
VOLUMETRIC SURVEYOF
LAKE GRANBURY
Prepared for:
THE BRAZOS RIVER AUTHORITY
Prepared by:
The Texas Water Development Board
March 10, 2003
Texas Water Development Board

Craig D. Pedersen, Executive Administrator
Texas Water Development Board
Charles W. Jenness, Chairman Wesley E. Pittman, Vice ChairmanWilliam B. Madden Noe FernandezDiane E. Umstead Dr. Elaine M. Barron
Authorization for use or reproduction of any original material contained in this publication, i.e. notobtained from other sources, is freely granted. The Board would appreciate acknowledgement.
This report was prepared by the Hydrographic Survey group:
Scot Sullivan, P.E. Duane Thomas
Randall Burns
For more information, please call (512) 445-1471
Published and Distributedby the
Texas Water Development BoardP.O. Box 13231
Austin, Texas 78711-3231

TABLE OF CONTENTS
INTRODUCTION .......................................................................................................................... 1
HISTORY AND GENERAL INFORMATION OF THE RESERVOIR ......................................... 1
HYDROGRAPHIC SURVEYING TECHNOLOGY ...................................................................... 2GPS Information................................................................................................................. 2Equipment........................................................................................................................... 4Previous Survey Procedures............................................................................................... 5Survey Methods.................................................................................................................. 6
DATA............................................................................................................................................ 11
SUMMARY................................................................................................................................... 12
APPENDICES
APPENDIX A - DEPTH SOUNDER ACCURACYAPPENDIX B - RESERVOIR VOLUME TABLEAPPENDIX C - RESERVOIR AREA TABLEAPPENDIX D - AREA-ELEVATION-CAPACITY GRAPH
LIST OF FIGURES
FIGURE 1 - LOCATION MAPFIGURE 2 - LOCATION OF SURVEY DATAFIGURE 3 - SHADED RELIEFFIGURE 4 - DEPTH RANGESFIGURE 5 - 2-D CONTOUR MAP

1
LAKE GRANBURYHYDROGRAPHIC SURVEY REPORT
INTRODUCTION
Staff of the Hydrologic Survey Unit of the Texas Water Development Board
(TWDB) conducted a hydrographic survey on Lake Granbury in October, 1993. The purpose of
the survey was to determine the capacity of the lake at the normal pool elevation and to establish
baseline information for future surveys. From this information, future surveys will be able to
determine sediment deposition locations and rates over time. Survey results are presented in the
following pages in both graphical and tabular form.
HISTORY AND GENERAL INFORMATION OF THE RESERVOIR
Lake Granbury and associated De Cordova Bend Dam are owned by the Brazos River
Authority (BRA). De Cordova Bend Dam is located on the Brazos River approximately eight
miles southeast of Granbury, Texas in Hood County. Lake Granbury inundates approximately 33
miles of the original Brazos river bed. Ambursen Engineering Corp. of Houston, Texas designed
the dam and the H. B. Zachry Company was the Contractor. Construction began on December 12,
1966 and deliberate impoundment commenced September 15, 1969. The earth-rolled embankment
is 2,200 feet in length with a maximum height of 84 feet at elevation 706.5 feet above mean sea
level (msl) . The service spillway is a gate-controlled ogee crest There are 16 tainter gates each
36 feet (L) by 35 feet (H) have a crest elevation of 658.0 feet above msl. Outlet works consist of
two 84" by 96" openings, motor-controlled by sluice gates with invert elevations at 652.0 and
640.0 feet above msl.

2
Water Rights Permit No. 2111, issued July 24, 1964, authorized the Brazos River
Authority (BRA) to construct and maintain a dam and reservoir (Lake Granbury) on the Brazos
River, to impound and not exceed 155,000 acre-feet of water. BRA was permitted to divert and
use not to exceed 10,000 acre-feet of water per annum for municipal purposes, 70,000 acre-feet
per annum for industrial purposes, 20,000 acre-feet per annum for irrigation and 350,000 per
annum for hydroelectric power generation. Several amendments were made to Permit 2111 in the
following years. On September 28,1966 the authorization to divert 350,000 acre-feet of water per
annum for hydroelectric power generation was deleted and on September 13, 1979 the impounded
waters of Lake Granbury was approved for recreational purposes. A change in water use resulted
in another amendment to the Permit that was approved on November 25, 1980. It allowed the
permittee to use 500 acre-feet of the 20,000 acre-feet of water designated for irrigation to be used
for mining purposes.
The Certificate of Adjudication, No. 12-5156, was issued to the Brazos River
Authority on December 14, 1987. It basically grants the BRA the right to impound and use the
waters of Lake Granbury as previously described along with several "Special Conditions"
concerning the "Systems Operations Order". The priority rights of Lake Granbury also fall under
the order of Certificate of Adjudication 5167 for the purpose of system operation as authorized by
Commission Order of July 23, 1964, as amended and as modified, by the Commission's final
determination of all claims of water rights in the Brazos River Basin and the San Jacinto-Brazos
Coastal Basin maintained by the Brazos River Authority, the Fort Bend County W.C.I.D. No. One
and the Galveston County Water Authority on June 26,1985.
HYDROGRAPHIC SURVEYING TECHNOLOGY
The following sections will describe the equipment and methodology used to conduct this
hydrographic survey. Some of the theory behind Global Positioning System (GPS) technology and
its accuracy are also addressed.

3
GPS Information
The following is a brief and simple description of Global Positioning System (GPS)
technology. GPS is a new technology that uses a network of satellites, maintained in precise orbits
around the earth, to determine locations on the surface of the earth. GPS receivers monitor the
broadcasts from the satellites over time to determine the position of the receiver. With only one
satellite being monitored, the point in question could be located anywhere on a sphere surrounding
the satellite with a radius of the distance measured. Additional satellite readings would also
produce a possible location on a sphere surrounding that satellite with a radius of the distance
measured. The observation of two satellites from an unknown point decreases the possible
location to a finite number of points on a circle where the two spheres intersect. With a third
satellite observation, the unknown location is reduced to two points where all three spheres
intersect. One of these points is obviously in error because its location is in space, and it is
ignored. Although three satellite measurements can fairly accurately locate a point on the earth, the
minimum number of satellites required to determine a three dimensional position within the
required accuracy is four. The fourth measurement compensates for any time discrepancies
between the clock on board the satellites and the clock within the GPS receiver.
GPS technology was first utilized on February 22, 1978, when the initial satellite was
launched. The NAVSTAR (NAVigation System with Time And Ranging) satellite constellation
will consist of 24 satellites when fully implemented. At the time of the survey, 23 satellites of the
constellation were fully functional. The United States Department of Defense (DOD) is
responsible for implementing and maintaining the satellite constellation. In an attempt to
discourage the use of these survey units as a guidance tool by hostile forces, the DOD has
implemented means of false signal projection called Selective Availability (S/A). Positions
determined by a single receiver when S/A is active result in errors to the actual position of up to
100 meters. These errors can be reduced to centimeters by performing a static survey with two
GPS receivers, one of which is set over a point with known coordinates. The errors induced by
S/A are time-constant. By monitoring the movements of the satellites over time (1 to 3 hours), the
errors can be minimized during post processing of the collected data and the unknown position

4
computed accurately.
Differential GPS (DGPS) can determine positions of moving objects in real-time or "on-
the-fly" and was used during the survey of Lake Granbury. One GPS receiver was set up over a
benchmark with known coordinates established by the hydrographic survey crew. This receiver
remained stationary during the survey and monitored the movements of the satellites overhead.
Position corrections were determined and transmitted via a radio link once per second to a second
GPS receiver located on the moving boat. The boat receiver used these corrections, or
differences, in combination with the satellite information it received to determine its differential
location. The large positional errors experienced by a single receiver when S/A is active are
greatly reduced by utilizing DGPS. The reference receiver calculates satellite corrections based
on its known fixed position, which results in positional accuracies within 3 meters for the moving
receiver. DGPS was used to determine horizontal position only. Vertical information was
supplied by the depth sounder.
Equipment
The equipment used in the hydrographic survey of Lake Granbury consisted of a 23 foot
aluminum tri-hull SeaArk craft with cabin, equipped with twin 90 Horsepower Johnson outboard
motors. Installed within the enclosed cabin are an Innerspace Helmsman Display (for navigation),
an Innerspace Technology Depth Sounder and Velocity Profiler, a Trimble Navigation, Inc.
4000SE GPS receiver, a Motorola Radius radio with an Advanced Electronic Applications, Inc.
packet modem, and an on-board computer. The computer is supported by a dot matrix printer and
a B-size plotter. Power is provided by a water-cooled generator through an in-line uninterruptible
power supply. Reference to brand names does not imply endorsement by the TWDB.
The shore station included a second Trimble 4000SE GPS receiver, Motorola Radius
radio and Advanced Electronic Applications, Inc. packet modem, and an omni-directional antenna
mounted on a modular aluminum tower to a total height of 40 feet. The combination of this
equipment provided a data link with a reported range of 25 miles over level to rolling terrain that
does not require that line-of-sight be maintained with the survey vessel in most conditions, thereby

5
reducing the time required to conduct the survey.
As the boat traveled across the lake surface, the depth sounder gathered approximately ten
readings of the lake bottom each second. The depth readings were averaged over the one-second
interval and stored with the positional data to an on-board computer. After the survey, the average
depths were corrected to elevation using the daily lake elevation. The set of data points logged
during the survey were used to calculate the lake volume. Accurate estimates of the lake volume
can be quickly determined using these methods, to produce an affordable survey. The level of
accuracy is equivalent to or better than previous methods used to determine lake volumes, some of
which are discussed below.
Previous Survey Procedures
Originally, reservoir surveys were conducted with a rope strung across the reservoir
along pre-determined range lines. A small boat would manually pole the depth at selected
intervals along the rope. Over time aircraft cable replaced the rope, and electronic depth sounders
replaced the pole. The boat hooked itself to the cable and depths were again recorded at selected
intervals. This method, used mainly by the Soil Conservation Service, worked well for small
reservoirs.
Larger bodies of water required more involved means to accomplish the survey, mainly
due to increased size. Cables could not be strung across the body of water, so surveying
instruments were utilized to determine the path of the boat. A monument was set for each end point
of each line, so the same lines could be used on subsequent surveys. Prior to a survey, each end
point had to be located (and sometimes reestablished) in the field and vegetation cleared so that
line of sight could be maintained across the body of water. One surveyor monitored the path of the
boat and issued commands via radio to insure that it remained on line while a second surveyor
determined depth measurement locations by turning angles. Since it took a major effort to
determine each of the points along the line, the depth reading were spaced quite a distance apart.
Another major cost was the land surveying required prior to the reservoir survey to locate the
range line monuments and clear vegetation.

6
Electronic positioning systems were the next improvement. If triangulation could
determine the boat location by electronic means, then the boat could take continuous depth
sounding. A set of microwave transmitters positioned around the lake at known coordinates,
would allow the boat to receive data and calculate its position. Line of site was required, and the
configuration of the transmitters had to be such that the boat remained within the angles of 30 and
150 degrees in respect to the shore stations. The maximum range of most of these systems was
about 20 miles. Each shore station had to be accurately located by survey, and the location
monumented for future use. Any errors in the land surveying resulted in significant errors that
were hard to detect after the fact. Large reservoirs required multiple shore stations and a crew to
move the shore stations to the next location as the survey progressed. Land surveying was again a
major cost.
Another method used mainly prior to construction utilized aerial photography to generate
elevation contours which could then be used to calculate the volume of the reservoir. Fairly
accurate results could be obtained, although the vertical accuracy of the aerial topography was
generally one-half of the contour interval or + five feet for a ten foot contour interval. This method
could be quite costly, and was only applicable in areas that were not inundated.
Survey Methods
The Hydrographic Survey crew set a benchmark in October, 1993 that would serve as
a control point for the shore station site. A brass cap marked TWDB #008 was embedded in
concrete near the main office at the Brazos River Authority's SWATS facility. This location was
chosen because of the proximity to the reservoir, and the security of the area.
A static survey using the two Trimble 4000SE GPS receivers was performed to obtain
coordinates for the TWDB benchmark. One GPS receiver was positioned over a USGS first-order
monument named HENSEN, located approximately eight miles northeast of De Cordova Dam.
HENSEN was established in 1946. TWDB acknowledges the Brazos River Authority's Datum for
Lake Granbury is 1.113 feet lower in elevation than the USGS datum. Satellite data were gathered
from this station for approximately an hour and a half, with up to seven satellites visible to the

7
receiver. During the same time period, data were gathered from the second receiver positioned
over TWDB #008.
Once data collection ended, the data were retrieved from the two receivers using Trimble
Trimvec software, and processed to determine coordinates for the shore station benchmark. The
NAVSTAR satellites use the World Geodetic System (WGS '84) spherical datum. WGS '84 is
essentially identical to the North American Datum of 1983 (NAD '83). The WGS' 84 coordinates
for TWDB #008 were determined to be North latitude 32° 25' 03.45515", West longitude 97° 39'
54.31045", and ellipsoid height of 685.75 feet. The approximate NGVD '29 elevation is 779.0
feet. Those coordinates were then entered into the shore station receiver located over TWDB
#008 to fix its location and allow calculation and broadcasting of corrections through the radio and
modem to the roving receiver located on the boat.
Due to the size and geographical shape of the reservoir, and the surrounding terrain, two
additional shore station sites were required to maintain contact with the roving receiver on the
boat.. The same procedure discussed previously was used to establish the second and third shore
station sites. The second shore station site (1/2 iron rod) was set on the grounds of the Granbury
Country Club. TWDB #008 was used as the known point to establish the coordinates for the
second shore station site. The WGS'84 coordinates for the Granbury Country Club shore station
site were determined to be North Latitude 32° 26' 35.42336", West Longitude 97° 45' 54.16602"
and ellipsoid height of 653.99 feet. The approximate NGVD '29 elevation is 747.7 feet. The third
shore station site ("+" chiseled in a flat rock) is located on the property of Mr. Ronald Bush of
Granbury, Texas. The second shore station site was used as the known point to establish the
coordinates for this site. The coordinates for the Bush's property shore station site were
determined to be North Latitude 32° 29' 39.25122", West Longitude 097° 50' 51.86681" and
ellipsoid height of 777.41 feet. The approximate NGVD '29 elevation is 871.63 feet. Information
regarding a more detailed location description for these sites are available upon request.
The reservoir's surface area was determined by digitizing the lake boundary from 1961
USGS quad sheets that were updated in 1979 from 1976 aerial photographs. AutoCad software
was used to digitize an estimate of the 693.0 contour based on the North American Datum of 1927

8
(NAD '27) used for these maps. The graphic boundary was then transformed from NAD '27 to
NAD '83 using Environmental Systems Research Institutes's (ESRI) Arc/Info project command
with the NADCOM parameters, to get the boundary into a more recent datum compatible with the
positions received from the satellites. The area of the boundary shape was the same in both datum.
NAD '83, a flat projected representation of the curved earth surface, was chosen to calculate
areas and volumes. NAD '27 is also a flat projection, but the two datum have a slightly different
point of origin, and distinctly different state plane false northing and false easting coordinate to be
able to distinguish coordinate points between the two datum.
The resulting shape was modified slightly to insure that all data points gathered were
within the boundary. The acreage at the normal pool elevation was thereby estimated to be
8,310 acres, or within 4.5 percent of the recorded 8,700 acres. An aerial topo of the upper four
feet of the lake or an aerial photograph taken when the lake is at the normal pool elevation would
more closely define the present boundary. However, the minimal increase in accuracy does not
appear to offset the cost of those services at this time.
The survey layout was pre-planned, using approximately 300 survey lines at a spacing of 500
feet. Innerspace Technology Inc. software was utilized for navigation and to integrate and store
positional data along with depths. In areas where vegetation or obstructions prevented the boat
from traveling the planned line, random data were collected wherever the boat could maneuver.
Additional random data were collected lengthwise in the reservoir. Data points were entered into
the data set utilizing the DGPS horizontal position and manually poling the depth in shallow areas
where the depth was less than the minimum recordable depth of the depth sounder, which is about
3.5 feet. Figure 2 shows the actual location of the data collection sites. Data were not collected in
areas that were inaccessible due to shallow water or obstructions. The data set included
approximately 38,730 data points.
TWDB staff verified the horizontal accuracy of the DGPS used in the Lake Granbury
survey to be within the specified accuracy of three meters. The shore station was set up over a
known United States Geological Service (USGS) first order monument and placed in differential
mode. The second receiver, directly connected to the boat with its interface computer, was placed

9
over another known USGS first order monument and set to receive and process the corrections.
Based on the differentially-corrected coordinates obtained and the published coordinates for both
monuments, the resulting positions fell within a three meter radius of the actual known monument
position. For DGPS operation the reference station receiver was set to a horizontal mask of 0°, to
acquire information on the rising satellites. A horizontal mask of 10° was used on the roving
receiver for better satellite geometry and thus better horizontal positions. The DGPS positions
were within acceptable limits of horizontal accuracy with a PDOP (Position Dilution of Precision)
of seven (7) or less. The GPS receivers have an internal alarm that sounds if the PDOP rises
above the maximum entered by the user, to advise the field crew that the horizontal position has
degraded to an unacceptable level.
The depth sounder measures depth by measuring the time between the transmission of the
sound pulse and the reception of its echo. The depth sounder was calibrated with the Innerspace
Velocity Profiler typically once per day, unless the maximum depth varied by more than twenty
feet. The velocity profiler calculates an average speed of sound through the water column of
interest (typically set at a range of two feet below the surface to about ten feet above the maximum
encountered depth), and the draft value or distance from the transducer to the surface. The velocity
profiler probe is placed in the water to wet the transducers, then raised to the water surface where
the depth is zeroed. The probe is then lowered on a cable to just below the maximum depth set for
the water column, and then raised to the surface. The unit reads out an average speed of sound for
the water column and the draft measurement, which are then entered into the depth sounder. The
speed of sound can vary based on temperature, turbidity, density, or other factors. Based on the
measured speed of sound for various depths, and the average speed of sound calculated for the
entire water column, the depth sounder is accurate to within +0.2 feet, plus an estimated error of
+0.3 feet due to the plane of the boat for a total accuracy of +0.5 feet for any instantaneous reading.
These errors tend to be minimized over the entire survey, since some are plus readings and some
are minus readings. Further information on these calculations is presented in Appendix A, Page
13. Manual poling of depths within shallow areas agreed with the depth obtained by the depth
sounder typically within + 0.3 feet, and since the boat is moving much slower, the plane of the boat
has much less effect.

10
Analog charts were printed for each survey line as the data were collected. The gate mark,
which is a known distance above the actual depth that was recorded in the data file, was also
printed on the chart. Each analog chart was analyzed, and where the gate mark indicated that the
recorded depth was other than the bottom profile, depths in the corresponding data files were
modified accordingly. The depth sounder was set to record bad depth readings as 0, and all points
with a zero depth were deleted.
Each data point consisted of a latitude, longitude and depth. The depths were transformed
to elevations with a simple Unix command based on the water surface elevation each day, rounded
to the nearest tenth of a foot since the depth sounder reads in tenths of a foot, and ranged from
692.5 to 693.1 feet (BRA datum). The latitude, longitude data set was converted to decimal
degrees and loaded into Arc/Info along with the NAD '83 boundary file using the CREATETIN
command. The data points along with the boundary were used to create a Digital Terrain Model
(DTM) of the reservoir's bottom surface using the Arc\Info TIN module. This software uses a
method known as Delauney's criteria for triangulation. A triangle is formed between three non-
uniformly spaced points, including all points along the boundary. If there is another point within
the triangle, additional triangles are created until all points lie on the vertex of a triangle. This
method preserves all data points for use in determining the solution. The set of three-dimensional
triangular planes represents the actual bottom surface. Once the triangulated irregular network
(TIN) is formed, the software then calculates elevations along the triangle surface plane by solving
the equations for elevation along each leg of the triangle. Areas that were too shallow for data
collection or obstructed by vegetation were estimated by the Arc/Info's TIN product using this
method of interpolation. There were some areas where interpolation could not occur because of a
lack of information along the boundary of the reservoir. "Flat triangles" were drawn at these
locations. ArcInfo does not use flat triangle areas in the volume or contouring features of the
model. Therefore, additional data points were estimated for these locations to allow for
interpolation and contouring of the entire lake surface. The differences between the estimated
volume from these two processes and the actual volume are believed to be very minor because
these areas do not contain significant amounts of water. The model size changed by about 20
surface acres after the additional data points were added, and the storage volume changed by about
259 acre/ft. From this three-dimensional triangular plane surface representation, the TIN product

11
calculated the surface area and volume of the entire reservoir at one-tenth of a foot intervals.
The three-dimensional triangular surface was then shaded by a GRIDSHADE command.
Colors were assigned to different elevation values of the grid. Using the command
COLORRAMP, a set of colors that varied from navy to yellow was created. The lower elevation
was assigned the color of navy, and the lake normal pool elevation was assigned the color of
yellow. Different intensities of these colors were assigned to the different depths in between.
Figure 3 consists of the resulting depth shaded representation of the lake, broken into two figures
for enhanced clarity. Figure 4 presents a two-dimensional version of the same map, using bands of
color for selected contour intervals. The color increases in intensity from the shallow contour
bands to the deep water bands.
The DTM was then smoothed and linear smoothing algorithms were applied to the
smoothed model to produce smoother contours. The following smoothing options were chosen for
this model: Douglas-Peucker option with a 1/1000 tolerance level to eliminate any duplicate
points, and Round Corners with a maximum delta of 1/1000 of the model's maximum linear size, in
an attempt to smooth some of the angularity of the contours. Contours of the bottom surface at two
foot intervals are presented in Figure 5. The lake has been broken into 4 sections for easier
viewing purposes.
DATA
Extra time was required to collect the field data of Lake Granbury due to trees and sand
bars in the upper reaches of the lake. Submerged branches posed a significant hazard to
navigation for the 33 mile long lake. The deepest part of the 25 year old lake was found near the
dam and in the old channel bed of the Brazos River.
Lake Granbury was estimated by this survey to encompass 8,310 acres and to contain a
volume of 136,823 acre-feet at the normal pool elevation of 693.0 feet. The reservoir volume

12
table is presented in Appendix B, Page 3 and the area table in Appendix C, Page 4. The one-tenth
foot intervals are based on actual calculations from the model. An elevation-area-volume graph is
presented in Appendix D, Page 1. The surface elevation of the lake was near or above the normal
pool elevation during the survey. The survey crew experienced high flows during data collection
in the upper reaches of the lake. Since the boat cannot negotiate in shallow water, at a minimum
the upper two feet are based on a straight-line interpolation from the last data points collected to
the normal pool elevation lake boundary as digitized. The positional data collected in the field
corresponds well with the boundary obtained from the photo-revised USGS map. The Board does
not represent the boundary, as depicted in this report, to be a detailed actual boundary. It is an
approximation of the actual boundary used to compute the volume and area within the upper
elevations.
The storage volume calculated by this survey is approximately 11% percent less than the
previous record information for the lake. The low flow outlet is at elevation 640.0 feet, resulting
in a dead storage volume of 1,140 acre-feet. Therefore, the conservation storage for the reservoir
is calculated to be 135,683 acre-feet.
SUMMARY
A hydrographic survey was performed by the Texas Water Development Board in October,
1993 on Lake Granbury. The lowest elevation encountered during this survey was elev. 626 feet,
or a maximum depth of 67 feet. The conservation storage was calculated to be 135,683 acre-feet.
The estimated reduction in storage capacity is 15,617 acre-feet, or 10 percent less capacity than
the original capacity. It is assumed that the reduction in estimated storage is due to both a
combination of sedimentation, and improved data and calculation methods. Repeating this survey
with the same calculation methodology in five to ten years or after major flood events should
remove any noticeable error due to improved calculation techniques and will help isolate the
storage loss due to sedimentation.

A-1
CALCULATION OF DEPTH SOUNDER ACCURACY
This methodology was extracted from the Innerspace Technology, Inc. Operation Manual for the
Model 443 Velocity Profiler.
For the following examples, t = (D - d)/V
where: tD = travel time of the sound pulse, in seconds (at depth = D)D = depth, in feetd = draft = 1.2 feetV = speed of sound, in feet per second
To calculate the error of a measurement based on differences in the actual versus averagespeed of sound, the same equation is used, in this format:
D = [t(V)]+d
For the water column from 2 to 30 feet: V = 4832 fps
t30 = (30-1.2)/4832 = 0.00596 sec.
For the water column from 2 to 45 feet: V = 4808 fps
t45 =(45-1.2)/4808 =0.00911 sec.
For a measurement at 20 feet (within the 2 to 30 foot column with V = 4832 fps):
D20 = [((20-1.2)/4832)(4808)]+1.2 = 19.9' (-0.1')
For a measurement at 30 feet (within the 2 to 30 foot column with V = 4832 fps):
D30 = [((30-1.2)/4832)(4808)]+1.2 = 29.9' (-0.1')
For a measurement at 50 feet (within the 2 to 60 foot column with V = 4799 fps):
D50 = [((50-1.2)/4799)(4808)]+1.2

A-2
= 50.1' (+0.1')
For the water column from 2 to 60 feet: V = 4799 fps Assumed V80 = 4785 fps
t60 =(60-1.2)/4799 =0.01225 sec.
For a measurement at 10 feet (within the 2 to 30 foot column with V = 4832 fps):
D10 = [((10-1.2)/4832)(4799)]+1.2 = 9.9' (-0.1')
For a measurement at 30 feet (within the 2 to 30 foot column with V = 4832 fps):
D30 = [((30-1.2)/4832)(4799)]+1.2 = 29.8' (-0.2')
For a measurement at 45 feet (within the 2 to 45 foot column with V = 4808 fps):
D45 = [((45-1.2)/4808)(4799)]+1.2 = 44.9' (-0.1')
For a measurement at 45 feet (within the 2 to 45 foot column with V = 4808 fps):
D80 = [((80-1.2)/4785)(4799)]+1.2 = 80.2' (+0.2')

TEXAS IAIER D€VELOPI4ENT BOARDRESERVOIT I/OIUXE IABLE
LAKE ONA$BURI OCIO8ER 199] SURVEY
Jan ?0 1994
1
VOLIII'IE IN ACR€-'EET
. 1 , 2ELEVAIION INCREIIETI IS OIIE TEIITH F@T
EI.EV. IEET
627
6306ll
631615636637638659640
61?6L
645
4A
65065t6t2
6566576t86596606162
6656
664
6706?l
673
1
1 2!9
t t8214!10425
727920
1 1 1 01588166519682296266330533489!99645455 1 1 9576264517204803t89079844
10882| 198!t313114371'15702
171031ar7?2013321763234162525327!1929155514513351736042183384t095
1
87
z2t!214385n
91111611{14
2000
26863099
404045915164583165207100810489999963
t097!1209811?69145091584017211ta7i020294219242361525142273192%8t3t6804t717
2723an741322
I
1 6
t 5 t232332{51595763962
I tE714fi1nt2032
3115!60441094660
59006612736981969091
1005511084121901t18411616159741B7A1EE712045522t i l8475257122A4A296t4319103397616501390271t5rz
1
518
159241!4!
6097829U
1 2 1 11466175!206424102na3191365041t t47065503596966407161a2a79!83
101471120512305'13199
1176116116175161903120615?2?624105259112n7az9u1121103120636731392t611741
I6
20
1021652t1
1n62'801
1005123514951761209624332E01
t6961201471553726038
75308t7992n
102621 1 3 1 812443116151$99162531767719192?o77622452241052617128007l00E32110l,(455369613918642241
26
2359
t07
260t65491641820
'1027
126015211815
24nzu73260
12704AZ15141610768187622a471i36t
103541 1 4 1 012557137511t037163911741519t30209372261?21311261712423730t0332369t165571903971512170
7266l
I t lt8t270w505557840
104t128515511g44216225022E9!
378413164 E 0551061755910769185409481
10464111241267?1tE6615152165291nn
21097227962156\2610028/,665053532599:i4894474203994t42700
zE
?968
91892803895 1 9
86010711 3 1 015791874219525182938
383443624935
62446979na?86�t2917t
105601163912747t400415?E9'16667
1 8 1 1 3196512125422957247932661020696347623ZAZat51213764910171429?9
. l. 0 . 5 . 7
I
5 !9 1 0
32 357 2 n
125 l t l197 205290 30q40t 4t l533 '47692 709840 900
1094 11171336 13621607 16561905 19362229 22632t71 26tf2961 30073198 31113m5 3919445t 41Z|t005 t0735621 569363t! 63A27048 7t407651 n434724 64159665 9757
10675 1076711754 1186912902 t1017141tE 1125615127 1556516404 1694214274 1E41119ErZ 1997221442 215022t1* 2311625023 21023z6u 2709924926 289263099? 3122133058 V324735588 3581337An 5810840654 40855431Ea 41618

RESERVOIR VOLU E IA8L€
LIKE 6iANBUiY OCTOBER 199] SI]RVEY
ELEV. FEET
675
6n6746n6E06E1&z6ala46at
6476846€9690691692693
43844468325004655260569116050664BA6EA7ln23Z780538!104886139435r
100781107208114096121442t?9017136825
40n17062502n,t7 t95716!6106tc4i869310f36917E5124356369OZJ95041
101240107497114741122140129706
4453547521505055t9a9176226152465a27697A97115174972
4975195rjo
1019281085861151n122819130621
17nO509645440857851617516t8867021474E1979�660u71 l9022096189
'lo25t7
10927511639112t50813M3
44995479E0,11945463758310622L
70707f52iaE0119851709090996878
10!30610996:,117080124426112002
4U39516515509658n062672668047116675ng60579658599136897567
1039941t065211n69! 2 5 t 1 5112920
156411&6951882,13265699962902670t1716?57621781036863189205798026
10445411124111845712580:111609
1r9144849652342
5945861361671937208/�76676a11'78700692746
7t41051421 1 2 0 2 91 1 9 1 1 6126722't31527
rEtfr F@T
4614t49357525715601559917638206795272314nlttE218t474.69120t9940J
10583111zVa119Ef5127410135216
465024954753010,647160147&2n68411nnam91a2&5a792593893
1000921065?0111407lZOnt126099t36t34
votuti€ tt AcnE-iEET .LEVITIOII IXCREflEIIT IS OIIE. 5 . 6 . 7

TEXAS I]AI'R DEVELOPIiENI BOARDRES'iVOIi AREA IA8LT
J3n 20 1994
IAKE GiANBURY OC'OSER I99] SIJRVEY
ATE
IN ACRESELEV, FEET .0 .1 .2 ,3 .1
ELEVA'IOX INCRENC{I tS ONE IEIIIII FOOI
6266275?8529630631632631
615616
638639640&1612ta3
64'
644
6t06t1652
651
657658659&061662663
665666
664
6706716n673
I
l 6
374E67a7
105126150179zo7
263290I 6313
420
t205656126657227E499tt9AZ
10581 1 5 21202127813561434r 5 1 71599168!1n11866196420672176zz932410
?709
1
1 8
89107128153142209
3 1 8316379az51785245706t7670na793656
9891066t 139t?09r?861361'1413
15251607'1691
178514781i76?ov218E229624332571zEz
26
20
t071
1091301 5 6185212239269
1213193834ta483,29
6?2676735799462924996
1074
1217129113721151155516151700179218881986208821992319243325942755
23
5?n93
1 1 1112158188214
zga
387416187t3l580627681711806864935
100310821 1 5 11ZZ11302'1379
1159151?'1623
170914011497199620992211?319?45625912755
725
3131l6 l191217245
500126
391
5la,u6325E7714812875942
1 0 1 11089116012321 3 1 01387
1550163217141810190720062109
234221562517?na
. 5
l
I27435577
1 1 5136165
2192142n!03329158396
513589637691751819881944
1 0 1 41097'1167
1239131811951175r5581640172ArE201 9 1 6201621202231231?21n26402801
13
30
577998
1 1 61t916A195
2r1280!06Jl l161400452501
59464369876182t8889t5
10261 1 0 4
121713261403118l�1166164817171429192620262131?216236'210226402801
1
1 012135981
1001 1 9142171199
282306
t65105
506
5986{6?04767831494962
105/.1 1 1 11 1 8 1125513331 1 t I149?1571165717451659193620!6211222t82188
2E?1
I
1 134
t01't21
2022272r7
t t l137
4r01625 1 055660!654710
817901969
1011l 811881262134114181500t582'tt6�5
1755184�9'1916
2016215122m?388z5z5z&284�7
1
!6
E5
t0 l
1471n
2!0260288
!40
4 1 54665 1 55616086597167808439089n
10491 1 2 5119512701349't126
1509t t9 l1674't764
16581956zo572165zzal?1102514
2470
.6 .7 .8

LA(E 6RANIURY OCTOBEI 1993 SIIRVEY
IESETVOIN AREA TAETE Pree 2
TLEVITION INCRENENT IS ONE TENTH Fo�T
5766n6745n5806816a?
544
586647
6496t0691692693
AREA tX rCiES
289! 29161076 30763260 32601466 t489!696 !7193926 39264112 41554462 41851614 16604936 19595280 5t0l5670 '7166107 6129&24 &5167'5 6a187094 71407418 74a1vaz 7a?a
. 0
24701053
41114673!90141094l191t914E905257,64?60616405671970717415m68lt0
29383099!281! t12t7123949417411l l46El50055349,7626175
68417163no17851
293811225106!535t765t9721201
4706502855955608619665206887718t75537897
. t
2961314533293556376639944221
5oaj541E5E5462446566691072t1
n43
29&�:145ll521581!8114 0 1 742174500a75Z5 1 1 9
5900626765125956
7622n66
298/�lt6833751604l81410101270152t479851125 5 1 059466?90665569794007645E012
. a
30075191559t352738574061129t65454821t188
59926t3666E0700273237664E056
50105214tazll6t0188040861] l6456A1|ll,15211560160186359670370217369n1aE104

610 620ELEVATION (FEEI)
630 640 650 660 670 680 690 700
1,000
2,000
[i 3,000tr
g
160,000
140,000
120,000
100,000
80,000
60,000
40,000
20,000
< 4,000ultl
!{ 5,000
trIY- 6,000
7,000
8,000
9,000
FuJl!t!tf
8.E
a-O
0610 620 630 640 650 660 670
ELEVATION (FEET)680 690 700
SURFACEAREA CAPACITY- -4. - -
LAKE GRANBURY SURVEYOctober 1993
Prepared by : TWDB January 1994

tAKE GRANB URY
{
t1" ̂ ! 10,000 '
Figune
Lc c at i .cn N4*p

FIGURE 2
LAKE GRANBI.]RYLoc?rtion of Survey Data
{
$r - ADO'
EXPL{NATION
- Lake Boundary- lsland. . . . - ' - D a t a P o i n t s
FBEPAFED EY: TWDa JANUABY 1994

:_
>'q
^ *-
o
E$
e c\ ll 66 rf
''l |TI
r'i 7! rf'
F z cp
a

FIGURE 3CONTINUED
LAKE GRANBURYShad€d Relief
. { #- }
- * -
{ "
From Eievation 626 rrI ro 693 n.Prepafed by TWDB January 1994
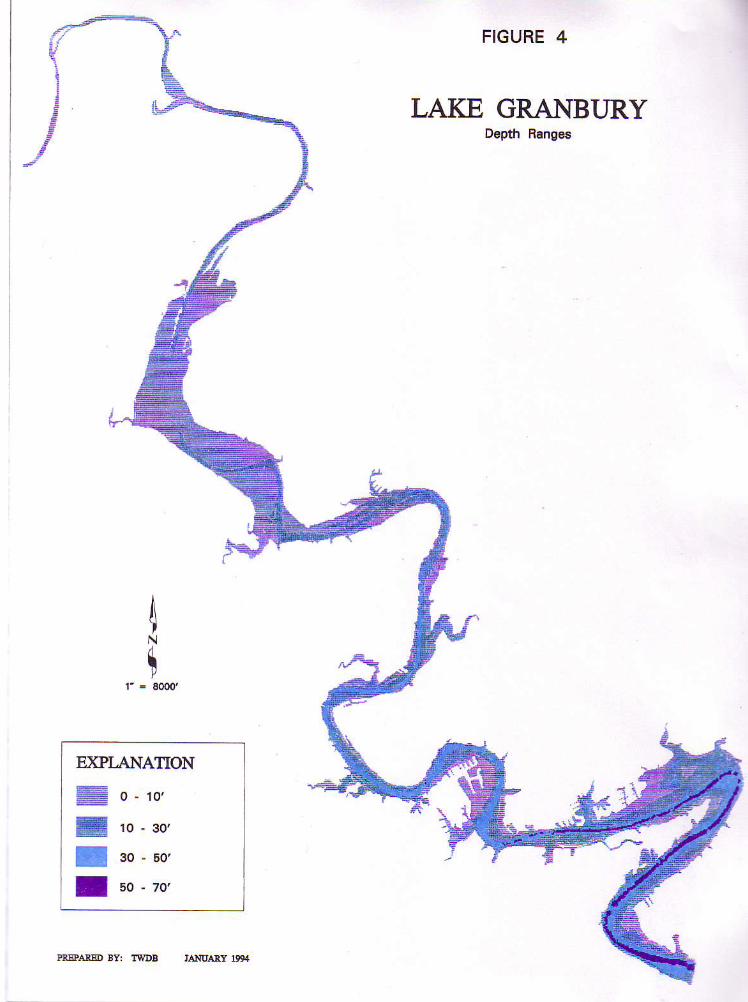
FIGURE 4
LAKE GRANBT]RYDopth F€nges
EXPT.{NATION
III
o - 1 0 '
10 - 30,
30 - 50'
50 - 70'


