
Journal of Colloid and Interface Science 470 (2016) 92–99doi:10.1016/j.jcis.2016.02.052
Fabrication of polyelectrolyte multilayered nano-
capsules using a continuous layer-by-layer
approach
Iuliia S. Elizarova* and Paul F. Luckham
e-mail address: [email protected] (Iuliia Elizarova)
Department of Chemical Engineering and Chemical Technology, Imperial College London,
Prince Consort Road, London SW7 2AZ, UK
Keywords: layer-by-layer self-assembly, continuous, polydiallyldimethylammonium chloride
PDADMAC, polystyrenesulfonate PSS, lambda carrageenan, poly-L-lysine, nano-capsules,
calcium phosphate.
ASSOCIATED CONTENT
1. Determination of optimum concentrations of polymers for coating
The minimum concentration of polyelectrolyte, which is necessary to form a stable layer on the
particle, but is not high enough to cause any major irreversible aggregation, is what we call in
this paper the “optimum concentration”. Optimum concentration identification is particularly
important due to specifics of the method used for layering the particles. The continuous
Journal of Colloid and Interface Science 470 (2016) 92–99doi:10.1016/j.jcis.2016.02.052
production method involved precluded any washing steps, hence the polyelectrolyte should not
be present in excess as if it were polyelectrolyte complexation would occur, affecting the
properties of the final polyelectrolyte layers and hence the capsules. Determination of the
optimum concentration of polyelectrolytes was performed experimentally using a trial and error
method. Core particles were mixed with corresponding polyanion solutions of different
concentrations in cuvettes in volume ratio of 1:1, then left for 10 minutes to ensure the
completion of deposition process. Afterwards, the zeta potentials of resulting suspensions were
measured. The details of measurements for the are presented in tables and figures below.
The concentration of core particles is 0.22 g∙L-1 for PSS/PDADMAC pair and Lambda
Carrageenan/ε-Poly-L-Lysine Pair, 2.2 g∙L-1 for Lambda carrageenan/PDADMAC pair.
1.1 PSS/PDADMAC Pair
Poly (sodium-4-styrenesulfonate), PSS, was the first polyelectrolyte studied to determine the
optimum polyelectrolyte concentration, hence, several preliminary experiments were necessary
for this particular material. Implications that had arisen during trials are reported in detail only
for PSS, but they were taken into consideration when working out concentrations for other
polyelectrolytes.
Core particles-PSS, 2d layer. Concentrations of PSS solutions and the corresponding zeta
potentials are presented in table 1. Data is presented graphically in figure 1.
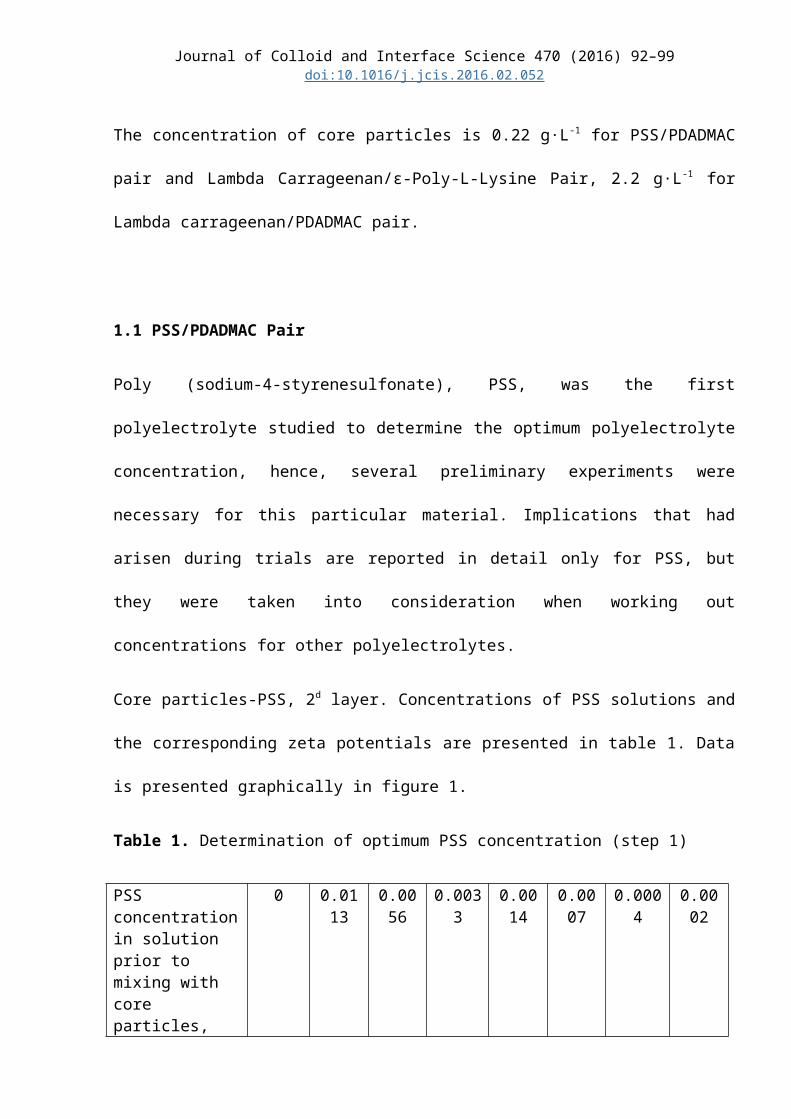
Table 1. Determination of optimum PSS concentration (step 1)
PSS concentration in solution prior to mixing with core particles, g∙L-1
0 0.0113 0.0056 0.0033 0.0014 0.0007 0.0004 0.0002
PSS:core particles concentration ratio 0 0.05 0.025 0.015 0.006 0.003 0.001 0.0009
Journal of Colloid and Interface Science 470 (2016) 92–99doi:10.1016/j.jcis.2016.02.052
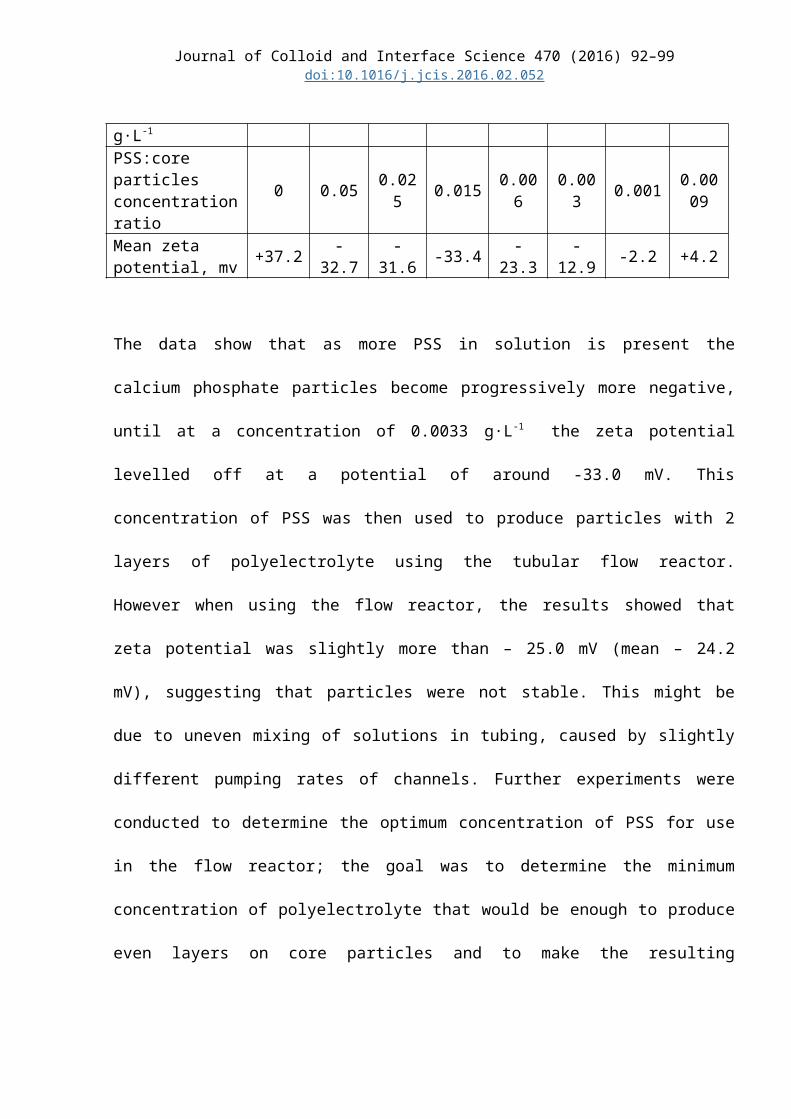
Mean zeta potential, mv +37.2 -32.7 -31.6 -33.4 -23.3 -12.9 -2.2 +4.2
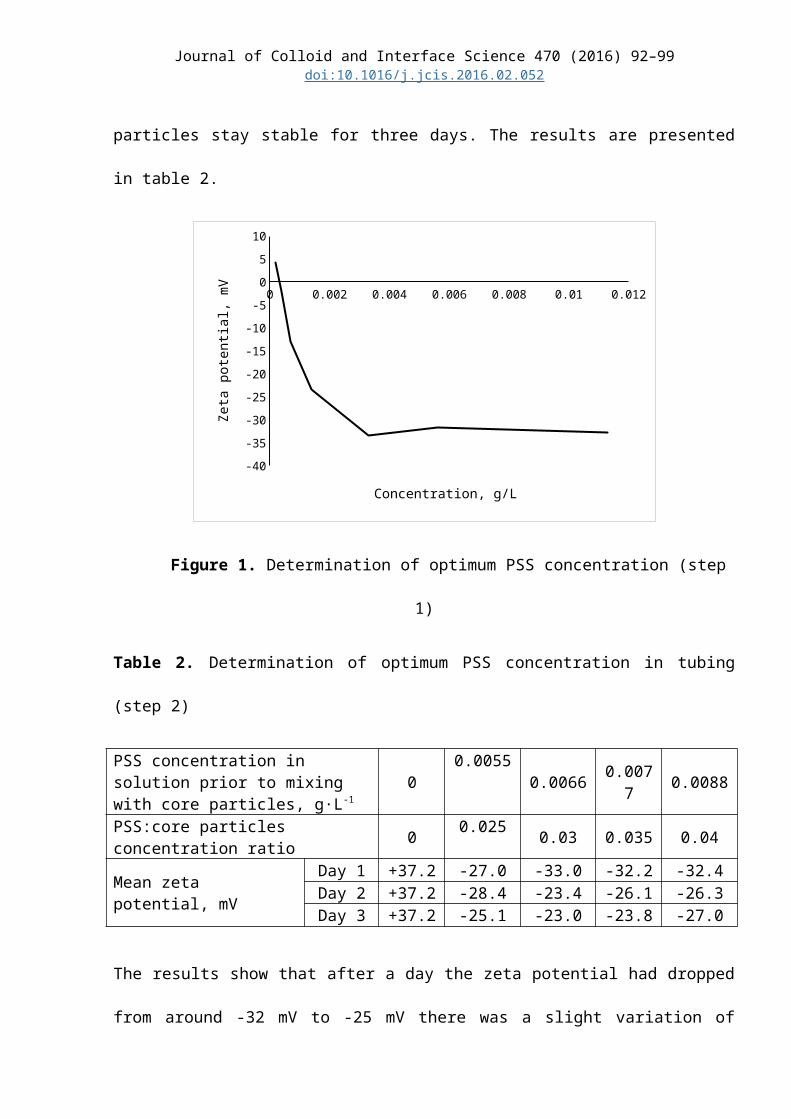
The data show that as more PSS in solution is present the calcium phosphate particles become
progressively more negative, until at a concentration of 0.0033 g∙L-1 the zeta potential levelled
off at a potential of around -33.0 mV. This concentration of PSS was then used to produce
particles with 2 layers of polyelectrolyte using the tubular flow reactor. However when using the
flow reactor, the results showed that zeta potential was slightly more than – 25.0 mV (mean –
24.2 mV), suggesting that particles were not stable. This might be due to uneven mixing of
solutions in tubing, caused by slightly different pumping rates of channels. Further experiments
were conducted to determine the optimum concentration of PSS for use in the flow reactor; the
goal was to determine the minimum concentration of polyelectrolyte that would be enough to
produce even layers on core particles and to make the resulting particles stay stable for three
days. The results are presented in table 2.
0 0.002 0.004 0.006 0.008 0.01 0.012
-40
-35
-30
-25
-20
-15
-10
-5
0
5
10
Concentration, g/L
Zeta
pot
entia
l, m
V
Figure 1. Determination of optimum PSS concentration (step 1)
Table 2. Determination of optimum PSS concentration in tubing (step 2)
Journal of Colloid and Interface Science 470 (2016) 92–99doi:10.1016/j.jcis.2016.02.052
PSS concentration in solution prior to mixing with core particles, g∙L-1 0 0.0055 0.0066 0.0077 0.0088
PSS:core particles concentration ratio 0 0.025 0.03 0.035 0.04
Mean zeta potential, mVDay 1 +37.2 -27.0 -33.0 -32.2 -32.4Day 2 +37.2 -28.4 -23.4 -26.1 -26.3Day 3 +37.2 -25.1 -23.0 -23.8 -27.0
The results show that after a day the zeta potential had dropped from around -32 mV to -25 mV
there was a slight variation of zeta potential in relation to concentrations. Though the final, third
day potentials show that a PSS concentration of 0.0088 g∙L-1 gave a minimal variation of zeta
potential for 1, 2 and 3 day, so that concentration was used in the continuous adsorption
experiments.
Core particles – PSS-PDADMAC, 3d layer. The identification of optimum and optimum
concentration of PDADMAC was performed in a similar way. The range of concentration ratios
was tested for stability of three layered particles. Two layered particles from previous
experiment were used for concentration determination. The results of the experiment are
presented in table 3 and figure 2.
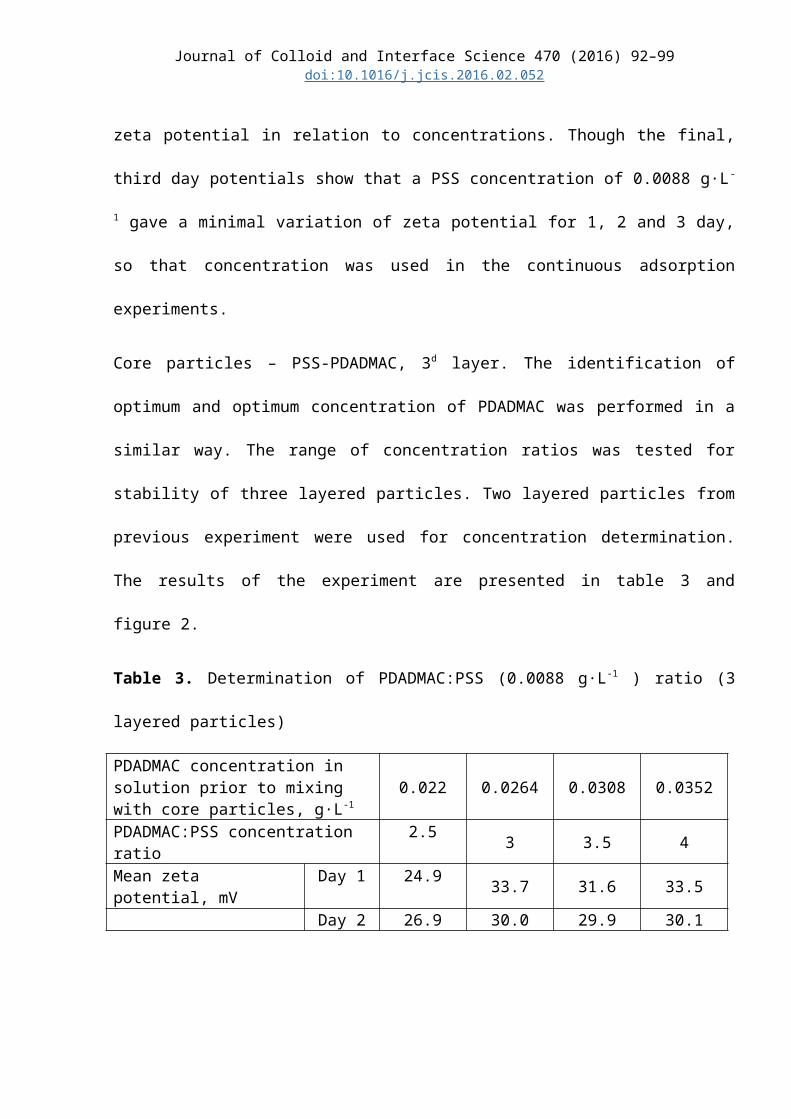
Table 3. Determination of PDADMAC:PSS (0.0088 g∙L-1 ) ratio (3 layered particles)
PDADMAC concentration in solution prior to mixing with core particles, g∙L-1 0.022 0.0264 0.0308 0.0352
PDADMAC:PSS concentration ratio 2.5 3 3.5 4Mean zeta potential, mV Day 1 24.9 33.7 31.6 33.5
Day 2 26.9 30.0 29.9 30.1
Journal of Colloid and Interface Science 470 (2016) 92–99doi:10.1016/j.jcis.2016.02.052
2 2.5 3 3.5 4 4.50
5
10
15
20
25
30
35
40
PDADMAC:PSS ratio
Zeta
pot
entia
l, m
V
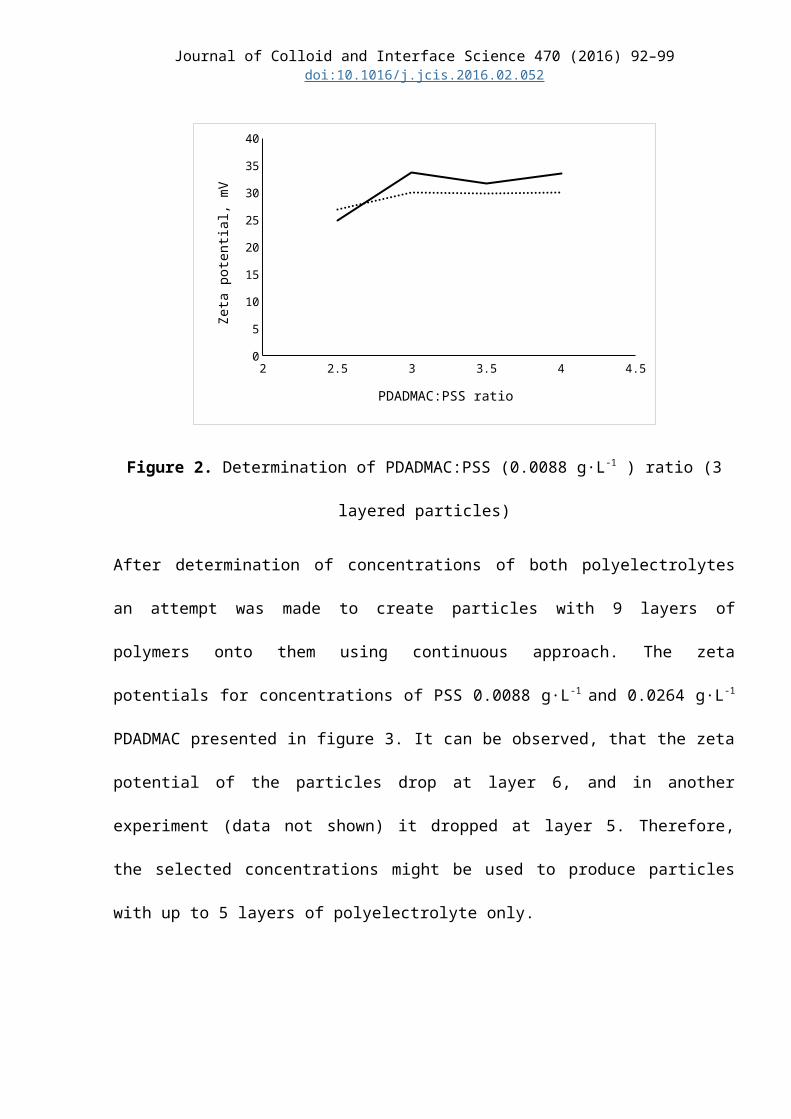
Figure 2. Determination of PDADMAC:PSS (0.0088 g∙L-1 ) ratio (3 layered particles)
After determination of concentrations of both polyelectrolytes an attempt was made to create
particles with 9 layers of polymers onto them using continuous approach. The zeta potentials for
concentrations of PSS 0.0088 g∙L-1 and 0.0264 g∙L-1 PDADMAC presented in figure 3. It can be
observed, that the zeta potential of the particles drop at layer 6, and in another experiment (data
not shown) it dropped at layer 5. Therefore, the selected concentrations might be used to produce
particles with up to 5 layers of polyelectrolyte only.
0 1 2 3 4 5 6 7 8 9 10
-50
-40
-30
-20
-10
0
10
20
30
40
50
Number of layers
Zeta
pot
entia
l, m
V
Journal of Colloid and Interface Science 470 (2016) 92–99doi:10.1016/j.jcis.2016.02.052
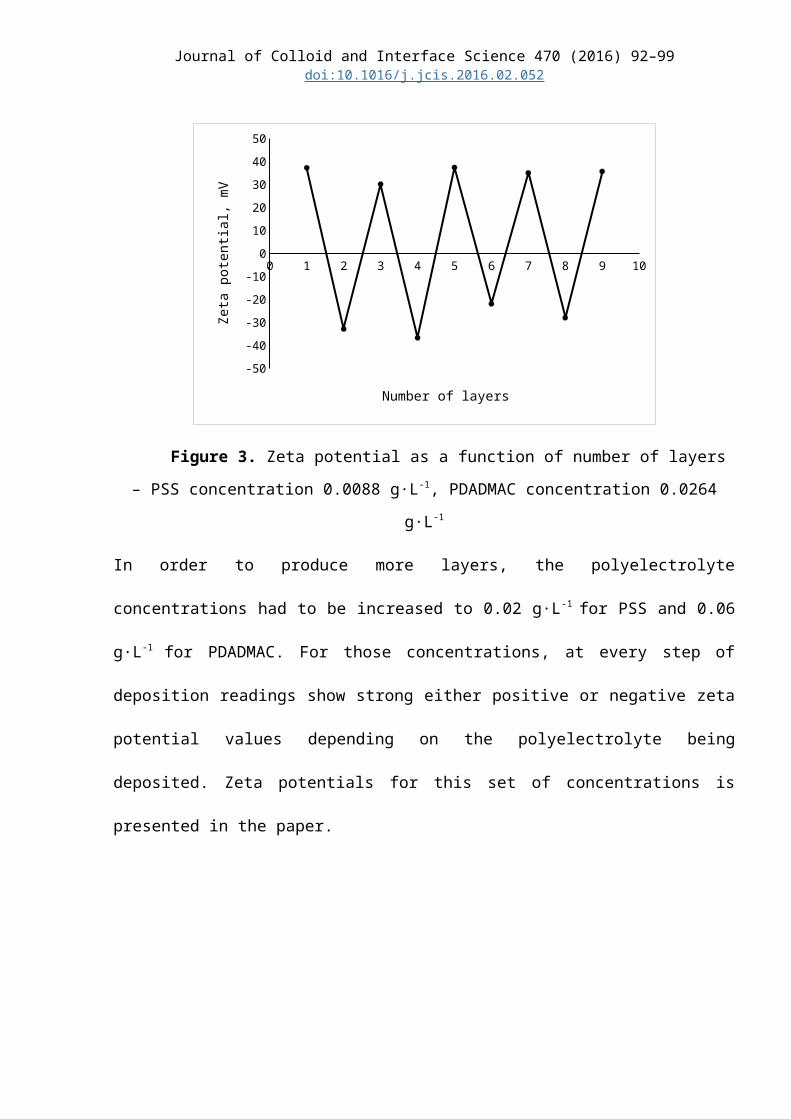
Figure 3. Zeta potential as a function of number of layers – PSS concentration 0.0088
g∙L-1, PDADMAC concentration 0.0264 g∙L-1
In order to produce more layers, the polyelectrolyte concentrations had to be increased to 0.02
g∙L-1 for PSS and 0.06 g∙L-1 for PDADMAC. For those concentrations, at every step of deposition
readings show strong either positive or negative zeta potential values depending on the
polyelectrolyte being deposited. Zeta potentials for this set of concentrations is presented in the
paper.
1.2 Lambda carrageenan/PDADMAC Pair
Concentrations for this pair of polyelectrolytes was determined in the same manner as for
PSS/PDADMAC pair. The results of the experiments are presented in tables 4 and 5.
Table 4. Determination of optimum lambda carrageenan concentration
Lambda carrageenan concentration in solution prior to mixing with core particles, g∙L-1
0 0.008 0.01 0.02 0.03
Lambda carrageenan:core particles ratio 0 0.036 0.045 0.089 0.134
Mean zeta potential, mV +37.2±0.7 -19.1±2 -23.5±1.5 -29.3±1.1 -31.2±1.1
The optimum concentration for lambda carrageenan was determined to be 0.02 g∙L-1.
Table 5. Determination of PDADMAC:lambda carrageenan (0.02 g∙L-1 ) ratio (3 layered
particles)
PDADMAC concentration, g∙L-1 0.04 0.06 0.08PDADMAC:lambda carrageenan concentration ratio 2 3 4Mean zeta potential, mV -3.8±0.4 33.0±0.5 34.4±0.3
Journal of Colloid and Interface Science 470 (2016) 92–99doi:10.1016/j.jcis.2016.02.052
According to data collected, the concentrations ratio of PDADMAC:lambda carrageenan can be
confirmed to be 3:1.
1.3 Lambda carrageenan/ε-Poly-L-Lysine Pair
Concentrations for this pair of polyelectrolytes was determined in the same manner as for
PSS/PDADMAC pair. The results of the experiments are presented in tables 6 and 7.
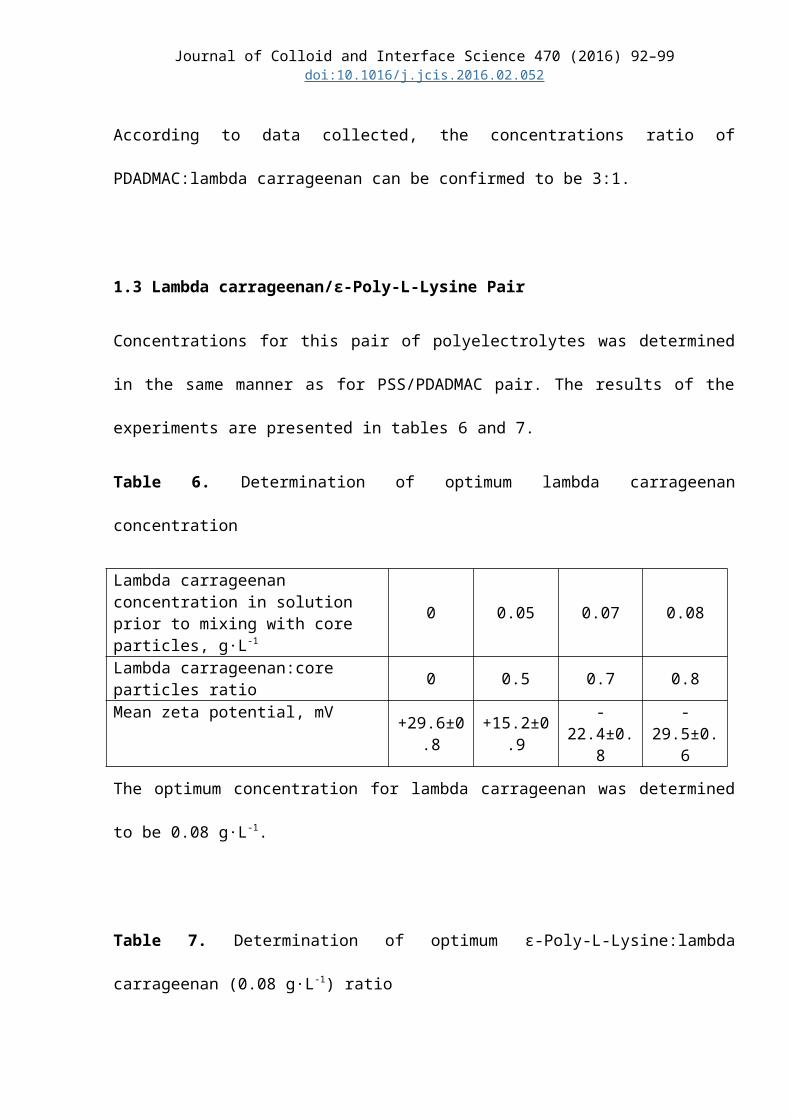
Table 6. Determination of optimum lambda carrageenan concentration
Lambda carrageenan сoncentration in solution prior to mixing with core particles, g∙L-1
0 0.05 0.07 0.08
Lambda carrageenan:core particles ratio 0 0.5 0.7 0.8Mean zeta potential, mV +29.6±0.8 +15.2±0.9 -22.4±0.8 -29.5±0.6
The optimum concentration for lambda carrageenan was determined to be 0.08 g∙L-1.
Table 7. Determination of optimum ε-Poly-L-Lysine:lambda carrageenan (0.08 g∙L-1) ratio
ε-Poly-L-Lysine concentration in solution prior to mixing with core particles, g∙L-1 0.05 0.06 0.07 0.08
Lambda carrageenan:ε-Poly-L-Lysine ratio 0.63 0.75 0.88 1Mean zeta potential, mV 25.2±0.7 26.7±1 31.9±0.5 36.0±0.5
The optimum concentration for ε-Poly-L-Lysine was determined to be 0.07 g∙L-1. Despite the
fact that using 0.05 and 0.06 g∙L-1 concentrations show zeta potential above 25 mV, it is only a
mean potential: step readings included potentials less than 25 mV (20 – 23 mV).
1.4 Charge based calculations for the polyelectrolyte concentrations
Table 8. Calculations of the polyelectrolyte concentration ratios based on amount of charge
present in the solution
Journal of Colloid and Interface Science 470 (2016) 92–99doi:10.1016/j.jcis.2016.02.052
PolyelectrolyteMolecular weight
of monomer, g·mol-1
Charge per 1 gram, mol
Resulting charge-based ratios
PDADMAC 137.65
100% material: 0.007265
PDADMAC (20%) to PSS = 3.3379
PDADMAC (20%) to Lambda carrageenan (1
charge) = 3.6775
20% solution as in stock material:
0.001453
PSS 206.19 0.00485
Lambda carrageenan(contains 3 charges per monomer)
Full monomer: 561.45
1/3 monomer (1 charge): 187.15 0.005343
ε-Poly-L-Lysine 206.67 0.004839ε-Poly-L-Lysine to Lambda
carrageenan (1 charge) = 1.1043
2. Determination of deposition time
In order to construct experimental setup correctly (length of tubing) and to choose the correct
pump speed it is necessary to know the deposition time for each polyelectrolyte. This time was
determined by mixing the core particles with polyelectrolyte of the opposite charge in cuvettes in
1:1 volume ratio and immediately taking zeta potential measurements (80 seconds is the
minimum time required for taking data). Deposition time was determined for the concentrations
identified in the first section of this document. Measurements for PSS/PDADMAC pair are
presented in tables 9 and 10, for lambda carrageenan/PDADMAC pair in tables 11 and 12.
2.1 PSS/PDADMAC Pair
Table 9. PSS 0.02 g∙L-1 Deposition time

Journal of Colloid and Interface Science 470 (2016) 92–99doi:10.1016/j.jcis.2016.02.052
Cumulative time, seconds Zeta potential, mV Error, mV80 -27.2
0.3
160 -27.0240 -28.1320 -28.4400 -26.0480 -27.3560 -26.5
Deposition time for PSS is 80 seconds, can be rounded up to 2 minutes.
Table 10. PDADMAC 0.06 g∙L-1 Deposition time
Cumulative time, seconds Zeta potential, mV Error, mV80 23.8
0.8
160 27.2240 27.2320 28.4400 28.2480 28.8
Deposition time for PDADMAC is 160 seconds, can be rounded up to 3 minutes.
2.2 Lambda carrageenan/PDADMAC Pair
Table 11. Lambda carrageenan 0.02 g∙L-1 deposition time
Cumulative time, seconds Zeta Potential, mV Error, mV80 -21.5
0.9
160 -26.3240 -28.2320 -28.0400 -28.8480 -28.8560 -27.9
Deposition time for lambda carrageenan is 160 seconds, can be rounded up to 3 minutes.
Table 12. PDADMAC 0.06 g∙L-1 deposition time
Cumulative time, seconds Zeta potential, mV Error, mV80 25.0 1.6160 23.3
Journal of Colloid and Interface Science 470 (2016) 92–99doi:10.1016/j.jcis.2016.02.052
240 19.5320 29.0400 29.2480 29.9560 28.0
Deposition time for PDADMAC is 320 seconds, can be rounded up to 6 minutes.
2.3 Lambda carrageenan/ε-Poly-L-Lysine Pair
Deposition times for both of polyelectrolytes is in the range of several seconds, but because
deposition occurs in tubing, the best decision it to allow around 1 minute for polyelectrolyte to
adsorb completely.
3. Continuous layer by layer tubular reactor layout
Schematic layout of a tubular reactor is presented in figure 4. A photograph of the tubular reactor
presented it this paper is shown in figure 5. L1, L2, L3, L4 – lengths of tubing, the same for
figure 4 and 5. These length were determined in accordance to longest deposition times (see
section 2), 3 minutes for anion solutions, 6 minutes for cation solutions.
L1 = 120 cm
L2 = 510 cm
L3 = 170 cm

Journal of Colloid and Interface Science 470 (2016) 92–99doi:10.1016/j.jcis.2016.02.052
L4 = 510 cm
Figure 4. Schematic layout of continuous production

Journal of Colloid and Interface Science 470 (2016) 92–99doi:10.1016/j.jcis.2016.02.052

Journal of Colloid and Interface Science 470 (2016) 92–99doi:10.1016/j.jcis.2016.02.052
Figure 5. Tubular reactor: 1 - Core Particles Source, 2 – Anion solution source, 3 – Cation solution source. Anion 1, 2 – Inlets; Cation 1, 2 – Inlets;
Sample 1, 2, 3 – Sample Collection Outlet


