Download - Vietnam Pharmaceutical Industry
8/11/2019 Vietnam Pharmaceutical Industry
http://slidepdf.com/reader/full/vietnam-pharmaceutical-industry 1/28
www.VPBS.com.vn Page |
INDUSTRY COVERAGE
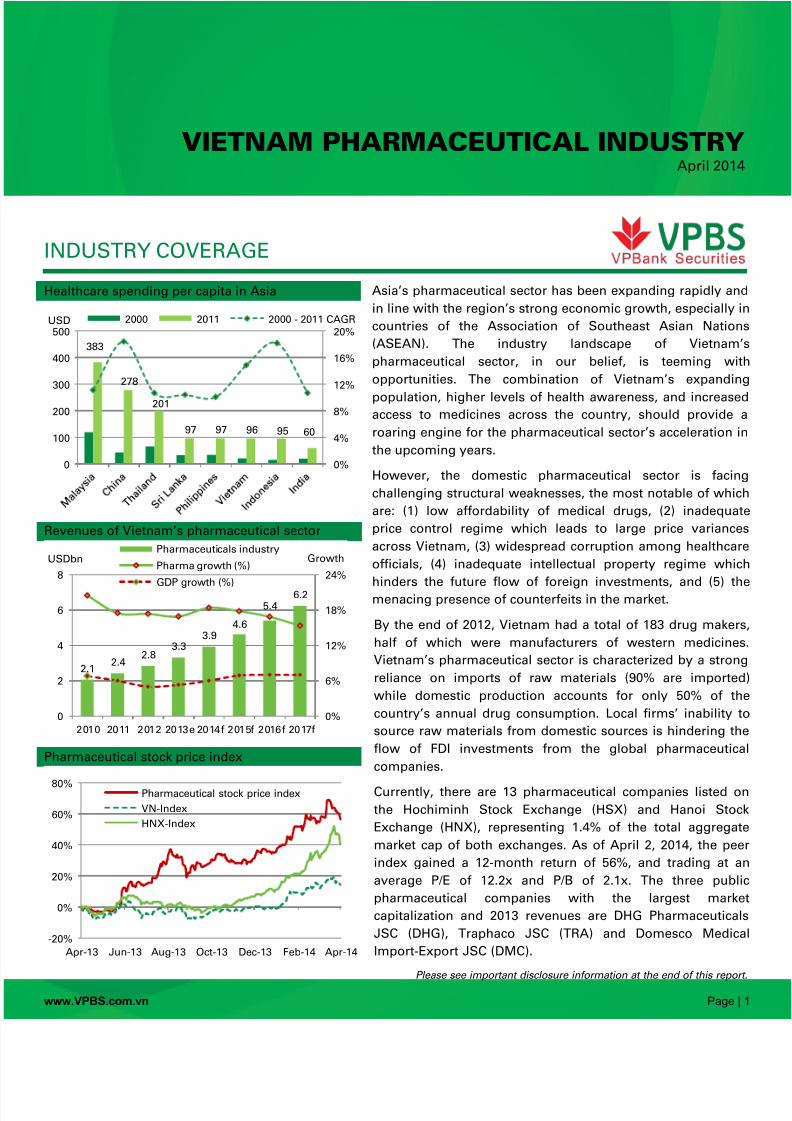
Healthcare spending per capita in Asia Asia’s pharmaceutical sector has been expanding rapidly an
in line with the region’s strong economic growth, especially i
countries of the Association of Southeast Asian Nation
(ASEAN). The industry landscape of Vietnam
pharmaceutical sector, in our belief, is teeming wit
opportunities. The combination of Vietnam’s expandin
population, higher levels of health awareness, and increase
access to medicines across the country, should provide
roaring engine for the pharmaceutical sector’s acceleration i
the upcoming years.
However, the domestic pharmaceutical sector is facin
challenging structural weaknesses, the most notable of whic
are: (1) low affordability of medical drugs, (2) inadequat
price control regime which leads to large price variance
across Vietnam, (3) widespread corruption among healthcar
officials, (4) inadequate intellectual property regime whic
hinders the future flow of foreign investments, and (5) th
menacing presence of counterfeits in the market.
By the end of 2012, Vietnam had a total of 183 drug maker
half of which were manufacturers of western medicines
Vietnam’s pharmaceutical sector is characterized by a stron
reliance on imports of raw materials (90% are imported
while domestic production accounts for only 50% of th
country’s annual drug consumption. Local firms’ inability t
source raw materials from domestic sources is hindering th
flow of FDI investments from the global pharmaceutica
companies.
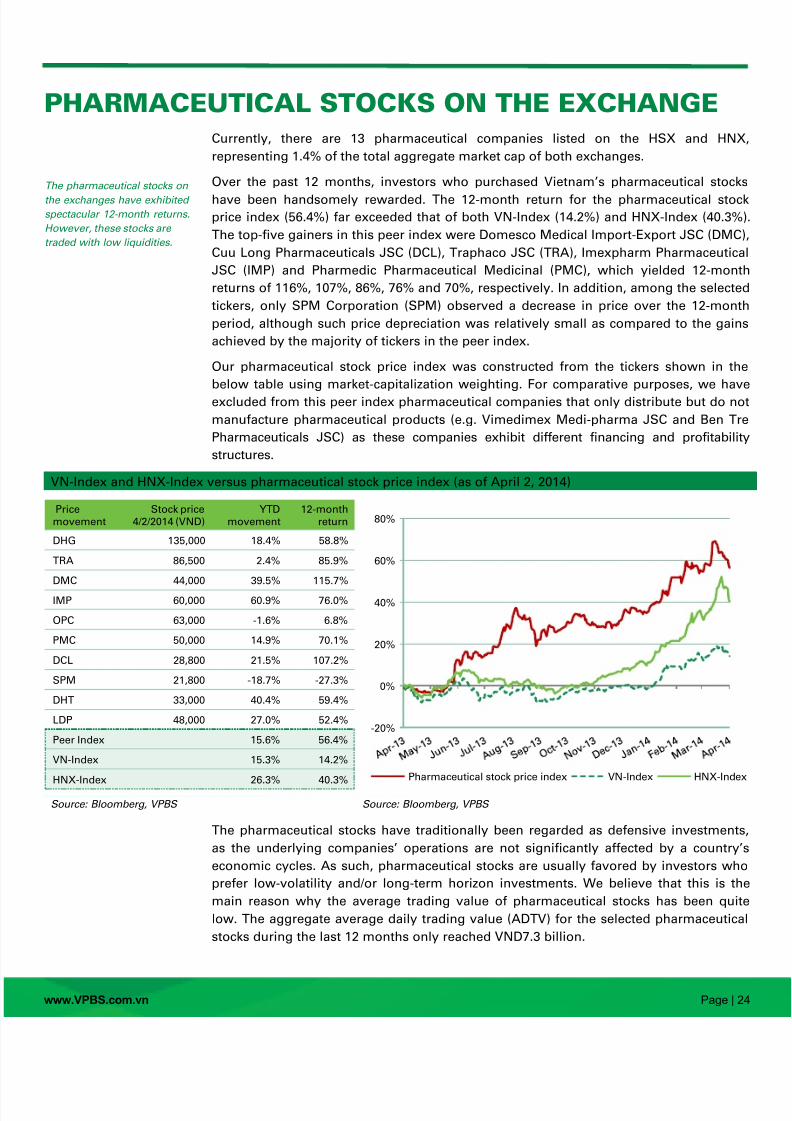
Currently, there are 13 pharmaceutical companies listed o
the Hochiminh Stock Exchange (HSX) and Hanoi Stoc
Exchange (HNX), representing 1.4% of the total aggregat
market cap of both exchanges. As of April 2, 2014, the pee
index gained a 12-month return of 56%, and trading at a
average P/E of 12.2x and P/B of 2.1x. The three publ
pharmaceutical companies with the largest marke
capitalization and 2013 revenues are DHG Pharmaceutica
JSC (DHG), Traphaco JSC (TRA) and Domesco Medica
Import-Export JSC (DMC).
Please see important disclosure information at the end of this repo
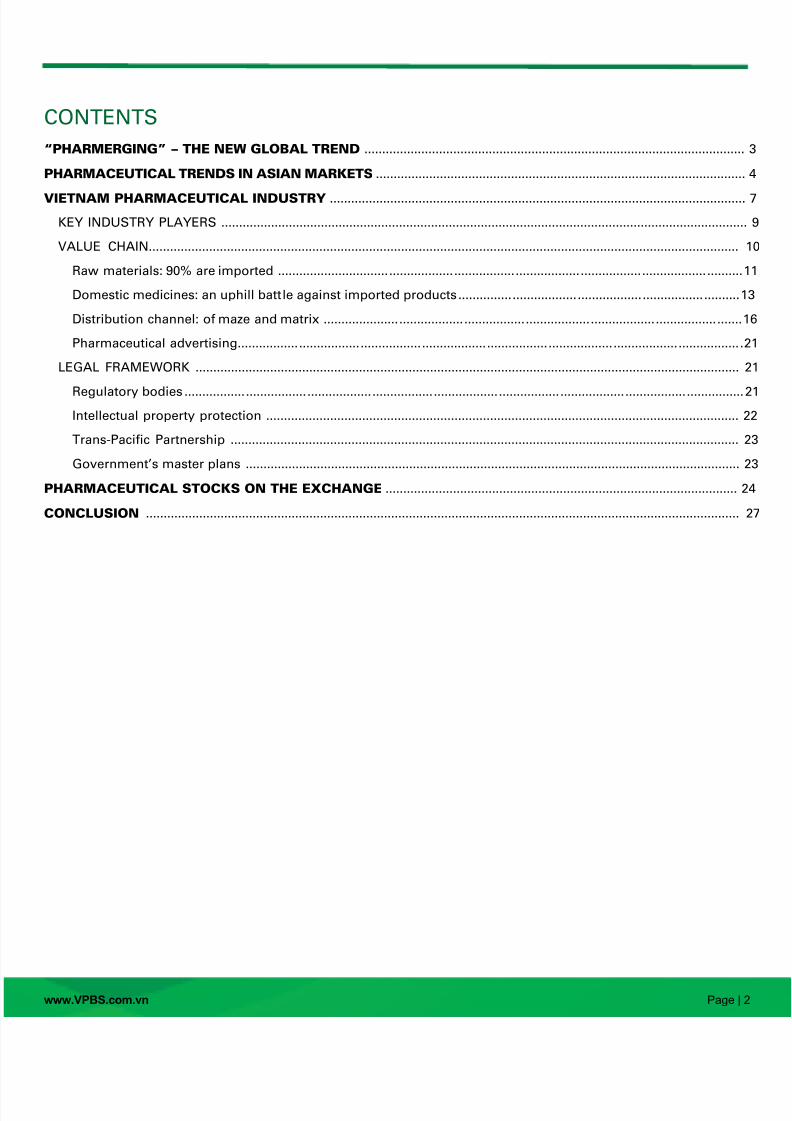
Revenues of Vietnam’s pharmaceutical sector
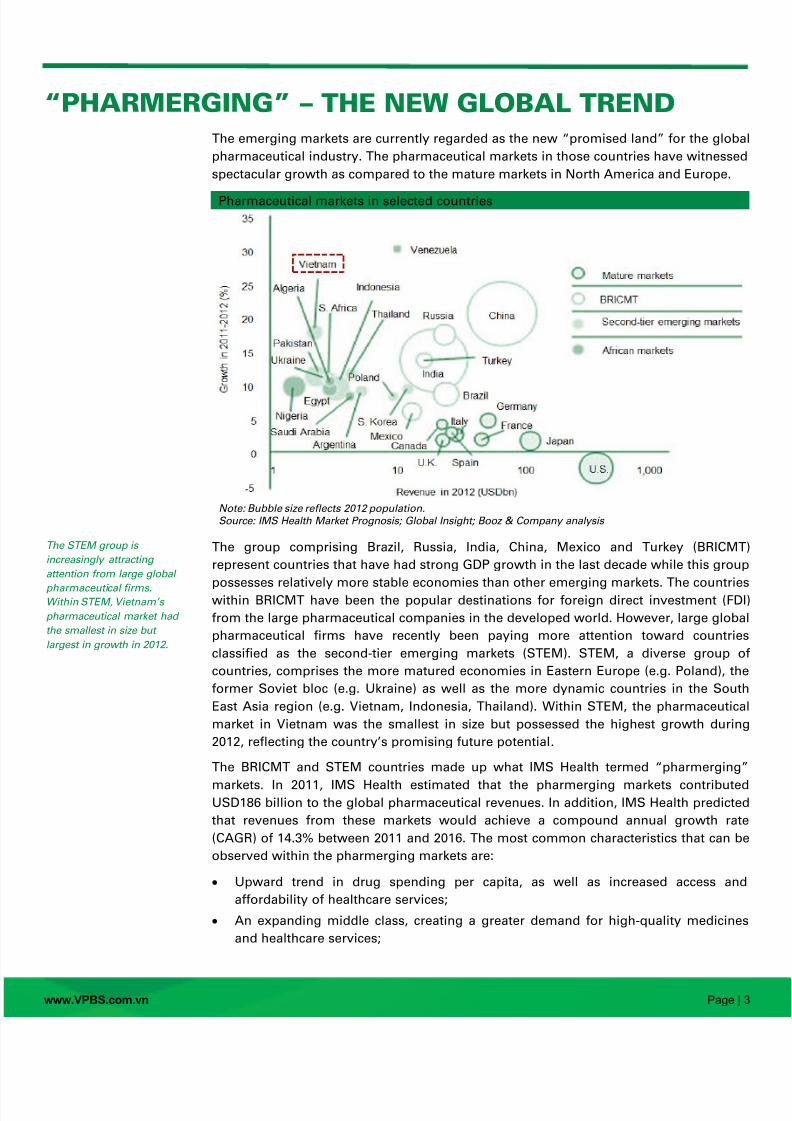
Pharmaceutical stock price index
383
278
201
97 97 96 95 60
0%
4%
8%
12%
16%
20%
0
100
200
300
400
500USD 2000 2011 2000 - 2011 CAGR
2.12.4
2.83.3
3.94.6
5.46.2
0%
6%
12%
18%
24%
0
2
4
6
8
2010 2011 2012 2013e 2014f 2015f 2016f 2017f
GrowthUSDbnPharmaceuticals industry
Pharma growth (%)
GDP growth (%)
-20%
0%
20%
40%
60%
80%
Apr-13 Jun-13 Aug-13 Oct-13 Dec-13 Feb-14 Apr-14
Pharmaceutical stock price index
VN-Index
HNX-Index
VIETNAM PHARMACEUTICAL INDUSTRYApril 2014
8/11/2019 Vietnam Pharmaceutical Industry
http://slidepdf.com/reader/full/vietnam-pharmaceutical-industry 2/28
www.VPBS.com.vn Page |
CONTENTS
“PHARMERGING” – THE NEW GLOBAL TREND ...........................................................................................................
PHARMACEUTICAL TRENDS IN ASIAN MARKETS ........................................................................................................
VIETNAM PHARMACEUTICAL INDUSTRY .....................................................................................................................
KEY INDUSTRY PLAYERS ....................................................................................................................................................
VALUE CHAIN...................................................................................................................................................................... 1
Raw materials: 90% are imported ................................................................................................................................. 1
Domestic medicines: an uphill battle against imported products .............................................................................. 1
Distribution channel: of maze and matrix .................................................................................................................... 1
Pharmaceutical advertising ............................................................................................................................................ 2
LEGAL FRAMEWORK ......................................................................................................................................................... 2
Regulatory bodies ........................................................................................................................................................... 2
Intellectual property protection ..................................................................................................................................... 2
Trans-Pacific Partnership ............................................................................................................................................... 2
Government’s master plans ........................................................................................................................................... 2
PHARMACEUTICAL STOCKS ON THE EXCHANGE ................................................................................................... 2
CONCLUSION ....................................................................................................................................................................... 2
8/11/2019 Vietnam Pharmaceutical Industry
http://slidepdf.com/reader/full/vietnam-pharmaceutical-industry 3/28
www.VPBS.com.vn Page |
“PHARMERGING” – THE NEW GLOBAL TRENDThe emerging markets are currently regarded as the new ‚promised land‛ for the globa
pharmaceutical industry. The pharmaceutical markets in those countries have witnesse
spectacular growth as compared to the mature markets in North America and Europe.
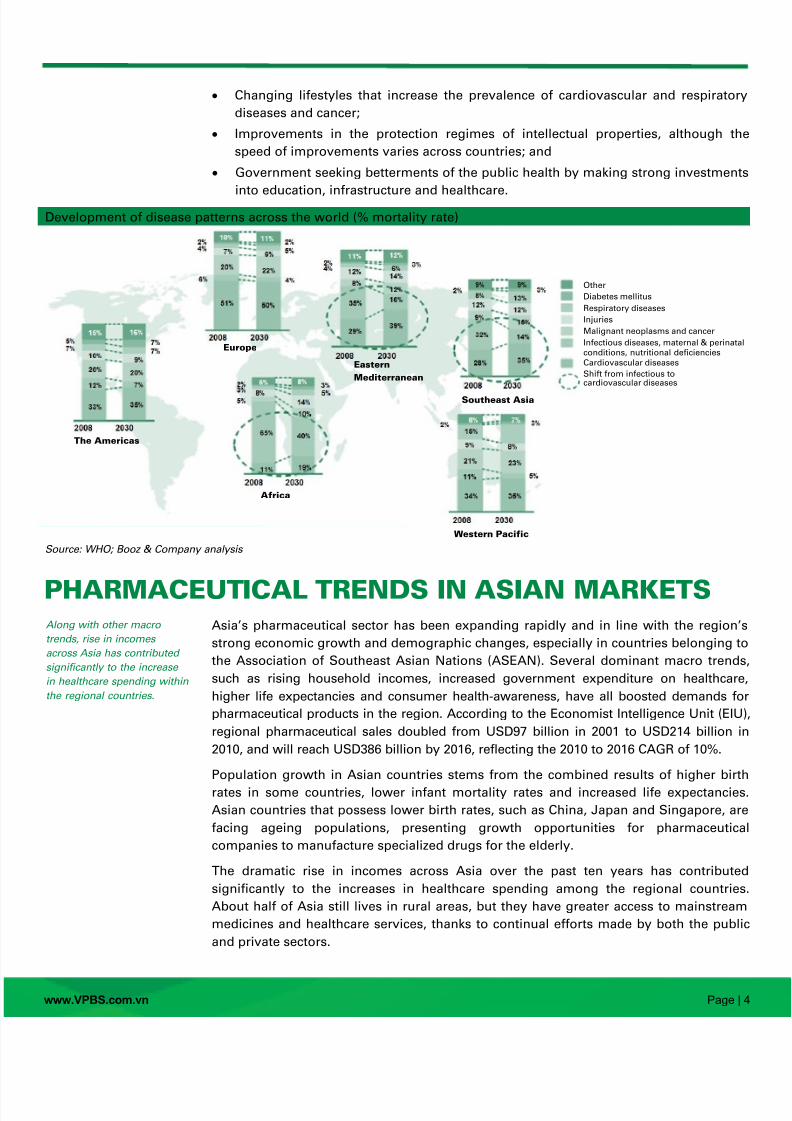
Pharmaceutical markets in selected countries
Note: Bubble size reflects 2012 population.Source: IMS Health Market Prognosis; Global Insight; Booz & Company analysis
The group comprising Brazil, Russia, India, China, Mexico and Turkey (BRICMT
represent countries that have had strong GDP growth in the last decade while this grou
possesses relatively more stable economies than other emerging markets. The countrie
within BRICMT have been the popular destinations for foreign direct investment (FD
from the large pharmaceutical companies in the developed world. However, large globa
pharmaceutical firms have recently been paying more attention toward countrie
classified as the second-tier emerging markets (STEM). STEM, a diverse group o
countries, comprises the more matured economies in Eastern Europe (e.g. Poland), th
former Soviet bloc (e.g. Ukraine) as well as the more dynamic countries in the Sout
East Asia region (e.g. Vietnam, Indonesia, Thailand). Within STEM, the pharmaceutica
market in Vietnam was the smallest in size but possessed the highest growth durin
2012, reflecting the country’s promising future potential.
The BRICMT and STEM countries made up what IMS Health termed ‚pharmerging
markets. In 2011, IMS Health estimated that the pharmerging markets contributeUSD186 billion to the global pharmaceutical revenues. In addition, IMS Health predicte
that revenues from these markets would achieve a compound annual growth rat
(CAGR) of 14.3% between 2011 and 2016. The most common characteristics that can b
observed within the pharmerging markets are:
Upward trend in drug spending per capita, as well as increased access an
affordability of healthcare services;
An expanding middle class, creating a greater demand for high-quality medicine
and healthcare services;
The STEM group is
increasingly attracting
attention from large global
pharmaceutical firms.Within STEM, Vietnam’s
pharmaceutical market had
the smallest in size but
largest in growth in 2012.
8/11/2019 Vietnam Pharmaceutical Industry
http://slidepdf.com/reader/full/vietnam-pharmaceutical-industry 4/28
www.VPBS.com.vn Page |
Changing lifestyles that increase the prevalence of cardiovascular and respirator
diseases and cancer;
Improvements in the protection regimes of intellectual properties, although th
speed of improvements varies across countries; and
Government seeking betterments of the public health by making strong investment
into education, infrastructure and healthcare.
Development of disease patterns across the world (% mortality rate)
Source: WHO; Booz & Company analysis
PHARMACEUTICAL TRENDS IN ASIAN MARKETSAsia’s pharmaceutical sector has been expanding rapidly and in line with the region’
strong economic growth and demographic changes, especially in countries belonging t
the Association of Southeast Asian Nations (ASEAN). Several dominant macro trend
such as rising household incomes, increased government expenditure on healthcare
higher life expectancies and consumer health-awareness, have all boosted demands fo
pharmaceutical products in the region. According to the Economist Intelligence Unit (EIU
regional pharmaceutical sales doubled from USD97 billion in 2001 to USD214 billion i
2010, and will reach USD386 billion by 2016, reflecting the 2010 to 2016 CAGR of 10%.
Population growth in Asian countries stems from the combined results of higher birt
rates in some countries, lower infant mortality rates and increased life expectancies
Asian countries that possess lower birth rates, such as China, Japan and Singapore, ar
facing ageing populations, presenting growth opportunities for pharmaceutica
companies to manufacture specialized drugs for the elderly.
The dramatic rise in incomes across Asia over the past ten years has contribute
significantly to the increases in healthcare spending among the regional countrie
About half of Asia still lives in rural areas, but they have greater access to mainstream
medicines and healthcare services, thanks to continual efforts made by both the publ
and private sectors.
Europe
Eastern
Mediterranean
Southeast Asia
The Americas
Africa
Western Pacific
Other
Diabetes mellitus
Respiratory diseases
Injuries
Malignant neoplasms and cancer
Infectious diseases, maternal & perinataconditions, nutritional deficiencies
Cardiovascular diseases
Shift from infectious tocardiovascular diseases
Along with other macro
trends, rise in incomes
across Asia has contributed
significantly to the increase
in healthcare spending within
the regional countries.

8/11/2019 Vietnam Pharmaceutical Industry
http://slidepdf.com/reader/full/vietnam-pharmaceutical-industry 5/28
www.VPBS.com.vn Page |
GNI per capita for selected Asian countries
Source: World Bank
As Asian people have become richer, their diet habits have changed. For instance, th
growing middle class in the region consumes more sweetened food (e.g. candieschocolates) and beverages (e.g. soda, sport drinks). This has led to an increase
prevalence of cardiovascular diseases, cancer and diabetes within the regiona
countries’ populations. Governments in the region have been investing in the healthcar
infrastructure and services in order to alleviate the expenditure burden on household
and adapt to the aforementioned changes in the disease profiles.
Real pharmaceutical spending per capita Healthcare spending per capita (USD)
Source: World Health Organization (WHO) Source: World Health Organization (WHO)
Thanks to the positive macro catalysts mentioned above, Asia has become an attractiv
market for the global pharmaceutical companies. In 2010, the Asia-Pacific regio
accounted for 21% of Bayer AG’s total revenues as compared to only 10% in 1990. I
addition, according to the international data provider fDiMarkets.com, there had bee
653 cross-border investment projects in Asia between 2004 and 2011 worth a total o
USD29 billion, coming from 321 companies in the pharmaceutical (70%) an
biotechnology space (30%). China was the largest recipient with 186 inwar
investments, followed by India (157) and Singapore (94). Global pharmaceutical firm
have been moving into Asian countries in order to lower their production costs and
960 470 7103,540
1,030
20,690
2,000430
5,7201,580
3,420
9,820
2,500
47,210
5,2101,550
19.5%
12.9%
17.0%
10.7%9.3%
8.6%
10.0%
13.7%
0%
5%
10%
15%
20%
25%
0
10,000
20,000
30,000
40,000
50,000
China India Indonesia Malaysia Philippines Singapore Thailand Vietnam
USD 2002 2012 2002 - 2012 CAGR
2% 2%4%
7%
9%9% 10%
12%
0%
3%
6%
9%
12%
15%
383
278
201
97 97 96 9560
0%
4%
8%
12%
16%
20%
0
100
200
300
400
500
2000 2011 2000 - 2011 CAGR2000 – 2009 CAGR
From 2004 to 2011, there
had been 653 cross-border
investment projects flowing
into Asian countries.
8/11/2019 Vietnam Pharmaceutical Industry
http://slidepdf.com/reader/full/vietnam-pharmaceutical-industry 6/28
www.VPBS.com.vn Page |
expand the research and development (R&D) base. R&D accounted for 200 projects o
the 653 cross-border investment projects mentioned above, compared to manufacturin
with 175.
Another trend that attracts global pharmaceutical companies to Asia is the dominanc
of generic drugs among the region’s less-developed emerging markets due to the
affordability. In addition to employing market-based pricing strategy for foreigmarkets, pharmaceutical companies have been partnering with local gener
manufacturers to broaden market shares and/or to capitalize on the loss of exclusivity o
patented/original drugs.
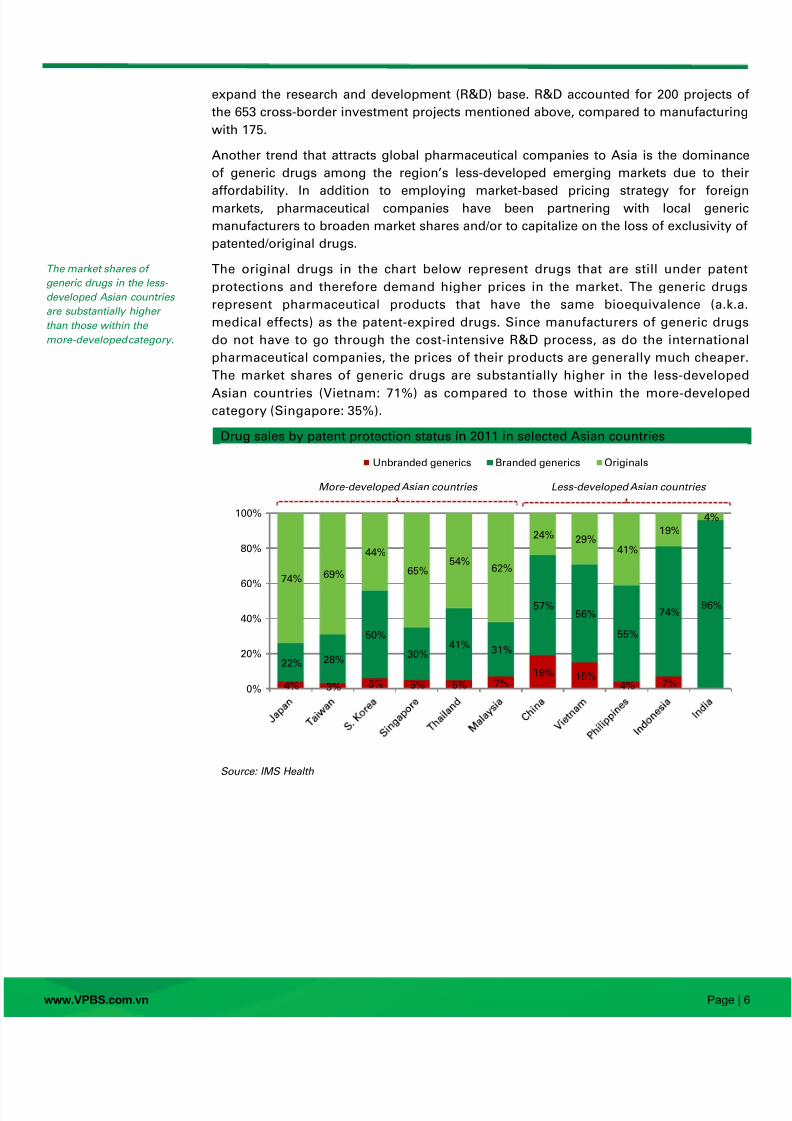
The original drugs in the chart below represent drugs that are still under paten
protections and therefore demand higher prices in the market. The generic drug
represent pharmaceutical products that have the same bioequivalence (a.k.a
medical effects) as the patent-expired drugs. Since manufacturers of generic drug
do not have to go through the cost-intensive R&D process, as do the internationa
pharmaceutical companies, the prices of their products are generally much cheape
The market shares of generic drugs are substantially higher in the less-develope
Asian countries (Vietnam: 71%) as compared to those within the more-developecategory (Singapore: 35%).
Drug sales by patent protection status in 2011 in selected Asian countries
Source: IMS Health
4% 3% 6% 5% 5% 7%19% 15%
4% 7%
22% 28%
50%
30%41%
31%
57%56%
55%
74%96%
74% 69%
44%
65%54%
62%
24% 29%41%
19%
4%
0%
20%
40%
60%
80%
100%
Unbranded generics Branded generics Originals
More-developed Asian countries Less-developed Asian countries
The market shares of
generic drugs in the less-
developed Asian countries
are substantially higher
than those within the
more-developed category.
8/11/2019 Vietnam Pharmaceutical Industry
http://slidepdf.com/reader/full/vietnam-pharmaceutical-industry 7/28
www.VPBS.com.vn Page |
VIETNAM PHARMACEUTICAL INDUSTRY
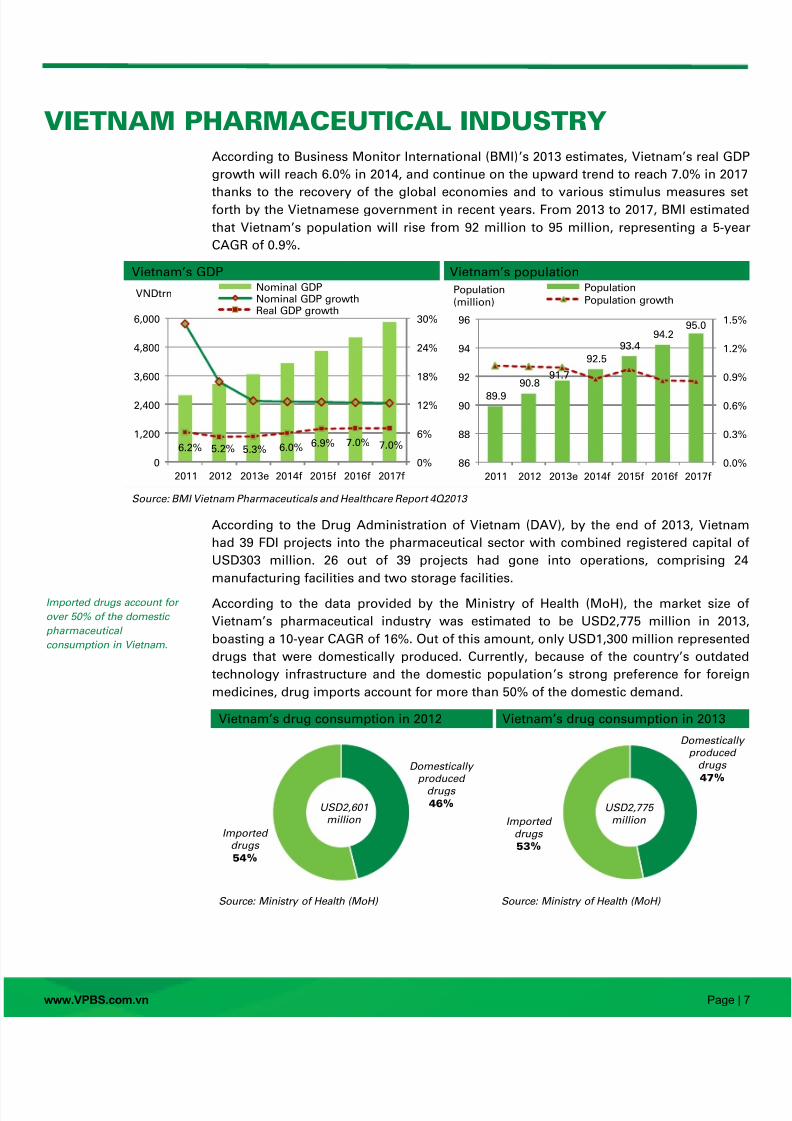
According to Business Monitor International (BMI)’s 2013 estimates, Vietnam’s real GD
growth will reach 6.0% in 2014, and continue on the upward trend to reach 7.0% in 201
thanks to the recovery of the global economies and to various stimulus measures seforth by the Vietnamese government in recent years. From 2013 to 2017, BMI estimate
that Vietnam’s population will rise from 92 million to 95 million, representing a 5-yea
CAGR of 0.9%.
Vietnam’s GDP Vietnam’s population
Source: BMI Vietnam Pharmaceuticals and Healthcare Report 4Q2013
According to the Drug Administration of Vietnam (DAV), by the end of 2013, Vietnam
had 39 FDI projects into the pharmaceutical sector with combined registered capital o
USD303 million. 26 out of 39 projects had gone into operations, comprising 2
manufacturing facilities and two storage facilities.
According to the data provided by the Ministry of Health (MoH), the market size o
Vietnam’s pharmaceutical industry was estimated to be USD2,775 million in 2013
boasting a 10-year CAGR of 16%. Out of this amount, only USD1,300 million represente
drugs that were domestically produced. Currently, because of the country’s outdate
technology infrastructure and the domestic population’s strong pref erence for foreig
medicines, drug imports account for more than 50% of the domestic demand.
Vietnam’s drug consumption in 2012 Vietnam’s drug consumption in 2013
Source: Ministry of Health (MoH) Source: Ministry of Health (MoH)
6.2% 5.2% 5.3% 6.0% 6.9% 7.0% 7.0%
0%
6%
12%
18%
24%
30%
0
1,200
2,400
3,600
4,800
6,000
2011 2012 2013e 2014f 2015f 2016f 2017f
VNDtrnNominal GDPNominal GDP growthReal GDP growth
89.9
90.891.7
92.5
93.494.2
95.0
0.0%
0.3%
0.6%
0.9%
1.2%
1.5%
86
88
90
92
94
96
2011 2012 2013e 2014f 2015f 2016f 2017f
Population(million)
Population
Population growth
Domesticallyproduced
drugs
46%
Importeddrugs
54%
USD2,601million
Domesticallyproduced
drugs
47%
Importeddrugs
53%
USD2,775million
Imported drugs account for
over 50% of the domestic
pharmaceutical
consumption in Vietnam.

8/11/2019 Vietnam Pharmaceutical Industry
http://slidepdf.com/reader/full/vietnam-pharmaceutical-industry 8/28
www.VPBS.com.vn Page |
According to BMI’s research data, the total market size of Vietnam’s pharmaceutica
industry reached USD3,320 million in 2013, up 17% from USD2,840 million in 2012
(These data discrepancies are common in Vietnam, where statistical figures can var
across different governmental agencies.)
Sales of Vietnam’s pharmaceutical industry Vietnam’s pharmaceutical spending per capita
Source: BMI Vietnam Pharmaceuticals and Healthcare Report 4Q2013
We believe that the industry landscape of Vietnam’s pharmaceutical sector is teemin
with potentials. Vietnam’s expanding population, higher levels of health awarenes
among the growing middle class, together with increased access to medicines acros
the country, should provide a roaring engine for the pharmaceutical sector’
acceleration in the upcoming years. Between 2013 and 2017, BMI predicted that th
pharmaceutical sector would achieve a CAGR of 17.1% in sales.
Nevertheless, Vietnam’s pharmaceutical industry is not without its shortcomings an
weaknesses, some more entrenched and enduring than others: Low affordability of medical drugs: Vietnam’s low per capita pharmaceutica
spending (1.9% of GDP per capital in 2013) highlights the country’s poor access t
medical drugs, which is caused by the high prices charged by imported drug
According to the MoH at a conference organized by the DAV in August 2013
imported medicines account for 80% of the total medicines used in hospitals.
Inadequate price-control regime : Medicine cost varies wildly throughout the supp
chain due to the arbitrary price mark-ups by both drug distributors and retail stores
According to a statement by Vietnam’s Health Minister, Ms. Nguyen Thi Kim Tien
there are many instances of the same drugs being sold at significantly differen
prices in various provinces. Not only does this situation erode the affordability o
medicines in various parts of the country, it also severely hurts consumer
confidence in the competence of both the DAV and MOH.
Corruption: There have been numerous accusations regarding the collusion betwee
foreign drug-makers and local distributors in order to keep prices high and doctor
receiving commissions for prescribing certain drugs. Such practices are puttin
medicinal treatments beyond the budgets of many patients in Vietnam. Sinc
August 2012, Vietnam’s social health insurance fund has been running at deficit, i
part due to the mismanagement of funds as well as corruption. In a meetin
organized by the MoH officials in August 2013, it was estimated that the nationa
health insurance fund would face USD47 million in overspending in 2013.
2.12.4
2.83.3
3.9
4.6
5.4
6.2
0%
6%
12%
18%
24%
0
2
4
6
8
2010 2011 2012 2013e 2014f 2015f 2016f 2017f
GrowthUSDbn
Pharmaceuticals industryPharma growth (%)GDP growth (%)
23.127.0
31.236.2
42.4
48.9
55.963.6
0%
5%
10%
15%
20%
0
20
40
60
80
2010 2011 2012 2013e 2014f 2015f 2016f 2017f
GrowthUSDPharmaceuticals spending per capitaGDP growth
While teeming with
opportunities, Vietnam’s
pharmaceutical sector is
hindered by numerous
structural weaknesses.
8/11/2019 Vietnam Pharmaceutical Industry
http://slidepdf.com/reader/full/vietnam-pharmaceutical-industry 9/28
www.VPBS.com.vn Page |
Lack of Intellectual property protection: Since 2004, the Office of the US Trad
Representative (USTR) has been including Vietnam among its list of ‚watch
countries because of Vietnam’s inadequate mechanism for the protection o
intellectual property (IP). According to BMI, a large portion of Vietnam’s gener
drug market actually represents low-quality copies of unproven bioequivalence
Vietnam’s entrance into WTO in 2007 did provide some improvements with th
regard to the country’s intellectual property regimes. That said, without stronge
standards and stricter enforcement, further improvements of Vietnam’s IP protectio
regime will likely come at a very slow pace.
Counterfeit: Counterfeit drugs represent an extremely challenging issue in Vietnam
given the fact that pharmacy distribution in Vietnam is largely handled by privat
dealers. In addition, the country has long and poorly monitored borders wit
neighboring countries such as Laos, China and Cambodia, where the counterfe
drug trade is very active. In February 2010, an arrest warrant was issued for
number of individuals operating under a front company called Viet-Phap (Vietnam
France) Medicine Company. These individuals were indicted for manufacturing an
supplying fake pharmaceutical products.
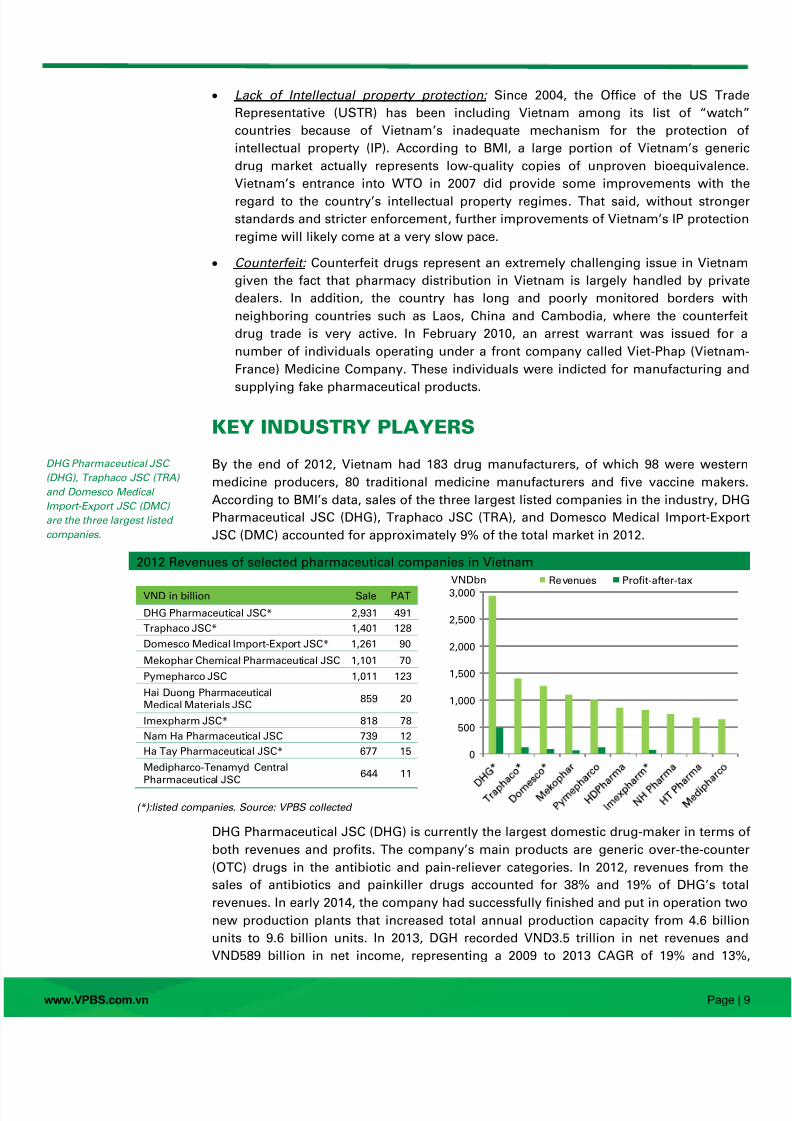
KEY INDUSTRY PLAYERS
By the end of 2012, Vietnam had 183 drug manufacturers, of which 98 were wester
medicine producers, 80 traditional medicine manufacturers and five vaccine makers
According to BMI’s data, sales of the three largest listed companies in the industry, DH
Pharmaceutical JSC (DHG), Traphaco JSC (TRA), and Domesco Medical Import-Expo
JSC (DMC) accounted for approximately 9% of the total market in 2012.
2012 Revenues of selected pharmaceutical companies in Vietnam
VND in billion Sale PAT
DHG Pharmaceutical JSC* 2,931 491
Traphaco JSC* 1,401 128
Domesco Medical Import-Export JSC* 1,261 90
Mekophar Chemical Pharmaceutical JSC 1,101 70
Pymepharco JSC 1,011 123
Hai Duong PharmaceuticalMedical Materials JSC
859 20
Imexpharm JSC* 818 78
Nam Ha Pharmaceutical JSC 739 12
Ha Tay Pharmaceutical JSC* 677 15
Medipharco-Tenamyd CentralPharmaceutical JSC
644 11
(*):listed companies. Source: VPBS collected
DHG Pharmaceutical JSC (DHG) is currently the largest domestic drug-maker in terms o
both revenues and profits. The company’s main products are generic over-the-counte
(OTC) drugs in the antibiotic and pain-reliever categories. In 2012, revenues from th
sales of antibiotics and painkiller drugs accounted for 38% and 19% of DHG’s tota
revenues. In early 2014, the company had successfully finished and put in operation tw
new production plants that increased total annual production capacity from 4.6 billio
units to 9.6 billion units. In 2013, DGH recorded VND3.5 trillion in net revenues an
VND589 billion in net income, representing a 2009 to 2013 CAGR of 19% and 13%
0
500
1,000
1,500
2,000
2,500
3,000
VNDbn Revenues Profit-after-tax
DHG Pharmaceutical JSC
(DHG), Traphaco JSC (TRA)
and Domesco Medical
Import-Export JSC (DMC)
are the three largest listed
companies.
8/11/2019 Vietnam Pharmaceutical Industry
http://slidepdf.com/reader/full/vietnam-pharmaceutical-industry 10/28
www.VPBS.com.vn Page | 1
respectively. DHG’s gross and net margins were the highest among listed companie
during 2013, recording 47% and 17%, respectively.
Traphaco JSC (TRA)‘s two most popular products in the market are Bogan
(supplements for liver’s functions) and Hoat Huyet Duong Nao (supplements for brai
functions). In 2012, sale of these two products together accounted for 34% of th
company’s total revenues. TRA’s main competitive advantage is the ability to sourc90% of the raw material needs from its local suppliers while other drug makers in th
same field have to rely on imported products from China. In 2013, TRA recorded VND1.
trillion in sales and VND149 billion in net income, representing a 2009 to 2013 CAGR o
23% and 31%, respectively. Last year, TRA had gross and net margins of 43% and 9%
respectively.
Domesco Medical Import Export JSC (DMC)’s offerings comprise a wide range o
products, from traditional medicines and vitamins & supplements to antibiotic, pain
killer and specialty drugs. DMC’s better known products in the markets are the gener
specialty drugs used for treatments for diabetes and cardiovascular diseases as the
costs are 30% to 40% lower than the imported products. In 2013, DMC recorded VND1.
trillion in net sales and VND106 billion in net income, representing a 2009 to 2013 CAGof 8% and 9%, respectively.
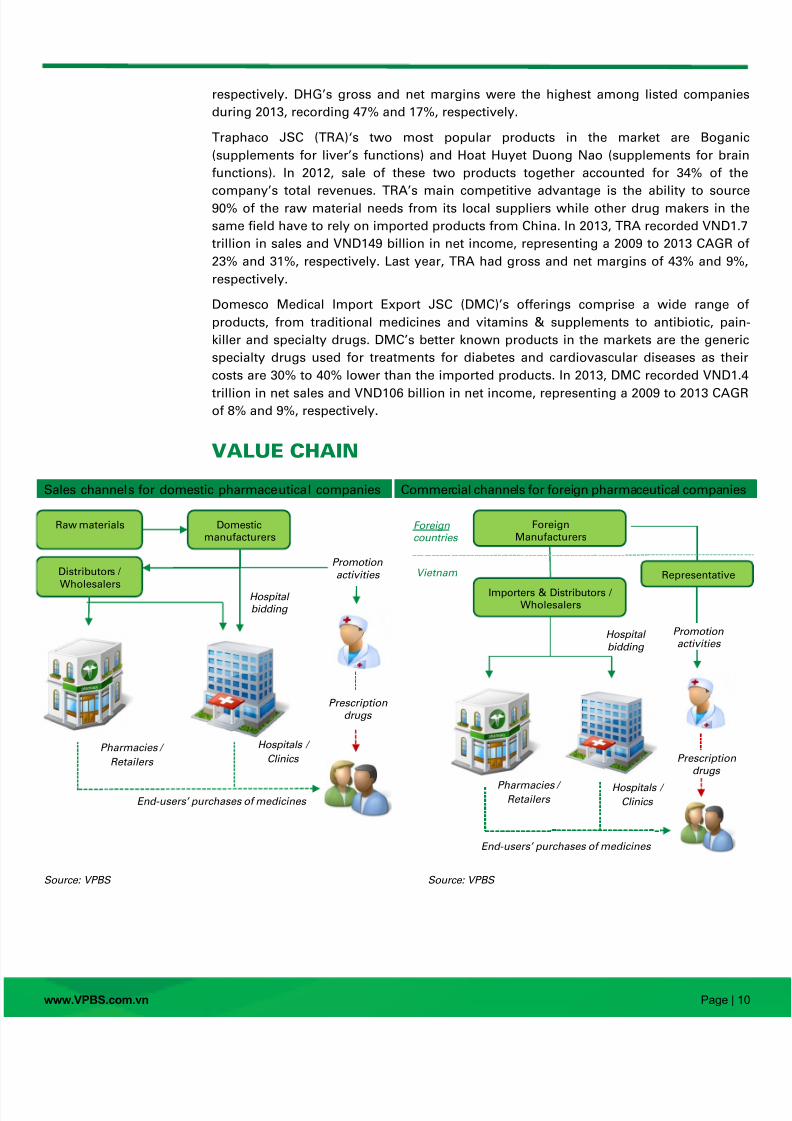
VALUE CHAIN
Sales channels for domestic pharmaceutical companies Commercial channels for foreign pharmaceutical companie
Source: VPBS Source: VPBS
Domestic
manufacturers
Distributors /
Wholesalers
Promotion
activities
Prescriptiondrugs
Raw materials
Hospitalbidding
End- users’ purchases of medicines
Pharmacies /
Retailers
Hospitals /
Clinics
Importers & Distributors /Wholesalers
Promotionactivities
Prescriptiondrugs
Foreign
Manufacturers
Representative
Hospital
bidding
End- users’ purchases of medicines
Foreigncountries
Vietnam
Pharmacies / Retailers
Hospitals /Clinics
8/11/2019 Vietnam Pharmaceutical Industry
http://slidepdf.com/reader/full/vietnam-pharmaceutical-industry 11/28
www.VPBS.com.vn Page | 1
Raw materials: 90% are imported
Each drug is made up of two main components, the active pharmaceutical ingredien
(API) and the excipient. The API is the biologically active substance that decides th
medical usage of a drug. The excipient, on the other hand, is an inactive substanc
formulated alongside the API, for the purpose of bulking up the dosage form for ease o
dispensation (e.g. sucrose used as tablet powders). The excipient might also servvarious therapeutic-enhancing purposes, such as facilitating drug absorption o
solubility. In Vietnam, alongside APIs and excipients, herbs and herbal extracts are als
used for medicinal purposes, especially in the field of traditional medicines.
APIs of originator drugs are usually protected by laws until the expirations of the
respective patents. For excipients, pharmaceutical companies can choose either to kee
them protected as trade secrets or to apply for patent protection if applicable.
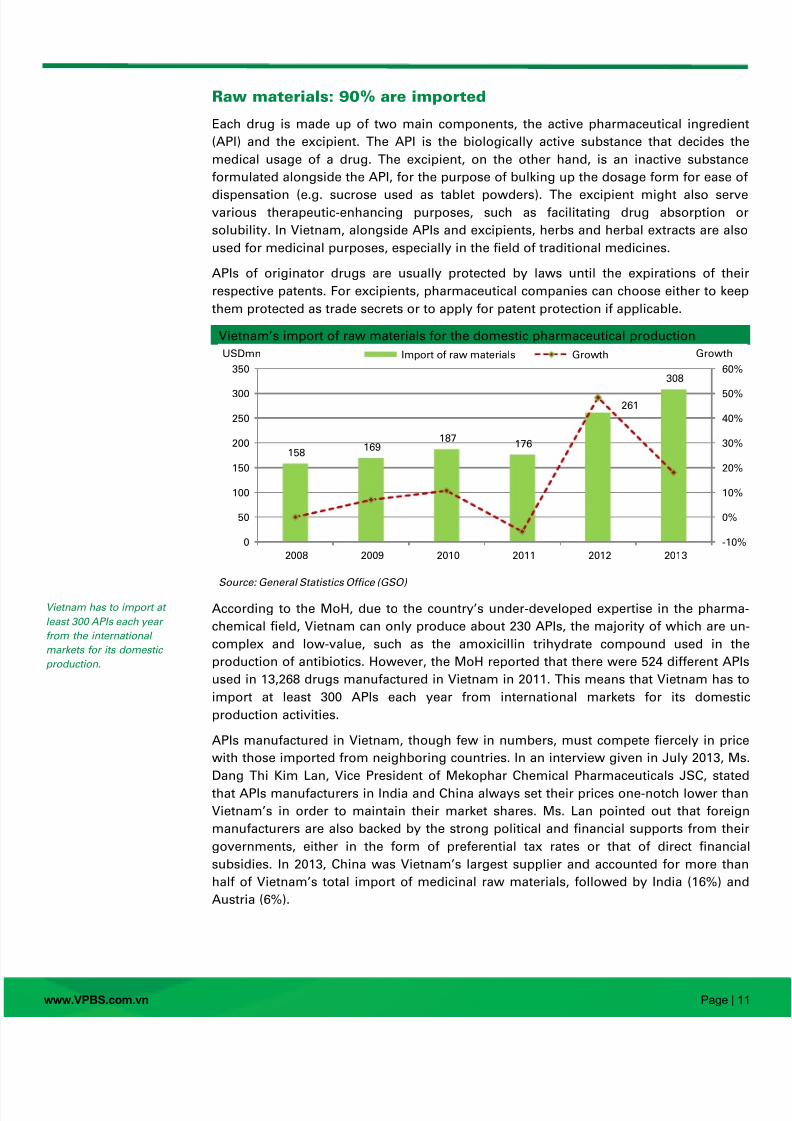
Vietnam’s import of raw materials for the domestic pharmaceutical production
Source: General Statistics Office (GSO)
According to the MoH, due to the country’s under-developed expertise in the pharma
chemical field, Vietnam can only produce about 230 APIs, the majority of which are un
complex and low-value, such as the amoxicillin trihydrate compound used in th
production of antibiotics. However, the MoH reported that there were 524 different AP
used in 13,268 drugs manufactured in Vietnam in 2011. This means that Vietnam has t
import at least 300 APIs each year from international markets for its domest
production activities.
APIs manufactured in Vietnam, though few in numbers, must compete fiercely in pric
with those imported from neighboring countries. In an interview given in July 2013, M
Dang Thi Kim Lan, Vice President of Mekophar Chemical Pharmaceuticals JSC, state
that APIs manufacturers in India and China always set their prices one-notch lower tha
Vietnam’s in order to maintain their market shares. Ms. Lan pointed out that foreig
manufacturers are also backed by the strong political and financial supports from the
governments, either in the form of preferential tax rates or that of direct financia
subsidies. In 2013, China was Vietnam’s largest supplier and accounted for more tha
half of Vietnam’s total import of medicinal raw materials, followed by India (16%) an
Austria (6%).
158169
187176
261
308
-10%
0%
10%
20%
30%
40%
50%
60%
0
50
100
150
200
250
300
350
2008 2009 2010 2011 2012 2013
GrowthUSDmn Import of raw materials Growth
Vietnam has to import at
least 300 APIs each year
from the international
markets for its domestic
production.
8/11/2019 Vietnam Pharmaceutical Industry
http://slidepdf.com/reader/full/vietnam-pharmaceutical-industry 12/28
www.VPBS.com.vn Page | 1
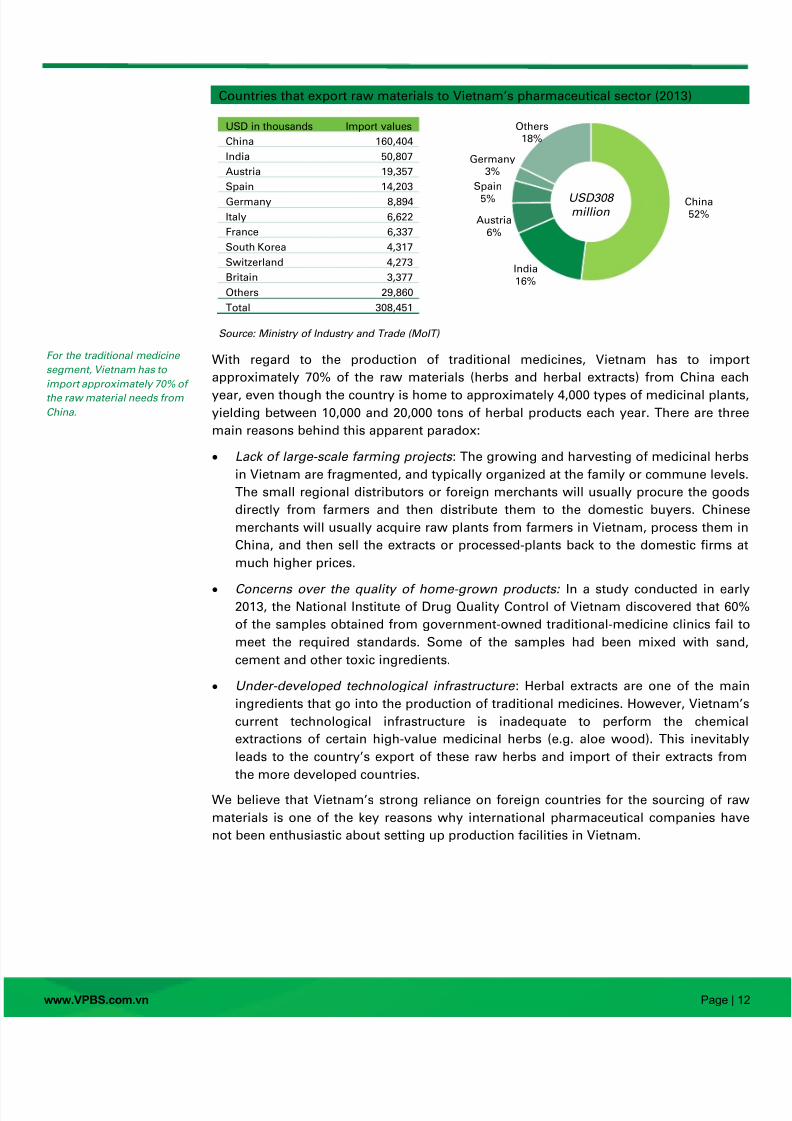
Countries that export raw materials to Vietnam’s pharmaceutical sector (2013)
USD in thousands Import values
China 160,404
India 50,807
Austria 19,357
Spain 14,203
Germany 8,894
Italy 6,622
France 6,337
South Korea 4,317
Switzerland 4,273
Britain 3,377
Others 29,860
Total 308,451
Source: Ministry of Industry and Trade (MoIT)
With regard to the production of traditional medicines, Vietnam has to impo
approximately 70% of the raw materials (herbs and herbal extracts) from China eac
year, even though the country is home to approximately 4,000 types of medicinal plantsyielding between 10,000 and 20,000 tons of herbal products each year. There are thre
main reasons behind this apparent paradox:
Lack of large-scale farming projects : The growing and harvesting of medicinal herb
in Vietnam are fragmented, and typically organized at the family or commune levels
The small regional distributors or foreign merchants will usually procure the good
directly from farmers and then distribute them to the domestic buyers. Chines
merchants will usually acquire raw plants from farmers in Vietnam, process them i
China, and then sell the extracts or processed-plants back to the domestic firms a
much higher prices.
Concerns over the quality of home-grown products: In a study conducted in ear2013, the National Institute of Drug Quality Control of Vietnam discovered that 60%
of the samples obtained from government-owned traditional-medicine clinics fail t
meet the required standards. Some of the samples had been mixed with sand
cement and other toxic ingredients.
Under-developed technological infrastructure : Herbal extracts are one of the mai
ingredients that go into the production of traditional medicines. However, Vietnam’
current technological infrastructure is inadequate to perform the chemica
extractions of certain high-value medicinal herbs (e.g. aloe wood). This inevitabl
leads to the country’s export of these raw herbs and import of their extracts from
the more developed countries.
We believe that Vietnam’s strong reliance on foreign countries for the sourcing of raw
materials is one of the key reasons why international pharmaceutical companies hav
not been enthusiastic about setting up production facilities in Vietnam.
China52%
India16%
Austria6%
Spain
5%
Germany3%
Others18%
USD308million
For the traditional medicine
segment, Vietnam has to
import approximately 70% of
the raw material needs from
China.
8/11/2019 Vietnam Pharmaceutical Industry
http://slidepdf.com/reader/full/vietnam-pharmaceutical-industry 13/28
www.VPBS.com.vn Page | 1
Domestic medicines: an uphill battle against imported products
Western medicines consistently accounted for about 90% of the industry’s total marke
share. According to the MOH’s Decision 3886/2004/QĐ-BYT, all domestic pharmaceutica
manufacturers must obtain WHO-GMP certification from the MoH by the end of 2010
However, by the end of 2013, there were only 120 companies complying with th
requirement of the total number of 183 firms.
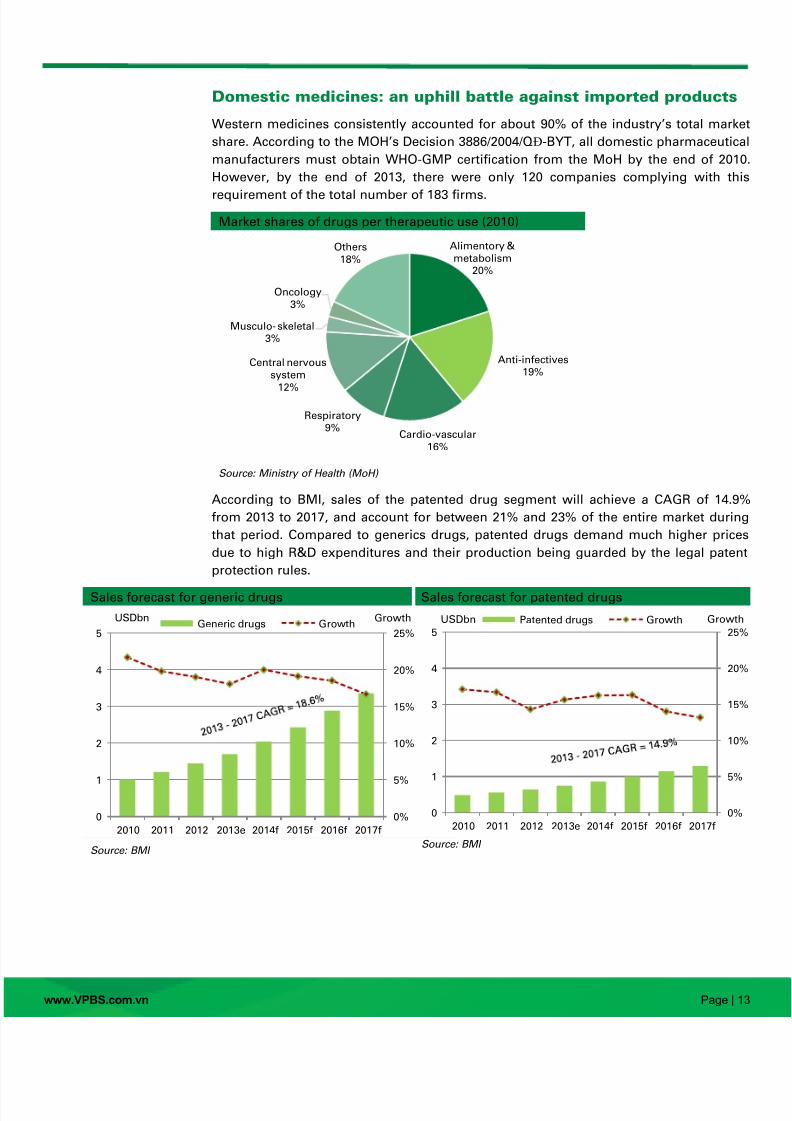
Market shares of drugs per therapeutic use (2010)
Source: Ministry of Health (MoH)
According to BMI, sales of the patented drug segment will achieve a CAGR of 14.9%
from 2013 to 2017, and account for between 21% and 23% of the entire market durin
that period. Compared to generics drugs, patented drugs demand much higher price
due to high R&D expenditures and their production being guarded by the legal paten
protection rules.
Sales forecast for generic drugs Sales forecast for patented drugs
Source: BMISource: BMI
Alimentory &metabolism
20%
Anti-infectives19%
Cardio-vascular16%
Respiratory9%
Central nervoussystem
12%
Musculo- skeletal3%
Oncology3%
Others18%
0%
5%
10%
15%
20%
25%
0
1
2
3
4
5
2010 2011 2012 2013e 2014f 2015f 2016f 2017f
GrowthUSDbnGeneric drugs Growth
0%
5%
10%
15%
20%
25%
0
1
2
3
4
5
2010 2011 2012 2013e 2014f 2015f 2016f 2017f
GrowthUSDbn Patented drugs Growth
8/11/2019 Vietnam Pharmaceutical Industry
http://slidepdf.com/reader/full/vietnam-pharmaceutical-industry 14/28
www.VPBS.com.vn Page | 1
Currently, all drugs that contain patented APIs are manufactured abroad and must b
imported for local consumption. As such, added fees such as imported tariffs (5% at th
moment), transportation costs and under-the-table dealings severely erode the
affordability in the market. Within this segment, patented specialty drugs, such as thos
treating the central nervous system, musculoskeletal oncology diseases, will exhib
strong growth as unhealthy life styles (e.g. smoking and drinking) and toxi
environment conditions are on a steady rise in Vietnam. According to the MoH’s data
around 150,000 people contract cancer each year in Vietnam, with the mortality rat
standing around 50%. Considering the shift in disease profiles discussed at th
beginning of this report, the patented drug segment will be a very lucrative market i
the upcoming years.
Local pharmaceutical companies in Vietnam, however, are not keen on investing in R&
in order to develop new patented drugs due to the huge expenditure and long tim
horizon usually associated with the development of a new drug. According to a stud
conducted in 2011 by InnoThink Center for Research in Biomedical Innovation, a Unite
States-based think tank, it costs at least USD3.6 billion and a period of five years i
order to develop a new drug. At the moment, pharmaceutical companies in Vietnam
ar
content with producing generic drugs and only hold patents for the trade names of the
products, but not for the drug formulas. For example, Traphaco JSC only holds th
patent for ‚Boganic‛, the trade name of its liver-function supplement drug.
At the moment, pharmaceutical production in Vietnam is still limited in term of offering
as most local companies choose to produce similar products to minimize business risk
According to data provided by the DAV, at the end of 2011, 524 APIs were used in th
domestic production of 13,268 pharmaceutical products (averaging 25 products per
API) while 927 APIs were present in 15,552 imported medicines (averaging 16 product
per API). The domestic companies manufacture mostly generics and low-value drugs
such as antibiotics, and painkillers while the high-value specialty drugs (e.g. oncology
diabetes medication) are usually imported. Vietnam offers strong potential for thgeneric market due to the country’s consumer purchasing power being quite low i
relation to the pricing of the patented drugs. However, in this category, the loca
pharmaceutical market is also dominated by foreign products.
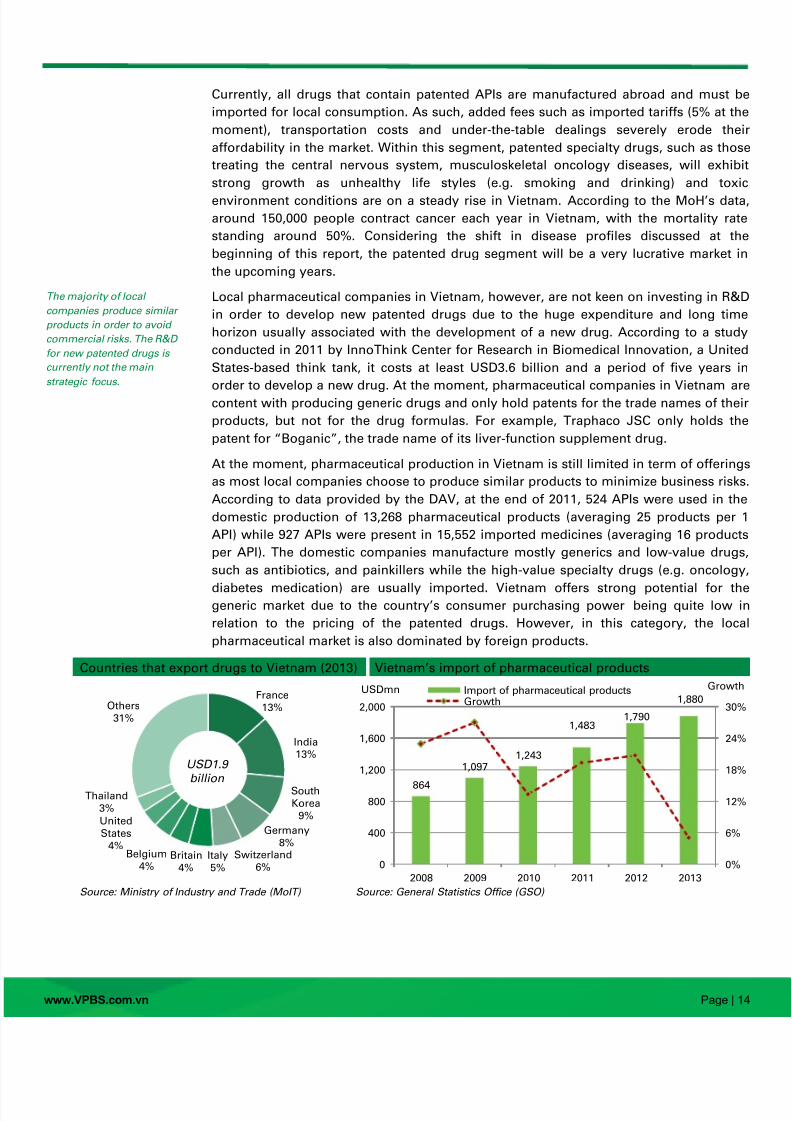
Countries that export drugs to Vietnam (2013) Vietnam’s import of pharmaceutical products
Source: Ministry of Industry and Trade (MoIT) Source: General Statistics Office (GSO)
France13%
India13%
SouthKorea
9%
Germany8%
Switzerland6%
Italy5%
Britain4%
Belgium4%
UnitedStates
4%
Thailand3%
Others31%
USD1.9
billion864
1,0971,243
1,4831,790
1,880
0%
6%
12%
18%
24%
30%
0
400
800
1,200
1,600
2,000
2008 2009 2010 2011 2012 2013
GrowthUSDmn Import of pharmaceutical productsGrowth
The majority of local
companies produce similar
products in order to avoid
commercial risks. The R&D
for new patented drugs is
currently not the main
strategic focus.
8/11/2019 Vietnam Pharmaceutical Industry
http://slidepdf.com/reader/full/vietnam-pharmaceutical-industry 15/28
www.VPBS.com.vn Page | 1
The dominance of the imported generic drugs is the result of several factors:
Local preference: Both local purchasers and doctors have a strong preference fo
imported products. The general perception in the market is that domestic drugs ar
manufactured from outdated production facilities with dismal quality control.
Unfair regulations of promotion activities: Promotion expenses for domest
pharmaceutical companies are curbed at 15% of annual revenues (per MOH’
regulation), while foreign pharmaceutical firms are allowed to spend up to 30% fo
this activity. As such, it is common for foreign companies to organize all-paid-fo
overseas conferences for local doctors and their families in order to promote the
products, with the unstated real purpose actually being sight-seeing and shopping.
Unscrupulous practices: Doctors and pharmacists enjoy much higher sa
commissions and (under-the-table) kickbacks when they prescribe foreign product
to patients. According to unofficial estimates, these commissions and kickbacks, th
most common form of which is wholesale discount, can amount up to 30% of th
drugs’ full prices.
Lax import policies : Vietnam’s regulations are extremely lax toward importe
pharmaceutical products. Currently, in order to sell their products in Vietnamforeign pharmaceutical companies need to provide cost, insurance and freight (CIF
pricing, certification of quality from the country or origins and a small applicatio
fee of approximately USD200. The MoH’s local review process does not require an
local testing for the bioequivalence and bioavailability of the drugs. Meanwhile, i
order for the domestic companies to export their products abroad, they have t
submit elaborate clinical testing results and undergo strict scrutinizing from th
foreign countries’ regulatory bodies.
Vietnam’s policies for pharmaceutical imports appear quite lacking compared t
neighboring countries. Indonesia, for example, severely limits the import of gener
drugs for which domestic alternatives are available; while Thailand requires that a
foreign drugs must undergo domestic clinical testing before they can be distributed tthe mass population. In 2011, approximately 3,000 trading licenses were granted t
imported drugs in Vietnam as compared to only 26 in Thailand.
Recent investigations, however, have discovered that imported pharmaceutical product
do not always mean higher quality as compared to the domestically produce
medicines. For example, in December 2013, the DAV revoked the licenses for th
distribution of Roxley 150 (Roxithromycin 150mg) produced in India, and Tatumcef 2
(Ceftazidim) produced in Taiwan.
The over-the-counter (OTC) segment, by definition, comprises drugs that patients ca
purchase without doctor’s prescriptions. The products in this category typically includ
vitamin supplements, common flu medicines, pain relievers and traditional medicineIn Vietnam, patients usually purchase medicines based on advice obtained from clerk
working in drug stores and friends, rather than from pharmacists and from
appointments with doctors. Moreover, as Vietnam’s consumers gradually gain mor
health-awareness, they become more confident toward the self-medication approach
especially in the case of the low-income population. However, a downside associate
with this trend is the increasing abuse of antibiotics among Vietnamese people
According to a 2010 study published by Karolinska Institute, 71% children with mil
respiratory infections are being given antibiotics. As a result, nearly 70% of the bacteri
carried by people living in urban areas of Vietnam are resistant to penicillin.
The generic segment is
currently dominated by
imported pharmaceutical
products.
8/11/2019 Vietnam Pharmaceutical Industry
http://slidepdf.com/reader/full/vietnam-pharmaceutical-industry 16/28
www.VPBS.com.vn Page | 1
With regard to the traditional medicine segment, we note that great opportunitie
abound if Vietnam is able to attract or initiate investments into the country’s extractio
technologies and into large-scale farming projects for local medicinal herbs. A
mentioned above, Vietnam is home to approximately 4,000 types of medicinal plants
yielding between 10,000 and 20,000 tons of herbal products each year.
Thanks to the encouraging key-drivers observed above, BMI forecasted that sales fothis segment will achieve a CAGR of 15.9% for the period from 2013 to 2017.
Distribution channel: of maze and matrix According to the MOH, in 2011, there were 10,250 private pharmacies, and a total o
44,000 drug retailers in the public and private sectors. On average, there was one dru
retailer for every 2,000 people in Vietnam in 2011. In addition, there are currentl
approximately 1,200 companies (comprising 300 foreign and 900 local companies
engaging in the distribution of pharmaceutical products in Vietnam.
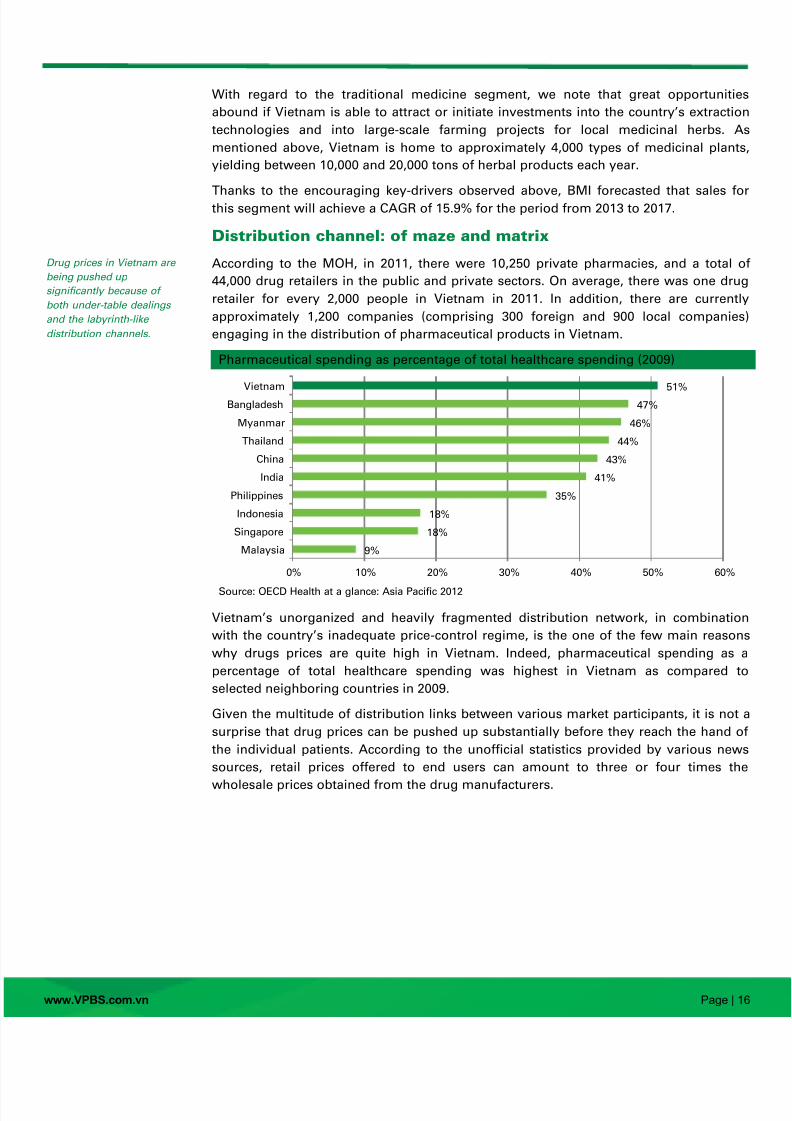
Pharmaceutical spending as percentage of total healthcare spending (2009)
Source: OECD Health at a glance: Asia Pacific 2012
Vietnam’s unorganized and heavily fragmented distribution network, in combinatio
with the country’s inadequate price-control regime, is the one of the few main reason
why drugs prices are quite high in Vietnam. Indeed, pharmaceutical spending as
percentage of total healthcare spending was highest in Vietnam as compared t
selected neighboring countries in 2009.
Given the multitude of distribution links between various market participants, it is not
surprise that drug prices can be pushed up substantially before they reach the hand o
the individual patients. According to the unofficial statistics provided by various new
sources, retail prices offered to end users can amount to three or four times th
wholesale prices obtained from the drug manufacturers.
9%
18%
18%
35%
41%
43%
44%
46%
47%
51%
0% 10% 20% 30% 40% 50% 60%
Malaysia
Singapore
Indonesia
Philippines
India
China
Thailand
Myanmar
Bangladesh
Vietnam
Drug prices in Vietnam are
being pushed up
significantly because of
both under-table dealings
and the labyrinth-like
distribution channels.
8/11/2019 Vietnam Pharmaceutical Industry
http://slidepdf.com/reader/full/vietnam-pharmaceutical-industry 17/28
www.VPBS.com.vn Page | 1
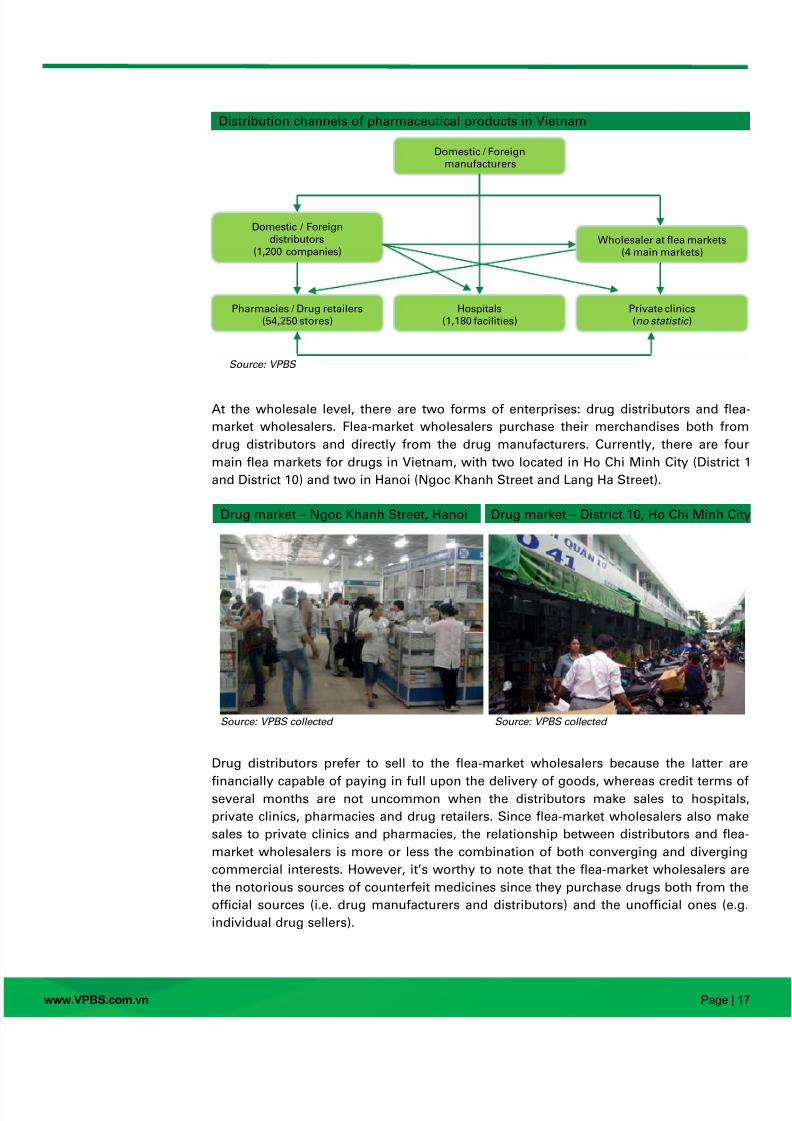
Distribution channels of pharmaceutical products in Vietnam
Source: VPBS
At the wholesale level, there are two forms of enterprises: drug distributors and flea
market wholesalers. Flea-market wholesalers purchase their merchandises both from
drug distributors and directly from the drug manufacturers. Currently, there are fou
main flea markets for drugs in Vietnam, with two located in Ho Chi Minh City (District
and District 10) and two in Hanoi (Ngoc Khanh Street and Lang Ha Street).
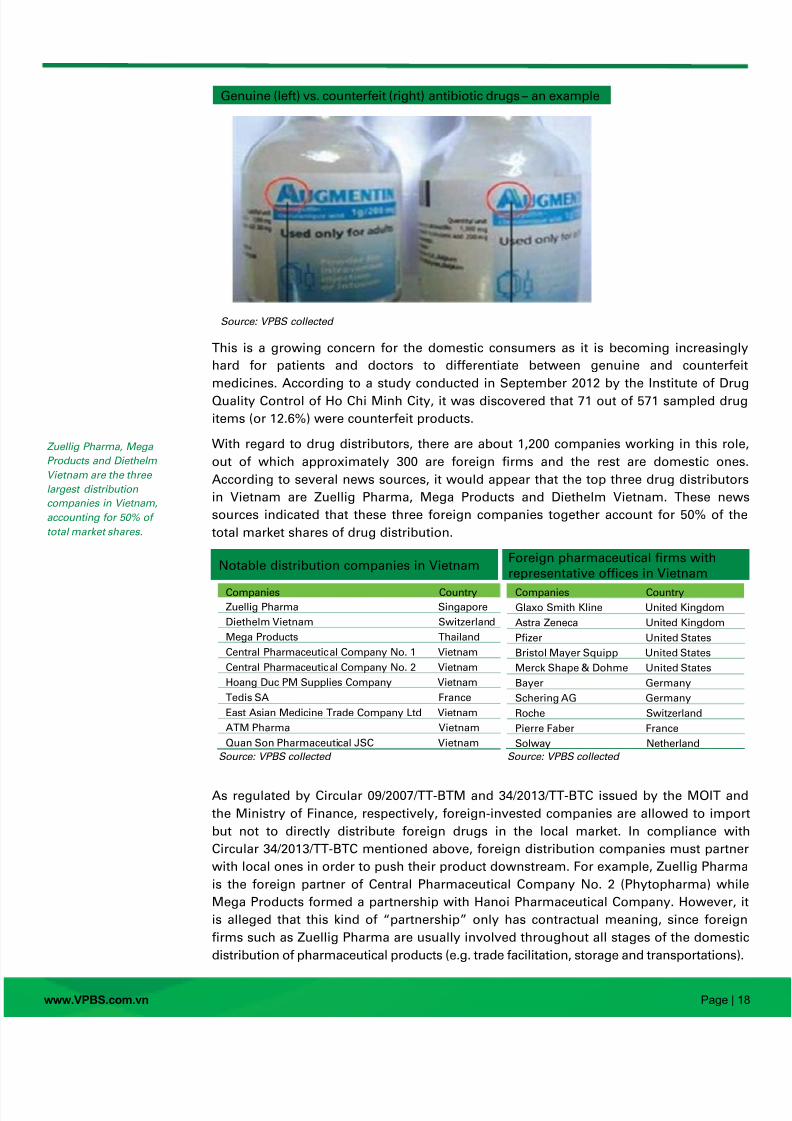
Drug market – Ngoc Khanh Street, Hanoi Drug market – District 10, Ho Chi Minh Cit
Source: VPBS collected Source: VPBS collected
Drug distributors prefer to sell to the flea-market wholesalers because the latter ar
financially capable of paying in full upon the delivery of goods, whereas credit terms oseveral months are not uncommon when the distributors make sales to hospital
private clinics, pharmacies and drug retailers. Since flea-market wholesalers also mak
sales to private clinics and pharmacies, the relationship between distributors and flea
market wholesalers is more or less the combination of both converging and divergin
commercial interests. However, it’s worthy to note that the flea-market wholesalers ar
the notorious sources of counterfeit medicines since they purchase drugs both from th
official sources (i.e. drug manufacturers and distributors) and the unofficial ones (e.g
individual drug sellers).
Domestic / Foreign
manufacturers
Domestic / Foreigndistributors
(1,200 companies) Wholesaler at flea markets
(4 main markets)
Pharmacies / Drug retailers (54,250 stores)
Hospitals
(1,180 facilities) Private clinics (no statistic )
8/11/2019 Vietnam Pharmaceutical Industry
http://slidepdf.com/reader/full/vietnam-pharmaceutical-industry 18/28
8/11/2019 Vietnam Pharmaceutical Industry
http://slidepdf.com/reader/full/vietnam-pharmaceutical-industry 19/28
www.VPBS.com.vn Page | 1
In addition, foreign distribution companies still hold substantial competitive advantage
as compared to their domestic counterparts primarily because of their long-standin
relationships with the foreign pharmaceutical companies and their technologically
advanced storage infrastructures (e.g. warehouses, transportations). As such, thes
foreign distribution companies will remain the key players with regard to the imports o
imported pharmaceutical products, especially specialty drugs, for the foreseeable future
Within the last few years, several large domestic pharmaceutical companies have bee
developing their own distribution channels to gain more control over the commercia
flows of their products. For example, DHG Pharma Corporation has approximately 8,00
distribution centers and wholesale stores throughout the country. Not only does th
distribution system help increase the availability of DHG’s products, it also gives th
company more control over their logistics and sale prices.
Hospitals: opaque auction processes
According to the Joint Annual Health Review report published in 2013, the entir
country had 1,180 public and private hospitals with a total of over 200,000 beds
achieving 25.04 beds per 10,000 patients. Distribution of drugs to hospitals is conductethrough a decentralized bidding process. Once or twice a year, the drug committees a
nationwide hospitals will initiate requests for biddings, to which pharmaceutical firm
and distribution companies can submit their offers. When an offer is chosen, th
contract prices are fixed until the end of the contract.
This auction process is organized separately by each hospital and there is very little,
any, cooperation between them. Since hospitals are given significant leeway in settin
up and managing their own auction process, corruption and collusion between doctor
and representatives from various pharmaceutical companies are not uncommon. Thi
corruption usually manifests in the forms of direct bribes to individual doctors
kickbacks offered to the hospitals or, more subtly, invitations to conferences oversea
extended to doctors’ families.
A direct result of bidding corruption is that drugs are often sold at vastly different price
throughout the provinces of Vietnam. For example, in an investigation conducted in lat
2012 by the MoH, the drug Perabact (manufactured by Parex Pharmaceutical) was price
at VND18,000 per unit at hospitals in Dong Thap Province, but costs VND30,000 in thos
located in Can Tho Province.
In 2013, in efforts to make the drug auction process more transparent and support th
consumption of domestically produced medicines, Regulation 43/2013/QH13 was issue
by the Ministry of Planning and Investment (MPI) and Circular 36/2013/TTLT-BYT-BT
(revision to Circular 01/2012/TTLT-BYT-BTC issued in June 2012) was jointly issued b
the MoH and MoF. In essence, Regulation 43/2013/QH13 forbids the submission obidding for any imported drugs for which a domestically produced alternative
available. The alternative must be deemed by the MoH as having the sam
bioequivalence, quality and availability as compared to the imported drugs. Circula
36/2013/TTLT-BYT-BTC, on the other hand, specifies in details the scoring system b
which each pharmaceutical product and each bidder should be evaluated during th
bidding process. In addition, Circular 36/2013/TTLT-BYT-BTC and Circular 01/2012/TTLT
BYT-BTC working jointly to ensure hospital bidding processes must give priority t
pharmaceutical products that offer the cheapest prices while scoring at or above certai
technical base point.
Opaque drug-bidding
auctions in hospitals give
rises to numerous
instances of corruptions
and collusions.
Several circulars have been
issued by the industry’s
regulatory bodies in order
to bring drug prices in
Vietnam in check.
8/11/2019 Vietnam Pharmaceutical Industry
http://slidepdf.com/reader/full/vietnam-pharmaceutical-industry 20/28
www.VPBS.com.vn Page | 2
Pharmacies and retail stores: small and largely unchecked
By the end of 2012, there were approximately 54,000 pharmacies and drug retailer
throughout Vietnam, presenting an average of 6.3 outlets per 10,000 people. In Vietnam
patients can get over-the-counter access to most drugs without prescriptions at privat
pharmacies or drug retailers, albeit usually at higher prices compared to pharmacie
located within hospitals. Despite various rules and measures imposed by the MoH tcounter this, the fact that only few outlets are examined and audited by the MoH eac
year means that this phenomenon will likely persist in the foreseeable future.
In addition, the majority of drug outlets in Vietnam are individually-owned and smal
scale in nature. The largest retail chains (e.g. My Chau Pharmacies) boasts between 2
and 30 stores at most. In contrast, drug retail chains in Vietnam’s more develope
neighboring countries are much larger. Philippine-based Mercury drug retail chain
owned more than 500 stores and accounted for 60% of the country’s total market shar
in 2010, according to the retail chain’s websites.
Staying nimble and small helps Vietnamese pharmacies and retail drug stores to sta
below the regulators’ radar, which, in turn, allows them to adjust the retail price o
drugs at will. In a survey conducted by students of HCMC’s Medicine and Pharmac
University in mid-2009, drugs prices varied from 10% to 38% across sampled retail outlet
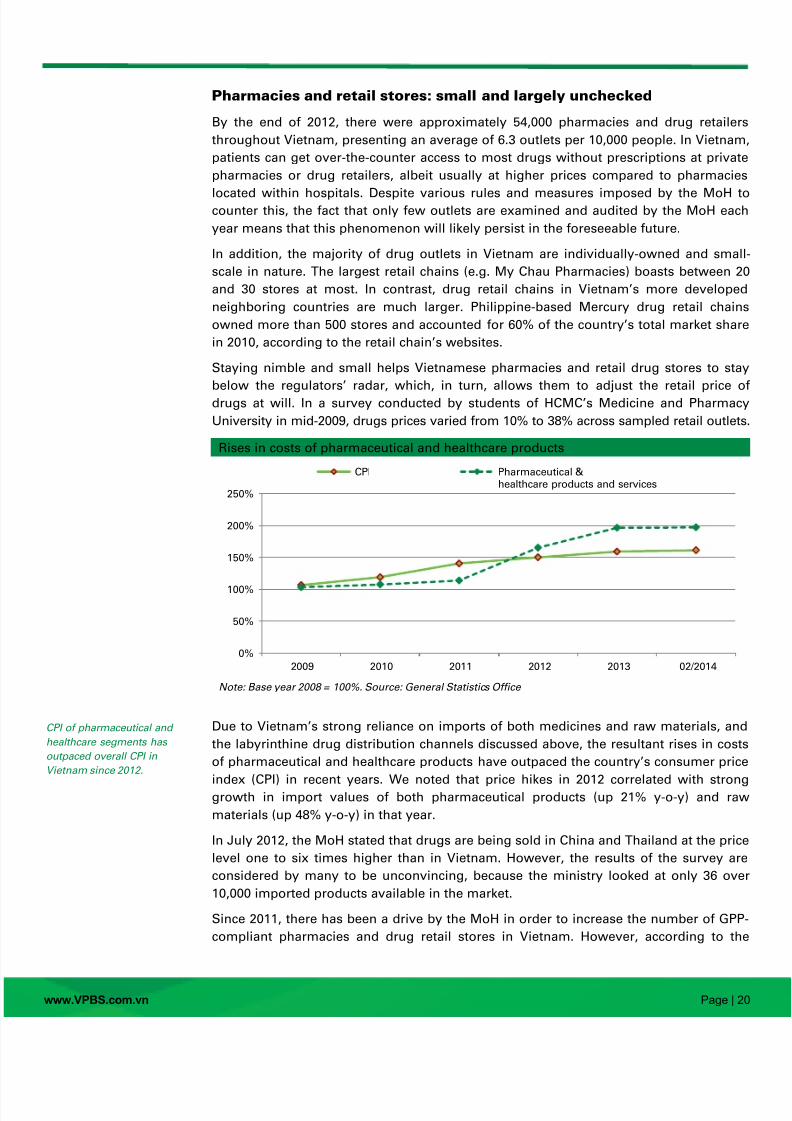
Rises in costs of pharmaceutical and healthcare products
Note: Base year 2008 = 100%. Source: General Statistics Office
Due to Vietnam’s strong reliance on imports of both medicines and raw materials, and
the labyrinthine drug distribution channels discussed above, the resultant rises in cost
of pharmaceutical and healthcare products have outpaced the country’s consumer pric
index (CPI) in recent years. We noted that price hikes in 2012 correlated with strongrowth in import values of both pharmaceutical products (up 21% y-o-y) and raw
materials (up 48% y-o-y) in that year.
In July 2012, the MoH stated that drugs are being sold in China and Thailand at the pric
level one to six times higher than in Vietnam. However, the results of the survey ar
considered by many to be unconvincing, because the ministry looked at only 36 ove
10,000 imported products available in the market.
Since 2011, there has been a drive by the MoH in order to increase the number of GPP
compliant pharmacies and drug retail stores in Vietnam. However, according to th
0%
50%
100%
150%
200%
250%
2009 2010 2011 2012 2013 02/2014
CPI Pharmaceutical &healthcare products and services
CPI of pharmaceutical and
healthcare segments has
outpaced overall CPI in
Vietnam since 2012.
8/11/2019 Vietnam Pharmaceutical Industry
http://slidepdf.com/reader/full/vietnam-pharmaceutical-industry 21/28
www.VPBS.com.vn Page | 2
JAHR published in 2013, the GPP compliance rate throughout the country by the end o
August 2012 was only 39%.
Pharmaceutical advertising
In Vietnam, prescription drugs cannot be advertised directly to consumers. Howeve
these products can be promoted to health officers and doctors via visits b
representatives of the pharmaceutical companies and through conferences and healt
seminars. In addition, foreign firms are required to obtain permission from a provincia
health department before holding any conference and that department must be mad
aware of any pharmaceutical displays.
Meanwhile, the advertising laws are more liberal for OTC products. Consume
marketing of OTC products is permitted via magazines and newspapers, as well a
leaflets and brochures. However, in order to be advertised through broader mass med
outlets such as television and radios, pharmaceutical companies must first subm
requests to the DAV for approval.
On the opposite, the DAV has banned the advertisement of nutritional supplement
effective from April 26, 2013 due to the chaotic state of the advertising system. In ainterview given in October 2012, Mr. Nguyen Thanh Phong, DAV’s Deputy Directo
asserted that preventing advertising violations was difficult as some advertisin
agencies were not registered with the authorities. There is a lack of cooperatio
between various regulatory bodies and rule enforcements are weak.
LEGAL FRAMEWORK
Regulatory bodies
The main regulatory authorities in Vietnam are the MoH and the DAV. However, bot
agencies often cooperated with other ministries such as the MoF and MoIT in order t
draft and issue regulations concerning the import, trading and distributing o
pharmaceutical products. One example of such cooperation is Circular 36/2013/TTLT
BYT-BTC, which was jointly issued by the MoH and the MoF in December 2013.
In general, it is a common perception that the regulation of pharmaceutical products i
Vietnam is not sufficiently effective due primarily to vague terms in the regulation
because rule enforcement is not strict enough to prevent violations and corruption. Fo
example, MOH’s Decision 19/2005/QQD-BYT required that all domestic drug-maker
must obtain WHO-GMP certifications by the end of 2010. However, by the end of 2012only 120 out of 183 local drug-makers had obtained this license.
By the end of 2012, only
120 out of the 183 local
drug-makers have obtained
WHO-GMP certifications.
8/11/2019 Vietnam Pharmaceutical Industry
http://slidepdf.com/reader/full/vietnam-pharmaceutical-industry 22/28
www.VPBS.com.vn Page | 2
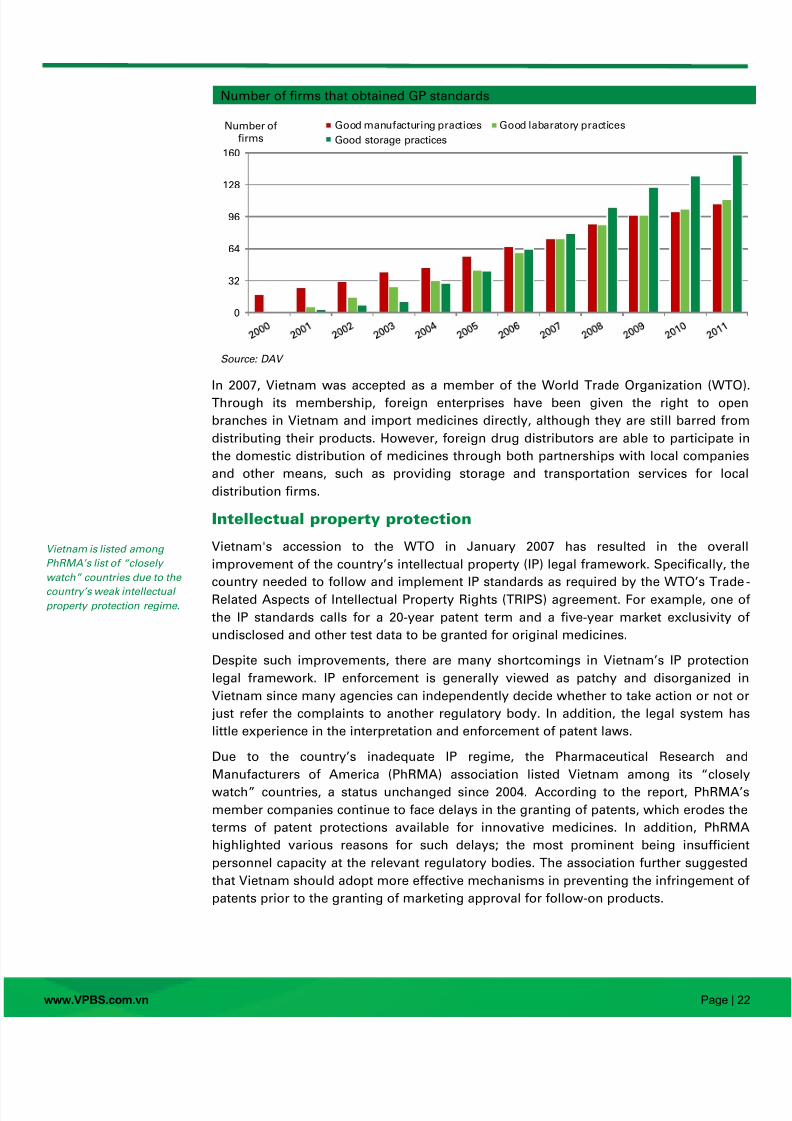
Number of firms that obtained GP standards
Source: DAV
In 2007, Vietnam was accepted as a member of the World Trade Organization (WTO
Through its membership, foreign enterprises have been given the right to ope
branches in Vietnam and import medicines directly, although they are still barred from
distributing their products. However, foreign drug distributors are able to participate i
the domestic distribution of medicines through both partnerships with local companie
and other means, such as providing storage and transportation services for loca
distribution firms.
Intellectual property protection
Vietnam's accession to the WTO in January 2007 has resulted in the overa
improvement of the country’s intellectual property (IP) legal framework. Specifically, th
country needed to follow and implement IP standards as required by the WTO’s Trade
Related Aspects of Intellectual Property Rights (TRIPS) agreement. For example, one o
the IP standards calls for a 20-year patent term and a five-year market exclusivity o
undisclosed and other test data to be granted for original medicines.
Despite such improvements, there are many shortcomings in Vietnam’s IP protectio
legal framework. IP enforcement is generally viewed as patchy and disorganized i
Vietnam since many agencies can independently decide whether to take action or not o
just refer the complaints to another regulatory body. In addition, the legal system ha
little experience in the interpretation and enforcement of patent laws.
Due to the country’s inadequate IP regime, the Pharmaceutical Research an
Manufacturers of America (PhRMA) association listed Vietnam among its ‚close
watch‛ countries, a status unchanged since 2004. According to the report, PhRMA
member companies continue to face delays in the granting of patents, which erodes th
terms of patent protections available for innovative medicines. In addition, PhRMA
highlighted various reasons for such delays; the most prominent being insufficien
personnel capacity at the relevant regulatory bodies. The association further suggeste
that Vietnam should adopt more effective mechanisms in preventing the infringement o
patents prior to the granting of marketing approval for follow-on products.
0
32
64
96
128
160
Number offirms
Good manufacturing practices Good labaratory practices
Good storage practices
Vietnam is listed among
PhRMA’s list of “closely
watch” countries due to the
country’s weak intellectual
property protection regime.

8/11/2019 Vietnam Pharmaceutical Industry
http://slidepdf.com/reader/full/vietnam-pharmaceutical-industry 23/28
8/11/2019 Vietnam Pharmaceutical Industry
http://slidepdf.com/reader/full/vietnam-pharmaceutical-industry 24/28
8/11/2019 Vietnam Pharmaceutical Industry
http://slidepdf.com/reader/full/vietnam-pharmaceutical-industry 25/28
www.VPBS.com.vn Page | 2
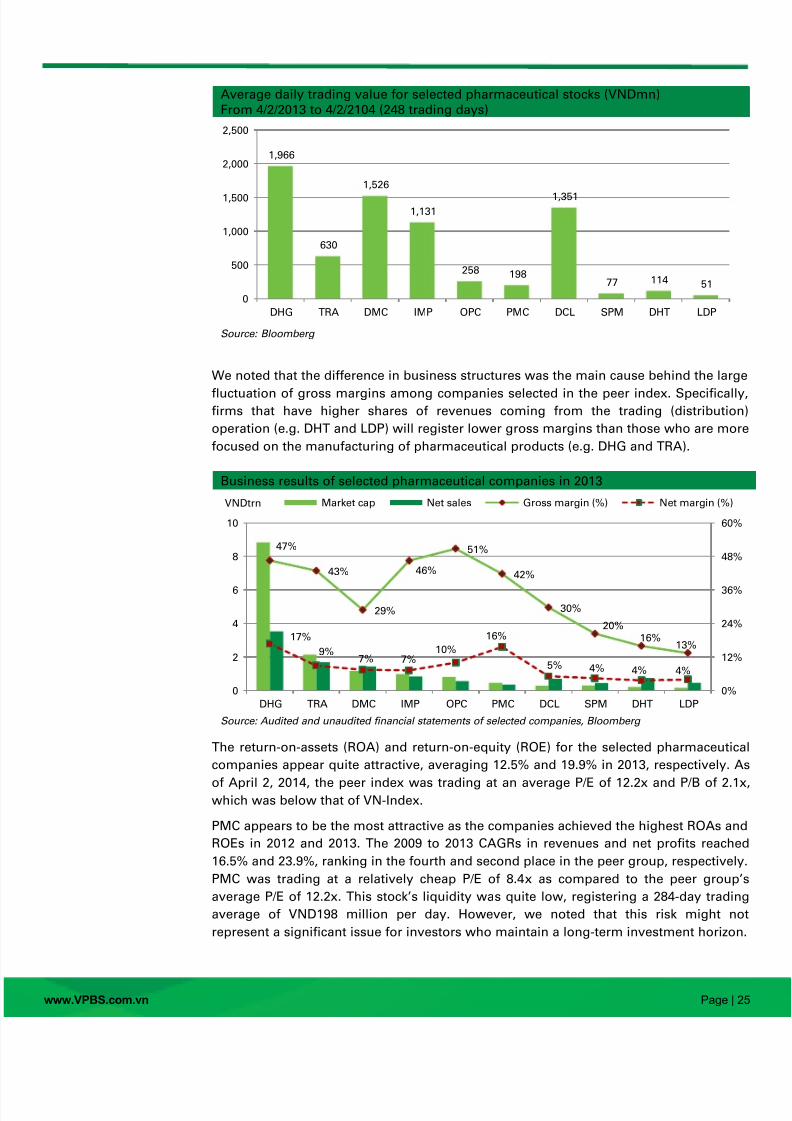
Average daily trading value for selected pharmaceutical stocks (VNDmn)
From 4/2/2013 to 4/2/2104 (248 trading days)
Source: Bloomberg
We noted that the difference in business structures was the main cause behind the larg
fluctuation of gross margins among companies selected in the peer index. Specificallyfirms that have higher shares of revenues coming from the trading (distribution
operation (e.g. DHT and LDP) will register lower gross margins than those who are mor
focused on the manufacturing of pharmaceutical products (e.g. DHG and TRA).
Business results of selected pharmaceutical companies in 2013
Source: Audited and unaudited financial statements of selected companies, Bloomberg
The return-on-assets (ROA) and return-on-equity (ROE) for the selected pharmaceutica
companies appear quite attractive, averaging 12.5% and 19.9% in 2013, respectively. A
of April 2, 2014, the peer index was trading at an average P/E of 12.2x and P/B of 2.1xwhich was below that of VN-Index.
PMC appears to be the most attractive as the companies achieved the highest ROAs an
ROEs in 2012 and 2013. The 2009 to 2013 CAGRs in revenues and net profits reache
16.5% and 23.9%, ranking in the fourth and second place in the peer group, respectively
PMC was trading at a relatively cheap P/E of 8.4x as compared to the peer group
average P/E of 12.2x. This stock’s liquidity was quite low, registering a 284-day tradin
average of VND198 million per day. However, we noted that this risk might no
represent a significant issue for investors who maintain a long-term investment horizon
1,966
630
1,526
1,131
258 198
1,351
77 114 51
0
500
1,000
1,500
2,000
2,500
DHG TRA DMC IMP OPC PMC DCL SPM DHT LDP
47%
43%
29%
46%
51%
42%
30%
20%16%
13%17%
9%7% 7%
10%
16%
5% 4% 4% 4%
0%
12%
24%
36%
48%
60%
0
2
4
6
8
10
DHG TRA DMC IMP OPC PMC DCL SPM DHT LDP
VNDtrn Market cap Net sales Gross margin (%) Net margin (%)

8/11/2019 Vietnam Pharmaceutical Industry
http://slidepdf.com/reader/full/vietnam-pharmaceutical-industry 26/28
www.VPBS.com.vn Page | 2
Data as of April 2, 2014. Source: Companies ’ financial statements, Bloomberg
Stock price Sale grow th Net income grow th
Ticker Market
Capital April 2
YTD
change
52-
Week
Hi h
52-
Week
Low
FY2012 FY2013 FY09-13
CAGR FY2012 FY2013
FY09-1
CAG
VNDbn VND VND VND
DHG DHG Pharmaceutical JSC 8,824 135,000 18.4% 150,000 77,000 17.7% 20.3% 19.2% 16.9% 21.3% 13.3%TRA Traphaco JSC 2,134 86,500 2.4% 97,500 44,390 31.8% 20.1% 22.5% 31.2% 28.3% 30.8%
DMC Domesco Medical Import Export JSC 1,175 44,000 39.5% 50,500 18,667 11.3% 13.4% 7.6% 12.6% 17.7% 8.6%
IMP Imexpharm Pharmaceutical JSC 984 60,000 60.9% 72,000 29,800 5.4% 3.0% 6.3% 0.0% -21.4% -1.8%
OPC OPC Pharmaceutical JSC 807 63,000 -1.6% 75,500 56,000 23.1% 11.9% 11.0% 10.4% 0.9% 3.3%
PMC Pharmedic Pharmaceutical Medicinal 467 50,000 14.9% 52,800 27,000 14.9% 17.9% 16.5% 14.8% 25.5% 23.9%
DCL Cuu Long Pharmaceutical JSC 286 28,800 21.5% 34,700 12,800 -2.9% 14.3% 5.1% n/a 87.3% -10.8%
SPM SPM Corporation 300 21,800 -18.7% 35,800 19,000 33.5% 4.1% 15.1% 8.6% -69.8% -25.2%
DHT Hatay Pharmaceutical JSC 207 33,000 40.4% 44,000 19,100 7.5% 9.7% 5.5% -12.3% 81.8% 16.8%
LDP Lam Dong Pharmaceutical JSC 163 48,000 27.0% 63,000 30,000 19.8% 9.5% 20.8% -12.1% -8.6% 4.7%
Average 20.5% 16.2% 12.4% 13.0% 7.8% 16.3% 6.4%
Median 20.0% 16.3% 12.7% 13.1% 10.4% 19.5% 6.6%
ROA ROE FY 2013
Ticker Foreign
owned FY2012 FY2013 FY2012 FY2013
Net
sales Gross profits Net income
Cash
ratio
Current
ratio
Debt to
Equity
% % % % VNDbn VNDbn % margin VNDbn % margin % % %
DHG 49.0% 22.5% 21.8% 31.7% 32.1% 3,527 1,640 46.5% 589 16.7% 76% 217% 6% 1 4.97x 4.45
TRA 46.0% 14.2% 16.6% 35.1% 26.3% 1,682 721 42.9% 149 8.9% 77% 232% 15% 15.13x 3.12
DMC 49.0% 10.7% 11.6% 15.8% 17.8% 1,430 412 28.8% 106 7.4% 15% 184% 17% 1 1.07x 1.87
IMP 47.4% 9.2% 7.1% 10.9% 8.5% 842 391 46.4% 61 7.2% 163% 468% 0% 16.51x 1.36
OPC 16.3% 11.6% 10.9% 17.3% 16.0% 564 286 50.7% 56 10.0% 16% 177% 20% 14.40x 2.23
PMC 12.8% 27.7% 29.5% 36.1% 39.0% 357 149 41.7% 56 15.6% 133% 350% 0% 8.37x 2.94
DCL 16.2% 2.5% 5.6% 8.0% 13.3% 699 208 29.7% 36 5.1% 5% 123% 88% 7.70x 1.03SPM 5.9% 6.0% 1.7% 10.4% 2.9% 448 91 20.3% 18 3.9% 45% 298% 23% 17.15x 0.44
DHT 0.4% 4.9% 9.9% 11.7% 19.5% 743 118 15.9% 27 3.6% 27% 163% 73% 7.74x 1.58
LDP 9.3% 12.7% 10.3% 28.1% 23.6% 463 62 13.4% 18 3.9% 12% 151% 0% 9.08x 2.07
Average 12.2% 12.5% 20.5% 19.9% 1,076 408 33.6% 111 8.2% 57% 236% 24% 12.21x 2.11
Median 11.1% 10.6% 16.5% 18.6% 721 247 35.7% 56 7.3% 36% 200% 16% 12.73x 1.97
Company name
Trailing
P/B
Trailing
P/E

8/11/2019 Vietnam Pharmaceutical Industry
http://slidepdf.com/reader/full/vietnam-pharmaceutical-industry 27/28
www.VPBS.com.vn Page | 2
CONCLUSIONWe believe that Vietnam’s pharmaceutical industry holds tremendous potential fo
future growth, in spite of numerous structural weaknesses . Indeed, the country
growing population, in combination with heightened health-awareness among th
middle-class segment, should provide ample fuel for growth in the domesticonsumption of pharmaceutical products. These positive macro trends will undoubtedl
enable domestic pharmaceutical companies to remain profitable in the upcoming years
In the medium to long term, we predict that the pharmaceutical industry as a whole wi
be further consolidated, although the rate of the consolidation might be moderate
Domestic drug-makers will pursue mergers and acquisitions (M&A) as a mean t
vertically integrate their operations and to expand their distribution networks. In 201
and 2013, Traphaco JSC (TRA) had successfully purchased 43% and 49% stake in Quan
Tri Pharmaceuticals & Medical Company and Thai Nguyen Pharmaceuticals & Medica
Company, respectively, in order to increase the number of distribution centers acros
the country.
At the same time, we believe that domestic pharmaceutical companies will continue t
allocate budgets for the technical upgrades of their production facilities. These upgrade
will increase the number of domestic companies that meet WHO-GMP standards an
broaden the portfolio of products that can be manufactured domestically.
While we maintain a positive outlook with regard Vietnam’s pharmaceutical stocks (e.g
DHG, TRA and PMC), we do not deem the sector attractive enough for foreign investor
to engage in direct capital investment, at least not at the moment. We encourage foreig
pharmaceutical companies to wait for the outcome of the TPP agreements, whic
should be finalized this year, before contemplating any long-term direct investment i
Vietnam’s pharmaceutical sector.
8/11/2019 Vietnam Pharmaceutical Industry
http://slidepdf.com/reader/full/vietnam-pharmaceutical-industry 28/28
DisclaimerResearch report is prepared and issued by VPBank Securities Co. Ltd. (‚VPBS‛). This report
not directed to, or intended for distribution to or use by, any person or entity who is a citizen o
resident of or located in any locality, state, country or other jurisdiction where such distribution
publication, availability or use would be contrary to law or regulation. This document is not fo
public distribution and has been furnished to you solely for your information and must not b
reproduced or redistributed to any other person. Persons into whose possession this documen
may come are required to observe restrictions.
Each research analyst involved in the preparation of a research report is required to certify tha
the views and recommendations expressed therein accurately reflect his/her personal viewabout any and all of the securities or issuers that are the subject matter of this research repor
and no part of his/her compensation was, is and will be directly or indirectly related to specifi
recommendations or views expressed by the research analyst in the research report. Th
research analyst involved in the preparation of a research report does not have authorit
whatsoever (actual, implied or apparent) to act on behalf of any issuer mentioned in suc
research report.
Any research report is provided, for information purposes only, to institutional investor an
retail clients of VPBS. A research report is not an offer to sell or the solicitation of an offer t
buy any of the securities discussed herein.
The information contained in a research report is prepared from publicly available information
internally developed data and other sources believed to be reliable, but has not bee
independently verified by VPBS and VPBS makes no representations or warranties with respec
to the accuracy, correctness or completeness of such information and they should not be relie
upon as such. All estimates, opinions and recommendations expressed herein constitut
judgment as of the date of a research report and are subject to change without notice. VPB
does not accept any obligation to update, modify or amend a research report or to otherwis
notify a recipient of a research report in the event that any estimates, opinions an
recommendations contained herein change or subsequently becomes inaccurate or if
research report is subsequently withdrawn.
Past performance is not a guarantee of future results, and no representation or warranty
express or implied, is made regarding future performance of any security mentioned in thi
research report. The price of the securities mentioned in a research report and the income the
produce may fluctuate and/or be adversely affected by market factors or exchange rates, an
investors may realize losses on investments in such securities, including the loss of investmen
principal. Furthermore, the securities discussed in a research report may not be liqu
investments, may have a high level of volatility or may subject to additional and special risk
associated with securities and investments in emerging markets and/or foreign countries tha
may give rise to substantial risk and are not suitable for all investors. VPBS accepts no liabilit
whatsoever for any loss arising from any use or reliance on a research report or the informatiocontained herein.
The securities in a research report may not be suitable for all types of investors and suc
reports do not take into account particular investment needs, objectives and financia
circumstances of a particular investor. An investor should not rely solely on investmen
recommendations contained in this research report, if any, as a substitution for the exercise o
their own independent judgment in making an investment decision and, prior to acting on an
of contained in this research report, investors are advised to contact his/her investment advise
to discuss their particular circumstances.
VPBS and its affiliated, officers, directors and employees world-wide may, from time to tim
have long or short position in, and buy or sell the securities thereof, of company (ies
mentioned herein or be engaged in any other transaction involving such securities and ear
brokerage or other compensation or act as a market maker in the financial instruments of th
company (ies) discussed herein or act advisor or lender/borrower to such company (ies) o
have other potential conflict of interest with respect to any recommendation and relate
information and opinions.
Any reproduction or distribution in whole or in part of a research report without permission o
VPBS is prohibited.
If this research report has been distributed by electronic transmission, such as e-mail, then suc
transmission cannot be guaranteed to be secure or error-free as information could b
intercepted, corrupted, lost, destroyed, arrive late, in complete, or contain viruses. Should
research report provide web addresses of, or contain hyperlinks to, third party web sites, VPB
has not reviewed the contents of such links and takes no responsibility whatsoever for th
contents of such web site. Web addresses and/or hyperlinks are provided solely for th
recipient’s convenience and information, and the content of third party web sites is not in an
way incorporated into this research report. Recipients who choose to access such we
Barry David WeisblattHead of [email protected]
Luu Bich HongDirector - Fundamental [email protected]
Nguyen Huu Toan
Research [email protected]
Hanoi Head Office362 Hue Street,Hai Ba Trung District, Hanoi
T - +84 (0) 4 3974 3655
F - +84 (0) 4 3974 3656
Ho Chi Minh City Branch76 Le Lai Street,District 1, Ho Chi Minh City
T - +84 (0) 8 3823 8608
F - +84 (0) 8 3823 8609
Danang Branch112 Phan Chau Trinh Street,Hai Chau District, Danang
T - +84 (0) 511 356 5419
F - +84 (0) 511 356 5418


