Video-rate centimeter-range optical coherence tomography based on dual optical frequency combs by electro-optic modulators JIQIANG KANG,1 PINGPING FENG,1 BOWEN LI,1 CHI ZHANG,2 XIAOMING WEI,3 EDMUND Y. LAM,1 KEVIN K. TSIA,1 AND KENNETH K. Y. WONG1,* 1Department of Electrical and Electronic Engineering, The University of Hong Kong, Pokfulam Road, Hong Kong, China 2Wuhan National Laboratory for Optoelectronics, Huazhong University of Science and Technology, Wuhan 430074, China 3Caltech Optical Imaging Laboratory, Andrew and Peggy Cherng Department of Medical Engineering and Department of Electrical Engineering, California Institute of Technology, Pasadena, California 91125, USA *[email protected]
Abstract: Imaging speed and range are two important parameters for optical coherence tomography (OCT). A conventional video-rate centimeter-range OCT requires an optical source with hundreds of kHz repetition rate and needs the support of broadband detectors and electronics (>1 GHz). In this paper, a type of video-rate centimeter-range OCT system is proposed and demonstrated based on dual optical frequency combs by leveraging electro-optic modulators. The repetition rate difference between dual combs, i.e. the A-scan rate of dual-comb OCT, can be adjusted within 0~6 MHz. By down-converting the interference signal from optical domain to radio-frequency domain through dual comb beating, the down-converted bandwidth of the interference signal is less than 22.5 MHz which is at least two orders of magnitude lower than that in conventional OCT systems. A LabVIEW program is developed for video-rate operation, and the centimeter imaging depth is proved by using 10 pieces of 1-mm thick glass stacked as the sample. The effective beating bandwidth between two optical comb sources is 7 nm corresponding to ~108 comb lines, and the axial resolution of the dual-comb OCT is 158 µm. Dual optical frequency combs provide a promising solution to relax the detection bandwidth requirement in fast long-range OCT systems. © 2018 Optical Society of America under the terms of the OSA Open Access Publishing Agreement OCIS codes: (320.7100) Ultrafast measurements; (110.4500) Optical coherence tomography; (040.2840) Heterodyne; (250.4110) Modulators.
References and links 1. S. T. Cundiff and J. Ye, “Colloquium: Femtosecond optical frequency combs,” Rev. Mod. Phys. 75(1), 325–342
(2003). 2. S. A. Diddams, “The evolving optical frequency comb [Invited],” J. Opt. Soc. Am. B 27(11), B51–B62 (2010). 3. T. W. Hänsch, “Nobel Lecture: Passion for precision,” Rev. Mod. Phys. 78(4), 1297–1309 (2006). 4. T. Udem, R. Holzwarth, and T. W. Hänsch, “Optical frequency metrology,” Nature 416(6877), 233–237 (2002). 5. S. A. Diddams, T. Udem, J. C. Bergquist, E. A. Curtis, R. E. Drullinger, L. Hollberg, W. M. Itano, W. D. Lee, C.
W. Oates, K. R. Vogel, and D. J. Wineland, “An optical clock based on a single trapped 199Hg+ ion,” Science 293(5531), 825–828 (2001).
6. F. R. Giorgetta, I. Coddington, E. Baumann, W. C. Swann, and N. R. Newbury, “Fast high-resolution spectroscopy of dynamic continuous-wave laser sources,” Nat. Photonics 4(12), 853–857 (2010).
7. M. Drescher, M. Hentschel, R. Kienberger, G. Tempea, C. Spielmann, G. A. Reider, P. B. Corkum, and F. Krausz, “X-ray pulses approaching the attosecond frontier,” Science 291(5510), 1923–1927 (2001).
8. J. Kim and Y. Song, “Ultralow-noise mode-locked fiber lasers and frequency combs: principles, status, and applications,” Adv. Opt. Photonics 8(3), 465–540 (2016).
9. B. Bernhardt, “Dual comb spectroscopy,” Ph.D. thesis, Ludwig Maximilian University of Munich (2011). 10. S. Schiller, “Spectrometry with frequency combs,” Opt. Lett. 27(9), 766–768 (2002). 11. B. Bernhardt, A. Ozawa, P. Jacquet, M. Jacquey, Y. Kobayashi, T. Udem, R. Holzwarth, G. Guelachvili, T. W.
Hänsch, and N. Picqué, “Cavity-enhanced dual-comb spectroscopy,” Nat. Photonics 4(1), 55–57 (2010). 12. I. Coddington, N. Newbury, and W. Swann, “Dual-comb spectroscopy,” Optica 3(4), 414–426 (2016).
Vol. 26, No. 19 | 17 Sep 2018 | OPTICS EXPRESS 24928
#335986 https://doi.org/10.1364/OE.26.024928 Journal © 2018 Received 27 Jun 2018; revised 24 Aug 2018; accepted 27 Aug 2018; published 10 Sep 2018
13. G. Millot, S. Pitois, M. Yan, T. Hovhannisyan, A. Bendahmane, T. W. Hänsch, and N. Picqué, “Frequency-agile dual-comb spectroscopy,” Nat. Photonics 10(1), 27–30 (2016).
14. D. A. Long, A. J. Fleisher, K. O. Douglass, S. E. Maxwell, K. Bielska, J. T. Hodges, and D. F. Plusquellic, “Multiheterodyne spectroscopy with optical frequency combs generated from a continuous-wave laser,” Opt. Lett. 39(9), 2688–2690 (2014).
15. T. Ideguchi, S. Holzner, B. Bernhardt, G. Guelachvili, N. Picqué, and T. W. Hänsch, “Coherent Raman spectro-imaging with laser frequency combs,” Nature 502(7471), 355–358 (2013).
16. E. D. Diebold, B. W. Buckley, D. R. Gossett, and B. Jalali, “Digitally synthesized beat frequency multiplexing for sub-millisecond fluorescence microscopy,” Nat. Photonics 7(10), 806–810 (2013).
17. E. Hase, T. Minamikawa, T. Mizuno, S. Miyamoto, R. Ichikawa, Y. Hsieh, K. Shibuya, K. Sato, Y. Nakajima, A. Asahara, K. Minoshima, Y. Mizutani, T. Iwata, H. Yamamoto, and T. Yasui, “Scan-less confocal phase imaging based on dual-comb microscopy,” Optica 5(5), 634–643 (2018).
18. X. Dong, X. Zhou, J. Kang, L. Chen, Z. Lei, C. Zhang, K. K. Y. Wong, and X. Zhang, “Ultrafast time-stretch microscopy based on dual-comb asynchronous optical sampling,” Opt. Lett. 43(9), 2118–2121 (2018).
19. C. Wang, Z. Deng, C. Gu, Y. Liu, D. Luo, Z. Zhu, W. Li, and H. Zeng, “Line-scan spectrum-encoded imaging by dual-comb interferometry,” Opt. Lett. 43(7), 1606–1609 (2018).
20. I. Coddington, W. C. Swann, L. Nenadovic, and N. R. Newbury, “Rapid and precise absolute distance measurements at long range,” Nat. Photonics 3(6), 351–356 (2009).
21. M. G. Suh and K. J. Vahala, “Soliton microcomb range measurement,” Science 359(6378), 884–887 (2018). 22. P. Trocha, M. Karpov, D. Ganin, M. H. P. Pfeiffer, A. Kordts, S. Wolf, J. Krockenberger, P. Marin-Palomo, C.
Weimann, S. Randel, W. Freude, T. J. Kippenberg, and C. Koos, “Ultrafast optical ranging using microresonator soliton frequency combs,” Science 359(6378), 887–891 (2018).
23. Z. He and K. Hotate, “Synthesized optical coherence tomography for imaging of scattering objects by use of a stepwise frequency-modulated tunable laser diode,” Opt. Lett. 24(21), 1502–1504 (1999).
24. S. Kray, F. Spöler, T. Hellerer, and H. Kurz, “Electronically controlled coherent linear optical sampling for optical coherence tomography,” Opt. Express 18(10), 9976–9990 (2010).
25. S. Kray, F. Spöler, M. Först, and H. Kurz, “Dual femtosecond laser multiheterodyne optical coherence tomography,” Opt. Lett. 33(18), 2092–2094 (2008).
26. S. Lee, B. Widiyatmoko, M. Kourogi, and M. Ohtsu, “Ultrahigh scanning speed optical coherence tomography using optical frequency comb generators,” Jpn. J. Appl. Phys. 40, L878–L880 (2001).
27. D. Huang, E. A. Swanson, C. P. Lin, J. S. Schuman, W. G. Stinson, W. Chang, M. R. Hee, T. Flotte, K. Gregory, C. A. Puliafito, and J. G. Fujimoto, “Optical Coherence Tomography,” Science 254(5035), 1178–1181 (1991).
28. A. F. Fercher, “Optical coherence tomography,” J. Biomed. Opt. 1(2), 157–173 (1996). 29. W. Drexler and J. G. Fujimoto, Optical coherence tomography: technology and applications, 2nd ed. (Springer,
2008). 30. W. Wieser, W. Draxinger, T. Klein, S. Karpf, T. Pfeiffer, and R. Huber, “High definition live 3D-OCT in vivo:
design and evaluation of a 4D OCT engine with 1 GVoxel/s,” Biomed. Opt. Express 5(9), 2963–2977 (2014). 31. A. E. Desjardins, B. J. Vakoc, M. J. Suter, S. H. Yun, G. J. Tearney, and B. E. Bouma, “Real-Time FPGA
Processing for High-Speed Optical Frequency Domain Imaging,” IEEE Trans. Med. Imaging 28(9), 1468–1472 (2009).
32. Z. Wang, B. Potsaid, L. Chen, C. Doerr, H. C. Lee, T. Nielson, V. Jayaraman, A. E. Cable, E. Swanson, and J. G. Fujimoto, “Cubic meter volume optical coherence tomography,” Optica 3(12), 1496–1503 (2016).
33. H. Murata, A. Morimoto, T. Kobayashi, and S. Yamamoto, “Optical pulse generation by electrooptic-modulation method and its application to integrated ultrashort pulse generators,” IEEE J. Sel. Top. Quantum Electron. 6(6), 1325–1331 (2000).
34. V. Torres-Company, J. Lancis, and P. Andrés, “Lossless equalization of frequency combs,” Opt. Lett. 33(16), 1822–1824 (2008).
35. R. Wu, V. R. Supradeepa, C. M. Long, D. E. Leaird, and A. M. Weiner, “Generation of very flat optical frequency combs from continuous-wave lasers using cascaded intensity and phase modulators driven by tailored radio frequency waveforms,” Opt. Lett. 35(19), 3234–3236 (2010).
36. N. Yokota, K. Abe, S. Mieda, and H. Yasaka, “Harmonic superposition for tailored optical frequency comb generation by a Mach-Zehnder modulator,” Opt. Lett. 41(5), 1026–1029 (2016).
37. V. Durán, P. A. Andrekson, and V. Torres-Company, “Electro-optic dual-comb interferometry over 40 nm bandwidth,” Opt. Lett. 41(18), 4190–4193 (2016).
38. M. Yan, P. Luo, K. Iwakuni, G. Millot, T. W. Hänsch, and N. Picqué, “Mid-infrared dual-comb spectroscopy with electro-optic modulators,” Light Sci. Appl. 6(10), e17076 (2017).
39. Z. Tong, A. O. J. Wiberg, E. Myslivets, B. P. P. Kuo, N. Alic, and S. Radic, “Spectral linewidth preservation in parametric frequency combs seeded by dual pumps,” Opt. Express 20(16), 17610–17619 (2012).
40. A. Ishizawa, T. Nishikawa, A. Mizutori, H. Takara, A. Takada, T. Sogawa, and M. Koga, “Phase-noise characteristics of a 25-GHz-spaced optical frequency comb based on a phase- and intensity-modulated laser,” Opt. Express 21(24), 29186–29194 (2013).
41. V. Ataie, E. Myslivets, B. P. P. Kuo, N. Alic, and S. Radic, “Spectrally equalized frequency comb generation in multistage parametric mixer with nonlinear pulse shaping,” J. Lightwave Technol. 32(4), 840–846 (2014).
42. N. J. Doran and D. Wood, “Nonlinear-optical loop mirror,” Opt. Lett. 13(1), 56–58 (1988).
Vol. 26, No. 19 | 17 Sep 2018 | OPTICS EXPRESS 24929
43. M. E. Fermann, F. Haberl, M. Hofer, and H. Hochreiter, “Nonlinear amplifying loop mirror,” Opt. Lett. 15(13), 752–754 (1990).
44. B. H. Kolner, “Space-time duality and the theory of temporal imaging,” IEEE J. Quantum Electron. 30(8), 1951–1963 (1994).
45. E. Myslivets, B. P. P. Kuo, N. Alic, and S. Radic, “Generation of wideband frequency combs by continuous-wave seeding of multistage mixers with synthesized dispersion,” Opt. Express 20(3), 3331–3344 (2012).
46. J. Kang, X. Wei, B. Li, X. Wang, L. Yu, S. Tan, C. Jinata, and K. K. Y. Wong, “Sensitivity enhancement in swept-source optical coherence tomography by parametric balanced detector and amplifier,” Biomed. Opt. Express 7(4), 1294–1304 (2016).
47. J. Kang, P. Feng, X. Wei, E. Y. Lam, K. K. Tsia, and K. K. Y. Wong, “102-nm, 44.5-MHz inertial-free swept source by mode-locked fiber laser and time stretch technique for optical coherence tomography,” Opt. Express 26(4), 4370–4381 (2018).
48. R. H. Wilson, K. P. Nadeau, F. B. Jaworski, B. J. Tromberg, and A. J. Durkin, “Review of short-wave infrared spectroscopy and imaging methods for biological tissue characterization,” J. Biomed. Opt. 20(3), 030901 (2015).
49. P. Feng, J. Kang, S. Tan, X. Zhou, C. Zhang, and K. K. Y. Wong, “Dual-comb spectrally encoded confocal microscopy,” in Conference on Lasers and Electro-Optics (Optical Society of America, 2018), paper JTh2A.148.
50. K. C. Cossel, E. M. Waxman, F. R. Giorgetta, M. Cermak, I. R. Coddington, D. Hesselius, S. Ruben, W. C. Swann, G. W. Truong, G. B. Rieker, and N. R. Newbury, “Open-path dual comb spectroscopy to an airborne retroreflector,” Optica 4(7), 724–728 (2017).
51. D. R. Carlson, D. D. Hickstein, D. C. Cole, S. A. Diddams, and S. B. Papp, “Dual-comb interferometry via repetition rate switching of a single frequency comb,” Opt. Lett. 43(15), 3614–3617 (2018).
1. Introduction Optical frequency comb is a powerful tool which activated a variety of frontier researches, such as optical frequency metrology, optical atomic clock, optical frequency synthesizer, and attosecond science, etc [1–8]. When two sets of optical frequency combs (comb 1 & 2) with slight repetition rate difference mix in a photodetector (PD), dual combs will beat with each other. Dual comb beating can be described in spectral and time domain, respectively [9]. In spectral domain, assume the frequency of nth comb line in comb 1 & 2 are fn,1 and fn,2 which can be further expressed as fn,1 = f0,1 + nfrep,1 and fn,2 = f0,2 + nfrep,2. Here, f0,1 and f0,2 are the frequency offset of comb1 & 2 which are determined by phase slippage between carrier and envelope, and frep,1 and frep,2 are repetition rate of comb 1 & 2. When two combs mix, the nth comb line in comb 1 & 2 will beat with each other to generate a radio-frequency (RF) tone with frequency of fRF = fn,1-fn,2 = [f0,1-f0,2] + nδ, where δ is the repetition rate difference, i.e. frep,1-frep,2 = δ. To avoid aliasing, δ are normally well selected to ensure the down-converted RF bandwidth (i.e. Δv) fit Δv<frep/2, and a low pass filter is normally used to filter out those RF frequencies out of Δv. In time domain, a burst will be generated when pulses from comb 1 & 2 arrive at the photodiode at the same time. Because of slight repetition rate difference δ, the burst will appear in a period of 1/δ. By using a low pass filter to block frequencies of frep,1 and frep,2, a pulse train with period of 1/δ can be obtained. Similar to optical sampling oscilloscope, dual comb beating down converts optical frequencies into RF domain, and it makes measurement with much narrower band detectors and electronics achievable. This advantage renders dual comb very promising in a variety of applications, such as in spectroscopy [10–14], nonlinear and linear microscope [15–19], range measurement [20–22], and optical coherence tomography (OCT) [23–26], etc.
OCT is a well-recognized label-free optical imaging modality for multi-dimensional tissue architecture visualization with micrometer-scale axial resolution [27]. Currently, two major types of OCT systems are developed, i.e. time-domain OCT (TD-OCT) and Fourier-domain OCT (FD-OCT). In TD-OCT, different sample layers are represented by bursts directly in time domain [28]. A burst appears when pulses reflected from sample and reference mirror arrive at a PD at the same time. Therefore, to get a cross-sectional or axial-scan (A-scan) image of the sample, the reference mirror has to scan periodically. The mechanical scanning speed and range determine the A-scan rate (several kHz) and imaging depth (<3 mm) of TD-OCT [28]. In FD-OCT, an interference fringe will be encoded in optical spectrum, and an A-scan image can be reconstructed by conducting Fourier transform to this interference fringe
Vol. 26, No. 19 | 17 Sep 2018 | OPTICS EXPRESS 24930
[29]. According to different spectrum detection methods, FD-OCT has two sub-implementations, i.e. spectral domain OCT (SD-OCT) and swept source OCT (SS-OCT). A comprehensive review on the principles and performance of SD- and SS-OCT are covered in [29]. Briefly, the density of the interference fringe grows monotonically with the imaging depth. Therefore, a high resolution camera (for SD-OCT) or broadband PD (for SS-OCT) should be equipped to resolve the dense interference fringes for large imaging depth. Consequently, these broadband electronics should be supported by a high performance computational platform, such as graphics processing unit (GPU) or field-programmable gate array (FPGA), to process massive data in real time for video-rate imaging [30–32]. Broadband detectors and high performance calculation platform increase system cost, and thus it is essential to develop a detection bandwidth reduction method for fast long-range OCT systems.
Dual-comb beating is a promising solution to relax detection bandwidth requirement by optical sampling and will not sacrifice imaging speed at the same time. Dual comb OCT (DC-OCT) has similar interferogram with TD-OCT, and no reference mirror and Fourier transform are needed anymore. Different layers underneath the sample surface reflect the pulses from the probe comb with different time delay, which equals to generate several virtual optical comb sources with different time offset. When those virtual combs beat with the second comb which is served as a local oscillator (LO), a series of bursts with certain time offset will be generated, and those bursts reflect the layer structure of the sample. The A-scan rate of DC-OCT determines by δ (a high δ supports high imaging speed), and the imaging depth is inversely related to the frep of the probe comb [24].
Several types of DC-OCT have been proposed based on different comb sources, such as fiber mode-locked laser [24], solid state mode-locked laser [25], and Fabry-Perot cavity with electro-optic (EO) modulator [26], etc. Mode-locked lasers provide an ultrastable comb solution since f0 and frep can be phase locked to an ultrastable RF sources [1]. Ultrastable combs ensure broadband mutual coherence in dual comb arrangement, which paves the way for high resolution DC-OCT. The repetition rate difference δ of a mode-locked laser based dual-comb system is normally at several kHz level because of large amount of modes (millions) and relative narrow mode spacing (normally in hundreds of MHz level) [8, 24, 25]. Several kHz δ is not high enough for a video-rate DC-OCT. EO modulator based frequency comb provides another important approach for comb generation [33–36]. The mode spacing of EO comb is determined by the driving frequency of RF signal imparted on EO modulators, and it can achieve tens of GHz with commercial components, and thus multi-MHz δ is feasible [37, 38]. Different with mode-locked laser combs, optical frequencies of EO combs are hard to be locked, which will cause coherence degeneration at high order comb lines because of accumulated phase noise [39, 40]. Coherence degeneration limits the mutual coherence performance in dual-comb system and thus reduces the number of effective beating comb lines (i.e. reduce optical bandwidth), thereby reducing the axial resolution of DC-OCT. However, its high repetition rate is very attractive for building a larger δ dual-comb system for video-rate DC-OCT with centimeter level imaging depth. In previous Fabry-Perot (FP) cavity-based EO comb scheme, the repetition rate was determined by the driving frequency imparted on EO devices as well as the FP cavity [26]. To flexibly adjust repetition rate, the FP cavity can be removed to construct a type of cavity-less dual comb system with EO modulators.
In this paper, a type of video-rate (> 24 frames/second) DC-OCT with centimeter imaging depth was proposed and demonstrated based on cavity-less EO combs. Different with the prevalent cavity-less dual EO combs generation schemes [37, 38], i.e. an acousto-optic modulator (AOM) was normally used at one of the dual combs to shift the center wavelength and the spectrum of the dual combs were broaden by the same spool of highly-nonlinear fiber (HNLF), the comb generation scheme in this paper has similar architecture with reference [41]. A continuous-wave (CW) source together with an intensity modulator (IM) and a low
Vol. 26, No. 19 | 17 Sep 2018 | OPTICS EXPRESS 24931
Vπ phase modulator were used to construct an EO comb generator. The pulses after EO comb were compressed further by a nonlinear optical loop mirror (NOLM) and a nonlinear amplified loop mirror (NALM) for spectrum broadening and high peak power operation [42, 43].
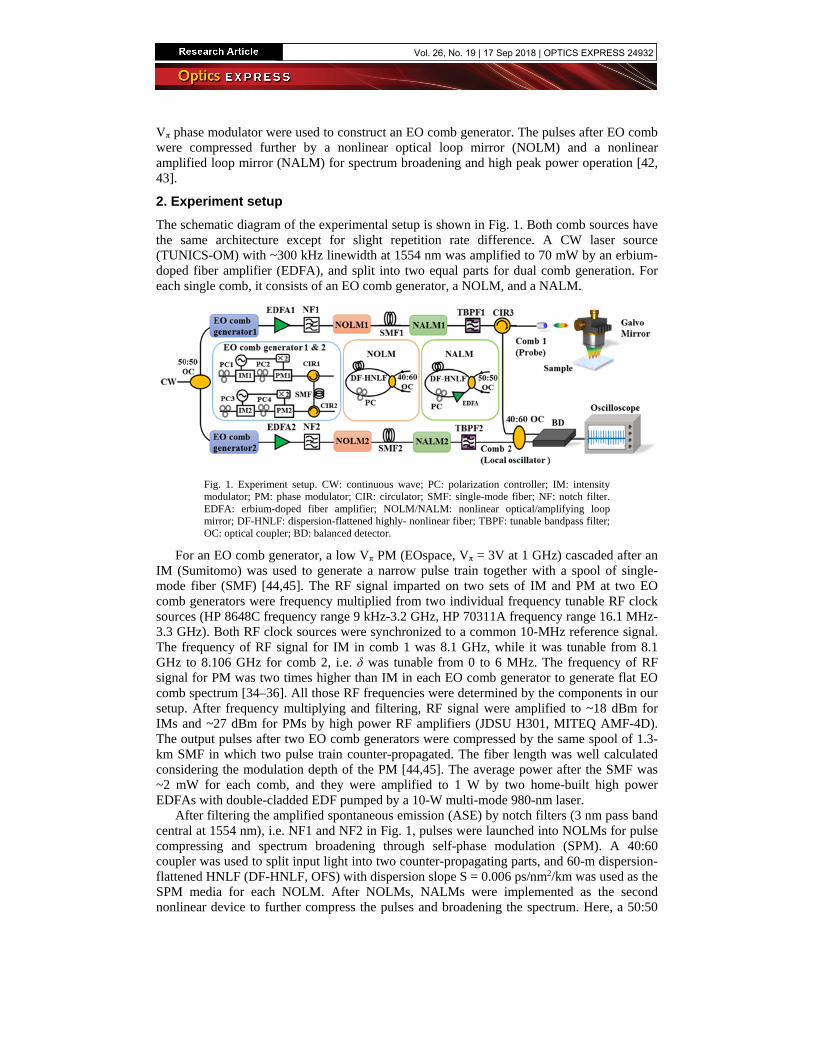
2. Experiment setup The schematic diagram of the experimental setup is shown in Fig. 1. Both comb sources have the same architecture except for slight repetition rate difference. A CW laser source (TUNICS-OM) with ~300 kHz linewidth at 1554 nm was amplified to 70 mW by an erbium-doped fiber amplifier (EDFA), and split into two equal parts for dual comb generation. For each single comb, it consists of an EO comb generator, a NOLM, and a NALM.
Fig. 1. Experiment setup. CW: continuous wave; PC: polarization controller; IM: intensity modulator; PM: phase modulator; CIR: circulator; SMF: single-mode fiber; NF: notch filter. EDFA: erbium-doped fiber amplifier; NOLM/NALM: nonlinear optical/amplifying loop mirror; DF-HNLF: dispersion-flattened highly- nonlinear fiber; TBPF: tunable bandpass filter; OC: optical coupler; BD: balanced detector.
For an EO comb generator, a low Vπ PM (EOspace, Vπ = 3V at 1 GHz) cascaded after an IM (Sumitomo) was used to generate a narrow pulse train together with a spool of single-mode fiber (SMF) [44,45]. The RF signal imparted on two sets of IM and PM at two EO comb generators were frequency multiplied from two individual frequency tunable RF clock sources (HP 8648C frequency range 9 kHz-3.2 GHz, HP 70311A frequency range 16.1 MHz-3.3 GHz). Both RF clock sources were synchronized to a common 10-MHz reference signal. The frequency of RF signal for IM in comb 1 was 8.1 GHz, while it was tunable from 8.1 GHz to 8.106 GHz for comb 2, i.e. δ was tunable from 0 to 6 MHz. The frequency of RF signal for PM was two times higher than IM in each EO comb generator to generate flat EO comb spectrum [34–36]. All those RF frequencies were determined by the components in our setup. After frequency multiplying and filtering, RF signal were amplified to ~18 dBm for IMs and ~27 dBm for PMs by high power RF amplifiers (JDSU H301, MITEQ AMF-4D). The output pulses after two EO comb generators were compressed by the same spool of 1.3-km SMF in which two pulse train counter-propagated. The fiber length was well calculated considering the modulation depth of the PM [44,45]. The average power after the SMF was ~2 mW for each comb, and they were amplified to 1 W by two home-built high power EDFAs with double-cladded EDF pumped by a 10-W multi-mode 980-nm laser.
After filtering the amplified spontaneous emission (ASE) by notch filters (3 nm pass band central at 1554 nm), i.e. NF1 and NF2 in Fig. 1, pulses were launched into NOLMs for pulse compressing and spectrum broadening through self-phase modulation (SPM). A 40:60 coupler was used to split input light into two counter-propagating parts, and 60-m dispersion-flattened HNLF (DF-HNLF, OFS) with dispersion slope S = 0.006 ps/nm2/km was used as the SPM media for each NOLM. After NOLMs, NALMs were implemented as the second nonlinear device to further compress the pulses and broadening the spectrum. Here, a 50:50
Vol. 26, No. 19 | 17 Sep 2018 | OPTICS EXPRESS 24932
coupler was used to split input light into two counter-propagating parts, and 40-m DF-HNLF was used as the SPM media. 2.5 m EDF pumped by a 980-nm laser diode was inserted into each NALM as the gain media. An in-line polarization controller (PC) was inserted into each NOLM and NALM for polarization manipulation.
In dual comb beating and imaging part, 7-nm optical spectrum (1554.1 nm-1561.1 nm) after each NALM was filtered out by two free-space tunable filters (Alnair BVF-100) to ensure good mutual coherence, and the power after each filter is ~7 mW. After filtering, one comb (probe) was launched into a sample arm consisted of a collimator, a galvo mirror, and a scanning lens (LSM03, Thorlabs). The effective focal length of the scanning lens is 36 mm and its aperture is 4 mm corresponding to 17 µm focal point size [46,47]. The back reflected light from the sample would beat with the other comb (LO) when they were combined in a 50:50 coupler. The interferogram was detected by a balanced detector (BD, Thorlabs PDB480C-AC). A high speed oscilloscope (Lecroy SDA 820Zi-B) with built-in MATLAB was used to analyze the interferogram and verify the algorithm for imaging. Subsequently, the algorithm was transplanted into LabVIEW platform for video-rate imaging, and the interferogram was digitized by a data acquisition card (Alazar Tech, ATS 460). In addition, it is worthwhile to note that averaging is normally conducted in dual comb system to enhance detection sensitivity, while no averaging was conducted in our experiment to avoid sacrificing the imaging speed.
3. Results and discussion 3.1 Single comb performance
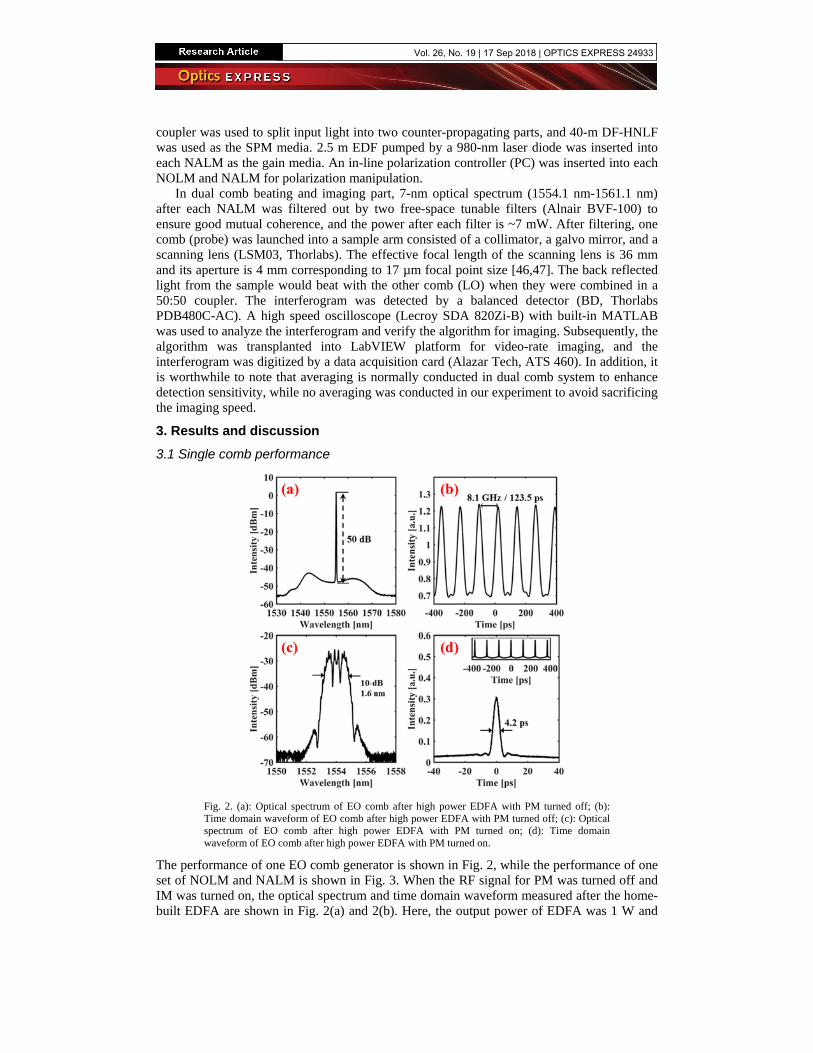
Fig. 2. (a): Optical spectrum of EO comb after high power EDFA with PM turned off; (b): Time domain waveform of EO comb after high power EDFA with PM turned off; (c): Optical spectrum of EO comb after high power EDFA with PM turned on; (d): Time domain waveform of EO comb after high power EDFA with PM turned on.
The performance of one EO comb generator is shown in Fig. 2, while the performance of one set of NOLM and NALM is shown in Fig. 3. When the RF signal for PM was turned off and IM was turned on, the optical spectrum and time domain waveform measured after the home-built EDFA are shown in Fig. 2(a) and 2(b). Here, the output power of EDFA was 1 W and
Vol. 26, No. 19 | 17 Sep 2018 | OPTICS EXPRESS 24933
1% of the power was coupled out by a 1:99 coupler for measurement, and the optical spectrum was measured by an optical spectrum analyzer (OSA, Yokogawa AQ6375) and time domain waveform was measured by a high speed oscilloscope (Lecroy SDA 820Zi-B) and a 10-GHz PD (HP 11982A). From Fig. 2(a), the home-built EDFA can amplify the ~2 mW signal after EO comb generator to 1 W effectively with ~50 dB optical signal-to-noise ratio (OSNR). The pulse train had 8.1 GHz repetition rate which was determined by the RF frequency imparted on IM. When RF signal for PM was turned on, the optical spectrum was broadened to 1.6 nm (10 dB-bandwidth), i.e. 24 comb lines were generated, as shown in Fig. 2(c). The spectrum broaden amount depends on the RF power and Vπ of the PM [33]. The single pulse shape measured by an optical sampling oscilloscope (Alnair labs EYE-1000C) with 500 GHz bandwidth is shown in Fig. 2(d), and the corresponding pulse train was shown in the inset of Fig. 2(d). The PM and 1.3-km SMF form a time lens which compressed the pulses effectively to 4.2 ps [44].
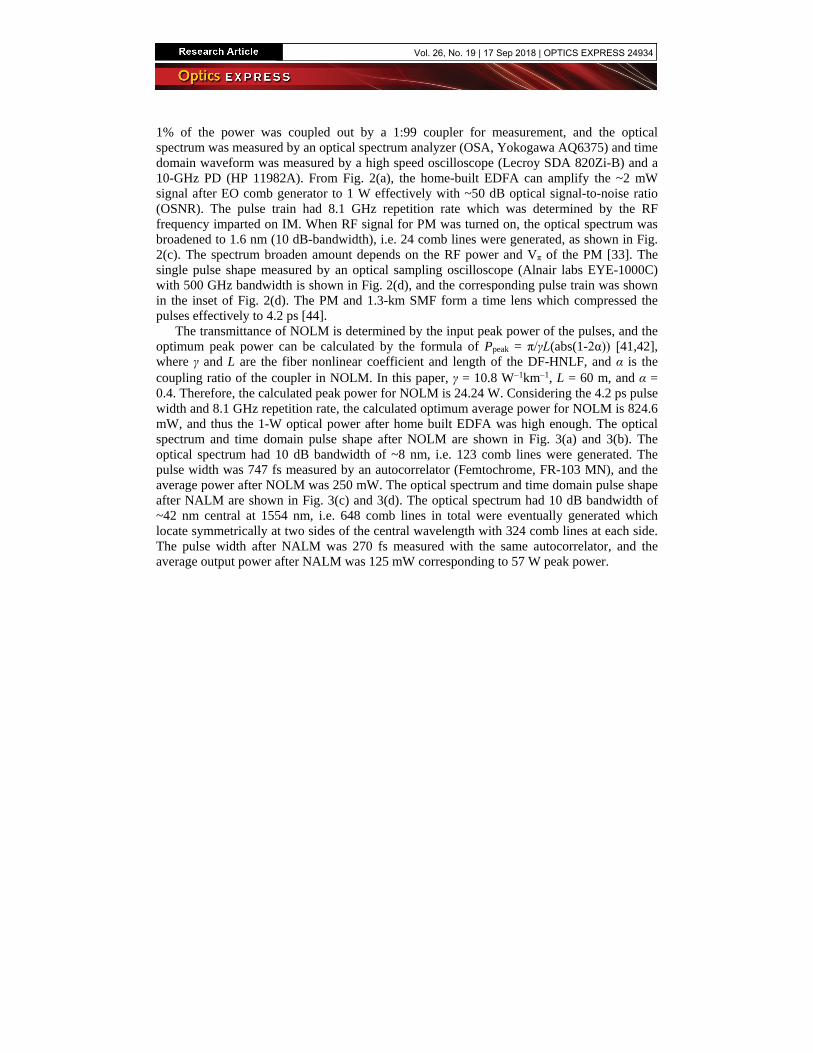
The transmittance of NOLM is determined by the input peak power of the pulses, and the optimum peak power can be calculated by the formula of Ppeak = π/γL(abs(1-2α)) [41,42], where γ and L are the fiber nonlinear coefficient and length of the DF-HNLF, and α is the coupling ratio of the coupler in NOLM. In this paper, γ = 10.8 W−1km−1, L = 60 m, and α = 0.4. Therefore, the calculated peak power for NOLM is 24.24 W. Considering the 4.2 ps pulse width and 8.1 GHz repetition rate, the calculated optimum average power for NOLM is 824.6 mW, and thus the 1-W optical power after home built EDFA was high enough. The optical spectrum and time domain pulse shape after NOLM are shown in Fig. 3(a) and 3(b). The optical spectrum had 10 dB bandwidth of ~8 nm, i.e. 123 comb lines were generated. The pulse width was 747 fs measured by an autocorrelator (Femtochrome, FR-103 MN), and the average power after NOLM was 250 mW. The optical spectrum and time domain pulse shape after NALM are shown in Fig. 3(c) and 3(d). The optical spectrum had 10 dB bandwidth of ~42 nm central at 1554 nm, i.e. 648 comb lines in total were eventually generated which locate symmetrically at two sides of the central wavelength with 324 comb lines at each side. The pulse width after NALM was 270 fs measured with the same autocorrelator, and the average output power after NALM was 125 mW corresponding to 57 W peak power.
Vol. 26, No. 19 | 17 Sep 2018 | OPTICS EXPRESS 24934
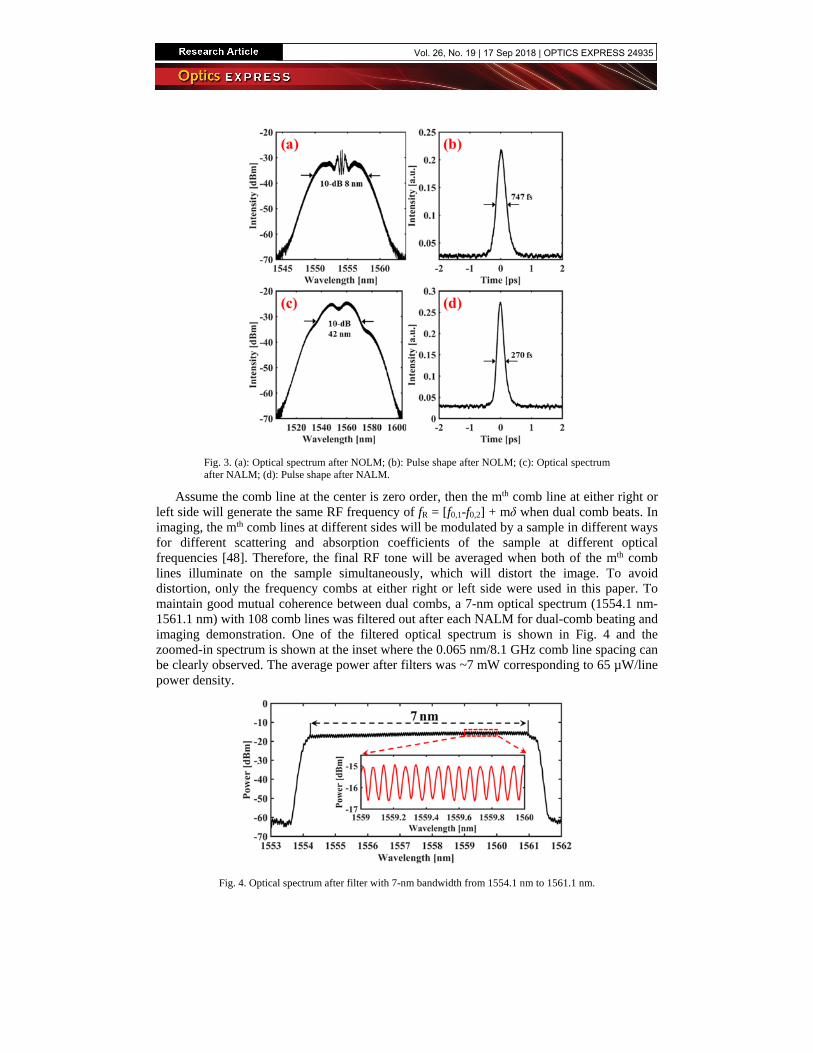
Fig. 3. (a): Optical spectrum after NOLM; (b): Pulse shape after NOLM; (c): Optical spectrum after NALM; (d): Pulse shape after NALM.
Assume the comb line at the center is zero order, then the mth comb line at either right or left side will generate the same RF frequency of fR = [f0,1-f0,2] + mδ when dual comb beats. In imaging, the mth comb lines at different sides will be modulated by a sample in different ways for different scattering and absorption coefficients of the sample at different optical frequencies [48]. Therefore, the final RF tone will be averaged when both of the mth comb lines illuminate on the sample simultaneously, which will distort the image. To avoid distortion, only the frequency combs at either right or left side were used in this paper. To maintain good mutual coherence between dual combs, a 7-nm optical spectrum (1554.1 nm-1561.1 nm) with 108 comb lines was filtered out after each NALM for dual-comb beating and imaging demonstration. One of the filtered optical spectrum is shown in Fig. 4 and the zoomed-in spectrum is shown at the inset where the 0.065 nm/8.1 GHz comb line spacing can be clearly observed. The average power after filters was ~7 mW corresponding to 65 µW/line power density.
Fig. 4. Optical spectrum after filter with 7-nm bandwidth from 1554.1 nm to 1561.1 nm.
Vol. 26, No. 19 | 17 Sep 2018 | OPTICS EXPRESS 24935
3.2 dual comb beating and imaging results
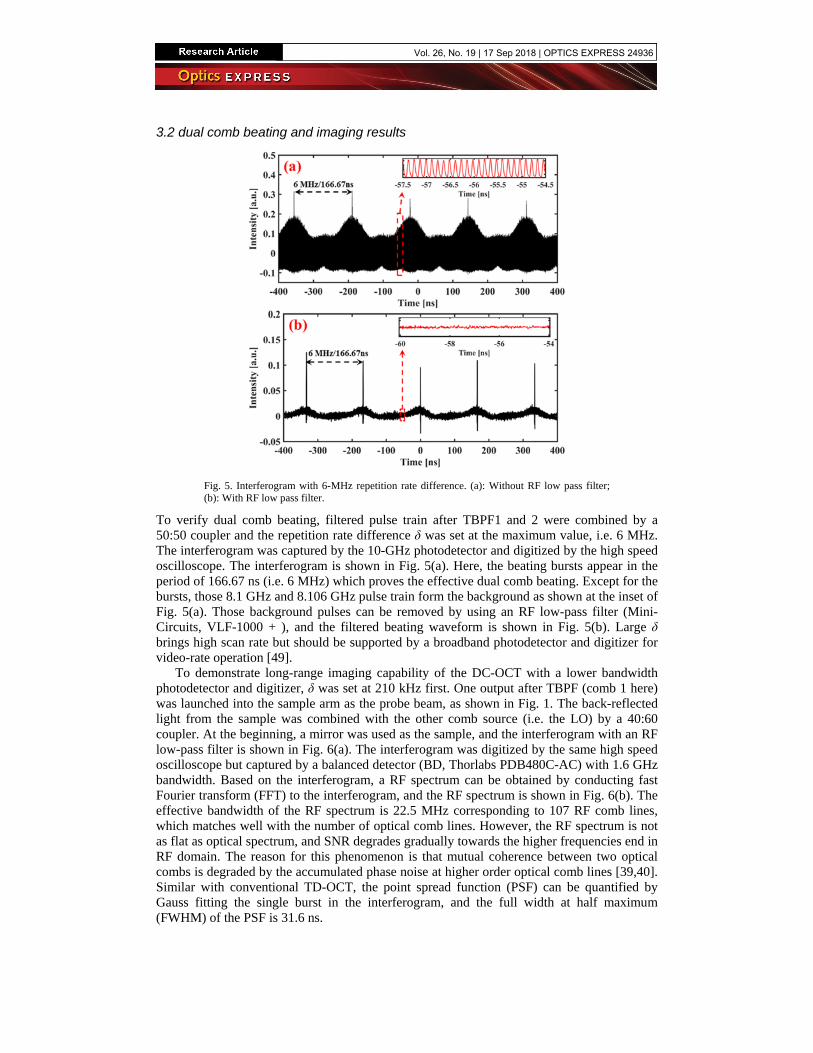
Fig. 5. Interferogram with 6-MHz repetition rate difference. (a): Without RF low pass filter; (b): With RF low pass filter.
To verify dual comb beating, filtered pulse train after TBPF1 and 2 were combined by a 50:50 coupler and the repetition rate difference δ was set at the maximum value, i.e. 6 MHz. The interferogram was captured by the 10-GHz photodetector and digitized by the high speed oscilloscope. The interferogram is shown in Fig. 5(a). Here, the beating bursts appear in the period of 166.67 ns (i.e. 6 MHz) which proves the effective dual comb beating. Except for the bursts, those 8.1 GHz and 8.106 GHz pulse train form the background as shown at the inset of Fig. 5(a). Those background pulses can be removed by using an RF low-pass filter (Mini-Circuits, VLF-1000 + ), and the filtered beating waveform is shown in Fig. 5(b). Large δ brings high scan rate but should be supported by a broadband photodetector and digitizer for video-rate operation [49].
To demonstrate long-range imaging capability of the DC-OCT with a lower bandwidth photodetector and digitizer, δ was set at 210 kHz first. One output after TBPF (comb 1 here) was launched into the sample arm as the probe beam, as shown in Fig. 1. The back-reflected light from the sample was combined with the other comb source (i.e. the LO) by a 40:60 coupler. At the beginning, a mirror was used as the sample, and the interferogram with an RF low-pass filter is shown in Fig. 6(a). The interferogram was digitized by the same high speed oscilloscope but captured by a balanced detector (BD, Thorlabs PDB480C-AC) with 1.6 GHz bandwidth. Based on the interferogram, a RF spectrum can be obtained by conducting fast Fourier transform (FFT) to the interferogram, and the RF spectrum is shown in Fig. 6(b). The effective bandwidth of the RF spectrum is 22.5 MHz corresponding to 107 RF comb lines, which matches well with the number of optical comb lines. However, the RF spectrum is not as flat as optical spectrum, and SNR degrades gradually towards the higher frequencies end in RF domain. The reason for this phenomenon is that mutual coherence between two optical combs is degraded by the accumulated phase noise at higher order optical comb lines [39,40]. Similar with conventional TD-OCT, the point spread function (PSF) can be quantified by Gauss fitting the single burst in the interferogram, and the full width at half maximum (FWHM) of the PSF is 31.6 ns.
Vol. 26, No. 19 | 17 Sep 2018 | OPTICS EXPRESS 24936
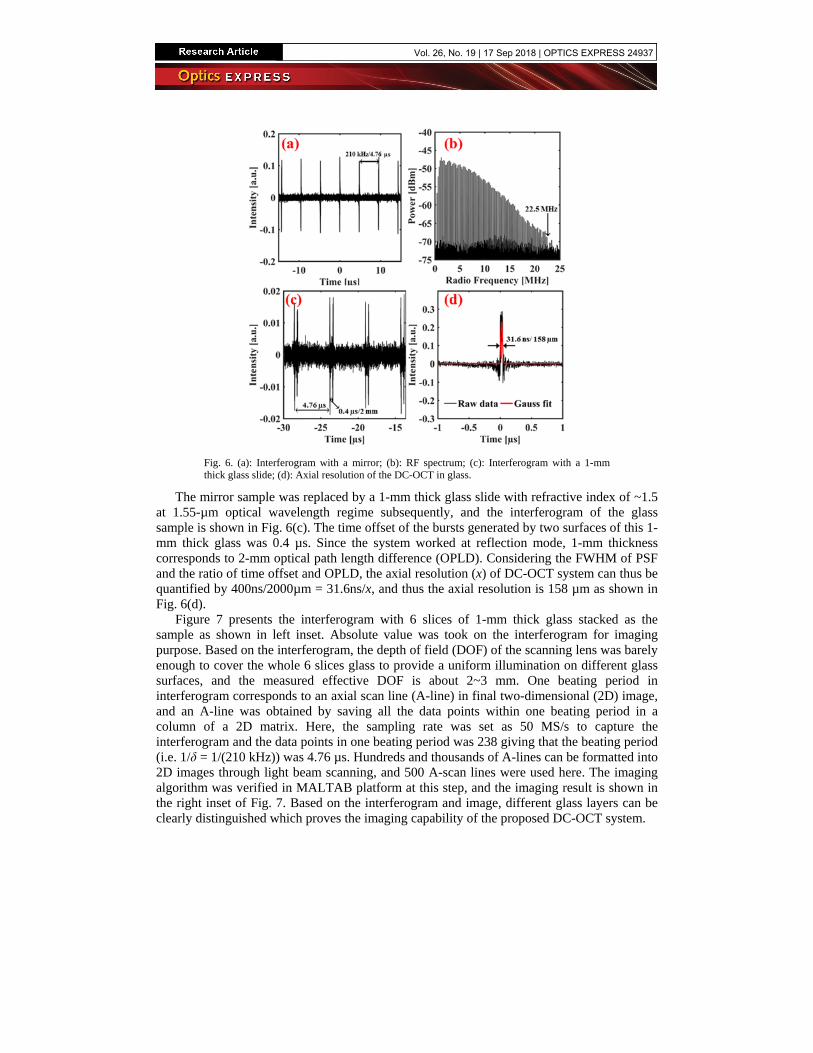
Fig. 6. (a): Interferogram with a mirror; (b): RF spectrum; (c): Interferogram with a 1-mm thick glass slide; (d): Axial resolution of the DC-OCT in glass.
The mirror sample was replaced by a 1-mm thick glass slide with refractive index of ~1.5 at 1.55-µm optical wavelength regime subsequently, and the interferogram of the glass sample is shown in Fig. 6(c). The time offset of the bursts generated by two surfaces of this 1-mm thick glass was 0.4 µs. Since the system worked at reflection mode, 1-mm thickness corresponds to 2-mm optical path length difference (OPLD). Considering the FWHM of PSF and the ratio of time offset and OPLD, the axial resolution (x) of DC-OCT system can thus be quantified by 400ns/2000µm = 31.6ns/x, and thus the axial resolution is 158 µm as shown in Fig. 6(d).
Figure 7 presents the interferogram with 6 slices of 1-mm thick glass stacked as the sample as shown in left inset. Absolute value was took on the interferogram for imaging purpose. Based on the interferogram, the depth of field (DOF) of the scanning lens was barely enough to cover the whole 6 slices glass to provide a uniform illumination on different glass surfaces, and the measured effective DOF is about 2~3 mm. One beating period in interferogram corresponds to an axial scan line (A-line) in final two-dimensional (2D) image, and an A-line was obtained by saving all the data points within one beating period in a column of a 2D matrix. Here, the sampling rate was set as 50 MS/s to capture the interferogram and the data points in one beating period was 238 giving that the beating period (i.e. 1/δ = 1/(210 kHz)) was 4.76 µs. Hundreds and thousands of A-lines can be formatted into 2D images through light beam scanning, and 500 A-scan lines were used here. The imaging algorithm was verified in MALTAB platform at this step, and the imaging result is shown in the right inset of Fig. 7. Based on the interferogram and image, different glass layers can be clearly distinguished which proves the imaging capability of the proposed DC-OCT system.
Vol. 26, No. 19 | 17 Sep 2018 | OPTICS EXPRESS 24937
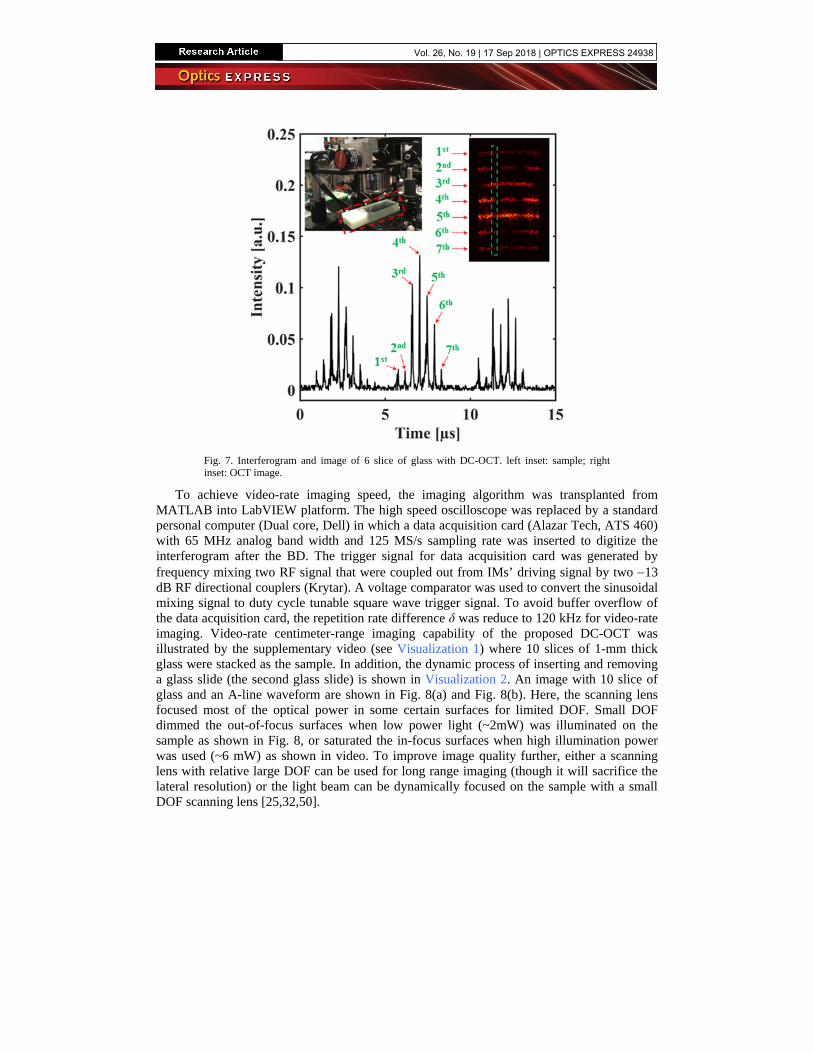
Fig. 7. Interferogram and image of 6 slice of glass with DC-OCT. left inset: sample; right inset: OCT image.
To achieve video-rate imaging speed, the imaging algorithm was transplanted from MATLAB into LabVIEW platform. The high speed oscilloscope was replaced by a standard personal computer (Dual core, Dell) in which a data acquisition card (Alazar Tech, ATS 460) with 65 MHz analog band width and 125 MS/s sampling rate was inserted to digitize the interferogram after the BD. The trigger signal for data acquisition card was generated by frequency mixing two RF signal that were coupled out from IMs’ driving signal by two −13 dB RF directional couplers (Krytar). A voltage comparator was used to convert the sinusoidal mixing signal to duty cycle tunable square wave trigger signal. To avoid buffer overflow of the data acquisition card, the repetition rate difference δ was reduce to 120 kHz for video-rate imaging. Video-rate centimeter-range imaging capability of the proposed DC-OCT was illustrated by the supplementary video (see Visualization 1) where 10 slices of 1-mm thick glass were stacked as the sample. In addition, the dynamic process of inserting and removing a glass slide (the second glass slide) is shown in Visualization 2. An image with 10 slice of glass and an A-line waveform are shown in Fig. 8(a) and Fig. 8(b). Here, the scanning lens focused most of the optical power in some certain surfaces for limited DOF. Small DOF dimmed the out-of-focus surfaces when low power light (~2mW) was illuminated on the sample as shown in Fig. 8, or saturated the in-focus surfaces when high illumination power was used (~6 mW) as shown in video. To improve image quality further, either a scanning lens with relative large DOF can be used for long range imaging (though it will sacrifice the lateral resolution) or the light beam can be dynamically focused on the sample with a small DOF scanning lens [25,32,50].
Vol. 26, No. 19 | 17 Sep 2018 | OPTICS EXPRESS 24938
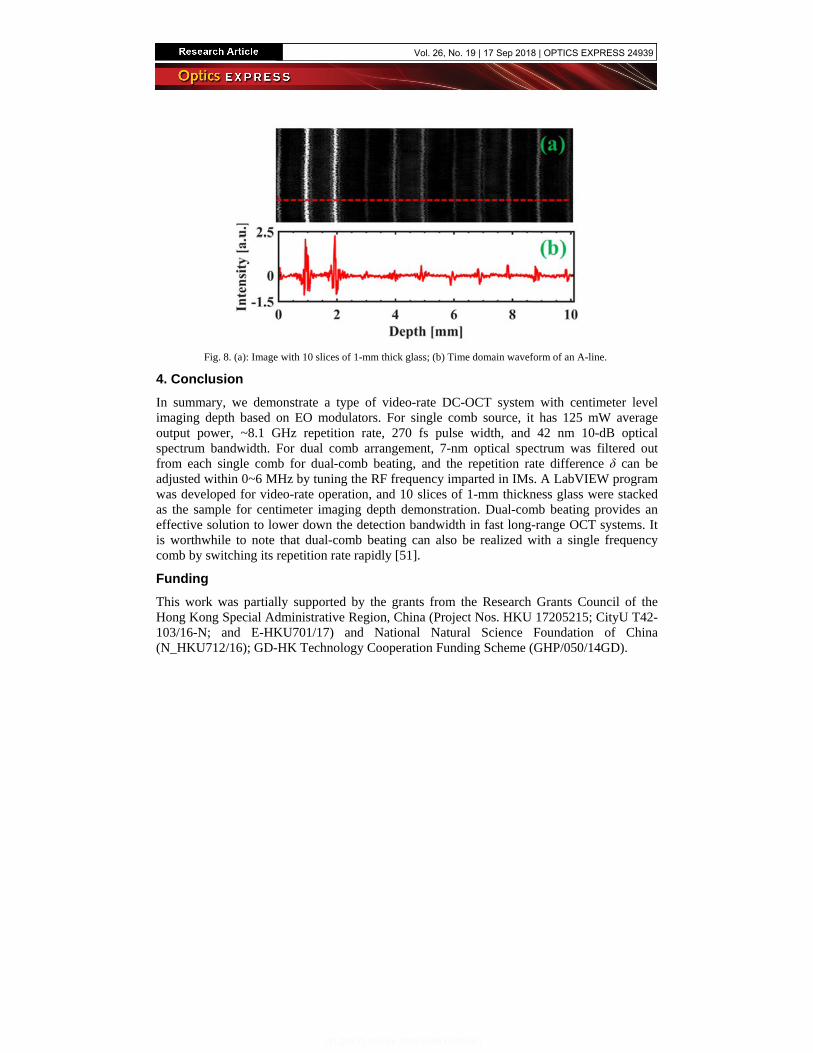
Fig. 8. (a): Image with 10 slices of 1-mm thick glass; (b) Time domain waveform of an A-line.
4. Conclusion In summary, we demonstrate a type of video-rate DC-OCT system with centimeter level imaging depth based on EO modulators. For single comb source, it has 125 mW average output power, ~8.1 GHz repetition rate, 270 fs pulse width, and 42 nm 10-dB optical spectrum bandwidth. For dual comb arrangement, 7-nm optical spectrum was filtered out from each single comb for dual-comb beating, and the repetition rate difference δ can be adjusted within 0~6 MHz by tuning the RF frequency imparted in IMs. A LabVIEW program was developed for video-rate operation, and 10 slices of 1-mm thickness glass were stacked as the sample for centimeter imaging depth demonstration. Dual-comb beating provides an effective solution to lower down the detection bandwidth in fast long-range OCT systems. It is worthwhile to note that dual-comb beating can also be realized with a single frequency comb by switching its repetition rate rapidly [51].
Funding This work was partially supported by the grants from the Research Grants Council of the Hong Kong Special Administrative Region, China (Project Nos. HKU 17205215; CityU T42-103/16-N; and E-HKU701/17) and National Natural Science Foundation of China (N_HKU712/16); GD-HK Technology Cooperation Funding Scheme (GHP/050/14GD).
Vol. 26, No. 19 | 17 Sep 2018 | OPTICS EXPRESS 24939


