
An AffordAble, tunAble microplAte reAder for 96-well formAt
Versamax microplate reader
AffordAble
The robot-compatible VersaMax Reader is cost-effective—users never have to buy filters. Furthermore, VersaMax is reliable, which means more uptime and lower long-term cost of ownership.
wide rAnge of ApplicAtions
The VersaMax reader covers a wide range of applications: > Microbial Growth/MIC > IC50/LD50 > Endpoint ELISAs/EIA > Cytoproliferation/Cytotoxicity > Colorimetric Protein > Kinetic ELISAs/Enzyme Assays > Bacterial Identification
powerful dAtA AnAlysis
SoftMax® Pro, Software Molecular Devices’ industry-leading data analysis and instrument control software, is included with VersaMax
The VersaMax™ Microplate Reader from Molecular Devices bridges the gap between the affordability of filter-based readers and the flexibility of monochromator-based systems.
tunAble, filterless flexibility
The VersaMax Reader uses a grating monochromator to select the wavelength, so the exact wavelength needed can be selected for every assay. With a wavelength range from 340 to 850 nm, this is equivalent to having 510 free filters.
exceptionAl performAnce
Using an advanced optical and electronic design, the VersaMax Reader gives the same high performance with round-bottom, flat-bottom or half-area well plates. Dual wavelength readings report the actual absorbance at each wavelength so data can be analyzed according to the user’s preferences. Temperature control up to 45°C allows kinetic assays at ambient and physiological temperatures.
> tunAble for filterless
flexibility
> exceptionAl performAnce
> AffordAble
> wide ApplicAtion bAse
> powerful dAtA AnAlysis
> eAsy VAlidAtion And
testing
VersAmAx tunAble microplAte reAder
Temperature RegulationTemperature range: Ambient +4°C to 45°CTemperature uniformity (microplate): ±0.5°C at 37°C, well-to-well
General SpecificationsDimensions (in.): 8.6 (L) x 22.8 (W) x 15 (H)Dimensions (cm): 22 (L) x 58 (W) x 38 (H)Weight: 30 lbs. (13.6 kg)Power consumption: < 250 watts
Power source: 100–240 Vac, 4 A 50/60 Hz
Robot compatible: Yes
ordering informAtion
Contact your Molecular Devices sales representative for configuration options.
sAles offices
> USA & Canada +1-800-635-5577> Brazil +55-11-3616-6607> China (Beijing) +86-10-6410-8669> China (Shanghai) +86-21-6887-8820> Germany +49-89/96-05-88-0> Japan (Osaka) +81-6-6399-8211> Japan (Tokyo) +81-3-5282-5261> South Korea +82-2-3471-9531> United Kingdom +44-118-944-8000
Check our web site for a current listing of our worldwide distributors. www.moleculardevices.com
for reseArcH use only. not for use in diAgnostic procedures.
the trademarks used herein are the property of molecular devices, inc. or their
respective owners.
specifications subject to change without notice.
Systems and provides additional flexibility for the user. SoftMax Pro Software can handle analysis requirements from simple endpoint assays to complex kinetic assays requiring custom calculations. The software is both Windows- and Macintosh-compatible and meets the needs of both basic and power users. Choose from nine different curve-fitting routines and use default data reduction, or set up custom formulas for analysis. Data can be analyzed and combined from different plates. (See Figures 1, 2 and 3.)
VAlidAtion mAde eAsy
The SpectraTest® Validation Package tests optical performance using NIST-traceable standards. Testing can be done in the user’s lab on their own schedule. Software validation, FDA 21 CFR Part 11 compliance tools and IQ/OQ/PQ tools are also available.
tecHnicAl specificAtions
Photometric PerformanceWavelength range: 340–850 nm Wavelength selection: Monochromator, tunable in 1.0 nm incrementsWavelength bandwidth: 2 nm Wavelength accuracy: < ±2.0 nmPhotometric range: 0–4.000 ODPhotometric linearity: (405 nm) 0–3.000 ODPhotometric accuracy (340–850 nm): < ±0.006 OD ±1.0%, 0–2.0 ODPhotometric precision (340–850 nm): < ±0.003 OD ±1.0%, 0–2.0 ODMicroplate read times: Endpoint: 12 seconds Kinetics: 9 second min. interval
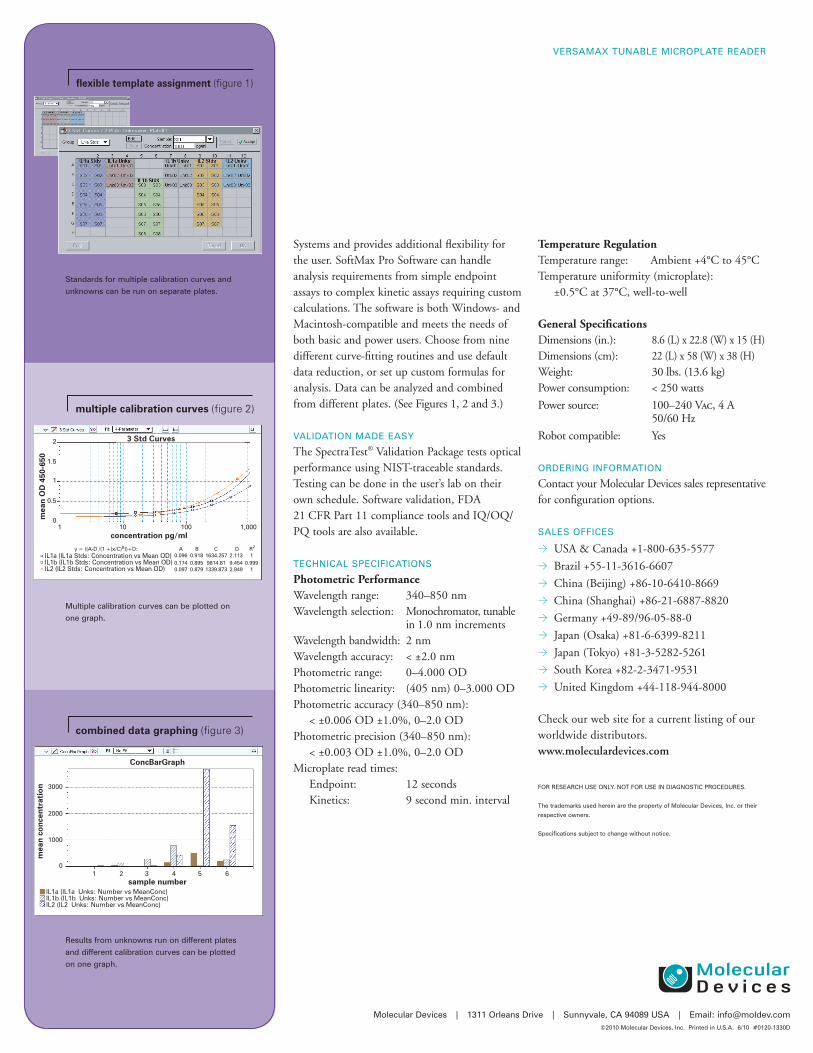
standards for multiple calibration curves and
unknowns can be run on separate plates.
flexible template assignment (figure 1)
IL1a (IL1a Stds: Concentration vs Mean OD)IL1b (IL1b Stds: Concentration vs Mean OD)IL2 (IL2 Stds: Concentration vs Mean OD)
1 10 100 1,0000
0.5
1
2
1.5
mea
n O
D 4
50-6
50
concentration pg/ml
3 Std Curves
multiple calibration curves (figure 2)
A0.0960.1740.097
0.9180.8950.879
1634.2579814.811339.873
10.999
1
2.1139.4542.949
B C D R2y = ((A-D /(1 +(x/C)B))+D:
multiple calibration curves can be plotted on
one graph.
results from unknowns run on different plates
and different calibration curves can be plotted
on one graph.
IL1a (IL1a Unks: Number vs MeanConc)IL1b (IL1b Unks: Number vs MeanConc)IL2 (IL2 Unks: Number vs MeanConc)
1 2 3 4 5 6
1000
0
2000
3000
mea
n co
ncen
trat
ion
sample number
ConcBarGraph
combined data graphing (figure 3)
molecular devices | 1311 orleans drive | sunnyvale, cA 94089 usA | email: [email protected]©2010 molecular devices, inc. printed in u.s.A. 6/10 #0120-1330d


