
Van Eenennaam 11/17/2010 Animal Genomics and Biotechnology Education
Alison Van Eenennaam, Ph.D.Cooperative Extension SpecialistAnimal Biotechnology and Genomics University of California, [email protected](530) 752-7942
animalscience.ucdavis.edu/animalbiotech
The Value of Accuracy
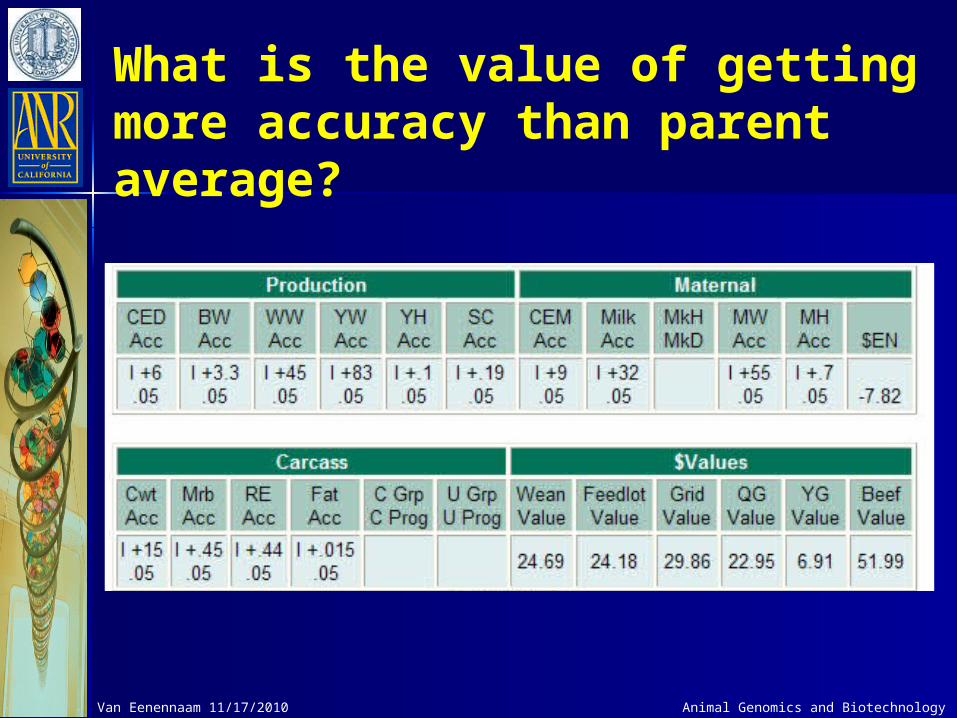
What is the value of getting more accuracy than parent average?
Van Eenennaam 11/17/2010 Animal Genomics and Biotechnology Education

What is accuracy?
EPDs are estimates– Accuracy tells use how close the estimate is to
the true value Accuracy increases with additional data Accuracy is not a measure of progeny variability Accuracy is a measure of how much an EPD could
change– Way of quantifying risk
Van Eenennaam 11/17/2010 Animal Genomics and Biotechnology Education

Possible Change Table
Van Eenennaam 11/17/2010 Animal Genomics and Biotechnology Education
What is BIF accuracy?
“Breeders” or “True” Accuracy (r)– Defined as the correlation between true and
estimated values
BIF Accuracy – BIF accuracies are more conservative, in that
they require more progeny records to achieve high accuracy values
Van Eenennaam 11/17/2010 Animal Genomics and Biotechnology Education
How can you increase accuracy ?
Get records on parents (Pedigree estimate)
Get records on the individual Get records on other relatives Get records on progeny
Collection of records can take a long time – especially for traits collected late in life. Van Eenennaam 11/17/2010 Animal Genomics and Biotechnology
Education

ΔG = (im rm +if rf)/ (Lm + Lf)
im Intensity of male section rm Accuracy of male section if Intensity of female section rf Accuracy of female section Lm Male generation intervalLf Female generation interval
The rate of genetic gain can be accelerated by altering
components of the “breeders” equation:
Van Eenennaam 11/17/2010 Animal Genomics and Biotechnology Education

How can DNA tests improve accuracy?
Proposition behind DNA testing is that they will increase the accuracy of genetic estimates in young animals because you can tell which offspring got a better than average sampling of their parents’ genes
DNA tests are particularly useful for traits that are:– Lowly heritable– Hard or expensive to measure– Measured late in life– Sex specific
Van Eenennaam 11/17/2010 Animal Genomics and Biotechnology Education

Animal Biotechnology and Genomics Education Van Eenennaam 11/17/2010
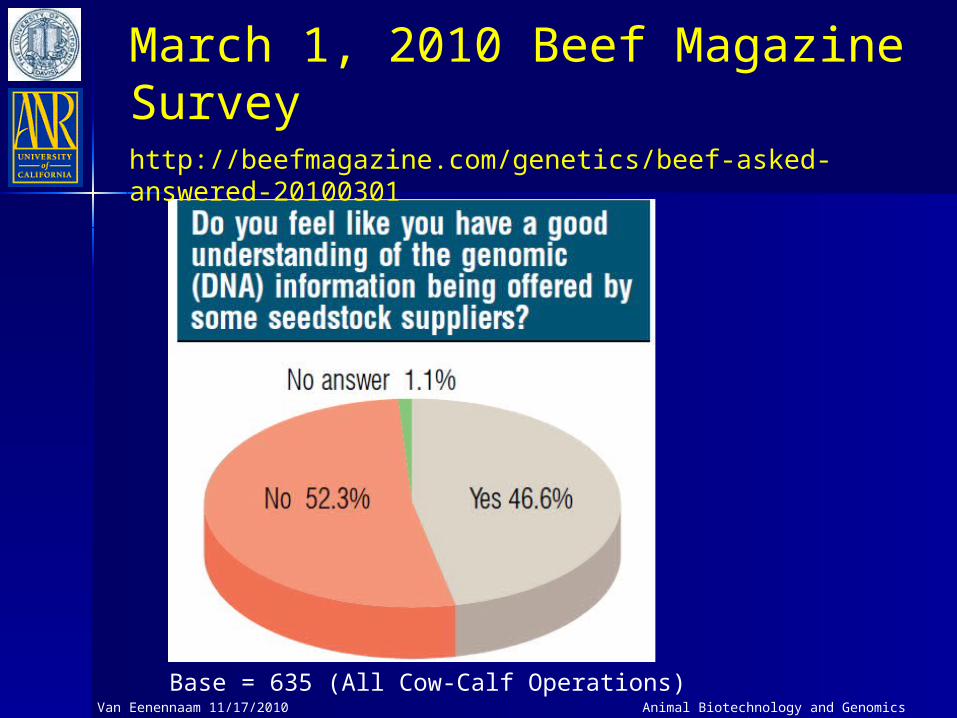
Base = 635 (All Cow-Calf Operations)
March 1, 2010 Beef Magazine Surveyhttp://beefmagazine.com/genetics/beef-asked-answered-20100301
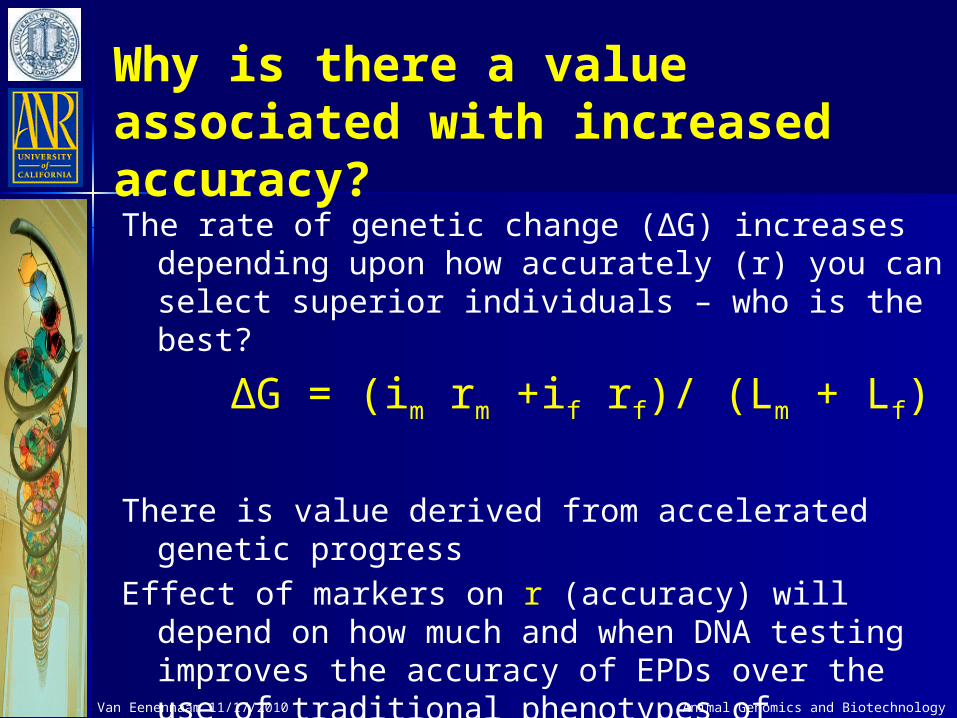
Why is there a value associated with increased accuracy? The rate of genetic change (ΔG) increases
depending upon how accurately (r) you can select superior individuals – who is the best?
ΔG = (im rm +if rf)/ (Lm + Lf)
There is value derived from accelerated genetic progress
Effect of markers on r (accuracy) will depend on how much and when DNA testing improves the accuracy of EPDs over the use of traditional phenotypes of individual and relatives
Van Eenennaam 11/17/2010 Animal Genomics and Biotechnology Education

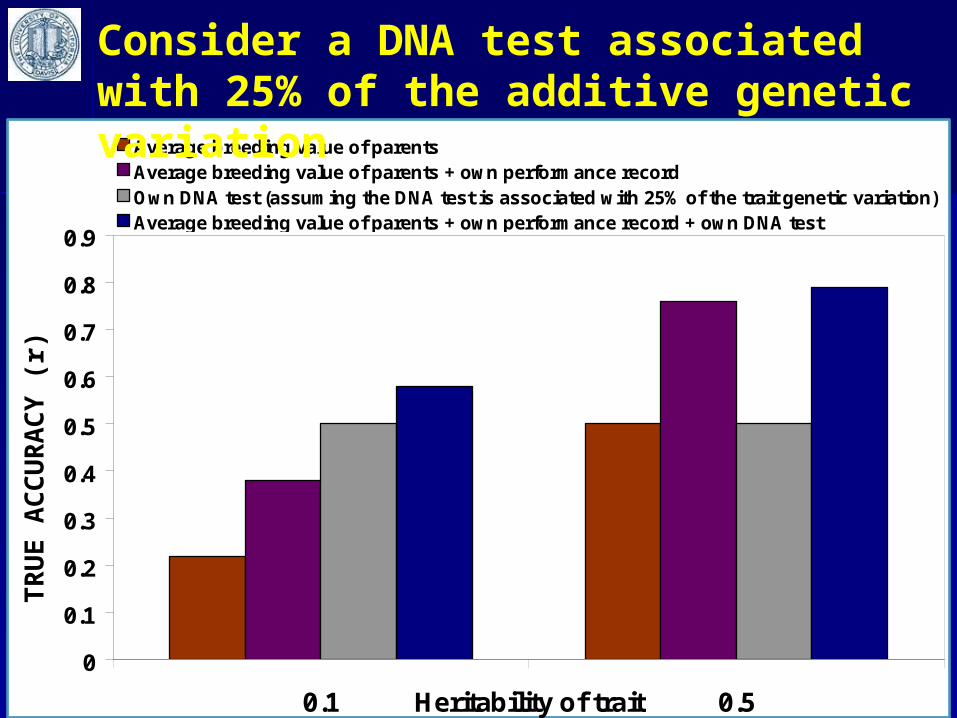
Consider that there is a DNA test associated with 25% of trait
genetic variation
REMAINDER =ENVIRONMENT
h2 = GENETIC
COMPONENT
TEST ACCOUNTS FOR 25%
OTHER GENES
(75%)
Van Eenennaam 11/17/2010 Animal Genomics and Biotechnology Education
120
0.1
0.2
0.3
0.4
0.5
0.6
0.7
0.8
0.9
0.1 0.5Heritability of trait
Ac
cu
rac
y o
f E
BV
Average breeding value of parentsAverage breeding value of parents + own performance recordOwn DNA test (assuming the DNA test is associated with 25% of the trait genetic variation)Average breeding value of parents + own performance record + own DNA test
Consider a DNA test associated with 25% of the additive genetic variation
TR
UE
AC
CU
RA
CY
(r)
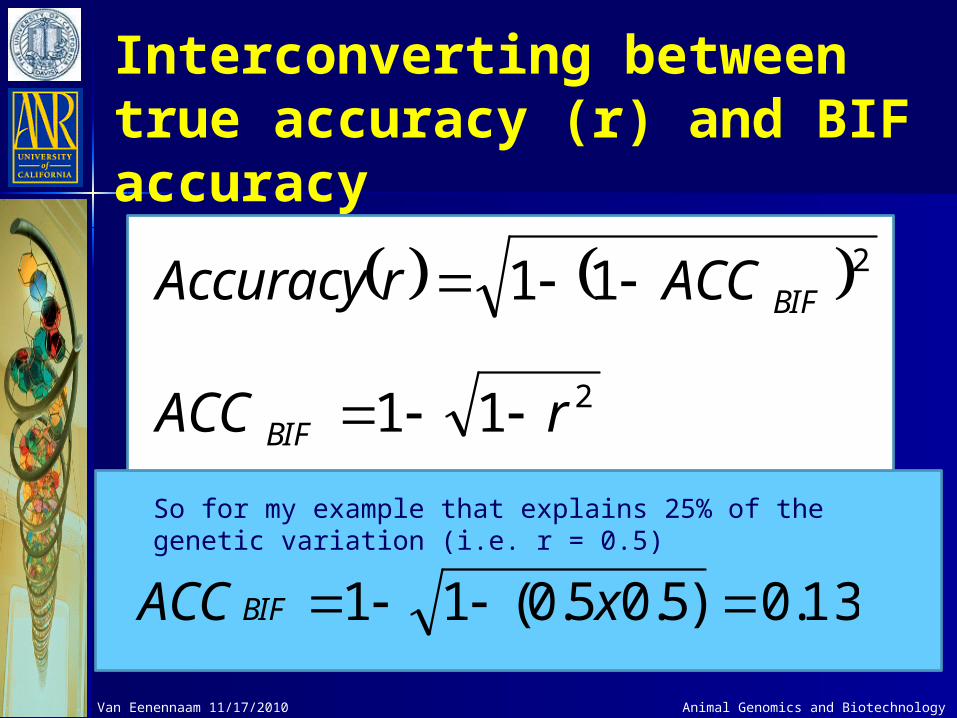
Interconverting between true accuracy (r) and BIF accuracy
2
2
11
11
rACC
ACCrAccuracy
BIF
BIF
13.0)5.05.0(11 xACCBIF
So for my example that explains 25% of the genetic variation (i.e. r = 0.5)
Van Eenennaam 11/17/2010 Animal Genomics and Biotechnology Education
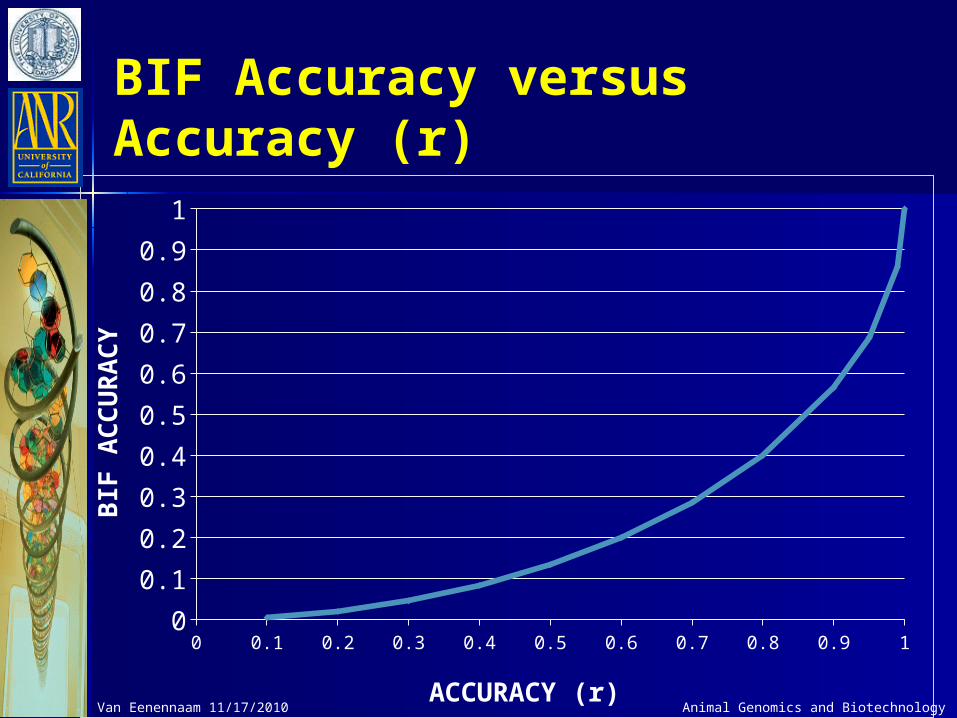
BIF Accuracy versus Accuracy (r)
0 0.1 0.2 0.3 0.4 0.5 0.6 0.7 0.8 0.9 10
0.1
0.2
0.3
0.4
0.5
0.6
0.7
0.8
0.9
1
ACCURACY (r)
BIF
AC
CU
RA
CY
Van Eenennaam 11/17/2010 Animal Genomics and Biotechnology Education
Van Eenennaam 11/17/2010
TRAIT Igenity “first” Angus Profile
Igenity 384 Angus Profile
Pfizer 50K HD
MMI*
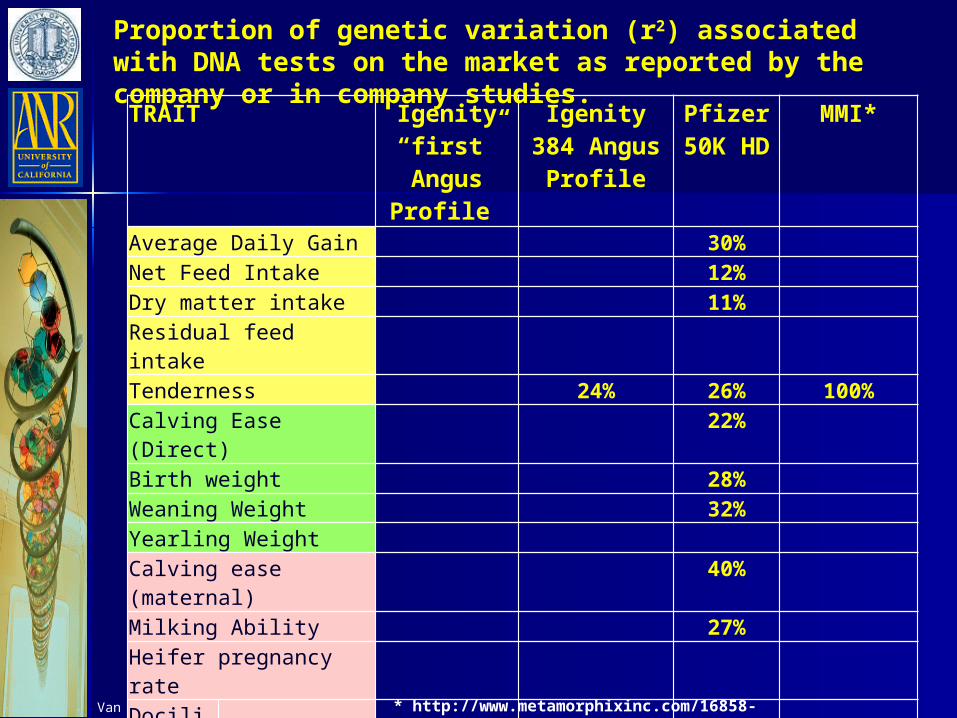
Average Daily Gain 30%Net Feed Intake 12%Dry matter intake 11%Residual feed intakeTenderness 24% 26% 100%Calving Ease (Direct) 22%Birth weight 28%Weaning Weight 32%Yearling WeightCalving ease (maternal) 40%Milking Ability 27%Heifer pregnancy rateDocility StayabilityCarcass weight 29%Backfat thickness 40%Ribeye area 29%Marbling score ~15% ~40% 34% 70%Yield Grade Percent Choice
Proportion of genetic variation (r2) associated with DNA tests on the market as reported by the company or in company studies.
* http://www.metamorphixinc.com/16858-trubreed_marketingmaterials.pdf
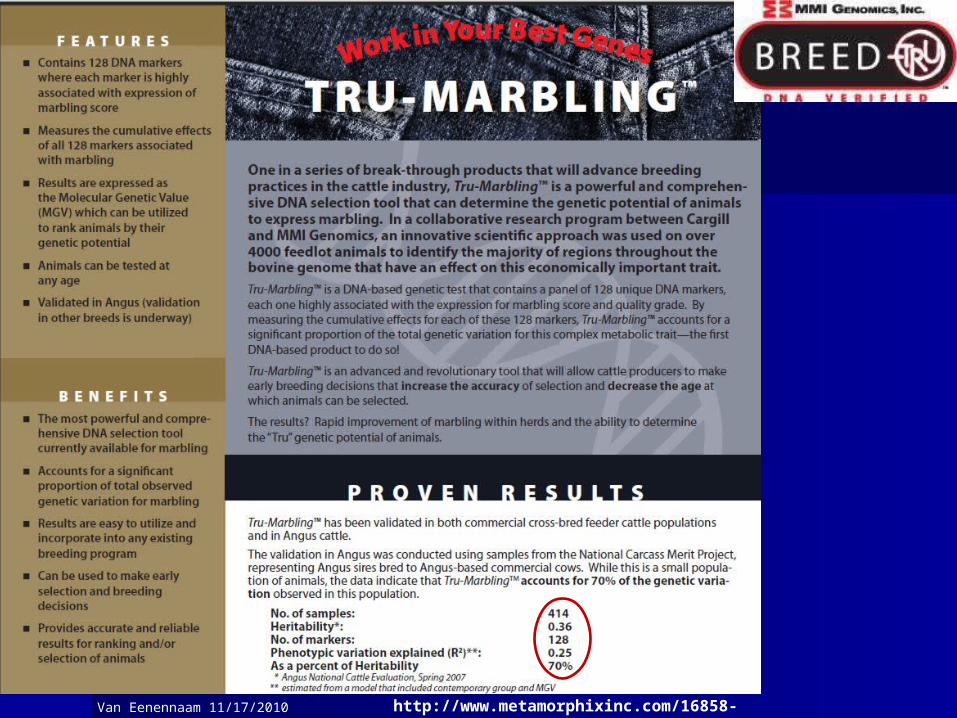
Van Eenennaam 11/17/2010 http://www.metamorphixinc.com/16858-trubreed_marketingmaterials.pdf

BIF Guiding Philosophy on DNA traits
“BIF believes that information from DNA tests only has value in selection when incorporated with all other available forms of performance information for economically important traits in national cattle evaluations (NCE), and when communicated in the form of an EPD with a corresponding BIF accuracy. For some economically important traits, information other than DNA tests may not be available. Selection tools based on these tests should still be expressed as EPD within the normal parameters of NCE.”
Van Eenennaam 11/17/2010 Animal Genomics and Biotechnology Education
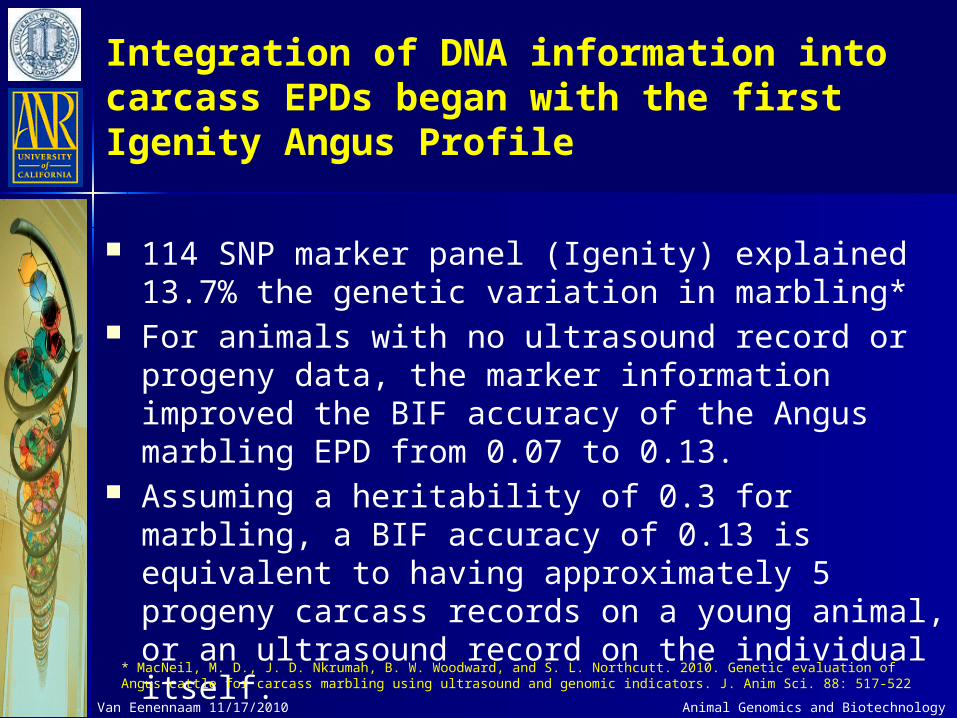
114 SNP marker panel (Igenity) explained 13.7% the genetic variation in marbling*
For animals with no ultrasound record or progeny data, the marker information improved the BIF accuracy of the Angus marbling EPD from 0.07 to 0.13.
Assuming a heritability of 0.3 for marbling, a BIF accuracy of 0.13 is equivalent to having approximately 5 progeny carcass records on a young animal, or an ultrasound record on the individual itself.
Integration of DNA information into carcass EPDs began with the first Igenity Angus Profile
Van Eenennaam 11/17/2010 Animal Genomics and Biotechnology Education
* MacNeil, M. D., J. D. Nkrumah, B. W. Woodward, and S. L. Northcutt. 2010. Genetic evaluation of Angus cattle for carcass marbling using ultrasound and genomic indicators. J. Anim Sci. 88: 517-522
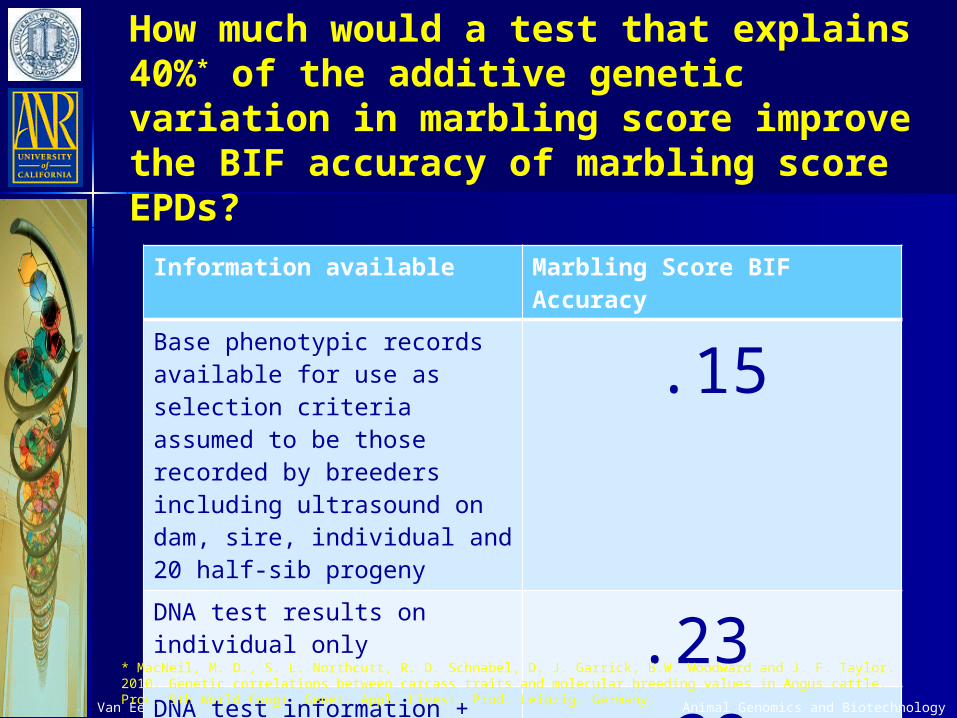
How much would a test that explains 40%* of the additive genetic variation in marbling score improve the BIF accuracy of marbling score EPDs?
Van Eenennaam 11/17/10
Information available Marbling Score BIF Accuracy
Base phenotypic records available for use as selection criteria assumed to be those recorded by breeders including ultrasound on dam, sire, individual and 20 half-sib progeny
.15
DNA test results on individual only .23 DNA test information + base phenotypic records .28
Animal Genomics and Biotechnology Education
* MacNeil, M. D., S. L. Northcutt, R. D. Schnabel, D. J. Garrick, B.W. Woodward and J. F. Taylor. 2010. Genetic correlations between carcass traits and molecular breeding values in Angus cattle. Proc. 9th World Congr. Genet. Appl. Livest. Prod. Leipzig, Germany.
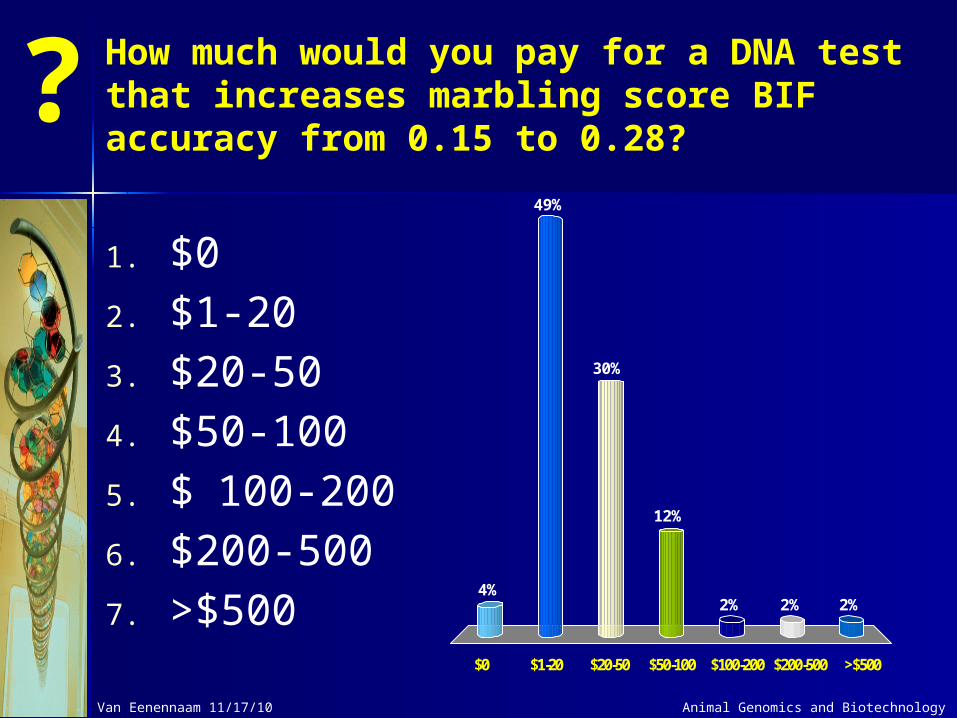
$0 $1-20 $20-50 $50-100 $100-200 $200-500 >$500
4%
49%
30%
2%2%2%
12%
How much would you pay for a DNA test that increases marbling score BIF accuracy from 0.15 to 0.28?
?1. $0 2. $1-20 3. $20-50 4. $50-100 5. $ 100-200 6. $200-500 7. >$500
Van Eenennaam 11/17/10 Animal Genomics and Biotechnology Education

Van Eenennaam 11/17/2010
13395344 3 6 6 4 2 8 9
Multibreed version 2008
Animal Biotechnology and Genomics Education Van Eenennaam 11/17/2010
Base = 635 (All Cow-Calf Operations)
March 1, 2010 Beef Magazine Surveyhttp://beefmagazine.com/genetics/beef-asked-answered-20100301

Lead Today with 50K
1. Birth weight2. Weaning weight 3. Weaning maternal (milk)4. Calving ease direct5. Calving ease maternal6. Marbling7. Backfat thickness 8. Ribeye area 9. Carcass weight 10. Tenderness11. Postweaning average daily gain12. Daily feed intake 13. Feed efficiency (net feed intake)
50K SNP chip assays 50,000 SNPs spread throughout genome
Van Eenennaam 11/17/2010
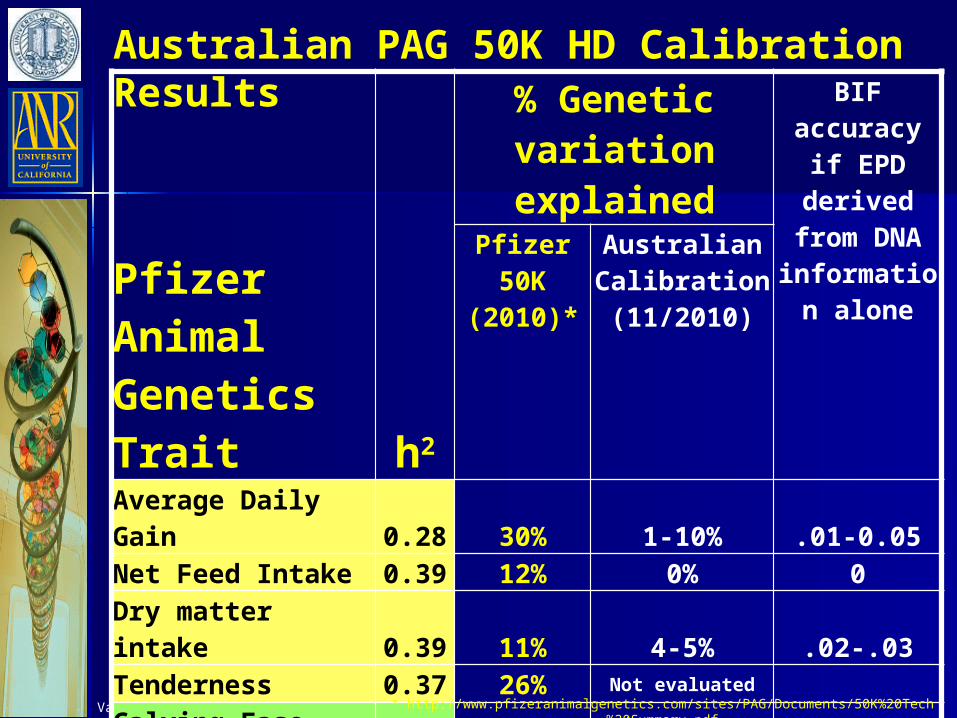
Pfizer Animal Genetics Trait h2
% Genetic variation explained
BIF accuracy if EPD derived from DNA
information alone
Pfizer 50K (2010)*
Australian Calibration (11/2010)
Average Daily Gain 0.28 30% 1-10% .01-0.05Net Feed Intake 0.39 12% 0% 0Dry matter intake 0.39 11% 4-5% .02-.03Tenderness 0.37 26% Not evaluated
Calving Ease (Direct) 0.1 22% 6% .03Birth weight 0.31 28% 12-16% .06-.08Weaning Weight 0.25 32% 12-19% .06-.10Calving ease (maternal) 0.1 40% 4% .02Milking Ability 0.25 27% 10-14% .05-.07Carcass weight 0.39 29% 6-13% .03-.07Backfat thickness 0.36 40% 14-19% .07-.10Ribeye area 0.4 29% 10-20% .05-.11Marbling score 0.37 34% 4-11% .02-.06
Australian PAG 50K HD Calibration Results
* http://www.pfizeranimalgenetics.com/sites/PAG/Documents/50K%20Tech%20Summary.pdf
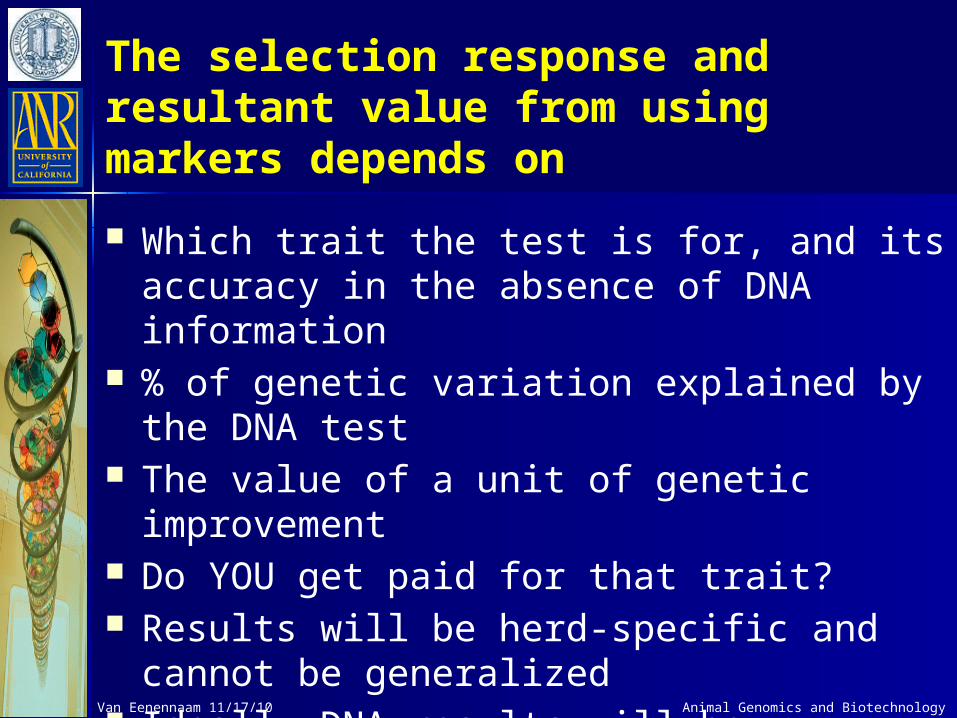
The selection response and resultant value from using markers depends on
Which trait the test is for, and its accuracy in the absence of DNA information
% of genetic variation explained by the DNA test
The value of a unit of genetic improvement
Do YOU get paid for that trait? Results will be herd-specific and cannot be
generalized Ideally DNA results will be integrated into
EPDs so there is only one source of information
Animal Genomics and Biotechnology Education
Van Eenennaam 11/17/10

Or more simply: Does it work? Is it useful? Does it pay?
Need independent estimates of proportion of genetic variation explained by test (r2) to determine if it works
Usefulness will depend on how much the DNA information improves the accuracy of genetic evaluations at the time of selection, and the value of a unit of genetic improvement.
Value proposition will depend on individual operation and level of industry integration
Exact value will require an economic weighting of traits with DNA and/or records (i.e. an index) of relevance for U.S. beef production systems
Animal Genomics and Biotechnology Education
Van Eenennaam 11/17/10
Animal Genomics and Biotechnology Education
Van Eenennaam 11/17/10
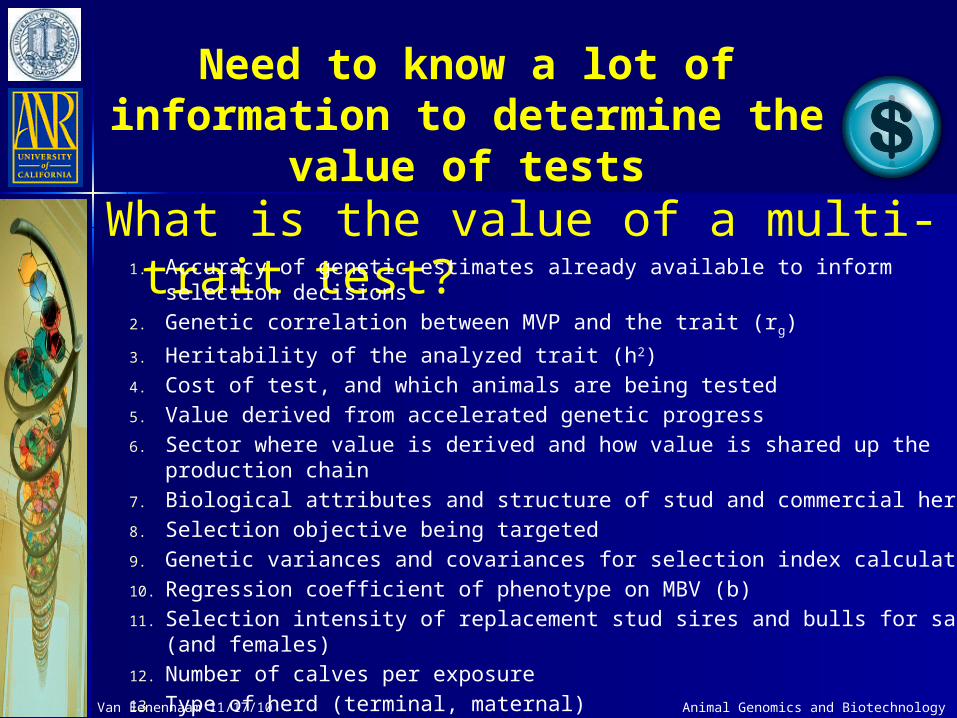
What is the value of a multi-trait test?1. Accuracy of genetic estimates already available to inform selection decisions
2. Genetic correlation between MVP and the trait (rg)
3. Heritability of the analyzed trait (h2)4. Cost of test, and which animals are being tested5. Value derived from accelerated genetic progress 6. Sector where value is derived and how value is shared up the production chain 7. Biological attributes and structure of stud and commercial herds8. Selection objective being targeted 9. Genetic variances and covariances for selection index calculations10. Regression coefficient of phenotype on MBV (b)11. Selection intensity of replacement stud sires and bulls for sale (and females)12. Number of calves per exposure13. Type of herd (terminal, maternal)14. Financial planning horizon etc., etc., etc.
Need to know a lot of information to determine the
value of tests
Animal Genomics and Biotechnology Education
Van Eenennaam 11/17/10


