
Valuation and Segmentation in Emerging
MarketsGeert Bekaert, Columbia + NBER
Campbell R. Harvey, Duke + NBERChristian T. Lundblad, UNC
Stephan Siegel, U. of Washington
May 16, 2008

• Why has globalization treated some countries better
than others?• What drives valuation differentials?• Can we characterize the types of policies that change
the degree of segmentation – both across countries and through time?
`
I. The Setting

1. Segmentation
2. Valuation`
II. The Plan

6
Two aspects of (de jure) globalization
Economic Integration: Trade Liberalization Indicator
[Wacziarg and Welch (2004)]
Financial Integration: Capital Account Openness Index
[Quinn and Toyoda (2001)]
Equity Market Openness [Bekaert and Harvey
(2000)]
III. Openness

7
0.0
0.2
0.4
0.6
0.8
1.0
Open Capital Account
Investable Equity
Trade Openness
Open Equity Market
III. Openness
Trade and Financial Openness Have Increased

8
Globalization may have wide-ranging effects:
Expected Returns, Correlation and Volatility [International Finance]
Consumption Risk Sharing, Efficacy of Macroeconomic Policy[International Economics]
Investment, Economic Growth[Development Economics]
Our Focus: Effects on Stock Valuation
III. Openness

9
Equity Returns
Cash Flows
Discount Rates
Real Rates
Term Premiums
Equity risk premiums
Bond Returns
Inflation Economic Integration
Economic Integration:• Specialization• Exposure to world shocks
Financial Integration
III. Openness

10
Building on Bekaert, Harvey, Lundblad, Siegel (BHLS) (JF - June 2007), develop a measure of the degree of effective market segmentation
Measurement: De Jure Openness ≠ De Facto Integration• Liberalization process is gradual and complex• Capital controls may not have been effective• Liberalization may not be credible• Indirect access may already exist
Other factors may “segment” markets:• political risk• corporate governance issues• liquidity / financial development• domestic product and labor markets• “push” factors
Literature: Bekaert (1995), Bekaert and Harvey (1995), Nishiotis (2004), Aizenman and Noy (2005), Lane and Milesi-Ferretti (2001)
1
III. Four Contributions
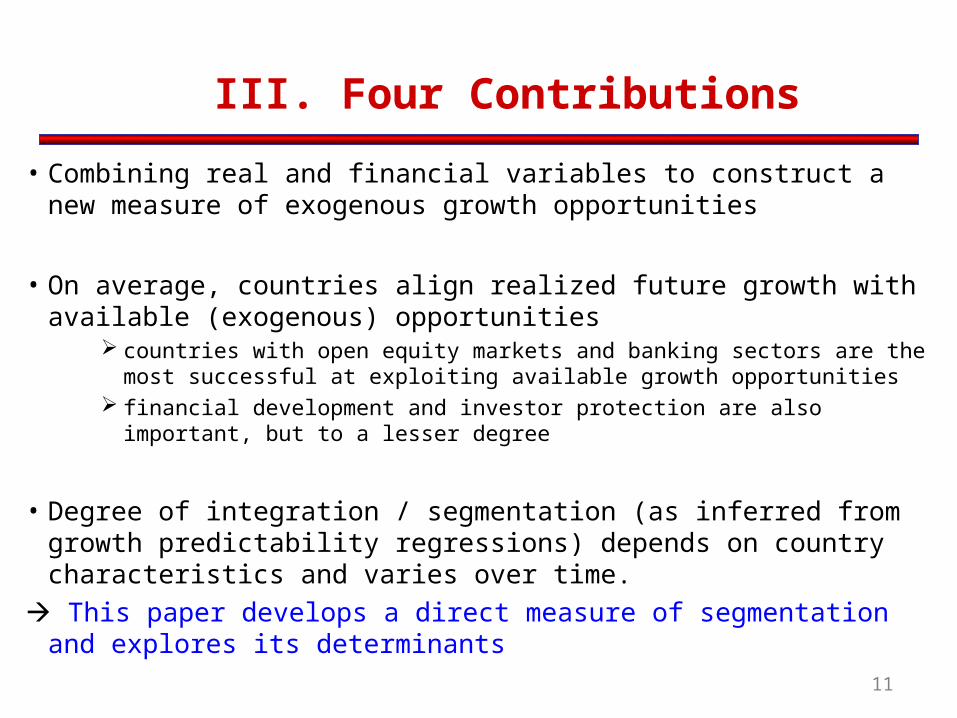
11
• Combining real and financial variables to construct a new measure of exogenous growth opportunities
• On average, countries align realized future growth with available (exogenous) opportunities
countries with open equity markets and banking sectors are the most successful at exploiting available growth opportunities
financial development and investor protection are also important, but to a lesser degree
• Degree of integration / segmentation (as inferred from growth predictability regressions) depends on country characteristics and varies over time.
This paper develops a direct measure of segmentation and explores its determinants
III. Four Contributions
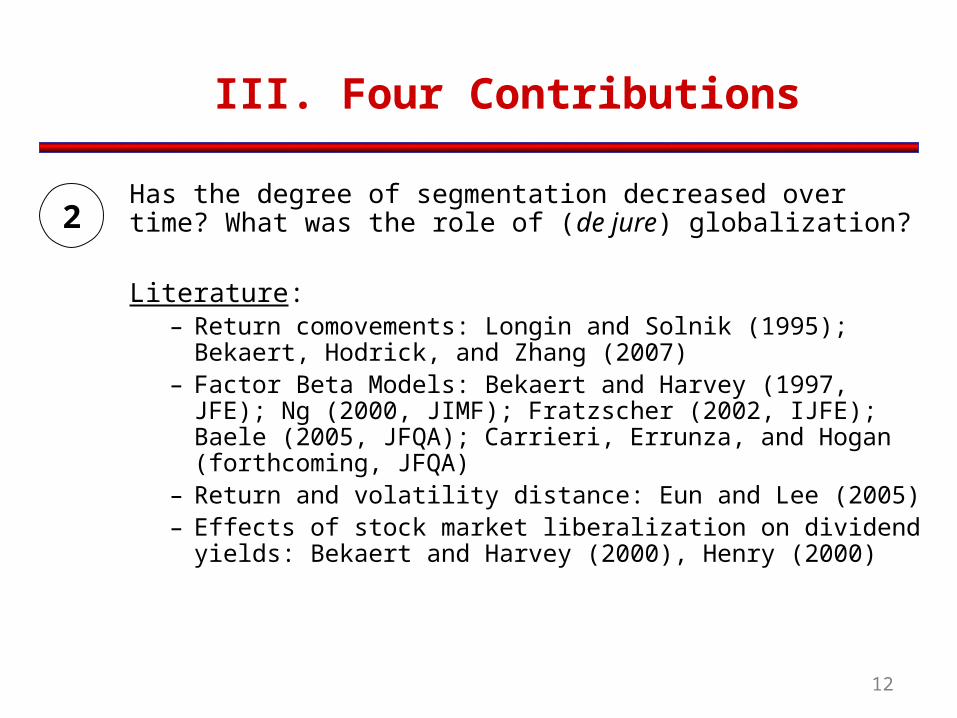
12
Has the degree of segmentation decreased over time? What was the role of (de jure) globalization?
Literature:– Return comovements: Longin and Solnik (1995);
Bekaert, Hodrick, and Zhang (2007)– Factor Beta Models: Bekaert and Harvey (1997, JFE);
Ng (2000, JIMF); Fratzscher (2002, IJFE); Baele (2005, JFQA); Carrieri, Errunza, and Hogan (forthcoming, JFQA)
– Return and volatility distance: Eun and Lee (2005)– Effects of stock market liberalization on dividend
yields: Bekaert and Harvey (2000), Henry (2000)
2
III. Four Contributions

13
Identify factors that determine the cross-sectional and time-series variation in segmentation:
Is de jure globalization first order?What is the impact of local institutions?
Literature: - Bhojraj and Ng (2007)- Hail and Leuz (2006)
3
III. Four Contributions

14
Related issues:
Investigate industry-specific degrees of segmentation
“Segmentation” within the U.S.
“Segmentation” within the EU
4
III. Four Contributions
15
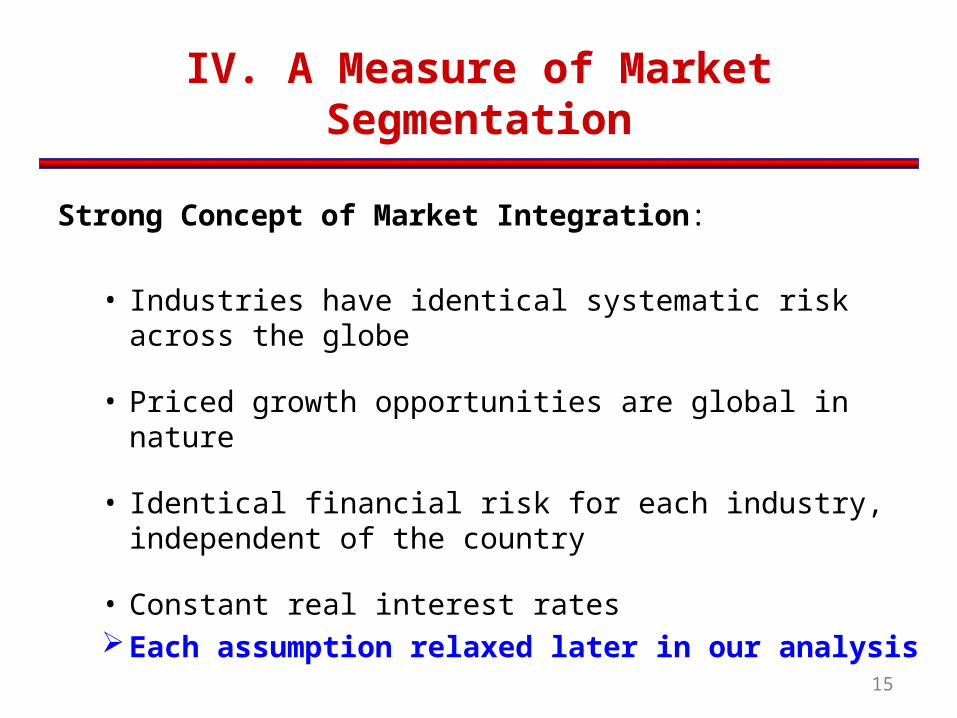
IV. A Measure of Market Segmentation
Strong Concept of Market Integration:
• Industries have identical systematic risk across the globe
• Priced growth opportunities are global in nature
• Identical financial risk for each industry, independent of the country
• Constant real interest rates Each assumption relaxed later in our
analysis

16
IV. A Measure of Market Segmentation
Assume each country i is a basket of industries with industry weights IWi,j,t
Let EYi,j,t = earnings yields for country i, industry j
Valuation Differential: |EYi,j,t- EYw,j,t|(small and constant under strong market integration)
Measure a country’s degree of observed segmentation:
, , , , , , ,1
= | |
N
i t i j t i j t w j tj
SEG IW EY EY

17
IV. A Measure of Market Segmentation
EYi,j,tEMDB: 28 countriesDataStream: 22 countries
DataStream
EMDB: 28 countriesDataStream: 22 countries
12 month trailing earnings yield,negative yields set to zero
12 month global trailing earnings yield, negative yields set to zero(also considered U.S.)Industry MCAP share in local market
EYw,j,t
IWi,j,t
Construct SEG for 50 Countries between 1973 and 2005

18
IV. A Measure of Market Segmentation
Country Sample Average St. Dev.
Year of first
observation
Average segmenation over first five
years
Average segmentation2001 - 2005
Change in segmentation
ARG EM 5.3% 5.2% 1988 9.5% 4.9% -48.4%CHN EM 2.3% 1.0% 1995 2.6% 2.1% -18.1%DEU DEV 2.1% 1.0% 1980 3.2% 2.4% -25.7%GBR DEV 1.9% 1.2% 1980 4.2% 1.2% -72.8%IND EM 3.2% 1.4% 1988 3.2% 2.7% -13.8%MEX EM 3.5% 3.6% 1988 5.8% 2.3% -61.0%PHL EM 2.9% 0.9% 1990 3.4% 2.5% -26.0%USA DEV 0.7% 0.2% 1980 0.6% 0.8% 23.6%VEN EM 6.8% 4.8% 1988 6.4% 10.0% 55.0%
Averages of country-level data
DEV 2.7% 1.5% 1982 4.5% 1.9% -45.0%EM 4.4% 2.6% 1991 5.8% 3.9% -20.1%
ALL 3.8% 2.2% 1988 5.3% 3.1% -29.6%
Segmentation Segmentation over time

19
IV. A Measure of Market Segmentation
Industry Average St. Dev.
Average segmentatio
n 1980 - 1984
Average segmentatio
n2001 - 2005
Change in segmentatio
n
Rank based on average
segmentation 1980 - 1984
Rank based on average
segmentation 2001 - 2005
Banks 5.8% 2.9% 10.0% 3.0% -69.8% 1 33Life Insurance 5.2% 3.5% 8.5% 2.9% -65.7% 2 34General Retailers 4.2% 2.6% 8.2% 4.1% -50.4% 3 12Nonlife Insurance 5.0% 2.0% 7.6% 4.1% -46.4% 4 13Electricity 4.5% 2.0% 7.5% 3.5% -52.5% 5 25Fixed Line Telecommunications 4.2% 2.1% 7.3% 3.8% -47.7% 6 18. . . Aerospace & Defense 3.0% 1.6% 3.4% 2.5% -25.7% 33 37Support Services 3.0% 1.7% 3.0% 3.2% 6.7% 34 30Pharmaceuticals & Biotechnology 3.0% 1.2% 3.0% 3.5% 16.1% 35 26Gas, Water & Multiutilities 2.6% 1.0% 2.9% 3.7% 28.3% 36 22Household Goods 3.6% 1.4% 2.8% 3.8% 35.6% 37 17Travel & Leisure 4.1% 2.0% 2.8% 5.4% 92.4% 38 3
Average of industry-level data 4.1% 1.7% 5.1% 3.9% -14.3%
RankSegmentation Segmentation over time

20
IV. A Measure of Market Segmentation
0.0%
0.5%
1.0%
1.5%
2.0%
2.5%
3.0%
3.5%
4.0%
4.5%
1973
1974
1975
1976
1977
1978
1979
1980
1981
1982
1983
1984
1985
1986
1987
1988
1989
1990
1991
1992
1993
1994
1995
1996
1997
1998
1999
2000
2001
2002
2003
2004
2005
Average Country Effect
Average Industry Effect
Average Country and Industry Segmentation (MAD)
1973 - 2005

21
V. Market Segmentation Dynamics
SEG: Industry-weighted Valuation Differentials
0.0%
2.0%
4.0%
6.0%
8.0%
10.0%
12.0%
Emerging Markets Segmentation
Developed Countries Segmentation
Linear (Developed Countries Segmentation)
Linear (Emerging Markets Segmentation)

22
V. Market Segmentation Dynamics
SEG: Industry-weighted Valuation Differentials
0%
2%
4%
6%
8%
10%
12%
1973
1974
1975
1976
1977
1978
1979
1980
1981
1982
1983
1984
1985
1986
1987
1988
1989
1990
1991
1992
1993
1994
1995
1996
1997
1998
1999
2000
2001
2002
2003
2004
2005
EM (Advanced) Segmentation
Developed Countries Segmentation
EM (Frontier) Segmentation

23
V. Market Segmentation Dynamics
SEG: Industry-weighted Valuation Differentials
0%
2%
4%
6%
8%
10%
12%
14%
16%
18%
20%
1973
1974
1975
1976
1977
1978
1979
1980
1981
1982
1983
1984
1985
1986
1987
1988
1989
1990
1991
1992
1993
1994
1995
1996
1997
1998
1999
2000
2001
2002
2003
2004
2005
North America
Africa
Asia (excl. JPN)
Europe
Latin America (incl. Caribbean)
Middle East / North Africa

24
V. Market Segmentation Dynamics
Changes over time suggest we observe valuation convergence…Explore an unbalanced panel regression with a simple time trend
Econometrics (throughout): OLS on unbalanced panels; Newey-West and SUR correction (similar to Thompson (2006))Prais-Winsten on unbalanced panel with Beck-Katz (1995) correction
All Developed Emerging
Trend -0.0007 -0.0012 -0.0012(0.0003) (0.0003) (0.0008)
R 2 0.02 0.19 0.02
Number of Countries 50 19 31

25
VI. Market Segmentation: U.S. Study
Clearly, valuation differentials may be due to other factors beyond segmentation
Within the U.S., we explore valuation differentials across industries and states to
uncover any biases in our measure of segmentation explore other explanatory factors (e.g., leverage, earnings volatility, number of firms)
Design: (a) iteratively draw N random firms (resembling countries) or (b) consider U.S. states compare to overall U.S. market

26
Segmentation across random draws of U.S. firms grouped into pseudo-’countries’
VI. Market Segmentation: U.S. Study
0%
2%
4%
6%
8%
10%
12%
1973
1974
1975
1976
1977
1978
1979
1980
1981
1982
1983
1984
1985
1986
1987
1988
1989
1990
1991
1992
1993
1994
1995
1996
1997
1998
1999
2000
2001
2002
2003
2004
2005
2006
Average Segmentation within U.S.
5th percentile Segmentation
95th percentile Segmentation
Developed Countries Segmentation
Emerging Markets Segmentation

27
Segmentation across random draws of U.S. firms by U.S. states
VI. Market Segmentation: U.S. Study
0%
2%
4%
6%
8%
10%
12%
1973
1974
1975
1976
1977
1978
1979
1980
1981
1982
1983
1984
1985
1986
1987
1988
1989
1990
1991
1992
1993
1994
1995
1996
1997
1998
1999
2000
2001
2002
2003
2004
2005
2006
Average Segmentation within U.S.
Developed Countries Segmentation
Emerging Markets Segmentation

28
Treating U.S. States as "Countries" I II III IV
Trend -0.0005 -0.0002 -0.0003 -0.00030.0001 0.0001 0.0001 0.0001
Number of Public Firms (log) -0.0049 -0.0046 -0.00450.0009 0.0008 0.0008
Abs. Difference in Financial Leverage (|Local - US|) 0.0234 0.0177
0.0131 0.0108
Abs. Difference in Log Earnings Growth Volatility (|Local - US|) 0.0064
0.0027
N 1,495 1,495 1,495 1,495
R 2 0.05 0.15 0.15 0.16
1973 - 2006
VI. Market Segmentation: U.S. Study

29
Distribution of coefficient estimates 5th 10th 50th 90th 95th
Trend -0.0002 -0.0002 -0.0001 -0.0001 -0.0001
Number of Public Firms (log) -0.0034 -0.0032 -0.0026 -0.0021 -0.0020
Abs. Difference in Financial Leverage (|Local - US|) 0.0033 0.0052 0.0220 0.0407 0.0427
Abs. Difference in Log Earnings Growth Volatility (|Local - US|) 0.0027 0.0036 0.0068 0.0108 0.0121
Distribution of t - stats 5th 10th 50th 90th 95th
Trend -6.956 -6.366 -4.427 -2.407 -0.668
Number of Public Firms (log) -12.316 -11.814 -9.329 -6.554 -4.526
Abs. Difference in Financial Leverage (|Local - US|) 0.478 0.625 2.652 4.239 7.134
Abs. Difference in Log Earnings Growth Volatility (|Local - US|) 1.517 1.749 3.222 6.036 7.709
100 Random Samples of 50 "Countries" 1973 - 2006
VI. Market Segmentation: U.S. Study

30
Case study: we explore the role for valuation convergence in Europe
Direct analogue:Consider trends in European valuations relative to
“core” European basket (FRA, DEU, ITA, NLD, BEL, IRL, GBR, DNK)
Reconsider de jure openness: To what degree did EU membership or the entrance of the Euro Zone facilitate our notion of strong market integration? Do these factors explain the trend?
VI. Market Segmentation in the EU

31
SEG
VI. Market Segmentation in the EU

32
VI. Market Segmentation in the EU

33
SEG
VI. Market Segmentation in the EU

34
There is a significant trend towards valuation convergence in Europe. Is that explained by (de jure) EU or Euro membership?
EU membership is important, but trend persists.
(1) (2) (3) (4) (5) (6) (7)
EU Membership -1.427 -1.221 -1.127 -1.234(0.521) (0.567) (0.649) (0.660)
Euro Zone -1.243 -0.902 0.314 0.664(0.399) (0.456) (0.455) (0.363)
Trend -0.109 -0.102 -0.116 -0.117(0.028) (0.030) (0.033) (0.033)
R-squared 0.061 0.038 0.170 0.080 0.204 0.168 0.211
VI. Market Segmentation in the EU

35
VII. Market Segmentation Dynamics
(with controls)
All Countries (1980 - 2005) I II III IV
Trend -0.0007 -0.0007 -0.0008 -0.0008(0.0003) (0.0003) (0.0002) (0.0002)
Number of Public Firms (log) -0.0073 -0.0072 -0.0058(0.0021) (0.0020) (0.0019)
0.0972 0.0564(0.0544) (0.0508)
0.1279(0.0276)
N 906 906 906 906
R 2 0.02 0.09 0.10 0.16
Abs. Difference in Financial Leverage (|Local - Global|)
Abs. Difference in Log Earnings Growth Volatility (|Local - Global|)

36
VII. Market Segmentation Dynamics:
De Jure OpennessEquity Market Openness I II III IV V
Equity Market Openness -0.0282 -0.0228 -0.0253 -0.0212(0.0070) (0.0062) (0.0063) (0.0055)
Trade Openness -0.0289 -0.0151 -0.0122 -0.0092(0.0117) (0.0116) (0.0117) (0.0107)
Trend -0.0008 -0.0009(0.0003) (0.0003)
Number of Public Firms (log) -0.0045(0.0016)
0.0339(0.0530)
0.1121(0.0277)
N 906 906 906 906 906
R 2 0.11 0.07 0.13 0.15 0.24
Abs. Difference in Financial Leverage (|Local - Global|)
Abs. Difference in Log Earnings Growth Volatility (|Local - Global|)

37
VII. Market Segmentation Dynamics:
De Jure OpennessCapital Account Openness I II III IV V
Capital Account Openness -0.0331 -0.0296 -0.0296 -0.0202(0.0086) (0.0080) (0.0083) (0.0071)
Trade Openness -0.0185 -0.0076 -0.0063 -0.0063(0.0087) (0.0091) (0.0092) (0.0072)
Trend -0.0006 -0.0007(0.0003) (0.0003)
Number of Public Firms (log) -0.0047(0.0011)
0.0478(0.0437)
0.1074
(0.0279)
N 880 880 880 880 880
R 2 0.08 0.03 0.09 0.11 0.23
Abs. Difference in Financial Leverage (|Local - Global|)
Abs. Difference in Log Earnings Growth Volatility (|Local - Global|)

38
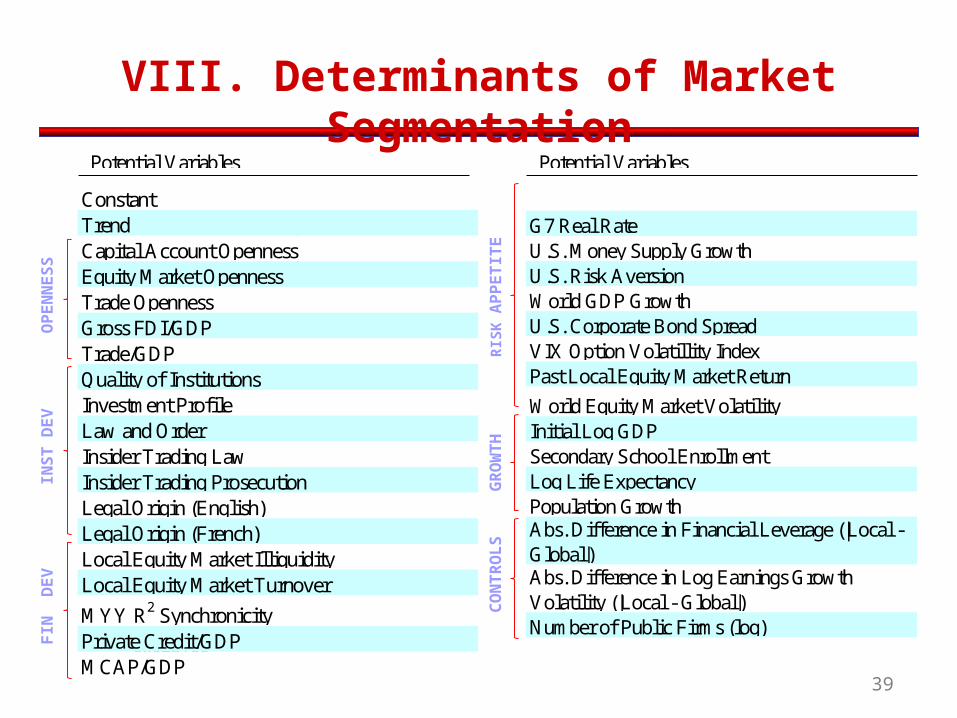
VIII. Determinants of Market Segmentation
Benchmark: fixed effects + time dummies 42% R2
Regulatory openness: explains up to 13%
Univariate evidence suggests other factors (institutions, financial development, local market liquidity, U.S. “push” factors, etc.) are also important
Is regulatory financial openness primary?
39
Potential Variables
Lagged Dependent VariableCapital Account OpennessEquity Market OpennessTrade OpennessGross FDI/GDPTrade/GDPPolitical RiskQuality of InstitutionsInvestment ProfileLaw and OrderMinority Shareholder RightsInsider Trading LawInsider Trading ProsecutionLegal Origin (English)Legal Origin (French)Local Equity Market IlliquidityLocal Equity Market TurnoverLocal Equity Market Return AutocorrelationMYY R2 SynchronicityPrivate Credit/GDPPrivate Credit/GDP (adj.)Accounting StandardsEarnings ManagementU.S. Real RateU.S. Money Supply GrowthU.S. Risk AversionWorld GDP GrowthU.S. Corporate Default SpreadVIX Option IndexPast Local Equity Market ReturnWorld Equity Market VolatilityInitial Log GDPSecondary School EnrollmentLog Life ExpantancyPopulation GrowthPredicted Growth OpportunitiesFinancial Leverage (|Local - Global|)Local Market Earnings Growth VolatilityNumber of Public Firms (log )
examples
ConstantTrendCapital Account OpennessEquity Market OpennessTrade OpennessGross FDI/GDPTrade/GDPQuality of InstitutionsInvestment ProfileLaw and OrderInsider Trading LawInsider Trading ProsecutionLegal Origin (English)Legal Origin (French)Local Equity Market IlliquidityLocal Equity Market Turnover
MYY R2 SynchronicityPrivate Credit/GDPMCAP/GDP
Potential Variables
Lagged Dependent VariableCapital Account OpennessEquity Market OpennessTrade OpennessGross FDI/GDPTrade/GDPPolitical RiskQuality of InstitutionsInvestment ProfileLaw and OrderMinority Shareholder RightsInsider Trading LawInsider Trading ProsecutionLegal Origin (English)Legal Origin (French)Local Equity Market IlliquidityLocal Equity Market TurnoverLocal Equity Market Return AutocorrelationMYY R2 SynchronicityPrivate Credit/GDPPrivate Credit/GDP (adj.)Accounting StandardsEarnings ManagementU.S. Real RateU.S. Money Supply GrowthU.S. Risk AversionWorld GDP GrowthU.S. Corporate Default SpreadVIX Option IndexPast Local Equity Market ReturnWorld Equity Market VolatilityInitial Log GDPSecondary School EnrollmentLog Life ExpantancyPopulation GrowthPredicted Growth OpportunitiesFinancial Leverage (|Local - Global|)Local Market Earnings Growth VolatilityNumber of Public Firms (log )
G7 Real RateU.S. Money Supply GrowthU.S. Risk AversionWorld GDP GrowthU.S. Corporate Bond SpreadVIX Option Volatillity IndexPast Local Equity Market Return
World Equity Market VolatilityInitial Log GDPSecondary School EnrollmentLog Life ExpectancyPopulation GrowthAbs. Difference in Financial Leverage (|Local - Global|)Abs. Difference in Log Earnings Growth Volatility (|Local - Global|)Number of Public Firms (log)
RIS
K AP
PE
TIT
E
OP
EN
NE
SS
INS
T D
EV
FIN
D
EV
GR
OW
TH
CO
NT
RO
LS
VIII. Determinants of Market Segmentation

40
Economic Effect on Market Segmentation (N= 906, R2 = 0.30)
OLS Estimate Emerging Developed
Standard Deviation of Time Series
Variation SEG
Equity Market Openness -0.0149 0.49 1.00 -0.0075Trade Openness -0.0082 0.81 1.00 -0.0016Investment Profile -0.0277 0.59 0.73 -0.0038MCAP/GDP -0.0056 0.46 0.65 -0.0010World GDP Growth 0.2315U.S. Corporate Bond Spread 2.0605 0.0048 0.0098VIX Option Volatility Index 0.0465 0.0725 0.0034Abs. Difference in Log Earnings Growth Volatility (|Local - Global|) 0.0911 0.13 0.09 -0.0035Number of Public Firms (log) -0.0042 5.47 5.89 -0.0018
VIII. Determinants of Market Segmentation

41
Economic Effect on Market Segmentation (N= 880, R2 = 0.33)
OLS Estimate Emerging Developed
Standard Deviation of Time Series
Variation SEG
Capital Account Openness -0.0164 0.56 0.91 -0.0058Trade Openness -0.0014 0.84 1.00 -0.0002Investment Profile -0.0300 0.61 0.73 -0.0038
Legal Origin (French) -0.0042 0.61 0.25 0.0015MCAP/GDP -0.0054 0.48 0.65 -0.0009U.S. Money Supply Growth 0.1026 0.0355 0.0036U.S. Corporate Bond Spread 1.6139 0.0048 0.0077VIX Option Volatility Index 0.0471 0.0725 0.0034Abs. Difference in Log Earnings Growth Volatility (|Local - Global|) 0.1044 0.13 0.09 -0.0039Number of Public Firms (log) -0.0044 5.52 5.89 -0.0016
VIII. Determinants of Market Segmentation

42
-0.050
0.000
0.050
0.100
0.150
0.200
0.250 Cross Section
Time-Series
VIII. Determinants of Market Segmentation

43
Equity Market Capital Account
Capital Account Openness -0.0190 -0.0174(0.0061) (0.0053)
Equity Market Openness -0.0156 -0.0145(0.0048) (0.0048)
Trade Openness -0.0104 -0.0032 -0.0115 -0.0027(0.0107) (0.0077) (0.0104) (0.0073)
Investment Profile -0.0278 -0.0293 -0.0228 -0.0337(0.0074) (0.0076) (0.0115) (0.0093)
Legal Origin (French) -0.0039 -0.0042(0.0040) (0.0036)
MCAP/GDP -0.0061 -0.0061 -0.0042 -0.0041(0.0031) (0.0031) (0.0035) (0.0036)
U.S. Money Supply Growth 0.0958 -0.0173(0.0393) (0.0366)
World GDP Growth 0.2149 0.0630(0.1140) (0.1120)
U.S. Corporate Bond Spread 2.4939 2.0609 1.7539 1.7090(0.3930) (0.3010) (0.3510) (0.2600)
VIX Option Volatility Index 0.0506 0.0522 0.0153 0.0218(0.0154) (0.0110) (0.0192) (0.0143)
Abs. Difference in Log Earnings Growth Volatility (|Local - U.S.|) 0.0783 0.0808 0.0940 0.1043
(0.0251) (0.0226) (0.0316) (0.0299)
Number of Public Firms (log) -0.0042 -0.0045 -0.0045 -0.0045(0.0018) (0.0015) (0.0016) (0.0013)
Determinants relative to World Average
Equity Market Capital Account U.S. as a Benchmark
VIII. Determinants of Market Segmentation

44
IX. Valuation
1) Segmentation is a measure of the absolute
difference between local and world (industry adjusted) earnings yields
2) Valuation attempts to explain the difference itself. The goal is to understand the drivers of ‘under’ and ‘over’ valuation

45
IX. Valuation
Valuation (switch to log PE ratios):
N
jtjwtjitjiti PEPEIWVAL
1,,,,,,,

46
IX. Valuation
Use some of the same variables to try to explain
variation in price to earnings ratios (both across countries and through time).
1: What explains the emerging markets discount?

47
IX Valuation
Figure 3
Emerging Market Discount (LEGO) (ex Japan)
-1
-0.8
-0.6
-0.4
-0.2
0
0.2
0.4
D I
S C
O U
N T
P R
E M
I U
M
Relative PE RatiosAve. Discount
“Emerging Market Discount”
Important factors? Financial openness, political and institutional risks, illiquid equity markets, and U.S. default premia

48
IX. Valuation
Are they driven by growth opportunities or
discount rate effects?
2: Decomposing PE Ratios

49
IX. Valuation
Are they driven by growth opportunities or
discount rate effects?
2: Decomposing PE Ratios

50
IX. Valuation
Empirical model for 5-year real returnsEmpirical model for 5-year real earnings growth
Project current PE on these two variables.
2: Decomposing PE Ratios

51
IX. Valuation
Given our model of expected (industry-adjusted) PE ratios, we can take a stand on whether a market is over or undervalued.
Trading simulations where you buy the undervalued markets and sell of the overvalued markets
3: Market Efficiency

52
Conclusions
•SementationNew price-based measure of market segmentation
Downwar trend in segmentation over time, partially explained by de jure globalization.
Identify most and least segmented industries over time.
Explain about 30% of the variation in degree of segmentation across countries and time:
Mostly from the cross-section Mainly from financial openness, financial
development, but “global risk” factors also matter

53
Conclusions
•ValuationValuation in developing markets is challenging for
investorsOur framework of industry adjusting compares
‘apples to apples’Our framework of considering the institutional
environment, the degree of openness as well as fundamental information, allows us to understand cross country differences in valuation – as well as time-series patterns.

54
Conclusions
• Why does this matter?Market segmentation and or undervaluation
raises the cost of capitalHigher cost of capital means less investment and
less employment growthLower investment and employment growth means
lower GDP growthFor example, Bekart, Harvey and Lundblad (JFE
2005) estimate that a market liberalization which reduces the cost of capital is associated with a increment in real GDP growth of 1% a year for five years

55
Supplementary Materials (not for reproduction)

57
I. Motivation and Goals
OutlineI. Motivation and GoalsII. Measure of Market SegmentationIII. Market Segmentation DynamicsIV. Determinants of Market SegmentationV. Robustness ChecksVI. Conclusions and Future Work

58
IV. A Measure of Market Segmentation
Earnings growth:
where:i is countryj is industryw is world
Pricing industry portfolios:
, , , , 1 , , 1 , ,
, , , , 1 , ,
, , , , , 1 , ,
ln i j t w j t i j t i j t
w j t j j w j t w j t
i j t i i j i j t i j t
Earn GO GO
GO GO
GO GO

59
IV. A Measure of Market Segmentation
Discount Rate:
where:i is countryj is industryw is world
Pricing industry portfolios:
, , , , , , , ,
, , 1 ,
, , 1 ,
= (1- - ) + +
=
=
i j t f i j i j i j w t i j i t
w t w w w t w t
i t i i i t i t
r
d
d

60
IV. A Measure of Market Segmentation
Valuation:
H0: (Strong) Market Integration:
H0: (Strong) Market Segmentation:
Pricing industry portfolios:
, , , , , , , , , , , , , , , , , ,1
= exp( )i j t i j k i j k w t i j k w j t i j k i t i j k i j tk
PE a b c GO e f GO
, , , ,
, , , , , , ,1
0; ; ( ) 0
= exp( )
i j i j j i j t
i j t i j k w t w j tk
GO
PE a GO
j,k j,kb c
, , ,
, , , , , , , , , , ,1
0; ( ) 0
= exp( )
i j w j t
i j t i j k i j k i t i j k i j tk
GO
PE a e f GO

61
Segmentation across U.S. States
0.0%
2.0%
4.0%
6.0%
8.0%
10.0%
12.0%
1973
1974
1975
1976
1977
1978
1979
1980
1981
1982
1983
1984
1985
1986
1987
1988
1989
1990
1991
1992
1993
1994
1995
1996
1997
1998
1999
2000
2001
2002
2003
2004
2005
2006
Average Segmentation
Developed Countries Segmentation
Emerging Markets Segmentation
VI. Market Segmentation: U.S. Study

62
Methodology:
– General multivariate model: Which factors account for most of the explained variance?
Need to be able to interpret evidence in the face of severe multi-collinearity
Must reduce the number of factors Lack theoretical guidance
Model reduction techniques (e.g. PCGets (Hendry))
VIII. Determinants of Market Segmentation

63
IV. General-to-Specific Modeling
Pre
-se
arc
h r
edu
ctio
n
Mu
ltip
le s
earc
h p
ath
s
En
com
pa
ssin
g
ConstantTrendCapital Account OpennessEquity Market OpennessTrade OpennessGross FDI/GDPTrade/GDPQuality of InstitutionsInvestment ProfileLaw and OrderInsider Trading LawInsider Trading ProsecutionLegal Origin (English)Legal Origin (French)Local Equity Market IlliquidityLocal Equity Market Turnover
MYY R2 SynchronicityPrivate Credit/GDPMCAP/GDPG7 Real RateU.S. Money Supply GrowthU.S. Risk AversionWorld GDP GrowthU.S. Corporate Bond SpreadVIX Option Volatillity IndexPast Local Equity Market Return
World Equity Market VolatilityInitial Log GDPSecondary School EnrollmentLog Life ExpectancyPopulation GrowthAbs. Difference in Financial Leverage (|Local - Global|)Abs. Difference in Log Earnings Growth Volatility (|Local - Global|)Number of Public Firms (log)
Positive
NegativeNegative
Negative
Negative
PositivePositivePositive
Positive
Negative
Positive
Negative
Negative
Negative
Negative
Negative
Positive
PositivePositive
Positive
Negative
Potential Variables Equity MarketCapital Account

64
Explained Variation in SEG
Contribution of individual factors (xj) to predicted segmentation:
All Factors:
where
, , ,
,
ˆ( , )i t j i j t
i t
Cov SEG x
Var SEG
,2
,
i t
i t
Var SEGR
Var SEG , ,
ˆˆi t i tSEG x
IV. Determinants of Market Segmentation

66
Variance Decomposition
IV. Determinants of Market Segmentation
EstimateOverall
Contributionyit-yi
(TS)remainder
(CS)yit-yt
(CS)remainder
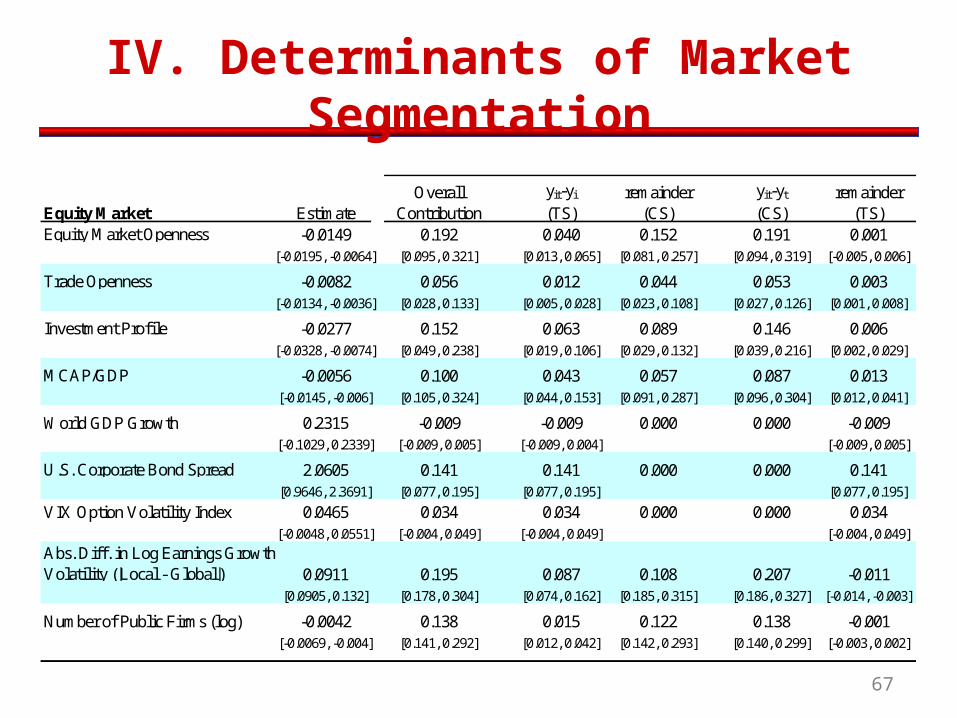
(TS)Equity Market Openness -0.0149 0.192 0.040 0.152 0.191 0.001Trade Openness -0.0082 0.056 0.012 0.044 0.053 0.003Investment Profile -0.0277 0.152 0.063 0.089 0.146 0.006MCAP/GDP -0.0056 0.100 0.043 0.057 0.087 0.013World GDP Growth 0.2315 -0.009 -0.009 0.000 0.000 -0.009U.S. Corporate Bond Spread 2.0605 0.141 0.141 0.000 0.000 0.141VIX Option Volatility Index 0.0465 0.034 0.034 0.000 0.000 0.034Abs. Difference in Log Earnings Growth Volatility (|Local - Global|) 0.0911 0.195 0.087 0.108 0.207 -0.011Number of Public Firms (log) -0.0042 0.138 0.015 0.122 0.138 -0.001The sample includes 19 developed and 31 emerging-market countries detailed in Table 1. We regress the annual country-level segmentation measure SEG onto the following variables: 1) the degree of equity market openness (investability) for a given country and year, 2) a 0/1 indicator of trade openness based on trade liberalization dates from Wacziarg and Welch (2003) for a given country and year, 3) a the investment profile from ICRG for a given country and year, 4) the ratio of equity market capitalization to gross domestic product for a given country and year, 5) the U.S. corporate bond spread for a given year, 6) the implied option volatility index (VIX) for a given year, 5) the absolute difference between the industry log earnings growth rate volatility in a given country and the U.S. market as a whole, averaged across all industries in a given country and year, and 6) the natural logarithm of the number of publicly traded firms in a given country and year. We report coefficient estimates from pooled OLS regressions as well as the overall contribution of a variable to the variation of the predicted degree of segmentation, defined as the ratio of the covariance between the given variable and the predicted degree of segmentation relative to the variance of the predicted degree of segmentation. We further distinguish between the time-series (TS) and cross-sectional (CS) component of this overall contribution in two different ways. For details on this distinction, see the corresponding chapter of the paper. N denotes the number of country-years and R2 denotes the coefficient of determination.
67
IV. Determinants of Market Segmentation
Equity Market EstimateOverall
Contributionyit-yi
(TS)remainder
(CS)yit-yt
(CS)remainder
(TS)Equity Market Openness -0.0149 0.192 0.040 0.152 0.191 0.001
[-0.0195, -0.0064] [0.095, 0.321] [0.013, 0.065] [0.081, 0.257] [0.094, 0.319] [-0.005, 0.006]
Trade Openness -0.0082 0.056 0.012 0.044 0.053 0.003[-0.0134, -0.0036] [0.028, 0.133] [0.005, 0.028] [0.023, 0.108] [0.027, 0.126] [0.001, 0.008]
Investment Profile -0.0277 0.152 0.063 0.089 0.146 0.006[-0.0328, -0.0074] [0.049, 0.238] [0.019, 0.106] [0.029, 0.132] [0.039, 0.216] [0.002, 0.029]
MCAP/GDP -0.0056 0.100 0.043 0.057 0.087 0.013[-0.0145, -0.006] [0.105, 0.324] [0.044, 0.153] [0.091, 0.287] [0.096, 0.304] [0.012, 0.041]
World GDP Growth 0.2315 -0.009 -0.009 0.000 0.000 -0.009[-0.1029, 0.2339] [-0.009, 0.005] [-0.009, 0.004] [-0.009, 0.005]
U.S. Corporate Bond Spread 2.0605 0.141 0.141 0.000 0.000 0.141[0.9646, 2.3691] [0.077, 0.195] [0.077, 0.195] [0.077, 0.195]
VIX Option Volatility Index 0.0465 0.034 0.034 0.000 0.000 0.034[-0.0048, 0.0551] [-0.004, 0.049] [-0.004, 0.049] [-0.004, 0.049]
Abs. Diff. in Log Earnings Growth Volatility (|Local - Global|) 0.0911 0.195 0.087 0.108 0.207 -0.011
[0.0905, 0.132] [0.178, 0.304] [0.074, 0.162] [0.185, 0.315] [0.186, 0.327] [-0.014, -0.003]
Number of Public Firms (log) -0.0042 0.138 0.015 0.122 0.138 -0.001[-0.0069, -0.004] [0.141, 0.292] [0.012, 0.042] [0.142, 0.293] [0.140, 0.299] [-0.003, 0.002]

68
Variance Decomposition
IV. Determinants of Market Segmentation
EstimateOverall
Contributionyit-yi
(TS)remainder
(CS)yit-yt
(CS)remainder
(TS)Capital Account Openness -0.0164 0.123 0.032 0.091 0.125 -0.001Trade Openness -0.0014 0.005 0.001 0.003 0.004 0.000Investment Profile -0.0300 0.161 0.079 0.081 0.153 0.007Legal Origin (French) -0.0042 -0.011 0.000 -0.011 -0.017 0.000MCAP/GDP -0.0054 0.110 0.052 0.058 0.093 0.016U.S. Money Supply Growth 0.1026 0.040 0.048 0.000 0.000 0.040U.S. Corporate Bond Spread 1.6139 0.149 0.182 0.000 0.000 0.149VIX Option Volatility Index 0.0471 0.049 0.040 0.000 0.000 0.049Abs. Difference in Log Earnings Growth Volatility (|Local - Global|) 0.1044 0.224 0.106 0.118 0.237 -0.013Number of Public Firms (log) -0.0044 0.149 0.020 0.129 0.152 -0.003
The sample includes 19 developed and 31 emerging-market countries detailed in Table 1. We regress the annual country-level segmentation measure SEG onto the following variables: 1) the degree of equity market openness (investability) for a given country and year, 2) a 0/1 indicator of trade openness based on trade liberalization dates from Wacziarg and Welch (2003) for a given country and year, 3) a the investment profile from ICRG for a given country and year, 4) the ratio of equity market capitalization to gross domestic product for a given country and year, 5) the U.S. corporate bond spread for a given year, 6) the implied option volatility index (VIX) for a given year, 5) the absolute difference between the industry log earnings growth rate volatility in a given country and the U.S. market as a whole, averaged across all industries in a given country and year, and 6) the natural logarithm of the number of publicly traded firms in a given country and year. We report coefficient estimates from pooled OLS regressions as well as the overall contribution of a variable to the variation of the predicted degree of segmentation, defined as the ratio of the covariance between the given variable and the predicted degree of segmentation relative to the variance of the predicted degree of segmentation. We further distinguish between the time-series (TS) and cross-sectional (CS) component of this overall contribution in two different ways. For details on this distinction, see the corresponding chapter of the paper. N denotes the number of country-years and R2 denotes the coefficient of determination.

70
IV. Determinants of Market Segmentation
Capital Account EstimateOverall
Contributionyit-yi
(TS)remainder
(CS)yit-yt
(CS)remainder
(TS)Capital Account Openness -0.0164 0.123 0.032 0.091 0.125 -0.001
[-0.0181, -0.0035] [0.03, 0.191] [0.006, 0.038] [0.024, 0.154] [0.03, 0.189] [-0.004, 0.003]
Trade Openness -0.0014 0.005 0.001 0.003 0.004 0.000[-0.0052, 0.0038] [-0.02, 0.032] [-0.003, 0.009] [-0.017, 0.023] [-0.018, 0.029] [-0.002, 0.003]
Investment Profile -0.0300 0.161 0.079 0.081 0.153 0.007[-0.0353, -0.0082] [0.053, 0.256] [0.023, 0.13] [0.031, 0.13] [0.043, 0.242] [-0.006, 0.034]
Legal Origin (French) -0.0042 -0.011 0.000 -0.011 -0.017 0.000[-0.009, -0.0007] [-0.031, -0.003] [-0.031, -0.003] [-0.044, -0.004]
MCAP/GDP -0.0054 0.110 0.052 0.058 0.093 0.016[-0.013, -0.0048] [0.091, 0.345] [0.04, 0.163] [0.05, 0.187] [0.078, 0.31] [0.011, 0.045]
U.S. Money Supply Growth 0.1026 0.040 0.048 0.000 0.000 0.040[0.0225, 0.1821] [0.013, 0.103] [0.013, 0.103] [0.013, 0.103]
U.S. Corporate Bond Spread 1.6139 0.149 0.182 0.000 0.000 0.149[1.0317, 2.545] [0.109, 0.296] [0.109, 0.296] [0.109, 0.296]
VIX Option Volatility Index 0.0471 0.049 0.040 0.000 0.000 0.049[-0.0045, 0.0611] [-0.005, 0.078] [-0.005, 0.078] [-0.005, 0.078]
Abs. Diff. in Log Earnings Growth Volatility (|Local - 0.1044 0.224 0.106 0.118 0.237 -0.013
[0.1003, 0.1299] [0.215, 0.36] [0.096, 0.193] [0.116, 0.172] [0.227, 0.369] [-0.017, -0.002]
Number of Public Firms (log) -0.0044 0.149 0.020 0.129 0.152 -0.003[-0.0054, -0.0032] [0.116, 0.268] [0.011, 0.032] [0.104, 0.241] [0.117, 0.269] [-0.004, 0.001]


