
University of South FloridaScholar Commons
Graduate Theses and Dissertations Graduate School
5-30-2008
Utilitarian Approaches for Multi-MetricOptimization in VLSI Circuit Design and SpatialClusteringUpavan GuptaUniversity of South Florida
Follow this and additional works at: https://scholarcommons.usf.edu/etd
Part of the American Studies Commons
This Dissertation is brought to you for free and open access by the Graduate School at Scholar Commons. It has been accepted for inclusion inGraduate Theses and Dissertations by an authorized administrator of Scholar Commons. For more information, please [email protected].
Scholar Commons CitationGupta, Upavan, "Utilitarian Approaches for Multi-Metric Optimization in VLSI Circuit Design and Spatial Clustering" (2008).Graduate Theses and Dissertations.https://scholarcommons.usf.edu/etd/273

Utilitarian Approaches for Multi-Metric Optimization in VLSI Circuit Design and Spatial Clustering
by
Upavan Gupta
A dissertation submitted in partial fulfillmentof the requirements for the degree of
Doctor of PhilosophyDepartment of Computer Science and Engineering
College of EngineeringUniversity of South Florida
Major Professor: Nagarajan Ranganathan, Ph.D.Dewey Rundus, Ph.D.
Srinivas Katkoori, Ph.D.Kandethody M. Ramachandran, Ph.D.
Date of Approval:May 30, 2008
Keywords: expected utility theory, game theory, nash equilibrium, risk averse optimization, processvariations, gate sizing, pattern recognition, search and rescue robotics
© Copyright 2008, Upavan Gupta

DEDICATION
To my wonderful parents,
with all my love and respect.

ACKNOWLEDGEMENTS
I would like to take this opportunity to thank Professor Nagarajan Ranganathan for providing
me the opportunity to work with him on interesting problems.I am most grateful to him for his con-
tinuous encouragement, motivation, and valuable suggestions from his vast experience. His patience,
guidance, and emotional support during difficult times havebeen instrumental in inspiring me to be-
come a good researcher, and more importantly, a better person. I consider myself extremely fortunate
for having worked with such an eminent scholar and an inspiring teacher. I would also like to thank
Professor Dewey Rundus, Professor Srinivas Katkoori, and Professor Kandethody M. Ramachandran
for their time and valuable suggestions. My sincere acknowledgments to Semiconductor Research
Corporation (grant # 2007-HJ-1596) and National Science Foundation (Computing Research Infras-
tructure grant # CNS-0551621) for supporting this researchin parts.
My peers and friends from the lab have made the years spent in pursuing this degree feel shorter.
Their constructive ideas and discussions have been extremely useful in improving the quality of this
research. On the personal front, I would like to thank my parents, who have always stood by me, and
have been a constant source of inspiration. At an early age they inculcated an attitude that nothing
is impossible and there are no shortcuts in life. My lovely sister and my brother-in-law have been
emotionally very supportive all this time. My good friend Kevin Frenzel has always been there for
me. I would also like to thank my friends, Sunny, Sonali, Piyoosh, Himanshu, Kadambari, Sanjay,
Mahalingam, and Shekhar, for their love and support. Finally, I thank my wife Shikha for all the
efforts she has made that enabled me to sail smoothly throughthe demanding times.

NOTE TO READER
The original of this document contains color that is necessary for understanding the data. The
original dissertation is on file with the University of SouthFlorida library in Tampa, Florida.
TABLE OF CONTENTS
LIST OF TABLES iv
LIST OF FIGURES v
LIST OF ALGORITHMS vii
ABSTRACT viii
CHAPTER 1 INTRODUCTION 11.1 Motivation 51.2 Why Utilitarian Approaches? 61.3 Scope and Contributions 71.4 Outline of Dissertation 10
CHAPTER 2 BACKGROUND AND RELATED WORK 112.1 Utility Theory 11
2.1.1 Expected Utility Theory and Risk Aversion 132.1.1.1 Expected Utility 132.1.1.2 Risk Aversion 14
2.1.2 Game Theory and Nash Equilibrium 162.1.2.1 Classification of Games 192.1.2.2 Mathematical Representation 202.1.2.3 Critique of Game Theory 21
2.2 Mathematical Programming 222.3 VLSI Circuit Optimization 23
2.3.1 Process Variations 262.4 Variation Aware Gate Sizing 27
2.4.1 Optimization Metrics 282.4.2 Optimization Methods 31
2.5 Spatial Data Clustering 322.5.1 Clustering Techniques 32
CHAPTER 3 EXPECTED UTILITY BASED CIRCUIT OPTIMIZATION 353.1 Issues in Circuit Optimization 353.2 Expected-Utility Based Modeling 39
3.2.1 Deterministic Modeling 433.3 Parametric Models 44
3.3.1 Delay, Process Variations and Spatial Correlation 453.3.2 Leakage and Dynamic Power 463.3.3 Crosstalk Noise 47
i

3.4 Stochastic to Deterministic Gate Sizing 493.4.1 Stochastic Optimization Problem 493.4.2 Deterministic Equivalent Model 52
3.5 Experimental Results 533.5.1 Setup 543.5.2 Sensitivity of Utility Assurance Constant 563.5.3 Risk Averse Optimization Results 573.5.4 Optimization Considering Device and Interconnect Variations 59
3.6 Discussion 61
CHAPTER 4 INTEGRATED FRAMEWORK FOR CIRCUIT OPTIMIZATION 644.1 Need for Integrated Framework 654.2 Single Metric Optimization Models 66
4.2.1 Unconstrained Delay Optimization 674.2.2 Power Optimization Under Delay Constraints 674.2.3 Crosstalk Noise Optimization Under Delay Constraints 68
4.3 Integrated Framework for Variation Aware Gate Sizing 694.3.1 Objective Function Modeling 694.3.2 Integrated Framework 714.3.3 Mathematical Programming Methodology 724.3.4 Paths to Nodes 75
4.4 Experimental Results 764.4.1 Simulation Setup 764.4.2 Optimal Noise Margins 774.4.3 Determination of Timing Specification 794.4.4 Leakage Power, Dynamic Power, and Crosstalk Noise Optimization 804.4.5 Single Metric Optimization Results 814.4.6 Results for Priority Based Optimization 83
4.5 Discussion 84
CHAPTER 5 A MICROECONOMIC APPROACH TO SPATIAL DATA CLUSTERING 875.1 Spatial Data Clustering 875.2 Why Game Theory for Clustering? 895.3 Microeconomic Clustering Algorithm 90
5.3.1 Mathematical Partitioning 905.3.2 Multi-Step Normal Form Game Model 92
5.3.2.1 Identification of Players 945.3.2.2 Definition of Strategy 955.3.2.3 Payoff Function 975.3.2.4 Nash Equilibrium Solution 98
5.3.3 Ensemble Based Game Theoretic Clustering 995.3.4 Analysis of Game Theoretic Algorithm 100
5.3.4.1 Computational Complexity Analysis 1005.3.4.2 Nature of Algorithm Execution 101
5.4 Experimental Results 1015.4.1 Simulation Setup 1025.4.2 Experiments with Existing Data Sets 1035.4.3 Experiments with Artificial Data Sets 105
ii

5.4.4 Fairness of Clustering 1075.4.5 Sensitivity Analysis 108
5.4.5.1 Data Set Similarity Measure 1085.4.5.2 Number of Players and Strategies 1085.4.5.3 Execution Time 111
5.5 Discussion 111
CHAPTER 6 GAME THEORETIC APPROACH TO ROBOT TEAM FORMATION 1156.1 Problem Description 1156.2 Why Microeconomics for Robot Team Formation? 1206.3 Background 1206.4 Microeconomic Modeling 122
6.4.1 KMeans Partitioning 1226.4.2 Game Theoretic Partitioning of Robots 123
6.5 Experimental Results 1256.5.1 Simulation Tools and Setup 1266.5.2 Analysis 126
6.6 Discussion 129
CHAPTER 7 CONCLUSIONS AND FUTURE DIRECTIONS 130
REFERENCES 134
LIST OF PUBLICATIONS 142
ABOUT THE AUTHOR End Page
iii
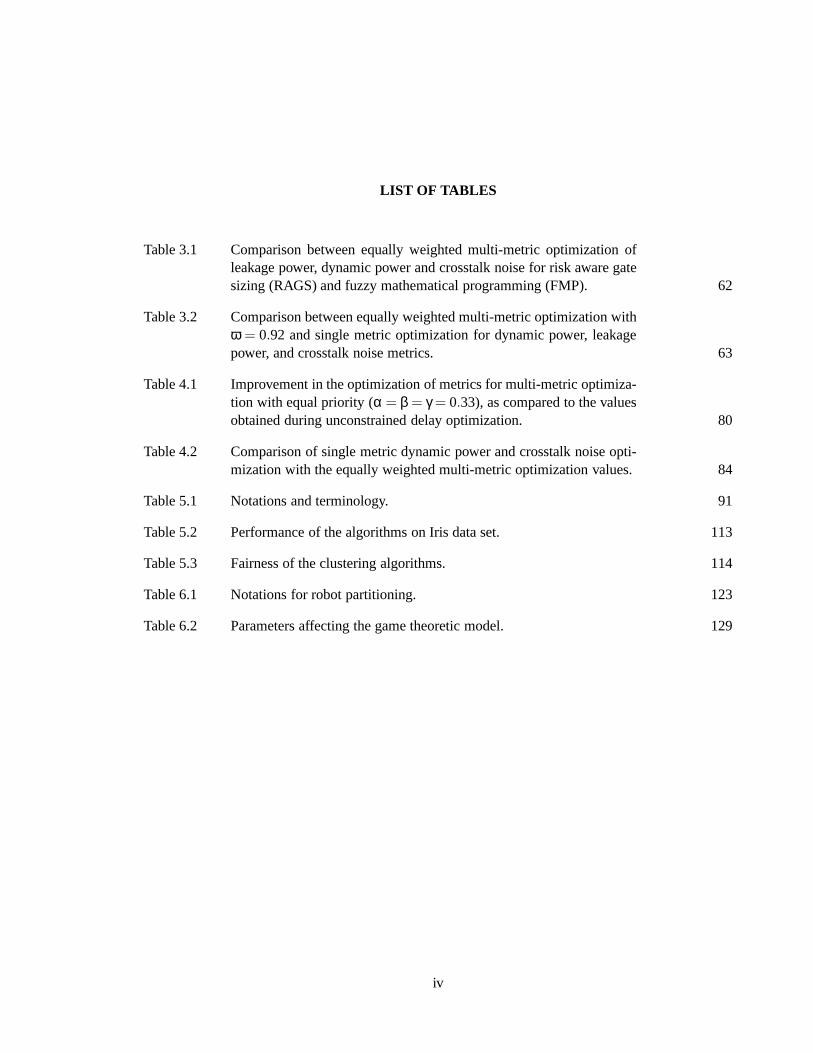
LIST OF TABLES
Table 3.1 Comparison between equally weighted multi-metric optimization ofleakage power, dynamic power and crosstalk noise for risk aware gatesizing (RAGS) and fuzzy mathematical programming (FMP). 62
Table 3.2 Comparison between equally weighted multi-metric optimization withω = 0.92 and single metric optimization for dynamic power, leakagepower, and crosstalk noise metrics. 63
Table 4.1 Improvement in the optimization of metrics for multi-metric optimiza-tion with equal priority (α = β = γ = 0.33), as compared to the valuesobtained during unconstrained delay optimization. 80
Table 4.2 Comparison of single metric dynamic power and crosstalk noise opti-mization with the equally weighted multi-metric optimization values. 84
Table 5.1 Notations and terminology. 91
Table 5.2 Performance of the algorithms on Iris data set. 113
Table 5.3 Fairness of the clustering algorithms. 114
Table 6.1 Notations for robot partitioning. 123
Table 6.2 Parameters affecting the game theoretic model. 129
iv

LIST OF FIGURES
Figure 1.1 Scope and contributions of the dissertation. 8
Figure 2.1 A utility based system from the perspective of a rational agent. 12
Figure 2.2 A function representing the relationship between expected utility andrisk aversion. 15
Figure 2.3 A simple example of two player non-cooperative normal form game. 17
Figure 2.4 Generation of the strategy sets, identification of the dominant strate-gies, and Nash equilibrium in prisoners’ dilemma game. 19
Figure 2.5 Variation impact at different technology nodes [1]. 28
Figure 2.6 Taxonomy of the variation aware gate sizing works. 29
Figure 3.1 Utility curve for a random function. 42
Figure 3.2 A coupling structure with single victim-aggressor pair setting. 48
Figure 3.3 Simulation setup for the risk averse gate sizing optimization problem. 55
Figure 3.4 Improvement in the timing yield of the circuits for different values ofω. 57
Figure 3.5 Percentage improvement in the optimization of the objective functionfor various values ofω. 58
Figure 3.6 Impact of interconnect variations and gate size variations on the opti-mization of the metrics. 60
Figure 4.1 Gate sizing framework for multi-metric circuit optimization. 72
Figure 4.2 Flowchart for simulation setup. 78
Figure 4.3 Effect of different noise tolerance values on theoptimality of the objectives. 79
Figure 4.4 Average improvement in the metrics values for simultaneous multi-metric optimization as compared to the deterministic worstcase pes-simistic analysis. 81
Figure 4.5 Effect of single metric leakage power optimization as compared toequally weighted multi-metric optimization. 82
v

Figure 4.6 The improvement in leakage power and dynamic power when opti-mized with prioritiesα = 0.5, β = 0.5, andγ = 0 as compared to thescenario whereα = 0.33,β = 0.33, andγ = 0.33. 85
Figure 4.7 Comparative study of leakage power optimizationin three differentscenarios, unconstrained delay optimization, single metric leakage poweroptimization, and multi-metric optimization. 85
Figure 5.1 Identification of optimum clusters using game theoretic clustering (GTK-Means) and KMeans methodologies. 94
Figure 5.2 An example for definition of strategy. 97
Figure 5.3 Performance of the algorithms on the British Towndata set. 104
Figure 5.4 Performance of the algorithms on the German Town data set. 105
Figure 5.5 Average improvement in the compaction objectivefor the experimentson artificial data sets. 106
Figure 5.6 Average improvement in the equi-partitioning objective for the exper-iments on artificial data set. 107
Figure 5.7 Effect of data set similarity measure on the execution time of the GTK-Means algorithm. 109
Figure 5.8 Relationship between the execution time and the number of clusters. 110
Figure 5.9 Average number of players and strategies for different cluster sizes. 110
Figure 6.1 Example of a multi-emergency situation in a suburban area. 117
Figure 6.2 An example of search and rescue robot deployment in multi-emergencyscenario. 118
Figure 6.3 Effect of high communication overhead on the search and rescue pro-cess. 118
Figure 6.4 Partitioning of robots such that the intra-cluster communication is min-imized, and each partition has a head node responsible for inter-clustercommunication. 119
Figure 6.5 Partitioning results for robot team formation using KMeans algorithm. 119
Figure 6.6 Identification of optimum sizes of the clusters and the locations of thecluster centers using game theoretic algorithm, and KMeansalgorithm. 127
Figure 6.7 Average performance of algorithms on artificial data sets. 128
vi

LIST OF ALGORITHMS
Algorithm 4.1 Multi-metric gate sizing algorithm 73
Algorithm 5.1 KMeans partitioning 92
Algorithm 5.2 Game theoretic algorithm 93
Algorithm 5.3 Generation of strategy set 96
Algorithm 5.4 Payoff matrix generation 98
Algorithm 5.5 Nash equilibrium algorithm 99
Algorithm 6.1 Microeconomic robot team clustering algorithm 124
vii

UTILITARIAN APPROACHES FOR MULTI-METRIC OPTIMIZATION IN V LSI CIRCUITDESIGN AND SPATIAL CLUSTERING
Upavan Gupta
ABSTRACT
In the field of VLSI circuit optimization, the scaling of semiconductor devices has led to the
miniaturization of the feature sizes resulting in a significant increase in the integration density and size
of the circuits. At the nanometer level, due to the effects ofmanufacturing process variations, the de-
sign optimization process has transitioned from the deterministic domain to the stochastic domain, and
the inter-relationships among the specification parameters like delay, power, reliability, noise and area
have become more intricate. New methods are required to examine these metrics in a unified manner,
thus necessitating the need for multi-metric optimization. The optimization algorithms need to be ac-
curate and efficient enough to handle large circuits. As the size of an optimization problem increases
significantly, the ability to cluster the design metrics or the parameters of the problem for computa-
tional efficiency as well as better analysis of possible trade-offs becomes critical. In this dissertation
research, several utilitarian methods are investigated for variation aware multi-metric optimization in
VLSI circuit design and spatial pattern clustering.
A novel algorithm based on the concepts of utility theory andrisk minimization is developed for
variation aware multi-metric optimization of delay, powerand crosstalk noise, through gate sizing. The
algorithm can model device and interconnect variations independent of the underlying distributions
and works by identifying a deterministic linear equivalentmodel from a fundamentally stochastic
optimization problem. Furthermore, a multi-metric gate sizing optimization framework is developed
that is independent of the optimization methodology, and can be implemented using any mathematical
programming approach. It is generalized and reconfigurablesuch that the metrics can be selected,
removed, or prioritized for relative importance dependingupon the design requirements.
viii

In multi-objective optimization, the existence of multiple conflicting objectives makes the cluster-
ing problem challenging. Since game theory provides a natural framework for examining conflicting
situations, a game theoretic algorithm for multi-objective clustering is introduced in this dissertation
research. The problem of multi-metric clustering is formulated as a normal form multi-step game
and solved using Nash equilibrium theory. This algorithm has useful applications in several engineer-
ing and multi-disciplinary domains which is illustrated byits mapping to the problem of robot team
formation in the field in multi-emergency search and rescue.
The various algorithms developed in this dissertation achieve significantly better optimization and
run times as compared to other methods, ensure high utility levels, are deterministic in nature and
hence can be applied to very large designs. The algorithms have been rigorously tested on the ap-
propriate benchmarks and data sets to establish their efficacy as feasible solution methods. Various
quantitative sensitivity analysis have been performed to identify the inter-relationships between the
various design parameters.
ix

CHAPTER 1
INTRODUCTION
The advances in science and technology impact the realm of engineering. The most important
facet of the technology evolution is that it facilitates thedevelopment of improved products, and helps
in applying the knowledge and intelligence gained from one discipline to advance other disciplines.
The important objectives in developing these products are,incorporation of enhanced feature sets,
improvement in performance, and miniaturization. One way to achieve these objectives is to scale
down the dimensions of various constituent elements or components of these products so that more
components can be integrated on it. Improvements in the fabrication technologies aid in achieving
these goals. However, the transition from one technology level to another is not rudimentary, and it
uncovers new concerns. In the context of very large scale integrated computer aided design (VLSI-
CAD), specifically circuit optimization, these concerns can be explained as follows.
With the aggressive scaling of semiconductor devices to thenano-meter level, the integration den-
sity of the circuits increases. According to the International Technology Roadmap for Semiconductors
(ITRS) [2], the feature sizes for the devices and interconnects will continue to scale down at the rate
of 0.7x per generation. This reduction in sizes affect the circuit optimization process in several ways.
First, as the wiring density and consequently the aspect ratios in the metal lines increase, the cross-
coupling capacitance between the neighboring interconnects grows. This may result in an increase in
the interconnect crosstalk noise on a wire, due to the chargeinjected in it during the switching in the
neighboring nets. In the deep sub-nanometer designs, such coupling capacitance effects between the
adjacent nets can cause functionality failures causing reliability issues [3]. The noise due to cross-
coupling capacitance is a dominant component among the noise sources, and hence is an essential
consideration during the circuit optimization process. Second, the demand for power sensitive devices
has grown significantly in recent years. This is attributed to the remarkable growth of personal com-
puting and mobile devices such as laptop computers, cellular phones, music players and other portable
1

devices that are predominantly battery driven. These devices demand high-speed computational func-
tionalities with low power consumption. However, as the integration density of transistors in a die and
the frequency of operations increase, the power consumption in a die increases with each generation.
To maintain low power dissipation, supply voltage is scaleddown. However, the scaling of supply
voltage is limited by the high-performance requirements. In order to maintain the performance, the
transistor threshold voltage should be scaled down to achieve low switching energy per device. Scal-
ing of threshold voltage significantly increases the sub-threshold leakage current [4], resulting in high
leakage power dissipation during standby. Thus, at the sub-nanometer level, power minimization is an
important metric in the circuit optimization process alongwith the performance metric. Hence, with
the scaling of technology, new paradigms that impact the performance and reliability of the designs
become an integral part of the design and optimization process.
The inter-relationships between these optimization metrics have become more intricate in the
nano-meter regime. Optimization of one metric alone may result in a performance shift from one
metric to another, thereby introducing sub-optimality in the values of other metrics. As a simple
example, if some circuit optimization technique is employed with an objective of only power min-
imization, the resulting circuit configuration may potentially have high interconnect crosstalk noise,
and hence low signal reliability. Alternatively, if the optimization is performed with the objective of
crosstalk noise minimization, the resulting design may notbe low power dissipating, thereby affecting
the performance of the device. Addressing these aspects of optimization are important considerations
in the next generation circuit optimization.
As the process technology is scaled down, the limitations due to manufacturing processes and en-
vironmental noise, make the physical realization of devices and interconnects unpredictable during the
front-end design. During the fabrication of semiconductordevices, the existence of non-uniform con-
ditions at the deposition and diffusion stages, or due to thelimited resolution of the photolithographic
process, the parameters like oxide thickness, effective gate length of individual transistors and inter-
connect widths may not follow the specifications. These variations may result in dramatic changes
in the device performance characteristics, as well as the reliability of the designs. As a result, the
design and optimization problem has transitioned from the deterministic domain to the probabilistic
domain [5]. Also, these process tolerances do not scale proportionally, thereby increasing the relative
impact of process variation on the design process with each new technology node.
2

This transition of optimization process to the stochastic domain affects the circuit optimization
process. Since, the stochastic optimization techniques are inherently slower than their deterministic
equivalents, the optimization process is adversely affected. In recent years, the state of the art research
in VLSI design automation has addressed this issue. Severalcircuit optimization methods have been
developed with an objective of centering the designs specifications such that majority of the fabricated
circuits follow design and performance specifications. Many of these methods are based on the as-
sumptions that the variation sources of the components follow specific distributions, such as Gaussian
distribution, identified during the preliminary analysis [6, 7]. However, recent research refute such
assumptions [8, 9]. Additionally, more sources of process variation are becoming predominant as the
level of miniaturization is increasing, which is a principal concern in the semiconductor industry.
As a result of technology scaling, more components are integrated on the design area. Consider-
ing a simple example, the recent Intel Itanium®processor, code named ’Tukwila’, released in 2008 is
a two billion transistor chip [10] manufactured with 65nm technology. The total area of the chip is
699mm2 as compared to the billion transistor Itanium ’Montecito’ chip with a design area of 580mm2.
Although the number of transistors have doubled, the chip area has increase only by 20%. Due to the
increase in the number of components, and consequently the problem size, the optimization process
becomes significantly slow. In a general optimization problem, the size of a problem can be reduced
by partitioning it into several smaller clusters, and performing optimization in each cluster separately.
However, the clustering problem is not elementary, and any technique developed specifically for clus-
tering of data objects in one knowledge discipline may not bedirectly applicable for clustering in other
disciplines.
In spatial pattern clustering, several techniques have been developed for various applications in
a wide variety of scientific disciplines such as biology, computer vision and pattern recognition, and
communications and computer networks [11,12]. These techniques are largely application specific and
perform single metric optimization. Hence, they may not be applicable to the applications like VLSI
design partitioning, rescue robots deployment, ad-hoc networks establishment, and multi-emergency
resource management etc. Often, multiple competitive metrics are required to be targeted for opti-
mization in these engineering domains. To understand this problem, we can consider a hypothetical
multi-emergency environment where an ad-hoc network of nodes (rescue personnel, resources etc.)
performing the rescue operations at different emergency locations is to be established over a wireless
3

link. Even though each node may have identical capabilities, due to the battery power constraints,
a subset of nodes are required to be identified that would be responsible for inter- and intra-cluster
communication. An optimal clustering mechanism must ensure that the nodes, as well as the complete
clusters do not drop out of the network. A clustering performed on the basis of one metric, saycluster
compactnessfor low power dissipation in intra-cluster communication,may result in a situation where
some clusters are too large and some are too small. The non-uniform power distribution among the
clusters in this case may result in a situation where the battery of the nodes in smaller clusters may
soon get exhausted, and the nodes drop out of the system. Thiswould result in loss of communication
from the emergency locations these nodes were servicing.
The exponential nature of such clustering problems qualifies the application of heuristics based op-
timization methodologies. However, any heuristic approach may not be adequate for spatial clustering
in this domain due to some inherent characteristics of theseproblems. First, the optimization metrics
here are often competitive in nature, and hence can not be optimized using the classical heuristics based
optimization methods that perform a single metric optimization, such as genetic algorithms, simulated
annealing etc. The clustering problem described above, represent one such class of problems. The two
objectives, cluster compactness and uniform power distribution are conflicting in nature and need to be
optimized simultaneously. Second, in several applications of this type, each objective to be optimized
during the clustering process is critical. In terms of the clustering performance, this translates to a
situation where the success of a clustering methodology is ascertained by the mutual satisfaction of
the optimizations corresponding to each objective in the problem. Formally, this metric of success is
termed as thesocial fairness[13] of the system. A concept widely studied and used in the field of
economics, social fairness of a system corresponds to a situation where each individual (or metric) in
the system is satisfied with respect to every other individual in the system, and the overall goals are
achieved. In this example, the social fairness of the partitioning mechanism for the ad-hoc network
clustering problem is maximized if both the objectives, compactness and uniform power distribution
are satisfied (optimized) with respect to each other. The mutual satisfaction ensures that all the metrics
are considered with the same priority level, and at an equilibrium solution point, any improvement in
one metric can only be achieved by worsening the optimization of other metrics.
The speed of technology evolution decides the lifetime of the products. The lifespan of the prod-
ucts is shrinking due to rapid improvement in the manufacturing technology. This entails the designers
4

to identify and develop generalized optimization methods capable of incorporating the design objec-
tives of the future generation products, and are applicableto multiple disciplines with relative ease.
The objectives may include examination of additional metrics during optimization, and investigation
and incorporation of the effect of randomness at several levels. The optimization frameworks capable
of addressing these issues effectively would be beneficial for the community.
1.1 Motivation
The issues discussed above give a strong intuition about theproblems that will be prevalent in the
next generation computer engineering research. More precisely, in the VLSI-CAD, the technology
trends [2] suggest that with the aggressive scaling of devices the uncertainties due to process varia-
tions are expected to worsen in future. The dimensionality of the circuit optimization process will
further expand due to an increasing impact of design components affecting the performance and relia-
bility of the circuits. Also, the multi-fold escalation in the design density of the circuits is inevitable.
Thus, the circuit optimization methodologies capable of addressing only the problems occurring in
current technology generation may not scale well with the next generation issues. The single met-
ric optimization methods that result in a performance shiftfrom one objective to another and are not
generalized to incorporate additional metrics are no longer acceptable. Hence, an important challenge
in the VLSI circuit optimization is to identify vertically as well as horizontally integrated solution
methodologies [14].
Likewise, the existing methods in data clustering are incapable of addressing the clustering require-
ments for various multi-disciplinary engineering applications. Specifically, these applications require
methods capable of simultaneously examining multiple metrics during clustering. Also, a clustering
method must satisfy the social fairness [13] from the perspective of each clustering criterion. This
would ensure that each clustering metric is satisfied with respect to every other metric in the system.
The motivation for this dissertation is to explore the core issues in these problem domains, and
develop new multi-metric optimization approaches that exhibit the following features.
• A framework that is generalized in its ability to incorporate any number of optimization metrics
that may be necessary to be optimized for feasible solutionsto the problems. Also, the frame-
5

work should be reconfigurable to enable relative prioritization of the metrics to be optimized as
per the requirements.
• A domain independent approach that is easily portable to solve the optimization problems in
several knowledge disciplines.
• An approach that is fast, scalable to larger problem sizes, accurate in terms of optimizations,
and feasible to solve real problems.
• A method that is capable of addressing the impact of randomness at several avenues. In the
context of VLSI circuit optimization this property is extremely important for addressing the
impact of process variations in multiple design components.
• An approach that is capable of inherently modeling the multi-objective optimization problems
where the objectives are competing or conflicting in nature.
• A methodology that can guarantee the optimization is performed from the perspective of each
metric, and hence satisfies the social fairness property.
Several flavors of utilitarian optimization methods have been widely applied to solve the problems
in the field of economics and finance [15]. In recent years, computer scientists have explored the
realm of utilitarian methods to solve various computer science [16–23] and computer engineering
[24–26] problems. The successful implementation of utilitarian approaches in these application areas
has benefited the engineering research community. This encouraged us to explore these methods to
solve the problems in VLSI-CAD and spatial pattern clustering.
1.2 Why Utilitarian Approaches?
The utility theoretic approaches are attractive as optimization methodologies due to some of unique
features and properties that they possess. The two variantsof the utilitarian methods are game theo-
retic optimization techniques and expected utility theorybased techniques. Game theory [27, 28] is a
microeconomic approach for visualizing a problem as a situation that consists of several players, each
player competing with all other players in the system and trying to maximize its own utility or gains
from the system. In this competitive setting, an equilibrium point is identified that maximizes the
6

utility of each player with respect to every other player in the game. Thus, the performance criteria of
the systems as a whole are determined by a combination of the performance criteria of the individual
agents. The salient features of game theory that serve as reasons for application to the optimization
problems are:
• The situations of conflict and cooperation are most effectively modeled as games [29–31].
• Game theoretic models have simple and well defined environments for a variety of problems.
• A methodology likeNash equilibriumthat identifies a socially fair solution, perfectly comple-
ments the problems modeled as a game. The social fairness of the solution is a particularly
attractive feature from the perspective of multi-metric spatial clustering.
The expected utility theory [32] was proposed by Von Neumannand Morgenstern in 1944, as a sound
prescription for rational decision-making. This theory has been widely studied and applied in the var-
ious fields of science and engineering like political sciences, finance, economics, computer networks,
and distributed computing. The success of utility theory isattributed to the fact that it enables the
designers (or decision makes) to visualize the optimization problems from a different perspective. As
a simple example, let us consider a stochastic optimizationproblem in the mathematical programming
setting, where the objectives are to be minimized while satisfying the constraints that are randomized
in nature. In the expected utility framework, this optimization problem can be conceived as an opti-
mization problem in which the risk of failure of constraintsis minimized by maximizing the expected
utility of the constraints. In large scale stochastic optimization problems, like those in VLSI-CAD,
this may help in substantially reducing the size of the problem, as well as translating a stochastic
optimization problem to the deterministic equivalent under certain situations.
1.3 Scope and Contributions
This dissertation explores the various optimization issues currently existing in the VLSI-CAD
field, specifically at the circuit level. It also identifies the concerns for spatial data clustering from the
viewpoint of its applications in several multi-disciplinary areas. We identify the different metrics that
are required to be examined for pragmatic solutions to theseproblems. The state of the art research
is studied to evaluate the feasibility, portability and scalability of the existing solution methodologies
7

for next generation technologies and emerging research disciplines. The generalized multi-metric
optimization frameworks based upon the utilitarian methods are developed to solve these problems.
The theme of this dissertation and the major contributions are summarized in Figure 1.1. A short
description of the research works that contributed to the dissertation is as follows.
Figure 1.1 Scope and contributions of the dissertation. Thetheme of the dissertation is to identify anddevelop new multi-metric optimization methods for VLSI circuit optimization and spatial data andpattern clustering.
• Expected Utility Based Optimization: Multi-objective optimization of delay, leakage power, dy-
namic power and crosstalk noise in VLSI circuits is performed via gate sizing using a method-
ology that is based on the concepts of expected utility theory and constraint risk minimization.
It identifies a deterministic equivalent model of the stochastic optimization problem using the
concepts of bounded rationality. The methodology is variation distribution independent, and
identifies solutions with high levels of utility, in the presence of scarce information about the
distribution of the process variations. The method is capable of addressing the impact of pro-
cess variations and randomness at several levels, both in the objective function as well as in the
8

constraints. This approach effectively tries to minimize the risk of violation or failure of the con-
straints in the model, evaluated and controlled by an expected utility measure that is maximized
to ensure that a constraint is satisfied. The deterministic model identified using this approach is
especially attractive for optimization in large scale VLSI-CAD problems.
• Integrated Framework for Circuit Optimization: In this work, a new variation aware multi-
metric gate sizing framework has been developed, which can be used to perform optimization of
several metrics like delay, leakage power, dynamic power, and crosstalk noise etc. The proposed
framework is completely reconfigurable and generalized in terms of its capability to incorporate
new metrics and selectively prioritize the metrics depending upon the design requirements, with
minimal changes in the model. More importantly, any mathematical programming approach
can be utilized within this framework, to solve the optimization problem. The process variation
effects are incorporated as stochastic components in the delay model. An important aspect of
the proposed framework is the identification of the inter-relationships between dynamic power,
leakage power, and crosstalk noise in terms of gate sizes, and modeling them in a unified manner.
• A Microeconomic Approach to Spatial Data Clustering: A novel multi-objective clustering ap-
proach that is based on the concepts of microeconomics, specifically game theory, has been
developed in this work. This approach is capable of simultaneously optimizing multiple con-
flicting objectives. The methodology consists of three components, an iterative hill climbing
based partitioning algorithm, a multi-step normal form game theoretic formulation, and a Nash
equilibrium based solution methodology. The normal form non-cooperative game consists of
randomly initialized clusters as players that compete for the allocation of resources (data ob-
jects). The Nash equilibrium based methodology evaluates asolution that is socially fair for
all the players, and any mathematical hill climbing algorithm can be used to update the clusters
after each iteration of the game.
• Robot Team Formation: The rescue robot teams formation problem in the multi-emergency
search and rescue environments is a practical application of the microeconomic spatial clustering
algorithm being developed. In these environments, robots performing the search and rescue
operations in the field are required to be divided into teams since the power dissipation in inter-
robot communication and the robot to base station communication is high, while the robots are
9

running primarily running on batteries, and each emergencylocation is required to be attended
all the time. Dropping out of all the robots servicing a locality would significantly hamper the
rescue process. Thus, in this work, robot teams are created on the basis of cluster compaction
and uniform power distribution objectives to identify decentralized robot teams with each robot
in a team closest to its communication gateway, as well as each team is equally represented in
terms of its strength (battery power).
1.4 Outline of Dissertation
The remainder of this dissertation is organized in six chapters. Chapter 2 describes the background
and the state of the art research related to the problems being addressed in this dissertation. Specifi-
cally, a short tutorial of the important concepts in expected utility theory, mathematical programming,
and game theory is presented. Also, the state of the art research in the field of variation aware circuit
optimization, and data and pattern clustering is describedin details. In Chapter 3, a risk averse util-
itarian approach VLSI circuit optimization under scarce information about the process variations is
presented. This is a post layout gate sizing approach for multi-metric optimization. Here, the expected
utility theoretic methodology is applied to convert the stochastic optimization problem to a determinis-
tic equivalent model. In Chapter 4, an integrated frameworkis developed for multi-metric optimization
of delay, leakage power, dynamic power, and crosstalk noiseconsidering the effect of process vari-
ations in the nanoscale VLSI circuits. This gate sizing framework is completely reconfigurable and
generalized to incorporate, remove or prioritize the metrics to be optimized. Chapter 5 defines the
problem of multi-objective spatial clustering in the context of novel multi-disciplinary application ar-
eas, and develops a novel game theoretic clustering algorithm. The different components of the game
theoretic modeling are explained in details and the simulations are performed to evaluate the efficacy
of the proposed method. In Chapter 6, the problem of robot teams formation in the multi-emergency
search and rescue environments is described. The game theoretic clustering algorithm being devel-
oped and discussed in Chapter 5 is adapted to solve this problem by forming teams on the basis two
optimization objectives cluster compaction, and uniform power distribution. The concluding remarks
and the suggested future work in terms of extensions to the problems addressed in this dissertation,
and other ideas for further refinements are given in Chapter 7.
10

CHAPTER 2
BACKGROUND AND RELATED WORK
In this chapter, we present a brief introduction of the various concepts that form the basis for the
research described in this dissertation. Specifically, we discuss the expected utility theoretic approach
and the game theory approach. These approaches are used to solve the multi-metric optimization
problems in the context of VLSI circuit design and spatial pattern clustering problems. The utility
theory is used for solving the VLSI circuit design optimization problem, specifically, gate sizing.
Game theory is applied in solving the multi-objective pattern clustering problem. Since, stochastic
and mathematical programming methods are used in the proposed solution, some background on these
topics is provided. We briefly introduce the various VLSI circuit optimization techniques available in
the literature, and present issue of VLSI manufacturing process variations effects in the nanometer
regime. A detailed discussion of the various related works for VLSI circuit optimization and spatial
pattern clustering is also presented in this chapter.
2.1 Utility Theory
A utilitarian theory forms the ethical framework for effective moral action. In this framework,
the measure of satisfaction is quantified in terms of the utility of the satisfaction, and is attempted to
be maximized by an individual. The utility is often measuredas the happiness, as the satisfaction of
preferences, or the preference utilitarianism. The philosophy behind the utility theory is to achieve the
greatest good for the greatest number. Utility theory has been used as a framework to argue for the
value of different actions. Two primary variants of the utility theory in terms of the expected utility
optimization exist in the literature. In the first form, the individuals, also known as the agents, try
to formulate and act under guidance of rules that maximize the utility if they were to be consistently
followed. Alternatively, in the second variant, the goal isto minimize negative utility rather than
maximizing the positive utility.
11

The utility of an action or a state of environment maps the state onto a real number to describe
the degree of satisfaction from the state [33]. This notion of the utility has two important implications
in terms of the goals. First, the scenarios where the goals are competing or conflicting, the utility
function specifies the appropriate trade-off. Second, the situations where several goals are specified,
none of which can be achieved with certainty, the utility function maps the likelihood of success of
each goal according to the weighted importance of the goals.The overall utility based system can be
represented by a simple diagram as shown in Figure 2.1.
Figure 2.1 A utility based system from the perspective of a rational agent. Depending upon the sys-tem’s current state, the agent’s satisfaction from the current state, and the agent’s action, the satisfac-tion of the agent in the system’s next state is identified. Theagent chooses its future actions based onthe change in its satisfaction value due to its own action in the previous state.
On the basis of the number of rational agents interacting in the system, the utility theory can be
categorized as expected utility theory and game theory. In the expected utility theory, the system
assumes a single agent playing a game against the nature, whereas in game theory, multiple agents
interact with the nature and against each other in an autonomous manner.
12

2.1.1 Expected Utility Theory and Risk Aversion
In an environment where the agents may not have complete control or access to the environmental
variables, a situation of uncertainty would arise. As an example, in the semiconductor devices fabri-
cated with the sub-100nm technology nodes, the environmental factors may affect the manufacturing
process significantly, thereby causing inconsistencies inthe fabricated devices. The CAD engineers
are unaware of the degree of disparity between the specifications and the actual designs. This uncer-
tainty changes the way in which an agent (or designer) makes decisions. In the presence of uncertainty,
the actions of the agents shift from deterministic actions to the preferences as a function of the outcome
probabilities of the actions. Theexpected utility functionmaps these preferences to real values.
An actiona of an agentA in the expected utility framework would have a set of possible outcomes
(also known as states)Oi(a) as a consequence of that action. The indexi ranges over the set of
outcomes. Also, corresponding to each actiona, the agentA assigns a probabilityP(Oi(a)|Do(a),K)
to each outcome. Here,Do(a) is the proposition that the actiona results to the associated outcome,
given the agentA’s information or knowledgeK of the environment. Theexpected utilityof an action
given the knowledgeK of the system is given byEU(a|K) as shown in Equation (2.1)
EU(a|K) = ∑i
P(Oi(a)|Do(a),K)U(Oi(a)) (2.1)
Here,U(Oi(a)) corresponds the quantitative measure of the utility of the outcomeOi for the actiona.
According to the principle of maximum expected utility, therational agent should choose an action that
maximizes its expected utilityEU. This notion of utility in terms of probabilities and the outcomes
was proposed by John Von Neumann and Oskar Morgenstern in their 1944 bookTheory of Games
and Economic Behavior[32]. According to this theory, if an agent maximizes a utility function that
correctly reflects the performance measure by which its behavior is being judged, then it will achieve
the highest possible performance for itself.
2.1.1.1 Expected Utility
The utility function maps the states to the real numbers. Hypothetically, the utility of a state
could be any real number depending upon the agent’s choice, and is an arbitrary function. However, in
practice, the preferences of the agents follow a more systematic approach. In a simple economic setup,
13

the utility can be considered as a monotonic preference function of the monetary values. According to
this definition, the utility of the action monotonically increases as the wealth increases in a gambling or
a lottery type of situation. However, the utility may not be alinear function of the expected monetary
value. This can be explained with a simple example. Suppose,in a game of ’deal or no deal’, you have
already won $1,000,000. At this stage, the banker asks you ifyou would like to open one more case
that may have $3,000,000. If the case has $3,000,000, you will win the whole amount; otherwise you
will go home with no money at all. In such a situation, the expected monetary value of the gamble is
0.5∗$0+0.5∗$3,000,000= $1,500,000. This value is greater than your current earnings. However,
would you be willing to play such a gamble? This is a subjective question, and it depends upon several
factors, including your current financial status without the million dollars, the improvement in the life
style a million dollars can bring, and how much you value the additional two millions if you already
have a million dollars. Thus, utility is not directly proportional to the expected monetary value.
2.1.1.2 Risk Aversion
Risk aversion is intuitively defined as situation where an agent, when faced with the choice of
comparable returns, tends to choose the less risky alternative [34]. In an expected utility framework,
this concept can be explained through the concave function graph shown in Figure 2.2. Here,X is
a random variable which can take on two values,x1 andx2. Consideringp be the probability that
x1 happens and (1− p) be the probability thatx2 happens. The expected outcomeE(x) = p∗ x1+
(1− p) ∗x2 is shown on theX axis as a convex combination ofx1 andx2. Considering au : ℜ→ ℜ
be an elementary concave utility function, as shown in Figure 2.2, the expected utility is given as
E(u) = p∗u(x1)+ (1− p)∗u(x2) denoted byB, betweenA = (x1,u(x1)) andC = (z2,u(z2)). Now,
by comparing pointsB andD in Figure 2.2, it is identified that the utility of expected income,u[E(x)]
is greater than expected utilityE(u), given by,
u[p∗x1+(1− p)∗x2] > p∗u(x1)+ (1− p)∗u(x2) (2.2)
Now, we can consider the scenario shown in Figure 2.2 as two lotteries such that one paysE(x) with
certainty and another paysx1 or x2 with probabilitiesp and(1− p) respectively. According to the
Von Neumann-Morgenstern utility notion, the utility of thefirst lottery would beU(E(x)) = u(E(x))
14
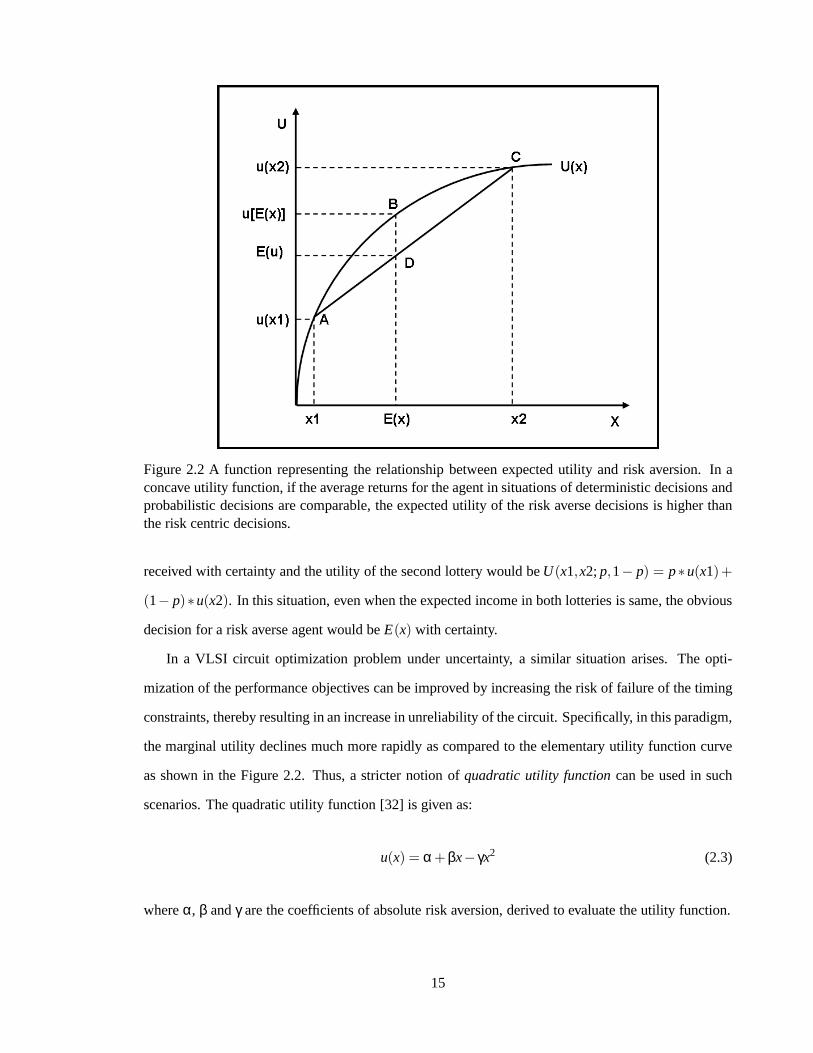
Figure 2.2 A function representing the relationship between expected utility and risk aversion. In aconcave utility function, if the average returns for the agent in situations of deterministic decisions andprobabilistic decisions are comparable, the expected utility of the risk averse decisions is higher thanthe risk centric decisions.
received with certainty and the utility of the second lottery would beU(x1,x2;p,1− p) = p∗u(x1)+
(1− p)∗u(x2). In this situation, even when the expected income in both lotteries is same, the obvious
decision for a risk averse agent would beE(x) with certainty.
In a VLSI circuit optimization problem under uncertainty, asimilar situation arises. The opti-
mization of the performance objectives can be improved by increasing the risk of failure of the timing
constraints, thereby resulting in an increase in unreliability of the circuit. Specifically, in this paradigm,
the marginal utility declines much more rapidly as comparedto the elementary utility function curve
as shown in the Figure 2.2. Thus, a stricter notion ofquadratic utility functioncan be used in such
scenarios. The quadratic utility function [32] is given as:
u(x) = α+ βx− γx2 (2.3)
whereα, β andγ are the coefficients of absolute risk aversion, derived to evaluate the utility function.
15

2.1.2 Game Theory and Nash Equilibrium
Game theory can be defined as a collection of mathematical models formulated to study the situa-
tions of conflict and cooperation between intelligent rational decision-makers. Game theory analysis
situations in which two or more individuals make decisions that will influence one another’s welfare.
These decision makers, also known as theplayers, choose from a finite list of alternative courses of
actions, leading to well defined outcomes expressed in termsof numerical payoffs associated with the
chosen course of action for each decision maker.
Formally, modern game theory began with the publication of the seminal book by Von Neumann
and Morgenstern in 1944 [35]. In 1951, John Nash described anequilibrium concept [36] for non-
cooperative games as a configuration of strategies that ensures a win-win situation for all decision
makers. This concept of cooperation under non-cooperativeenvironments was phenomenal, and as a
result game theory has been successfully applied extensively in the field of economics, engineering
[25] [24] [16], and several other real life situations of decision making under uncertainty.
The important elements of a game are categorized as players,strategies, strategy sets, strategy
combinations, payoffs, information, and equilibrium. Theplayers are a set of rational decision makers,
each having a set of strategiesSi = {si} available with them. A strategysi is a rule that a playeri
uses to choose an action at each instance of the game. Corresponding to each strategy, a utility is
associated, which is represented as a payoff denoted byPi(s1, · · · ,sN) that i tries to maximize. A
strategy combination is an ordered sets = (s1, · · · ,sN) that consists of one strategy for each ofN
players, and one such combination that maximizes every player’s payoff in the game is identified as
an equilibrium point.
The idea behind game theory can be explained with the aid of aninteresting and a classical example
of prisoners’ dilemma. Consider a situation where the police has convicted two computer programmers
Robin and David in a case of critical data theft from the database of the company that employs them.
The police is assured that they are guilty, but they could notprove it since there are no witnesses. So,
the police is dependent upon the convicts’ testimonies to identify who is guilty. The police decides
to keep them in separate rooms for interrogation. The convicts are given only two options, confess
or refuse. The police has decided to assign different penalties for the convicts depending upon their
16

independent responses, as well the combination of the responses of both convicts. The penalties for
different scenarios are as follows:
• If both convicts confess to stealing the data, the punishment is 5 years of jail term for each of
them.
• If one prisoner confesses and other refuses, then the confessor is given 1 year of jail term for his
truthfulness, and the one who has refused is penalized for 10years of jail term.
• If both convicts refuse to accept their involvement in the theft, then both of them are sentenced
for 3 years due to the lack of sufficient evidence.
Now, the situation before the convicts is complex, since they can not communicate and decide what
they should be doing. Also, each of them is afraid of the other’s position or standpoint. This situation
can be modeled as a matrix game as shown in Figure 2.3.
Figure 2.3 A simple example of two player non-cooperative normal form game. The prisoners’dilemma in terms of the strategies (confess, refuse) and thedifferent payoffs (1 year, 3 years, 5 yearsor 10 years) are shown.
In this example, the two convicts, David and Robin, are the players of the game. Each player
has two strategies, confess and refuse. The elements of the matrix game are the payoffs or utilities
associated with the strategies chosen by the players. For example, if Robin chooses his strategy of
17

refusing to be involved in the theft, his punishment will depend upon the strategy chosen by David. If
David also refuses, then Robin will get 3 years of jail term, whereas if David accepts their involvement
in the theft, then Robin will be sentenced for 10 years in jail. The information available with each
player is the strategies available with the other player. A strategy combination is a tuple consisting
of one strategy corresponding to each player in the game. Onesuch strategy combination is the set
(confess, confess).
The solution of a game model is identified using an equilibrium technique. Nash equilibrium [36]
is one such technique that has been widely used to solve the game theoretic formulations. Nash
equilibrium in a non-cooperative game setting is identifiedas a point (or strategy combination) at
which no player can improve its utility by deviating from that point, considering the other players do
not deviate from that point. A Nash equilibrium in the prisoners’ dilemma game can be explained with
the aid of the Figure 2.4(a) – 2.4(c).
As shown in Figure 2.4(a), Robin, if refuses to testify that he was involved in theft, would receive
a term of 10 years in the worst case scenario, and 3 years in thebest case scenario. However, if he
confesses his involvement in the theft, would serve a term of5 years in the worst case, and 1 year in
the best case scenario. Thus, to confess his involvement is the obvious dominant strategy for him. This
is shown as the yellow shaded region in the figure. Convict David has the similar situation as shown
in the payoff matrix in Figure 2.4(b). With the similar set ofarguments, it is logical for David to also
confess his involvement in the theft.
Now, if we take the dominant strategies of both the players, the final equilibrium strategy is identi-
fied, as shown in Figure 2.4(c). Here, the purple shaded region denotes the intersection of the dominant
strategies of the two players. This point is precisely called the equilibrium point, and the strategy com-
bination (confess, confess) is the Nash equilibrium strategy. At this strategy point, if David tries to
change its strategy from confess to refuse, while Robin maintaining his position of confession, David
will only loose and will get more years in the jail term. Similar situation occurs when Robin tries
to change his strategy unilaterally. Thus, at the Nash equilibrium point each player is satisfied with
respect to every other player in the game.
18

(a) Strategies and Payoffs of Robin (b) Strategies and Payoffs of David
(c) Nash Equilibrium Strategy Combination
Figure 2.4 Generation of strategy sets, identification of the dominant strategies, and Nash equilibriumin prisoners’ dilemma game. In (a) and (b) the respective strategies and the payoffs for Robin andDavid are shown. The Nash equilibrium strategy on the basis of the dominant strategies for eachplayer is shown in the right bottom box of (c).
2.1.2.1 Classification of Games
Games can be classified on the basis of several different criteria. Some of the important classifica-
tions of the games are given as follows.
• Number of players - 2-player (prisoners’ dilemma), N-player (finite), and infinite player games
• Number of moves and choices - finite strategy set and infinite strategies
• Degree of opposing interests - zero-sum games and general-sum games
• Degree of cooperation - cooperative games and non-cooperative games
• Number of stages - one-shot games and repeated games
19

• Time dependence - static games and dynamic games
• Involvement of probability - deterministic games and stochastic games
Here, we will discuss some of these classifications, specifically the ones of our interest in terms of
solving the multi-metric optimization problems. To get detailed information on the other classification
criteria, the readers may refer to [27, 28]. In a classification based on the degree of cooperation,
the non-cooperative games consist of rational players choosing their strategies independently, with
nominal information of the strategies available with the other players. Each player plays a strategy
that is its best response to the strategy combination of the other players. Unlike cooperative games,
the coordination among the players is not forced externally, but is self-enforcing. In multi-player
situations, where external communication for cooperationis complex, and hence impractical, the non-
cooperative games are pragmatic. Non-cooperative games can be further classified as normal form
or strategic games, and extensive form games. In the normal form games, players simultaneously
choose their strategies and a strategy combination that gives the best possible payoffs to every player
is considered as an equilibrium point. Whereas, in the extensive form games, the players move in a
sequential order, and the order of play affects the final outcome of the game. Since all the players
make their moves simultaneously in a normal form game, they do not get to learn each other’s private
information.
2.1.2.2 Mathematical Representation
A non-cooperative normal form game is a finite game if the strategy setsS1, · · · ,SN are finite. Here,
N is the set of all players in the game, andSi is the set of all the strategies of playeri. The game is
being represented as:
G = (Si , pi);∀i ∈ N (2.4)
Here,pi represents the payoff function for playeri, and is given as:
pi = ∏i≤N
Si →ℜ (2.5)
For the gameG represented by Equations (2.4) and (2.5), theN-tuple of strategiess∗1, · · · ,s∗N where
s∗1 ∈ S1, · · · ,s∗N ∈ SN, is defined as the Nash equilibrium point ofG if Equation (2.6) satisfies∀si ∈ Si
20

andi = 1, · · · ,N.
pi(s∗1, · · · ,s∗i , · · · ,s∗N)≥ pi(s
∗1, · · · ,s∗i−1,si ,s
∗i+1 · · · ,s∗N) (2.6)
Qualitatively, Nash equilibrium is a socially fair, good quality solution point at which every player is
satisfied with respect to every other player.
2.1.2.3 Critique of Game Theory
Although game theory has been widely studied and applied in several important application areas,
it is often criticized for some of its properties. The primary critiques of game theory are:
• Why non-cooperative games?: If the prisoners’ dilemma gamebeing presented above is revis-
ited, a natural question that arises is to why not play a cooperative game? This is intuitive, since
in such a scenario, players may come out with a more advantageous strategy combination of
(refuse, refuse). The issue with cooperative games is that in such games the players need to
make prior commitments for cooperation. The prisoners’ dilemma game (represented byχ per
say) can be transformed into a cooperative game by a mappingξ, such thatξ(χ) is another game
that represents the situation existing where, in addition to the strategy sets specified inχ, each
player would have some wide range of options for bargaining with the other players to jointly
plan cooperative strategies. In such situations the strategy set of each player would explode
and the game would potentially become inconceivable. Another reason for not considering a
cooperative game solution is the requirement of impartial arbitrator in cooperative games, who
could perform pre-play communication with all the players beforehand. In such situations, a
considerable amount of time is required for such arbitrations, which is not pragmatic in solving
real engineering problems.
• Multiple Nash equilibriums and pareto optimality: The Nashequilibrium for a game theoretic
model consists of all the dominant strategies. However, there may be multiple Nash equilibriums
in a game, and it is possible that several Nash equilibriums may not bepareto optimal[28]. A
solution is pareto optimal, if there exist no other solutionthat can make at-least one individual
better off without making any other individual in the systemworse off. A good example for
such a situation is the Prisoners’ dilemma situation. Here,the dominant strategy and the Nash
21

equilibrium point is the combination where both the prisoners confess their crimes, which is
reasonable from the players’ as well as the system’s perspective, considering that the players are
rational and non-cooperative. As evident, the solution is not pareto optimal. The pareto optimal
solution point is (refuse, refuse). However, the pareto optimality would require cooperation
among the players, existence of focal arbitrator, and a coalition formation, which is infeasible.
It is important to note that the criterion of pareto optimality does not ensure that a solution
is by any sense equitable and socially fair, which is an important criterion in multi-objective
optimization.
2.2 Mathematical Programming
A mathematical programming problem is an optimization problem, wherein one seeks to minimize
or maximize a real valued function of real or integer variables, subject to constraints on the variables.
Mathematical programming studies the following properties of an optimization problem:
• The mathematical properties of the optimization problem.
• The development and implementation of the algorithms to solve the optimization problems.
• The application of these algorithms to real world problems.
The mathematical programming is primarily performed to solve two types of problems, continuous
and discrete. The continuous optimization problems could be constrained or unconstrained. To solve
the unconstrained optimization problems, several methodslike non-linear programming, non-linear
least square optimization methods, non-differentiable optimization methods and other global opti-
mization methods are applied. The constrained optimization problems could be linear, stochastic,
non-linearly constrained or bound constrained. Several algorithms have been developed to solve such
problems [37]. The deterministic discrete optimization problems are solved using integer program-
ming methods. The stochastic optimization problems, whichcould be discrete or continuous problems,
are harder to solve, since they involve uncertainty.
Stochastic programmingis a framework for modeling optimization problems that involve uncer-
tainty. Stochastic programming methods take advantage of the fact that probability distributions gov-
erning the data are known or can be estimated. The goal here isto find some policy that is feasible for
22

all (or almost all) the possible data instances and maximizes the expectation of some function of the
decisions and the random variables. More generally, such models are formulated, solved analytically
or numerically, and analyzed in order to provide useful information to a decision-maker.
Stochastic programming is a widely studied and applied optimization problem to the real world
problems since any real world problem almost invariably includes some unknown parameters. Sev-
eral algorithms and solution methodologies have been developed to solve the stochastic optimization
problems. Chance constrained programming, two stage linear programming, multi-stage linear pro-
gramming, fuzzy mathematical programming and geometric programming are a few state of the art
methods to solve stochastic optimization problems. In general terms the optimization methods in this
discipline combine the power of mathematical programming with advanced probability techniques, to
attack optimization problems that involve uncertainty. A constraint or presumption in these methods
is that the probability distributions of the random parameters are known, and cannot depend on the
decisions taken.
2.3 VLSI Circuit Optimization
In the nanometer era, the performance of a VLSI circuit is notonly determined by the the delay or
the frequency of the circuit alone. The reliability, scalability, power dissipation, energy to perform a
function, cost, yield and the time-to-market the chips are also important performance metrics. The op-
timization of these metrics is thus an essential part of designing robust, reliable and high performance
circuits. The persistent push for higher performance and reliability in much more complex designs has
led to an increasing interest in the optimization techniques. Circuit optimization primarily involves
tuning of various components of a circuit to achieve desiredchanges in the performance metrics. The
components that can be tuned, include transistors, wires, buffers, power supply voltage, and thresh-
old voltage etc. [38]. In addition to these continuous tuning techniques, various discrete optimization
methods like buffer insertion, reordering of input pins, and choice of gates from discrete libraries etc.
are also widely studied in literature. Since, in this dissertation multi-metric optimization of delay,
power and crosstalk noise is being performed, the methods that are effective for the optimization of
these metrics are reviewed. It is important to note that the framework for VLSI optimization being de-
23

veloped in this research is independent of the metrics that can be incorporated for optimization. Other
performance metrics can be added in the model with minimal effort.
In a circuit, the maximum delay is defined as the total delay ofthe longest path (critical path) in
the design. Some of the prominent techniques for delay minimization include gate sizing, transistor
ordering, defining alternative logic structures, buffer insertion, reducing the voltage swing of the gates,
and interconnect wire sizing [39, 40]. In a gate sizing technique, the sizes of the gates in the path are
adjusted to minimize the delay of the path. The sizes of the gates in the entire circuit or a sub-circuit are
adjusted properly according to their capacitive loads for performance improvement. In the transistor
ordering technique, the transistors are ordered in a row andoriented in such a way that the sharing
of source and drain regions is maximized. This aids in reducing the total diffusion area and the cell
widths. Delay of a circuit can also be reduced by carefully replacing logic structures in a circuit.
For example, a function likeF = ABCDEFGHbeing implemented using 5 two input NAND gates, 2
two input NOR gates and a NOT gate can be replaced by a eight input NAND gate and a NOT gate.
Another effective technique for delay optimization is to insert buffers in order to isolate the fan-in
from the fan-out, thereby reducing the load on the critical path of the circuit. In the buffer insertion
technique, a series of cascaded inverters are inserted on interconnects between the gates. In a wire
sizing technique, the widths of the interconnect wires are sized to reduce the interconnect delays. The
techniques like multi-VDD assignment and threshold voltage scaling have also been applied for delay
minimization.
Power dissipation in VLSI circuits is primarily due to two components; static power, and dynamic
power [41]. The dynamic power dissipation is due to two sources, switching power due to charging
and discharging of load capacitance, and short circuit power due to non-zero rise and fall times of
input waveforms. The static power or leakage power dissipation occurs when the device is not active.
The three components of leakage power are sub-threshold leakage due to current from drain to source,
direct tunneling gate leakage due to tunneling of electronsor holes from the bulk silicon through the
gate oxide potential barrier into the gate, source and drainor substrate and substrate reverse biased p-n
junction leakage. Several techniques have been proposed toreduce these components of power dis-
sipation. For dynamic power reduction, gate sizing, interconnect sizing, clock gating, supply voltage
scaling and buffer insertion are primary techniques.
24

Dynamic power of the circuit is minimized by sizing down the gates in the circuit. However, such
sizing technique increases the delay of the circuit. In order to optimize both delay and dynamic power,
a path based technique can be applied, where gates in the critical paths are sized-up and the gates
in the non-critical paths are sized down. Alternatively, a global optimization can be performed with
delay-power trade-off. Wire sizing technique follows a similar relationship. If the width of the wire is
increased, the resistance per unit length of the wire decreases. However, the line capacitance increases,
consequently increasing the interconnect power. In a clockgating scheme, the clock is masked such
that the switching activity of the idle blocks of the circuitis minimized, thereby reducing dynamic
power dissipation. This technique also reduces the clock power dissipation. Supply voltage scaling
minimizes the switching power dissipation. Since supply voltage has a quadratic dependency on the
switching power, the technique is effective. In this method, either the supply voltage of the non-critical
part of the circuit can be lowered in a static manner, or the supply voltage can be dynamically lowered
depending upon the performance demand of the circuit.
Leakage power minimization at the circuit level can be performed by applying techniques like gate
sizing, threshold voltage scaling, transistor stacking and adaptive body biasing. Since the gate size is
directly proportional to the average leakage power of the gate, sizing the gate reduces the leakage
power of the circuit. Assignment of high threshold voltage to some transistors in the non-critical paths
can reduce the sub-threshold leakage. The transistor stacking method inserts extra transistors (sleep
transistors) connected in the series with the pull-up/pull-down path of the gates and turns them ’off’
during the standby mode. In adaptive body biasing, the forward body bias (FBB) and the reverse body
bias (RBB) is applied to vary the threshold voltage of the transistors, thereby turning them off during
the passive mode.
The coupling of a quiet line with one or more switching lines induces noise on the quiet line. If the
noise is high, the logic of the quiet line may switch causing logic failures. This crosstalk noise can be
reduced by applying methods like wire sizing, wire spacing,wire shielding, sizing of the driver gates
of the victim and aggressor interconnects, and sizing of thereceiver gates of the victim and aggressor
nets [42, 43]. If a wire is sized up, the resistance of the wireincreases, thereby reducing the coupling
effect on it. Alternatively, if the coupled wires are spacedfarther, the coupling capacitance between
them reduces, consequently reducing the noise on each of them. In the driver gate sizing, if the victim
net’s driver gate is sized up, the signal strength on the victim net increases, resulting in a decrease in
25

the coupling noise on itself. The impact is complementary, since an increase in signal strength on the
net induces higher coupling noise on the neighboring nets. Similarly, up-sizing the receiver gate of a
victim net reduces the noise on the net. However, the effect of receiver sizing is significantly smaller
as compared to the driver sizing.
Several state of the art techniques for VLSI optimization being discussed here are effective, and
have been successfully applied for optimization of either delay, power or crosstalk noise. However,
among these techniques,gate sizingis particularly interesting due to several reasons. Gate sizing
is a simple, general purpose post-layout optimization approach that can be utilized to optimize all
the important metrics like delay, power, and crosstalk noise. It does not require the incorporation
of any additional circuitry in the design, and hence incurs minimum overhead. Gate sizing at the
post-layout level does not require any circuit re-routing to be performed. Also, driver gate sizing is
the most effective technique for crosstalk noise optimization [43]. Thus, we utilize gate sizing as the
optimization methodology for multi-metric VLSI circuit optimization, considering process variations.
2.3.1 Process Variations
The aggressive scaling of devices and interconnects, the limitations of the manufacturing pro-
cesses, and the environmental noise affecting the manufacturing processes, have significantly affected
the VLSI design paradigm, resulting in a transition of the design and optimization process from the
deterministic to the probabilistic domain [5]. Such effects degrade the quality of the signals and af-
fect the reliability of the manufactured circuits. These process variations occur primarily due to two
factors.
• Environmental Factors: This includes the variations in theprocessing due to the variations in en-
vironmental factors like temperature, power supply voltage, humidity, pressure, electromagnetic
interference, cosmic rays etc.
• Physical Factors: These include the variations in the electrical and the geometrical parameters
caused due to imperfections in processing technologies like photolithography, planarization,
metal etching, polysilicon etching etc.
The physical factors can be further classified as die-to-diephysical variations and within-die physical
variations. The die-to-die physical variations cause the inconsistencies between the different dies, but
26
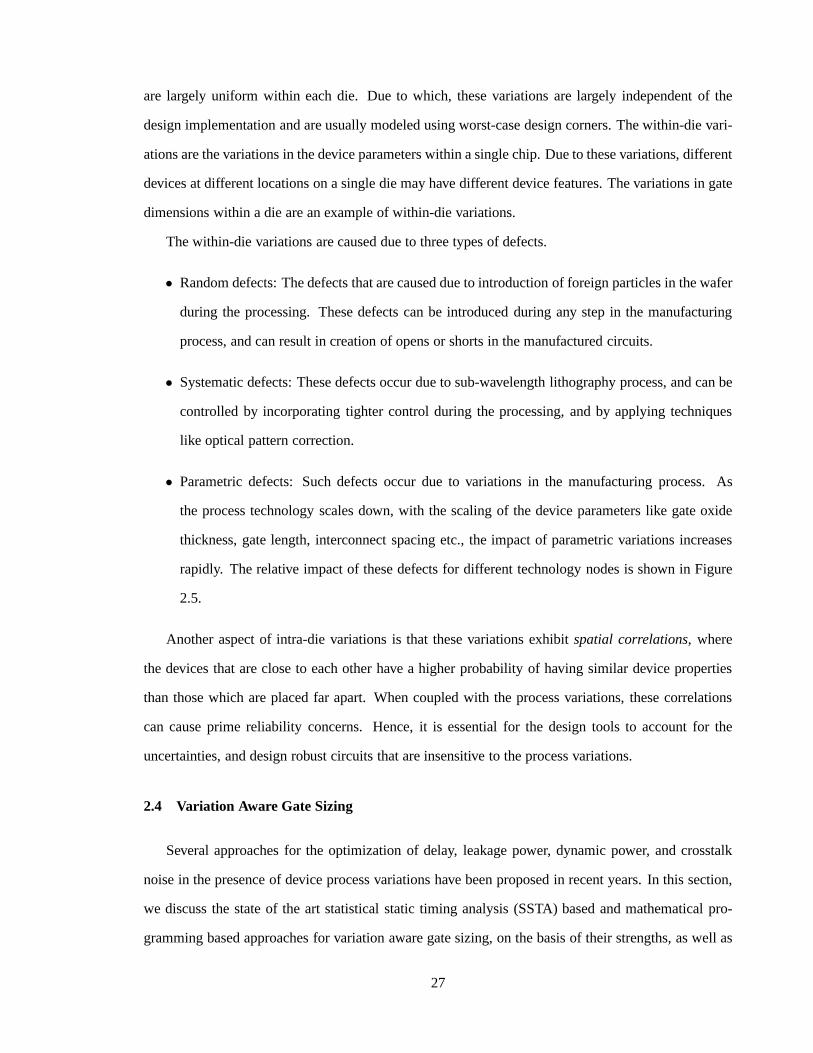
are largely uniform within each die. Due to which, these variations are largely independent of the
design implementation and are usually modeled using worst-case design corners. The within-die vari-
ations are the variations in the device parameters within a single chip. Due to these variations, different
devices at different locations on a single die may have different device features. The variations in gate
dimensions within a die are an example of within-die variations.
The within-die variations are caused due to three types of defects.
• Random defects: The defects that are caused due to introduction of foreign particles in the wafer
during the processing. These defects can be introduced during any step in the manufacturing
process, and can result in creation of opens or shorts in the manufactured circuits.
• Systematic defects: These defects occur due to sub-wavelength lithography process, and can be
controlled by incorporating tighter control during the processing, and by applying techniques
like optical pattern correction.
• Parametric defects: Such defects occur due to variations inthe manufacturing process. As
the process technology scales down, with the scaling of the device parameters like gate oxide
thickness, gate length, interconnect spacing etc., the impact of parametric variations increases
rapidly. The relative impact of these defects for differenttechnology nodes is shown in Figure
2.5.
Another aspect of intra-die variations is that these variations exhibitspatial correlations, where
the devices that are close to each other have a higher probability of having similar device properties
than those which are placed far apart. When coupled with the process variations, these correlations
can cause prime reliability concerns. Hence, it is essential for the design tools to account for the
uncertainties, and design robust circuits that are insensitive to the process variations.
2.4 Variation Aware Gate Sizing
Several approaches for the optimization of delay, leakage power, dynamic power, and crosstalk
noise in the presence of device process variations have beenproposed in recent years. In this section,
we discuss the state of the art statistical static timing analysis (SSTA) based and mathematical pro-
gramming based approaches for variation aware gate sizing,on the basis of their strengths, as well as
27
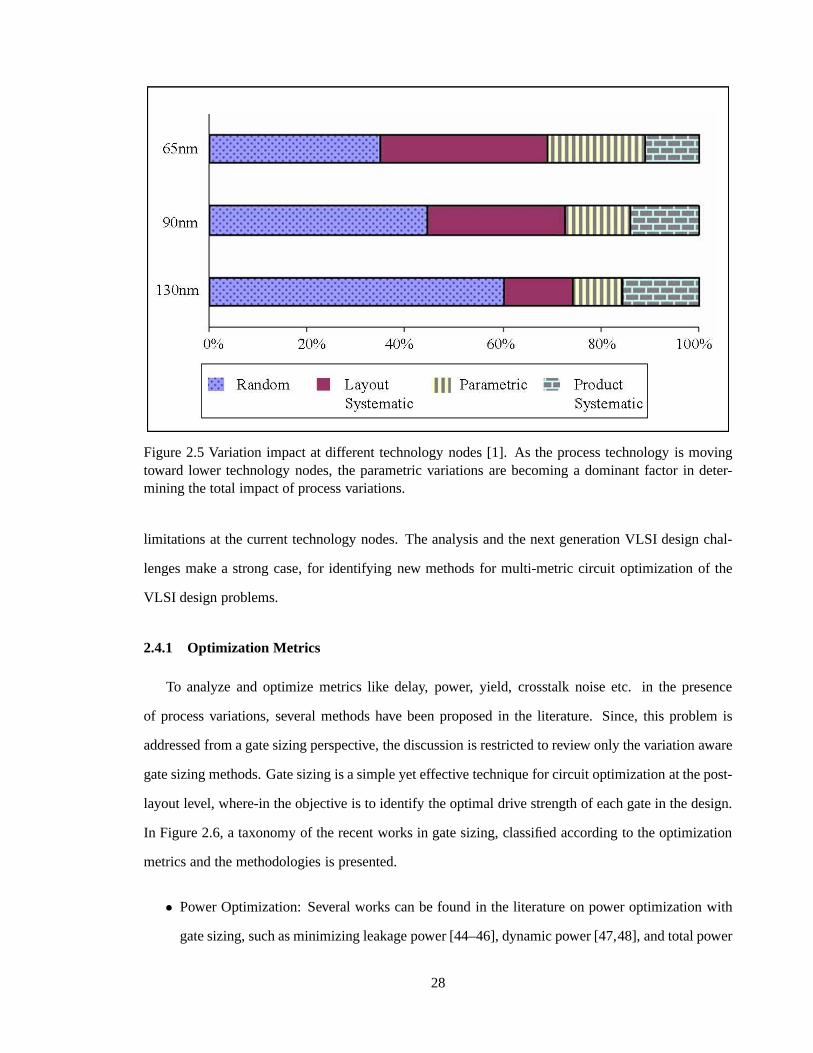
Figure 2.5 Variation impact at different technology nodes [1]. As the process technology is movingtoward lower technology nodes, the parametric variations are becoming a dominant factor in deter-mining the total impact of process variations.
limitations at the current technology nodes. The analysis and the next generation VLSI design chal-
lenges make a strong case, for identifying new methods for multi-metric circuit optimization of the
VLSI design problems.
2.4.1 Optimization Metrics
To analyze and optimize metrics like delay, power, yield, crosstalk noise etc. in the presence
of process variations, several methods have been proposed in the literature. Since, this problem is
addressed from a gate sizing perspective, the discussion isrestricted to review only the variation aware
gate sizing methods. Gate sizing is a simple yet effective technique for circuit optimization at the post-
layout level, where-in the objective is to identify the optimal drive strength of each gate in the design.
In Figure 2.6, a taxonomy of the recent works in gate sizing, classified according to the optimization
metrics and the methodologies is presented.
• Power Optimization: Several works can be found in the literature on power optimization with
gate sizing, such as minimizing leakage power [44–46], dynamic power [47,48], and total power
28

Figure 2.6 Taxonomy of the variation aware gate sizing works. The various works on the variation aware gate sizing are classified on the basis ofoptimization metrics and optimization methods.
29

[49–52]. In [47], a dynamic power minimization method is proposed with dynamic power
identified as a function of the gate sizes in a stochastic programming model. Similarly, in [48],
the authors have proposed a fuzzy mathematical programmingbased solution for dynamic power
optimization. Leakage power minimization under process variations is performed using SSTA
based methods [44, 45], in which continuous distributions are propagated through the paths
instead of the deterministic values to find the closed form expressions for performance. In [46],
a method to estimate the leakage current variation due to inter-die and intra-die gate length
variations is presented.
• Crosstalk Noise Optimization: The power optimization methods are primarily single metric
models that do not consider the effect of gate sizing on othermetrics such as crosstalk noise
of the circuits. At the post-layout level, interconnect coupling effects can worsen the signal
strength, leading to logic failures. Several techniques toreduce crosstalk noise have been pre-
sented in the recent years. In [42], the authors propose a linear programming based formulation
for transistor sizing to minimize crosstalk noise in circuits. In another approach [53,54], an yield
driven Lagrangian Relaxation based method identifies the upper-bound on noise for each net as
a noise constraint. The gates are iteratively sized-up to satisfy the timing and noise constraints,
and a simple linear model is evaluated for crosstalk noise minimization. In a recent work [55],
a stochastic game theoretic algorithm for post layout delayuncertainty and crosstalk noise op-
timization considering spatial correlations [56, 57] is proposed. The non-linear crosstalk noise
model used in this method is derived from [58], which accurately identifies a closer approxima-
tion of the crosstalk noise.
• Delay Optimization: Additionally, the optimization of other important metrics like delay, timing
yield and binning yield have also been discussed widely [59–61]. However, this research is
largely one-dimensional in the sense that these methods typically aim at optimizing specific
metrics and often do not consider the fact that optimizing one metric may negatively impact the
optimization of other metrics, leading to an inaccurate analysis of the complete design.
30

2.4.2 Optimization Methods
SeveralSSTA based approacheshave successfully been applied for delay minimization or yield
improvement problems [57, 62–64]. These approach intuitively model delay and yield optimization
problems in a simple model. The SSTA based approaches, improve over the pessimistic worst-case
corner based modeling [61] by performing a mean-variance analysis for the total circuit delay. How-
ever, such approaches are essentially path based [65], and traditionally applied to optimize a single
parameter. An assumption in a SSTA based technique is that the complete information about the vari-
ation distribution of the design parameters is known, and the methodology is based on such assump-
tions. Several works [6,7] have assumed a Gaussian distribution. However, global sources of variation
follow a log-normal distribution more closely [8,9] as compared to the Gaussian distribution.
Mathematical programming based approacheshave been widely investigated in the literature for
optimizing several metrics. An important aspect of mathematical programming approaches for circuit
optimization is that any path based problem can be easily converted to the node based equivalent with
some sub-optimality being introduced. A geometric programming (GP) approach has been proposed
in [66] for delay optimization in the presence of process variations. Although, the approach is robust,
the objective function and the constraints are required to be posynomial functions. Thus, modeling a
generalized optimization problem in a GP framework requires converting each optimization function
and the constraints in a posynomial form, and the problem canonly be modeled for minimization of
objectives.
In another approach for dynamic power minimization under delay constraints [47], the problem is
modeled as a chance constrained stochastic program (CCP). Although CCP techniques can transform
simple problems to their deterministic equivalent models,the transformation is extremely difficult for
large scale problems. Also, the method is bounded by continuous distributions, and requires a number
of operations to be performed iteratively at each node, thusinvolving higher run times. However, if
the variation distribution information is available, the methodology can be modified to incorporate
multiple metrics for optimization. Alternatively, the stochastic programming based statistical opti-
mization techniques are reasonably fast, but more conservative in terms of yield, and hence provide
lesser savings in terms of objective function optimizations. In a recent work [48], the dynamic power
optimization problem considering process variations has been modeled in a fuzzy optimization frame-
31

work. Here, the stochastic parameters are modeled as fuzzy numbers, and a crisp non-linear problem is
formulated to maximize the variation resistance (tolerance) of the circuit. The problem is then solved
using commercially available optimization solvers. Thesemethodologies typically aim at optimizing
specific metrics and often do not consider the fact that optimizing one metric can negatively impact
the optimization of other metrics, leading to an inaccurateanalysis of the complete design. The La-
grangian relaxation based methods [53] are limited to either up-sizing, or down-sizing the gates for
the optimization.
A shortcoming in the proposed methods for gate sizing considering process variations arise from
the fact that several methods [43, 47, 48] incorporate the effect of process variationsdue to only one
design parameter, like gate sizes (due to channel length, and oxide thickness). The impact of inter-
connect variations, which can cause 12-25% variations in the timing of the circuit, depending upon
the design and implementation [67, 68] can not be ignored at the deep sub-nanometer level. The pro-
cess variations can be modeled more accurately using complex and non-linear models that incorporate
more parameters, and have higher accuracy [55]. The disadvantage of such a modeling lies in the
implementation complexity.
2.5 Spatial Data Clustering
Spatial data clustering involves the grouping of objects into a set of sub-groups in such a manner
that the similarity measure between the data objects withina sub-group is higher than the similarity
measure between the data objects from different sub-groups. The object and data clustering techniques
find applications in a wide variety of scientific disciplinessuch as biology, computer vision and pattern
recognition, communications and computer networks, and information systems. As a result, cluster
analysis has received significant attention, and several customized clustering methodologies have been
developed to satisfy specific application requirements [11,12].
2.5.1 Clustering Techniques
Object clustering is a well researched problem reported extensively in the literature, including
several detailed survey papers. Jainet al. [11], and Scheunders [69] review clustering methods from
pattern recognition and image quantization viewpoint, while Kolatch et al. [70], and Berkhin [71]
32

identify methodologies from the data mining perspective. Similarly, Murtagh [72], and Baraldi [73]
surveyed various hierarchical, and fuzzy and neural clustering algorithms respectively. For a detailed
discussion and survey of different surveys, one is referredto [12].
Clustering techniques can be classified on the basis of several criteria, such as the principles, type
of data, shape of clusters, form of final partitions, distance measure, and the number of objectives.
Here, we will limit the discussion to partitioning of data sets on the basis of clustering objectives. The
three major groups of clustering objectives are compaction, connectedness, and spatial separation.
The compaction objective attempts to identify clusters with minimum intra-cluster variation. The
KMeans algorithm [74] is the simplest and the most widely mathematical method used in this category.
Other algorithms include average-link agglomerative clustering [75] and model based approaches [76].
Clustering with an objective of maximization of connectedness ensures that neighboring data items
share the same cluster. The density-based methods [77], andsingle-link agglomerative clustering
methods [75] implement this principle to identify clusterswith arbitrary shapes. In spatial separation
based methods, the objective is to maximize the inter-cluster separation. However, it provides little
guidance during clustering and may produce trivial results. Additionally, an important criterion that
has received significant attention recently in the domain ofdata clustering is equipartitioning or load-
sharing [78]. Load-sharing methodologies have been widelyresearched in the field of distributed
systems [79, 80], but did not receive much attention in clustering domain until recently. The new
application domains like ad-hoc networks [81,82] and emergency resource deployment require clusters
with almost equal number of data objects per cluster to satisfy the constraints.
From the clustering methodologies perspective, several heuristics based techniques have been de-
veloped in addition to the mathematical clustering methodologies. This includes simulated anneal-
ing [83], evolutionary algorithms [84–86], tabu search [87], and ant colony optimization [88]. Also,
hybrid approaches that combine different algorithms have been proposed in literature [85] [84]. Such
techniques are primarily used for feature selection in unsupervised classification, and are largely lim-
ited to single objective optimization. The multi-objective clustering problem has been solved using
the following principles.
• Ensemble methods: Here, the initial ensembles are created by clustering the data either mul-
tiple times using the same algorithm (with different initializations or using bootstrapping) or
33

using complementary clustering techniques [89]. Then, thesolutions are combined to create
ensembles using expectation maximization or graph based approaches [89]. However, sucha
posteriori integration of single objective clustering results do not exploit the real strength of
simultaneous multi-objective optimization.
• Pareto optimization: A feasible solution is pareto optimalif there is no other feasible solution
that is strictly better. Multi-objective pareto optimization [86, 90] performs simultaneous opti-
mization of complementary objectives, and hence, is betterthan the ensemble based methods.
• Microeconomic methods: The situations of conflicting objectives can be naturally modeled in a
game theoretic setting. The problems can be modeled in a framework consisting of players with
conflicting objectives competing to optimize their utilities [27,28]. The game is solved using the
Nash equilibrium based methodology that identifies a socially fair solution. The social fairness
ensures that every player is satisfied with respect to every other player.
Microeconomic approaches have been applied to a wide spectrum of problems in the domain
of computer science. Murugavelet al. [25] developed auction theoretic algorithms in VLSI design
automation for simultaneous gate sizing and buffer insertion problem. Hanchate [24] applied game
theoretic concepts for simultaneous optimization of interconnect delay and crosstalk noise through
gate sizing, while Gupta and Ranganathan [16] implemented game theory for resource allocation and
scheduling in the field of multi-emergency management. In grid computing, negotiating agents have
been used for leasing of resources using such models [21, 22]. Similarly, Grosuet al. [23, 91] used
cooperative games and the Nash bargaining solutions for load balancing in distributed systems, and
Lazar [20] implemented auctions for optimal bandwidth allocation in wired and wireless networks.
34
CHAPTER 3
EXPECTED UTILITY BASED CIRCUIT OPTIMIZATION
Aggressive technology scaling has adversely affected the circuit optimization process in two im-
portant ways. The impact of process variations in several components, coupled with multi-fold in-
crease in the design complexity has resulted in a situation that requires the circuit optimization tech-
niques to possess important features like accuracy of optimization, incorporation of process variation
effects due to various sources in a single model, and fast execution time. Also, in contrast to the
optimization techniques that are based on specific parametric variation distributions (like Gaussian),
these circuit optimization techniques should be variationdistribution independent. In this chapter, we
present a novel approach for circuit optimization in the presence ofscarce informationabout the dis-
tribution of the process variations. This algorithm reliesupon the concepts of utility theory and risk
minimization for multi-metric optimization of delay, dynamic power, leakage power, and crosstalk
noise, through the gate sizing technique. An important contribution of this work is the identifica-
tion of adeterministic linear equivalentmodel from a fundamentally stochastic optimization problem,
ensuring high levels of expected utility. The algorithm achieves significant speedup in the optimiza-
tion process for large circuits. This algorithm can addressthe impact of process variations at several
levels including device variations, interconnect variations etc., and is independent of the underlying
variation distribution. Using the concepts of bounded rationality, this method minimizes the risk of
constraint shortfall in a linear programming setup. The experimental results indicate that the algorithm
is efficient, and a comparative study with an existing gate sizing technique shows that our method is
multi-fold faster as well as comparable in terms of the optimization results.
3.1 Issues in Circuit Optimization
The scaling of process technology in sub-nanometer regime,and the apposition of Moore’s law
[92] has affected the realm of CMOS design and optimization process. Due to the aggressive tech-
35

nology scaling, the impact of device process variations on the design process has aggravated, and
consecutively, reliability and performance of the fabricated circuits have degraded. One reason for
such an effect is that, at the lower technology nodes, the parametric variations in other design parame-
ters have sizable impact on the circuit performance. For example, in sub-65nm designs, in addition to
the gate size variations (oxide thickness, channel length), the variations due to interconnects and vias
have sizable impact on the design. Due to these variations, the VLSI design optimization process has
switched from the deterministic domain to the stochastic domain in the sense that the sizes of gates,
wires etc. are no longer a deterministic quantity, but rather, a distribution. The state of the art research
in recent years has addressed the circuit optimization process primarily through the statistical static
timing analysis (SSTA) based approaches and mathematical programming approaches.
Various SSTA based approaches are variation distribution dependent, and several works have con-
sidered the variation sources of components as Gaussian distribution [6,7]. However, this assumption
has been invalidated by some recent analyses [8], accordingto which the process variations due to
different design parameters follow different distributions. For example, in [93] the authors have iden-
tified that the global sources of variation follow a log-normal distribution more closely as compared
to the Gaussian distribution. Hence, new methods for circuit optimization that are independent of the
underlying variation distributions need to be explored.
Another aspect of the rapid progress in the fabrication technology is the multi-fold increase in
the density of the VLSI circuits, resulting in larger and more complex designs. This issue, although
independent, has a coupling effect with the process variation impact in the sense that it further worsens
the circuit optimization process. The stochastic optimization techniques are inherently slower than
their deterministic equivalents for obvious reasons. Thisis aggravated by the ever-growing size of the
designs, and presents the designers with a challenge of identifying optimization methodologies that
are faster, can address the effects of process variations, and are yield efficient.
In the circuit optimization domain, the optimization of a single metric may introduce some sub-
optimality in the values of other metrics. Although, at higher technology nodes, the impact may
be negligible, however, such assumptions are not true for nano-scale designs. Thus, a single metric
optimization that results in a performance shift from one metric to another is not practical at this level.
As a simple example, if an optimization is performed with an objective of crosstalk noise minimization,
36

the resulting design may not be low power dissipating. Thus,another challenge in circuit optimization
is the quest for methods and solutions that are vertically aswell as horizontally integrated [14].
The study of the existing research in circuit optimization at the post layout level, as discussed in
Section 2.4, raise similar issues that need to be addressed in developing next generation optimization
methods. These can be summarized as follows:
• Most of the works perform a single metric optimization of either delay, power, or crosstalk noise.
However, such optimizations are no longer adequate for nanometer designs, and new modeling
techniques for multi-metric optimization are required to be developed.
• Several methods assume the process variations to follow certain distributions and are developed
to work specifically with those distributions. However, such assumptions are not valid for sev-
eral variations sources. An important aspect of the next generation VLSI optimization is to
identify methods that are variation distribution independent.
• The recent analysis on the variation distribution of the various variation sources identify that the
variations do not follow the same distributions as were identified in the preliminary analysis.
Thus, the methods that are capable of performing optimization under scarce information about
variation distribution are desirable.
• Due to the increasing complexity and size of the VLSI circuits, the circuit optimization process
has become slower. Due to the process variations, the optimization process has transitioned from
certainty domain to the uncertainty domain, adversely affecting the optimization time. Thus, an
accurate and fast stochastic optimization technique that could incorporate the impact of process
variations through a simple yet effective modeling is required to be developed.
• With the increasing integration density, the sizes of the circuits are increasing significantly. A
fast optimization method is thus required for practical solutions to the large scale VLSI design
optimization problems.
• With the scaling of technology, process variations in othercomponents of design are rapidly
becoming evident. A modeling technique that can address theimpact of process variations
at various levels, without complicating the modeling wouldscale well for the next generation
37
circuit optimization problems. A generic circuit optimization model capable of incorporating
the impact of parametric variations due to several factors is thus desirable.
In this work, we develop a novel expected-utility theory based methodology for optimization of mul-
tiple performance metrics through gate sizing technique. This approach effectively tries to minimize
the risk of violation or failure of the constraints in the model, evaluated and controlled by an expected
utility measure that is maximized to ensure that a constraint is satisfied. The modeling assumes the
availability of limited information about the system, i.e.only the mean, and standard deviation of
the process variation parameters is available, and not the actual distribution. A linear programming
model is identified using these values, and is solved for optimal solution. This methodology is capable
of coping with the scant information, evaluates a deterministic equivalent model which is important
for large scale problems, and can address the variability inseveral modeling parameters. The key
contributions of the algorithm are:
• Using the concepts of constraint risk aversion and minimization, it yields a deterministic equiv-
alent of the inherently stochastic optimization problem, while ensuring high utility levels.
• Performs optimization in the presence of scarce information about the variation distribution. In
terms of scarce information, only the mean and the standard deviation, and not the complete
information about the underlying distribution are required.
• Performs simultaneous optimization of multiple metrics. The metrics considered in this work
are delay, leakage power, dynamic power and crosstalk noise. The inter-relationship between
these metrics in terms of gate sizes is identified and modeledin a mathematical programming
model.
• Incorporates the impact of process variations due to gate sizes as well as interconnects.
The resulting deterministic problem is significantly faster than the corresponding stochastic problem,
and achieves high timing yields. Also, high level of utilityis obtained by controlling the risk from
each constraint in the model. The process variation effectsand the randomness can be incorporated in
the model at various levels including the variations in the gate sizes within the delay models, the inter-
connect variations, as well as the variations in objective functions. The impact of spatial correlation is
also modeled in the optimization methodology using a grid based correlation model [62].
38

The rest of the chapter is organized as follows. The detaileddescription of the expected utility
based deterministic modeling of a general stochastic optimization problem is presented in section 3.2.
In section 3.3, delay, power, and crosstalk noise models used in this work are briefly visited. The
models for delay and power have been adapted from literature, while a novel crosstalk noise model
has been developed in this research, and is discussed. Also,a relationship between the models in
terms of gate sizes is derived in this section. Section 3.4 presents the details of the transformation of
stochastic gate sizing problem to the equivalent deterministic model. Experimental results for different
scenarios and sensitivity analysis of the algorithm parameters are discussed in section 3.5.
3.2 Expected-Utility Based Modeling
In this section, the methodology to convert a stochastic optimization problem to a linear determin-
istic equivalent using the concepts of expected utility maximization is presented. In this algorithm,
different possible scenarios for a random constraint satisfaction are analyzed in terms of the quadratic
utility function. The problem is then converted to a utilitymaximization constrained deterministic
model.
A general stochastic optimization problem is given by (3.1), subject to the random constraint (3.2),
along with the set of non-random constraints, and the non-negativity conditions.
min Z=n
∑j=1
zjsj ;∀sj ∈ S (3.1)
s.t. ai =n
∑j=1
ai j sj ≥ bi ;∀i ∈M (3.2)
Here,sj is the jth design parameter to be optimized,zj is the weight (unit cost) ofsj , which by itself
could be a random value.ai j sj is a randomith constraint corresponding to the parametersj and,bi is
the random constraint satisfaction value.S is the total number of design parameters to be optimized,
andM is the total number of random constraints in the problem.
Now, from (3.2), the critical random variable for the randomconstrainti can be defined as:
ηi = (ai −bi)/bi ;∀i ∈M (3.3)
39

where,bi is the mean value of allbi ’s. Taking the first and second moments ofηi , we get the mean for
the constrainti as:
ηi = (n
∑j=1
ai j sj − bi)/bi (3.4)
and the variance as:
σ2i ≤ (1/bi)
2(n
∑j=1
σi j sj + σbi)2 (3.5)
where,σi j andσbi are the respective standard deviations ofai j andbi .
An effective way of controlling the risk of failure of a constraint is by maximizing the expected
utility of the constraint. The assumption of scarce information states that only the mean and the
standard deviation values, and not the complete information about the distribution for each random
variable are available. Also, in the context of scarce information, it is assumed that therisk of failure
significantly exists, i.e. the negative value ofηi can occur with significant probability, and thus our
goal is to minimize that by maximizing the utility value. In the context of gate sizing problem, it
corresponds to the situations where the delay constraints are not met due to the variation effects, and
consequently affecting the yield. For the justifications and the detailed descriptions of the technical
information that follows, please refer to Ballestero’s paper [94].
The decision maker’s utility can be given by the standard quadratic Von Neumann and Morgenstern
utility function [32] for ηi as:
Ui(ηi) = α+2βηi− γη2i (3.6)
ηi > 0;∀i ∈M
whereα, β, andγ are the parameters to be determined. In (3.6), there are three possible conditions:
• A shortfall, whereηi < 0 and the constraint is not satisfied
• A zero shortfall, whereηi = 0, and reflects a critical situation where the constraint mayor may
not satisfy depending upon the randomness ofηi
• A surplus, whereηi > 0, and the constraint is safely satisfied.
These possibilities and their utilities are pictorially described in Figure 3.1.
40

Now, for a shortfall, the utility (3.6) decreases rapidly asthe η increases, but the value is still
positive till α > 2βηi− γη2i . This interval is shown as ’bearable shortfall’ region in Figure 3.1. So, the
greatest bearable shortfallη∗i , which is a very small value, can be expressed as a function ofthe mean
value ofηi (ηi), given by
Ui(η∗i ) = α+2βη∗i − γη∗2i (3.7)
α+2βλiηi− γλ2i ηi
2 = 0
whereλi is a positive parameter close to zero, since the greatest bearable shortfall is a very small value.
From the first derivative of utility (3.6) with respect toηi , we get
U′i (ηi) = 2(β− γηi) > 0 (3.8)
As the utility monotonically increases withηi (which is negative), less shortfall is preferred to more
shortfall.
In case of zero shortfall, the utility is given byα. At this critical point, the randomness ofηi
decides if the constraint is met or not. A surplus is thus preferred by the decision makers since the
zero shortfall is a random value at the edge. So, asecurity marginin terms of small surplus is preferred.
However, a large surplus value is not good since it can adversely affect the achievement of the objective
goals. The security margin is shown as the shaded region in the Figure 3.1. A utility maximization
function is derived by substituting the values ofα, β, andγ in (3.6).
Now, if the first derivative of utility given in (3.8) is equated to zero for maximal value ofηi, we
get,
ηimax = ψi = β/γ (3.9)
Substituting the values in (3.7), we get
β/γ = λ2i ηi
2 +2ψiλi ηi (3.10)
α/β = (λ2i ηi
2 +2ψiλiηi)/ψi (3.11)
41

Figure 3.1 Utility curve for a random function. The possiblescenarios of shortfall, zero shortfall andthe surplus are shown here. The shaded region shows the security margin for random functionη,whose value is maximized when the first derivative of the expected utility function is equated to 0.
These values correspond to the greatest bearable shortfall, the mean, and the surplus of minimum
utility. Now, the overall maximum utility value can be derived with respect to the mean value as
Uimax = Kiηi ≈ ηi (3.12)
The value of K is irrelevant here, since the utility value is just an index. Now, Putting the values ofα,
β, andγ in (3.6), we get the maximum utility as,
ηi−αα
=ψ2
i
(λ2i ηi
2 +2ψiλi ηi)(3.13)
Now, for a problem in which the shortfall is unacceptable, such as gate sizing, the utility for
shortfall is 0. Thus, in Figure 3.1, the bearable shortfall area limits to 0, and henceα = λi ηi. Now,
42

substituting this value in (3.13), we get
ψi ≈ 2ηi ;asλi 0. (3.14)
In the optimization problem, the expected utility (EU) for each random constraintai is to be kept
at a high level to assure that the solution points are identified by satisfying the constraints. This is
mathematically expressed in terms of first and second derivatives as:
EUi(ηi) = Ui(ηi)+0.5U′′i (ηi)σ2
i (3.15)
= α+(2ψi ηi− ηi2)γ−σ2
i γ
A parameterω, symbolizing the utility value (an index) can be introducedhere such that:
α+(2ψiηi − ηi2)γ−σ2
i γ > ωbα+(2ψi ηi− ηi2)γc (3.16)
whereω is close to unity. The constraint (3.16) ensures that the expected utility of the constraint is
close to unity, and is satisfied.
Now, solving (3.16) forσ2i , we get,
σ2i < (1−ω)(3+ λ2
i +4λi)ηi2 (3.17)
≤ 3(1−ω)ηi2; ηi > 0
This equation gives a clear relationship between the variance and the mean in terms of expected utility.
These relationships are then utilized in identifying a deterministic model, as discussed next.
3.2.1 Deterministic Modeling
In a mean-variance approach for the expected utility maximization problem, the general minimiza-
tion problem described in (3.1) is converted into an equivalent maximization function of the expected
utility, subject to the parametric variance constraints. The expected utility maximization function can
43
be given as:
max Λ = C−Z = C−n
∑j=1
zjsj (3.18)
Here, C is a large positive constant. Also,Z =n
∑j=1
zjsj > 0, since no resource is free. Thus, the
equivalent minimization problem becomes,
minn
∑j=1
zjsj (3.19)
subject to the following constraints,
• Constraints (3.17), as developed earlier,
n
∑j=1
σi j sj + σbi <√
(1−ω)(3+ λ2i +4λi)(
n
∑j=1
ai j sj − bi) (3.20)
<√
3(1−ω)(n
∑j=1
ai j sj − bi);∀i ∈m
• Parametric variance constraint corresponding to the mean value objective function,
n
∑j=1
σzj sj ≤ ρn
∑j=1
zjsj (3.21)
The parameterρ corresponds to the value ofcoefficient of variation, if that information is avail-
able. This information is required only in situations when the objective function itself has ran-
dom parameters.
• The set of non-random constraints, and the non-negativity conditions in the original optimization
problem.
3.3 Parametric Models
In this section, we would present the models corresponding to each optimization metric, delay,
leakage power, dynamic power and crosstalk noise. The delayand power models have been adapted
from the literature, whereas a novel crosstalk noise model has been developed as part of this work.
This crosstalk model identifies noise as a linear function ofthe sizes of the driver gates. The dis-
44

cussion focuses on identifying a relationship between these metrics, and formulates the mathematical
programming models required for optimization. Also, the device level and interconnect process vari-
ation are briefly visited.
3.3.1 Delay, Process Variations and Spatial Correlation
Reducing the size of a gate (saysi), reduces the intrinsic gate capacitance of gatei, the power
consumption, and the fan-in load capacitances ofi. In the linear delay model [95], the delay is modeled
as a function of the gate sizes, as shown in (3.22).
di = ai −bisi +ci ∑j∈ f oi
sj (3.22)
where,di is the delay of gatei, si is the size of gatei, andsj corresponds to the sizes of all the fan-
out gates ofi. The coefficientsai ,bi ,ci are empirically determined by extensive SPICE simulations
for each gate in the standard cell library for all combinations of sizes and fan-out. Specifically,bi
corresponds to the impact of channel length (Le f f) on the delay of a gate, andci corresponds to the
impact of oxide thickness (tox)on the delay. Thus, the delay model incorporates the impactof device
process variations.
The uncertainty due to parameter variations in gate sizes ismodeled according to (3.23), which is
expressed in terms of nominal delay (di), and random parametersXj andXr , determining the correlated
and independent variations respectively.
D = di +n
∑j=1
d jXj +drXr (3.23)
Here,Xj models the principal components of correlated random variables with the correspondingd j
values evaluating the sensitivity of delay.Xr ∼ N(0,1) models the random component of variations in
all process parameters lumped into a single term, anddr is the standard deviation in delay due to these
random variations. The magnitude ofd j anddr is determined by extensive simulations.
In the linear delay model, only the process variation effects in the gate sizes (Le f f andtox) are incor-
porated, but not the interconnect variations. The interconnect variations in today’s gigahertz designs
are high, and can cause up to 25% variation in the clock skew, as shown in a paper by Liuet al. [68].
45

Also, these variations can not be incorporated in a simple nominal-worst case type of analysis. So,
in this model, the effect of the interconnect variations areaddressed in a mean-variance approach at
the timing constraints level. The optimal delays identifiedthrough an unconstrained delay minimiza-
tion as a first step in the optimization process are used as constraints for simultaneous optimization of
power and crosstalk noise. We incorporate a conservative 10% variance around the mean of the best
case timing values, corresponding to the interconnect variation effects.
The spatial correlations are modeled using a grid based correlation model proposed in [62]. Ac-
cording to this modeling, the complete design is divided into different number of regions. The gates
that are in same region are highly correlated and the variation effects on all of them are similar, whereas
the variation effects on the gates that are in different regions are different and are less correlated. These
effects are incorporated in (3.22) to evaluate the values ofbi andci , approximating the variations in
channel length and gate oxide thickness respectively.
3.3.2 Leakage and Dynamic Power
The power models proposed in [51] for dynamic and leakage power are adapted in our optimization
formulation. The dynamic power dissipationPd(i) of a gatei in each clock cycletc depends upon the
transition probabilityt pi , the power supply voltageVdd, and the load capacitanceLi. Load capacitance
on a gatei is given by (3.24).
Li = Wi + ∑k= f oi
Ci(k)sk (3.24)
whereWi is the wire capacitance, andCi(k) is the gate capacitance of the unit sized fan-out gate. The
equation for dynamic power dissipation can be given as (3.25).
Pd(i) = t pi ∑k= f oi
Ci(k)skV2dd/(2tc) (3.25)
The average leakage power dissipationPl (i) of gate i as a function of its sizesi , and the transition
probabilities are given by (3.26).
Pl (i) = [∑r
P(i, r)Il (i, r)]siVdd (3.26)
46

where,Il (i, r) is given as the leakage current of gatei for the input patternr, P(i, r) is the leakage
power for gatei corresponding to the input patternr, Il (i, r) is the leakage current for the unit sized
gatei and input patternr, si is the size of gatei, andVdd is power supply voltage.
From (3.25) and (3.26), it is identified that the leakage power of a gate is directly proportional to
its size, and the dynamic power is proportional to the sum of the sizes of its fan-out gates.
3.3.3 Crosstalk Noise
The coupling capacitance effects in the circuits are substantial, and present a major threat to the
reliability of the designs. They induce crosstalk noise on the coupled nets leading to timing yield
failures. Although, the effect of crosstalk noise on a net can be reduced by using techniques like wire
sizing, wire shielding, wire spacing, driver sizing (victim and aggressor), and receiver sizing (victim
and aggressor), the most effective technique for reducing the crosstalk noise at the post-layout level
is primarily driver sizing. In this technique, the driving gate of the net (often referred as thevictim
net), and all other driver gates of the nets that have a coupling effect on that victim net (referred as
aggressor nets) are sized. The up-sizing of the gates increases the signal strength on corresponding
net, and hence reduces the coupling effects.
Figure 3.2 shows a simple example of the noise on a net in a single victim-aggressor pair setting.
Here, G1, G2, G3, and G4 are the gates sizes, C1 and C2 are the coupling capacitances between the
wires, and Net1 and Net2 are the internal resistances. As discussed in [43], the major contributors to
the crosstalk noise on a net are the sizes of the victim driver(G1), and aggressor driver gates (G2).
If the size of the driving gate of the net is increased, the signal strength on the net increases, thereby
reducing the coupling noise on the net. Also, if the size of the driver gate of the coupled net is
decreased, the noise on the victim net decreases. However, such down-sizing will increase the noise
on the coupled net. Similarly, the up-sizing of the victim driver will increase the noise on the coupled
nets. Thus, the sizing has symmetric effects on the coupled nets, and a gate is an aggressor as well as
a victim at the same time.
47

Figure 3.2 A coupling structure with single victim-aggressor pair setting. Here, G1, G2, G3, and G4are the four gates, Net1 and Net2 are the two nets, and C1 and C2correspond to the two half-couplingcapacitances between the nets. For the victim net, Net1, G1 is the victim driver gate and G2 is thevictim receiver gate. G3 is the aggressor driver gate for Net1 and G4 is the aggressor receiver gate forNet1.
The relationship between the sizes of the driving gates of the coupled nets is incorporated in
formulating a simple crosstalk noise model. Here, the crosstalk noise on a netNi is given as (3.27)
Ni = Fi( ∑j∈coupledsi
(si −sj))∀si ∈ n (3.27)
where,si is the size of the driving gate of the net,j is the set of all the coupled nets corresponding to
i, andsj is the size of the driver gate of the coupled net in ann-gate design. Hence, for every gate, the
noise on its fanout net is a function of the total cross-coupling capacitance on the net.
The effect of crosstalk noise in a circuit can also be minimized at another level by incorporating
the noise margin constraints in the model. These constraints control that the maximum noise a net can
48

tolerate. In the present setting, the maximum tolerable noise on netj is given by (3.28).
U j = H( ∑k= f oj
(l j −uk))∀sk ∈ coupled(sj ) (3.28)
where,l j anduk correspond to the minimum and the maximum size of the gates available in the cell
library.
3.4 Stochastic to Deterministic Gate Sizing
In this section, a relationship between the dynamic power, leakage power, and crosstalk noise, is
first identified as a function of gate sizes, and a gate sizing approach is formulated in a mathematical
programming model. These metrics are incorporated in the objective function, with the delay and noise
tolerance as the constraints. The impact of process variations in different design parameters such as
gate size, and interconnects is addressed in the delay constraints. Once the problem is formulated as a
stochastic model, it is converted to the linear deterministic mean-variance equivalent model using the
results from the methodology discussed in Section 3.2.
3.4.1 Stochastic Optimization Problem
To formulate the objective function for the multi-metric optimization problem, a relationship be-
tween the leakage power, the dynamic power, and the crosstalk noise is derived as a function of the
size of gates in the design. In section 3.3, we derived these relationships independently, which can be
summarized as follows:
• In Equation 3.25, it is identified that the dynamic power dissipation of a gate is primarily affected
by the total size of its fan-out gates in the circuit. Thus, for a gate (sayi), the total number of
gates its fan-in nets are connected to determine the impact of the gatei on the dynamic power
of the gates that are in its fan-in. Hence, the weight for sizing this gatei is proportional to the
number of gates that it is connected to in their fan-out.
• From Equation 3.26, it is shown that the leakage power of a gate is directly proportional to the
size of the gate, and hence has a direct impact. So, increasing the size of the gate would increase
the leakage power dissipation of the circuit.
49

• The crosstalk noise on a net has an inverse relationship withthe size of its driver gate. If the
driver gate is sized up, the signal strength on the net increases, and hence the crosstalk noise on
the net reduces. However, the up-sizing of the gate has an adverse effect on the coupled nets.
By up-sizing the driver gates of the coupled nets, the noise on their corresponding output nets
can be reduced.
These performance metrics are now modeled in a single objective function, which is optimized in the
presence of delay constraints. The impact of these parameters on the size of the gate is incorporated by
multiplying the dimensionless normalized coefficientsκ, ν, andξ, referring to the impact of a gate size
on the leakage power, dynamic power, and crosstalk noise respectively. The coefficientκ is directly
proportional to the size of the gate, and coefficientν is a function of the normalized impact of the
gate size on the gates that are in its fan-in. So if a gatei is in the fan-out of a large number of gates,
the impact of up-sizingi will be higher for the circuit. However,ξ is inversely proportional to the
size of the gate, and its normalized value is a function of themaximum coupling capacitance of its
corresponding net with the aggressor nets.
The objective function for the optimization problem is given by the following equation:
Minimize GS=n
∑i=1
(κsi + νsi−ξsi) (3.29)
where,si is the size of the gatei, andn is the total number of gates in the design.
Now, to derive the delay constraints for the multi-metric optimization problem, the deterministic
best case delays for each gate in the paths are identified by performing a linear programming (LP)
optimization under the path delay constraints (3.22), and the noise margin constraints (3.28). Since
delay optimization is the primary objective in any circuit optimization technique, the delay is optimized
as a pre-processing step. As shown in (3.30), the delay (tspec) is the objective function, which is
minimized to identify the best possible circuit delay. The design constraints in terms of the node
delays in the paths form the constraints for the problem. Specifically, the constraints ensure that a gate
i+1, that is connected in the fan-out of another gatei, has a delay greater than the total delay of the path
till gate i and the internal gate delay ofi. The nominal (mean values) case delay coefficients are used
during this optimization. This deterministic optimization solution generates the delay specifications
50

for all the paths in the design, which are used as constraintsin the next steps.
min tspec (3.30)
s.t. ati(p)+di ≤ ati+1(p)∀i ∈ n;∀p∈ P
di = ∑i∈p
(ai − bisi + ci ∑j∈ f oi
sj)
l i ≤ si ≤ ui∀i ∈ n
where,ati(p) is the arrival time at the gatei in path p, di is the internal gate delay ofi, andati+1(p)
is the arrival time at the next gatei + 1 in the pathp. The valuesbi , and ¯ci are the mean parameter
coefficient values, andP is the set of all the paths in the design.
After the delays are calculated, the multi-metric optimization problem is formulated for simultane-
ous optimization of crosstalk noise, leakage power, and dynamic power under delay and noise margin
constraints. The stochastic multi-metric optimization problem is given as (3.31).
min GS=n
∑i=1
(κi + νi−ξi)si (3.31)
s.t dp≤ tspec∀p∈ P
dp = ∑i∈p
(ai −bisi +ci ∑j∈ f oi
sj)
Ni ≤Ui∀i ∈ n; l i ≤ si ≤ ui∀i ∈ n
This optimization problem is stochastic in nature, sincedp contains the parametric variation coeffi-
cientsbi andci corresponding to the gate size variations. Also,tspec is a random parameter since the
variations due to interconnects are not accounted. The interconnect variations can be incorporated in
the model by consideringtspecas a distribution rather than a number.
The next step in the problem is to convert this stochastic problem into an equivalent deterministic
problem based upon the concepts of expected utility maximization and risk minimization, discussed
in Section 3.2.
51

3.4.2 Deterministic Equivalent Model
If the objective function contains random variables, the expected utility approach can be used to
transform the original stochastic optimization problem tothe deterministic equivalent model, either by
minimizing the variance subject to mean value constraints,or by maximizing the mean value subject
to the parametric variance constraints, as discussed in theEquations (3.18– 3.21). In the gate sizing
problem, this corresponds to the randomness in the parameters κ, ν andξ. The equivalent objective
function for such modeling then becomes (corresponding to Equation (3.19)),
minn
∑i=1
(κi + νi− ξi)si (3.32)
whereκi, νi , ξi correspond to the mean values of the parameters. In case of non-randomκ, ν andξ,
the deterministic values will correspond to the mean values.
The constraints for the new gate sizing problem under the scarce information, and utility maxi-
mization scenario are derived as follows:
• The linear proxy constraints in terms of variance of the random parameters, corresponding to
the constraints derived in Equation (3.20). Please note that in this work we have considered a
10% standard deviation in thetspecvalue from its mean value identified during the first step of
the optimization process. The approximation is more conservative than the one derived in [68].
A more accurate estimate can be incorporated without any modifications in the model.
σdp + σtspec <√
3(1−ω)(dp− tspec);∀p∈ P (3.33)
σdp ≡∑i∈p
(σai −σbi + σci ∑j∈ f oi
si)
dp≡∑i∈p
(ai −bi +ci ∑j∈ f oi
si)
The value of the utility maximization parameterω can be experimentally determined, and can
be kept at a high level of 0.9, 0.92 or even 0.95.
• The parametric variance constraint corresponding to the mean valued objective function is given
by,n
∑i=1
(σκi + σνi −σξi)si ≤ ρ
n
∑i=1
(κi + νi−ξi)si (3.34)
52

whereρ is the coefficient of variation. This constraint is requiredonly in situations where the
objective function also has random parameters (say random cost parameters) in it. However, in
this work, the modeling does not consider the randomness in the objective function parameters,
and hence this constraint is not utilized at all. If the coefficients in the objective function are
considered as random during the modeling, then experimentation with different values ofρ
provides a complete frontier of the optimal solutions.
• The Non-random constraints, and the conditions corresponding to the available gate size ranges
are maintained.
Ni ≤Ui ;∀i ∈ n (3.35)
l i ≤ si ≤ ui ;∀i ∈ n (3.36)
Thus, the stochastic problem defined in Equation (3.31), is converted into a deterministic equiv-
alent multi-metric model given by Equations (3.32), (3.33), (3.34), (3.35) and (3.36) which can be
solved using any linear programming optimization tool.
3.5 Experimental Results
In this section, we present the simulation results to verifythe efficiency, accuracy and efficacy
of this methodology. First, a sensitivity analysis is performed to evaluate the sensitivity of the ex-
pected utility assurance constant (ω) with reference to the timing yield and the optimization of the
metrics. The analysis helps in identifying the optimum value of ω corresponding to the optimization
requirements. The risk averse optimization algorithm is then evaluated on the benchmark circuits for
optimization of different metrics and the execution time. Also, the approach is compared with a re-
cently proposed device variation aware mathematical programming based approach. The algorithm is
then used to perform single metric optimization, and the results are compared with the multi-metric op-
timization values to evaluate the relative impact of a single metric optimization on the sub-optimality
introduced in other metrics. Finally, the impact of incorporating interconnect variations in addition
to the gate size variations in the algorithm is analyzed. It is important to note that this method has
been transformed from a path based approach to an equivalentnode based approach according to the
technique proposed in [47]. This controls the size of the problem to further improve the runtime and
53

feasibility for large circuits. The sub-optimality introduced due to the transformation is close to 2%
for circuits with 20 levels of logic.
3.5.1 Setup
The multi-metric optimization algorithm for gate sizing under process variations was rigorously
tested on the ITC’99 benchmark circuits. The setup consisted of three steps, as listed below.
• The RTL level VHDL net-lists of the benchmark circuits were extracted for generating gate
level Verilog files using theSynopsys Design Compilertool. These gate level Verilog files
and the TSMC 180nm Standard Cell libraries (LEF, TLF, DB Files etc.) were then used to
place and route the designs and generate the DEF files, cell delay information etc. using the
Cadence Design Encountertoolkit. The benchmark circuits were synthesized using TSMC
180nm libraries since the lower level libraries were not available to us.
• The parasitic resistance and capacitance information (SPEF file) was extracted from the routed
designs using the CadenceFire N’ Ice RC extractor. This information was utilized for extracting
the coupling capacitance from the routed circuits. A PERL script was written to extract the
coupling capacitance information of each net with its top three coupled nets from the SPEF file.
• The delay coefficients for available gate sizes (1x - 6x) and fan-outs of the standard cells in the
TSMC 180nm standard cell library were characterized using the HSPICE simulations. Also,
the variations in gate sizing parameters were assumed to be 25% of the nominal values, which
were appropriately translated to the coefficientsa, b andc in Equation 3.22. A conservative
estimate of 10% variance for the interconnect variations inthe best case delay constraints was
incorporated in the model. The best case delays were identified in a pre-processing step, through
the unconstrained linear programming optimization.
After the delays, coupling noise etc. were calculated for the benchmark circuits, the stochastic gate
sizing optimization problem was formulated. The algorithmfor formulating the stochastic linear pro-
gramming model was programmed in C language. Next, the stochastic problem was converted into
a deterministic linear programming equivalent model through the expected utility maximization ap-
proach. The linear program was then converted to the standard AMPL format, which was solved using
54

the robust KNITRO [96] optimization solver. KNITRO uses interior point and active set methods for
optimization and is capable of utilizing multiple processors. This solver is specifically designed to
solve problems with large dimensionality. A detailed system flow is shown in Figure 3.3.
Figure 3.3 Simulation setup for the risk averse gate sizing optimization problem. The Synopsys andCadence tools are used to generate DEF, CAP, Verilog and SPEFfiles for each benchmark circuit.These files, and the delay coefficients (a,b,c)determined by the extensive SPICE siimulations areutilized in formulating the unconstrained linear programming problem, which is solved to evaluate thebest delays for each benchmark. The multi-metric stochastic optimization problem is then formulatedand converted to the equivalent risk averse deterministic problem. These linear programming problemsare then solved using the KNITRO optimization solver.
55
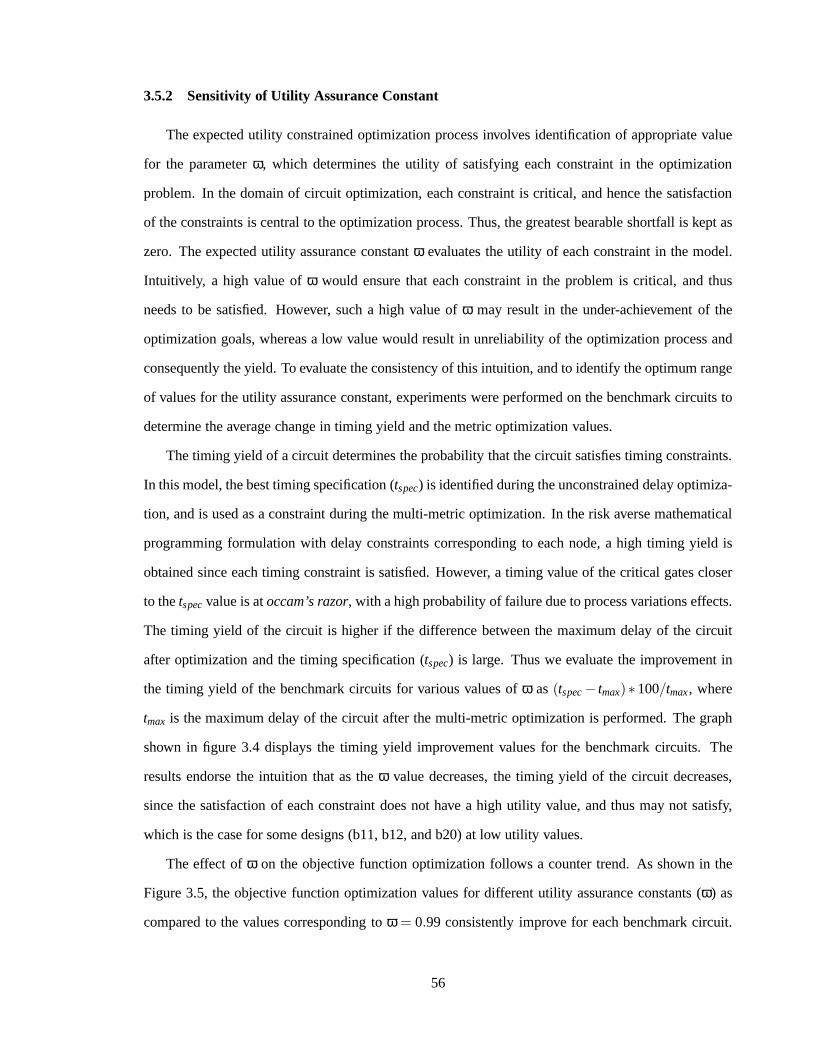
3.5.2 Sensitivity of Utility Assurance Constant
The expected utility constrained optimization process involves identification of appropriate value
for the parameterω, which determines the utility of satisfying each constraint in the optimization
problem. In the domain of circuit optimization, each constraint is critical, and hence the satisfaction
of the constraints is central to the optimization process. Thus, the greatest bearable shortfall is kept as
zero. The expected utility assurance constantω evaluates the utility of each constraint in the model.
Intuitively, a high value ofω would ensure that each constraint in the problem is critical, and thus
needs to be satisfied. However, such a high value ofω may result in the under-achievement of the
optimization goals, whereas a low value would result in unreliability of the optimization process and
consequently the yield. To evaluate the consistency of thisintuition, and to identify the optimum range
of values for the utility assurance constant, experiments were performed on the benchmark circuits to
determine the average change in timing yield and the metric optimization values.
The timing yield of a circuit determines the probability that the circuit satisfies timing constraints.
In this model, the best timing specification (tspec) is identified during the unconstrained delay optimiza-
tion, and is used as a constraint during the multi-metric optimization. In the risk averse mathematical
programming formulation with delay constraints corresponding to each node, a high timing yield is
obtained since each timing constraint is satisfied. However, a timing value of the critical gates closer
to thetspecvalue is atoccam’s razor, with a high probability of failure due to process variations effects.
The timing yield of the circuit is higher if the difference between the maximum delay of the circuit
after optimization and the timing specification (tspec) is large. Thus we evaluate the improvement in
the timing yield of the benchmark circuits for various values of ω as(tspec− tmax) ∗100/tmax, where
tmax is the maximum delay of the circuit after the multi-metric optimization is performed. The graph
shown in figure 3.4 displays the timing yield improvement values for the benchmark circuits. The
results endorse the intuition that as theω value decreases, the timing yield of the circuit decreases,
since the satisfaction of each constraint does not have a high utility value, and thus may not satisfy,
which is the case for some designs (b11, b12, and b20) at low utility values.
The effect ofω on the objective function optimization follows a counter trend. As shown in the
Figure 3.5, the objective function optimization values fordifferent utility assurance constants (ω) as
compared to the values corresponding toω = 0.99 consistently improve for each benchmark circuit.
56
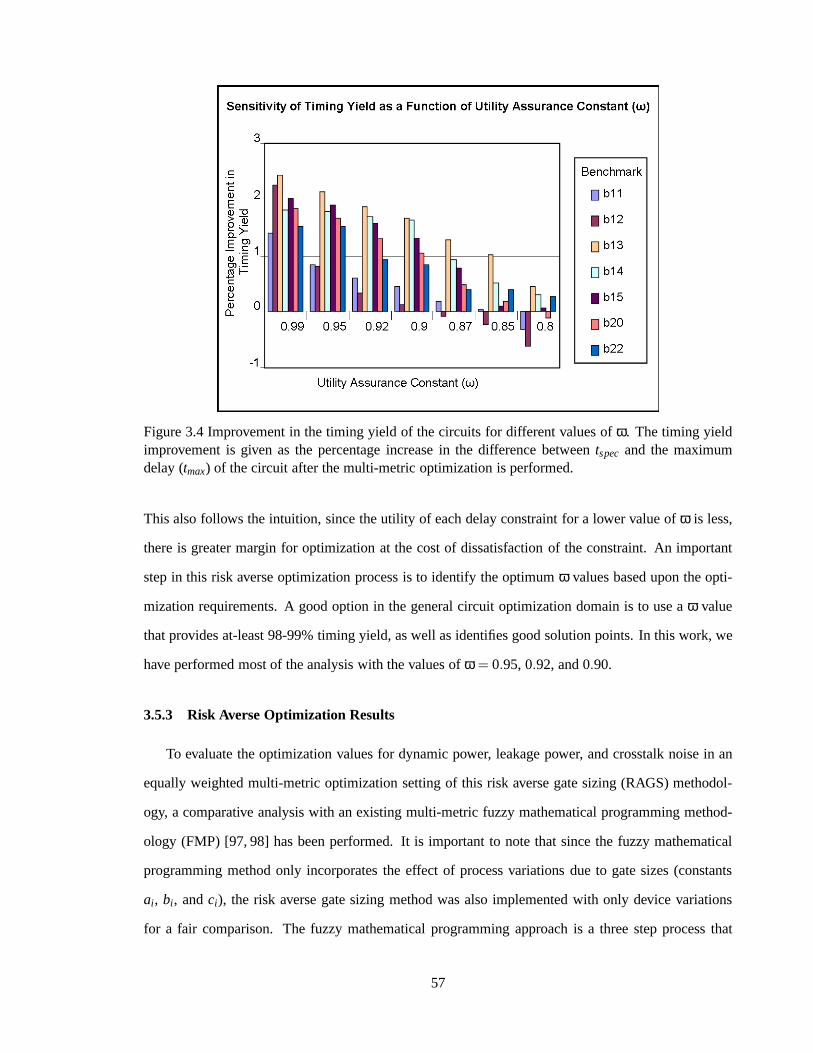
Figure 3.4 Improvement in the timing yield of the circuits for different values ofω. The timing yieldimprovement is given as the percentage increase in the difference betweentspec and the maximumdelay (tmax) of the circuit after the multi-metric optimization is performed.
This also follows the intuition, since the utility of each delay constraint for a lower value ofω is less,
there is greater margin for optimization at the cost of dissatisfaction of the constraint. An important
step in this risk averse optimization process is to identifythe optimumω values based upon the opti-
mization requirements. A good option in the general circuitoptimization domain is to use aω value
that provides at-least 98-99% timing yield, as well as identifies good solution points. In this work, we
have performed most of the analysis with the values ofω = 0.95, 0.92, and 0.90.
3.5.3 Risk Averse Optimization Results
To evaluate the optimization values for dynamic power, leakage power, and crosstalk noise in an
equally weighted multi-metric optimization setting of this risk averse gate sizing (RAGS) methodol-
ogy, a comparative analysis with an existing multi-metric fuzzy mathematical programming method-
ology (FMP) [97, 98] has been performed. It is important to note that since the fuzzy mathematical
programming method only incorporates the effect of processvariations due to gate sizes (constants
ai , bi , andci), the risk averse gate sizing method was also implemented with only device variations
for a fair comparison. The fuzzy mathematical programming approach is a three step process that
57

Figure 3.5 Percentage improvement in the optimization of the objective function for various values ofω. The objective function improvements are compared with thevalues obtained forω = 0.99.
first calculates the worst case and nominal case gate size values, with the optimal delays incorporated
as constraints in a similar fashion as this approach. These values are then used to formulate a fuzzy
non-linear program that is solved for optimization. The results for two values of utility assurance
constantω = 0.90 andω = 0.95 are shown in the Table 3.1. The results indicate that the optimiza-
tion values obtained using the risk averse gate sizing method is comparable to the fuzzy mathematical
programming results. On average, the improvement in metricoptimization values for each metric is
approximately equal to the FMP counter-parts forω = 0.95. The RAGS performed slightly better
than FMP in terms of metrics optimizations forω = 0.90. However, an important aspect of the risk
averse gate sizing approach is the execution time of the algorithm. As shown in last three columns of
Table 3.1, the algorithm execution time of our methodology is significantly less as compared to the
FMP method. The RAGS is 5.85 times faster than the FMP method for ω = 0.90 and more than 6.4
times faster forω = 0.95. This is attributed to the fact that the RAGS method is a single step linear
programming method as compared to FMP method which requiresthree steps, and the last step is a
non-linear program. This is significantly important for larger circuits like b17 which have more than
21000 gates.
58

This algorithm can be utilized to perform single metric optimization of the metrics depending upon
the design requirements. The metric to be optimized can be prioritized by assigning a high weight vec-
tor to it. For example, if the designer intends to optimize only leakage power, then the weight vector
corresponding toκ is assigned as 1 where as the other metricsξ andν in the objective function are
assigned as 0 and 0 respectively. However, during such optimization the improvement in the optimiza-
tion values of the corresponding metric comes at the cost of introducing sub-optimality in the values
of other metrics. We have compared the results of single metric optimizations for dynamic power,
leakage power and crosstalk noise, with the equally weighted simultaneous multi-metric optimization
of all three metrics. The results of the average change in theoptimization values for the metrics as
compared to multi-metric optimization in all three cases isshown in Table 3.2.
The dynamic power dissipation for single metric optimization is lower than the multi-metric op-
timization (as shown in column 2 of Table 3.2). However, it isinteresting to note that on average,
dynamic power dissipation is reduced at the cost of leakage power and not crosstalk noise. This trend
occurs due to the fact that during the dynamic power minimization, fewer gates are resized from the
sub-optimal sizes (after delay optimization) as compared to leakage power optimization. This results
in a decrease in dynamic power, but the leakage power is largely unaffected. When only leakage power
is optimized, the optimization introduces sub-optimalityprimarily in crosstalk noise metric. This is
intuitive, since the leakage power is directly proportional to the gate sizes, where-as the crosstalk
noise has an inverse relationship with the gate sizes. When the single metric optimization for crosstalk
noise is performed, the gate sizing problem translates intoa maximization problem. The reduction
in crosstalk noise as compared to the equally weighted multi-metric optimization is notable (almost
47%). This is due to the fact that the maximization problem satisfies the delay constraints much easily
as compared to the minimization problem. Increasing the gate sizes reduces the crosstalk noise, as
well as the gate delays. However, this increases the power dissipation of the design by 30%.
3.5.4 Optimization Considering Device and Interconnect Variations
In this set of experiments, both device level (gate size) variations as well as interconnect varia-
tions are incorporated in the model, and the impact of interconnect variations on the optimization of
objective function and the timing yield is analyzed. The results are compared to the scenario where
59

multi-metric optimization is performed considering only gate size variations. The overall variations
due to interconnects are assumed to be 10% of the nominal casevalues, and are incorporated in the
delay constraints by adding a variance of 10% to the optimal delay values (tspec). The utility assurance
constantω is kept as 0.92. As shown in Figure 3.6, the risk averse gate sizing methodology ensures
that the timing yield of the circuit is not sacrificed, even though the optimization results are affected.
It is interesting to note that the in the presence of interconnect variations, the timing yield for most
cases actually improves, since the methodology is risk averse, and intends to satisfy the constraints
with high utility. Due to this, the optimization is adversely affected.
Figure 3.6 Impact of interconnect variations and gate size variations on the optimization of the met-rics. In these experiments, the interconnect variations (of 10% variation from the mean value) areincorporate in addition to the gate size variations. The percentage change in the yield improvementfor the two cases (gate size variations and gate size and interconnect variations respectively), and thecorresponding percentage change in the objective functionachievement for the latter case (gate sizeand interconnect variations) as compared to the former (only gate size variations) are plotted in thegraph. The value for expected utility assurance is kept atω = 0.92.
60

3.6 Discussion
In this work, a new algorithm for simultaneous multi-metricoptimization of delay, dynamic power,
leakage power and crosstalk noise in presence of process variations and scarce information has been
developed. The algorithm is independent of the underlying variation distribution, and can handle the
impact of variations at several levels including variations due to gate sizes and due to interconnects.
This expected utility maximization based methodology models the problem in a mean-variance based
deterministic linear programming model, which optimizes the objectives while ensuring high levels
of expected utility for constraints satisfaction. The experiments conducted on the ITC’99 benchmarks
suggest that the algorithm is multi-fold faster than the existing mathematical programming algorithms
available in the literature, and ensures comparable optimization results. Good optimization results and
timing yields are obtained when the utility assurance constantω is kept at the levels between 0.95 and
0.90. A comparative study between the single metric and the multi-metric optimization reveals that the
improvements in a single metric are largely achieved by incorporating sub-optimality in other metrics.
This method is capable of incorporating more optimization metrics like security and reliability etc.,
if the metric can be expressed as a function of gate sizes. In general, the methodology developed in
this work is a fast, accurate, and efficient tool for nano-level post-layout gate sizing optimization for
complex circuits, where the complete variation distribution information is unavailable.
61

Table 3.1 Comparison between equally weighted multi-metric optimization of leakage power, dynamic power and crosstalk noise for risk aware gatesizing (RAGS) and fuzzy mathematical programming (FMP).
Comparison for Expected Utility Assurance Constantω = 0.90
ITC’99 Number Optimal †Performance of RAGS as Compared to FMP Exec. Time(ET) (secs) Speed-upBenchmark of gates Delay (ns) Dynamic Power Leakage Power Crosstalk Noise RAGS FMP of RAGS
b11 385 0.71 15.65% 18.75% -5.91% 0.53 2.35 4.43xb12 834 0.36 5.86% 7.52% 9.44% 9.63 38.65 4.01xb13 249 0.26 -3.95% -6.05% -2.69% 0.143 0.848 5.93xb14 4232 2.5 -5.42% -5.59% 9.31% 23 177 7.7xb15 4585 3.43 -1.58% -1.26% 5.98% 54 213 3.94xb20 8900 3.59 8.89% 9.75% -4.58% 97 713 7.35xb22 12128 2.63 3.69% 4.08% 1.48% 145 978 6.74xb17 21191 2.68 3.89% 1.79% -3.99% 349 2338 6.7x
Percentage Change 3.38% 3.62% 1.13% 5.85x
Comparison for Expected Utility Assurance Constantω = 0.95
b11 385 0.71 13.40% 16.28% -7.49% 0.51 2.35 4.6xb12 834 0.36 4.03% 5.33% 14.56% 8.38 38.65 4.61xb13 249 0.26 -4.82% -7.59% 2.17% 0.131 0.848 6.47xb14 4232 2.5 4.66% 4.95% -9.20% 19 177 9.31xb15 4585 3.43 -6.78% -6.46% 13.21% 49 213 4.34xb20 8900 3.59 -9.12% -9.36% 0.82% 88 713 8.1xb22 12128 2.63 1.50% 1.75% -4.66% 141 978 6.93xb17 21191 2.68 2.53% 1.21% -2.34% 330 2338 7.08x
Percentage Change 0.68% 0.77% 0.88% 6.43x†: The Percentage Change in the optimization of each metric is computed using the formula(ETFMP−ETRAGS)∗100/ETRAGS
62

Table 3.2 Comparison between equally weighted multi-metric optimization withω = 0.92 and single metric optimization for dynamic power, leakagepower, and crosstalk noise metrics.
ITC’99 †Dynamic Power Optimization ‡Leakage Power Optimization∓ Crosstalk Noise OptimizationBenchmark ∗DP ∗∗LP Noise DP LP Noise DP LP Noise
b11 33.05% -7.21% -9.57% -5.90% 36.94% -22.37% -11.73% -13.09% 29.49%b12 35.87% -9.03% -20.79% -8.29% 37.36% -33.76% -11.20% -12.09% 28.28%b13 1.18% -15.54% 3.01% -13.09% 1.83% 12.29% -18.51% -18.99% 77.61%b14 17.90% -3.54% 1.98% -2.87% 19.25% -26.84% -7.54% -7.77% 16.57%b15 40.47% -8.67% -2.82% -7.97% 41.20% -21.88% -21.37% -21.30% 42.91%b20 9.15% -14.17% 13.76% -13.15% 10.07% -29.70% -18.03% -18.75% 76.01%b22 18.07% -11.49% 6.45% -10.83% 19.33% -19.25% -13.24% -13.84% 57.59%
Average 22.24% -9.95% -1.12% -8.87% 23.71% -20.21% -14.52% -15.12% 46.92%†: Percentage Change in metric values when single metric optimization for Dynamic Power is performed‡: Percentage Change in metric values when single metric optimization for Leakage Power is performed∓: Percentage Change in metric values when single metric optimization for Crosstalk Noise is performed∗: Dynamic Power ∗∗: Leakage Power
63

CHAPTER 4
INTEGRATED FRAMEWORK FOR CIRCUIT OPTIMIZATION
In the nanometer regime, the transition of the process technology from one generation to the next
is contributing toward the identification of new metrics that can significantly affect the performance
and reliability of the designs. Thus, circuit optimizationtechniques developed to address the current
generation VLSI optimization issues may not be applicable to the future generation optimization re-
quirements. Also, a wide spectrum of devices incorporate VLSI circuits as an integral part of the
design. The design requirements of these devices vary widely. For example, mobile devices primar-
ily require low power dissipating design, while mission critical devices must ensure that the design
is reliable. Thus, there is a need for new horizontally and vertically integrated circuit optimization
solutions that are completely reconfigurable in terms of themetrics to be optimized, the optimization
methodology to be utilized, and the relative priorities with which the metrics are optimized. Thus, in
this chapter, a framework to optimize multiple performancemetrics in a unified manner is developed.
In this variation aware optimization model, a relationshipbetween the optimization metrics (like dy-
namic power, leakage power, and crosstalk noise) as a function of gate sizes is incorporated in the
objective function. The delay values obtained from unconstrained delay optimization, and noise mar-
gins obtained from the coupling capacitance information form the constraints form the optimization
problem, which is then solved for simultaneous optimization of multiple metrics. The framework is
independent of the optimization methodology, and can be implemented using any mathematical pro-
gramming approach. It is completely reconfigurable and generalized such that metrics can be selected,
removed, or prioritized for relative importance dependingupon the design requirements. This frame-
work is implemented, and tested on ITC’99 benchmarks for different combinations of multi-metric
and single metric optimizations of delay, dynamic power, leakage power, and crosstalk noise. The
results indicate that the approach identifies good solutionpoints, and is an efficient mechanism for
post-layout optimization via gate sizing.
64

4.1 Need for Integrated Framework
In the nano-meter regime, the increase in density and complexity of the VLSI circuits has affected
the circuit optimization process in several ways. First, the inter-relationships between the metrics like
delay, power, and crosstalk noise have become more intricate in such a manner that the optimization
of one metric may worsen the optimality of other metrics. Thus, the optimization of a single metric
may no longer be adequate. Second, due to aggressive scaling, the wiring density and consequently
the aspect ratios in metal lines have increased, there-by magnifying the impact of coupling capacitance
between the nets. The crosstalk noise induced between the coupled nets could cause functional failures
in the circuits. As a simple example, if a gate sizing technique is aimed at only power minimization
of a given circuit, based on timing constraints, the resulting gate size configuration could potentially
have a high interconnect crosstalk noise.
According to the technology trends [99], these effects and uncertainties are expected to worsen in
future, and optimization methodologies which result in a performance shift from one objective to an-
other will not be acceptable. From the VLSI circuit optimization perspective, an important challenge
is to identify vertically as well as horizontally integrated solution methodologies [14]. This necessi-
tates the examination of new approaches that can simultaneously optimize multiple design parameters
for feasible solutions to circuit design problems.
Another important aspect in nano-level VLSI design and the optimization process is to address the
effect of process variations, which introduce uncertaintyin the geometries of devices like gate sizes
(gate length, oxide thickness etc.) of the fabricated circuits. As shown in Figure 2.5, at sub-100nm
levels, the intra-die parametric and systematic variations are comparable to the random variations [1].
The effects of layout schematics as well as parametric variations increase significantly due to the
shrinking geometries. The uncertainty due to these manufacturing variations impacts the performance
characteristics and the reliability of the circuits. An optimization model that does not incorporate the
impact of process variations could result in inaccurate analysis.
In this work, we present a new variation aware multi-metric gate sizing framework that can be used
to perform optimization of several metrics like delay, leakage power, dynamic power, and crosstalk
noise etc. This approach is completely reconfigurable and generalized in terms of its capability to
incorporate new metrics and selectively prioritize the metrics depending upon the design requirements,
65

with minimal changes in the model. More importantly, any mathematical programming approach can
be utilized within this framework, to solve the optimization problem. An important aspect of this
approach is the identification of the inter-relationships between dynamic power, leakage power, and
crosstalk noise in terms of gate sizes, and modeling them in aunified framework.
In this framework, since delay is the primary objective in any circuit optimization process, it is
optimized with highest priority as a first step in the process. The delay values obtained from uncon-
strained delay optimization are then used as constraints during the simultaneous optimization of other
metrics: dynamic power, leakage power and crosstalk noise.The process variation effects due to gate
sizes (channel length, oxide thickness) are incorporated in the model, and a grid based model is used
to address the spatial correlation effects [62].
The state of the art research in VLSI design optimization that consider the impacts of process
variations has been discussed in details in the Section 2.4 of Chapter 3. The methods implemented for
optimizing various metrics has been studied and compared. Also, the different mathematical program-
ming techniques available in the literature, their properties and limitations are reviewed in that section.
One of these, or any other mathematical programming methodology may be used as the optimization
tool in this framework, without any apparent modification inthe modeling. The readers might want to
visit Sections 2.4 and 3.3 again to follow the material presented in the rest of this chapter.
The rest of the chapter is organized as follows. In Section 4.2, single metric mathematical pro-
gramming optimization models for leakage power, dynamic power, and crosstalk noise are derived
on the basis of the parametric models derived in the Section 3.3 of Chapter 3. The relationship be-
tween the design parameters in terms of gate sizes, and the steps involved in modeling the problem in
a multi-metric optimization framework are presented in section 4.3. Also, a mathematical program-
ming approach that is utilized for optimization in this workis briefly discussed. In Section 4.4, the
simulation setup, experimental results for various optimization scenarios, and analysis are presented,
followed by a summary and discussion in Section 4.5.
4.2 Single Metric Optimization Models
An important step in modeling any problem in a mathematical programming framework is to
identify the relationships between the design parameters.A model that relates the parameters in a
66

simple yet accurate fashion improves the optimization process both in terms of the efficiency and
the applicability of the model. In this section, we present the general mathematical programming
formulations for optimization of each metric, delay, power, and crosstalk noise.
4.2.1 Unconstrained Delay Optimization
Delay is an important optimization metric in any circuit optimization problem. Since a delay
optimized circuit has higher timing yield, the delay is considered as the most critical metric to be
optimized in any generalized framework. In the presence of process variations at the nanometer level,
delay uncertainty can be reduced by performing unconstrained delay optimization. The mathematical
programming model for unconstrained delay optimization isgiven by equation (4.1). The noise margin
constraints that control the maximum noise a net can tolerate has been derived in Equation (3.28). The
design constraints in terms of the node delays in the paths form the constraints for the problem.
min tspec (4.1)
s.t ati(p)+di ≤ ati+1(p)∀i ∈ n;∀p∈ P
Ni ≤Ui∀i ∈ n
di = ∑i∈p
(ai −bisi +ci ∑j∈ f oi
sj)
l i ≤ si ≤ ui∀i ∈ n
Similar to the Equation (3.30), theati(p) is the arrival time at the gatei in pathp, di is the internal gate
delay ofi, andati+1(p) is the arrival time at the next gatei +1 in the pathp. Ui is the upper bound on
the noise margin, andNi is the noise margin of the current net. The valuesbi , andci are the uncertain
parameter coefficient values, andP is the set of all the paths in the circuit. The linear delay model is
adapted from [95] and has been described in Equation (3.22).
4.2.2 Power Optimization Under Delay Constraints
The power models proposed by Gao and Hayes [51] have been adapted to identify the leakage
power and the dynamic power as a function of gate sizes in Equations (3.26) and (3.25) respectively.
67

These equations can be used to formulate the mathematical programming model for power optimiza-
tion under delay constraints.
From (3.26) and (3.25), it is identified that the leakage power of a gate is directly proportional to
its size, and the dynamic power is proportional to the sum of the sizes of its fan-out gates. Hence,
using the linear delay model, the problem of leakage and dynamic power optimization under delay
constraints can be given by (4.2).
minn
∑i=1
(θ∗si + φ∗si) (4.2)
s.t. di ≤ di(max)∀i ∈ n
l i ≤ si ≤ ui∀i ∈ n
where,θ corresponds to the normalized impact (weight) of gate size on the leakage power, andφ
corresponds to the normalized impact of the gate size on the fan-in gates of the design, and effectively
the dynamic power impact. Here,di is the delay of gatei, di(max) is the upper bound on the delay
of gatei, according to the timing specifications in a node based model, n is total number of gates in
the design, andl i andui are the minimum and maximum available gate sizes in the standard library,
respectively.
4.2.3 Crosstalk Noise Optimization Under Delay Constraints
The relationship between the sizes of the driving gates of the coupled nets, derived in Equation
(3.27) can be incorporated in formulating a linear programming formulation for the crosstalk noise
optimization under delay constraints. Here, for every gatesi , the noise on its fan-out net is a function
of the total cross-coupling capacitance on the net. So, given a weight vectorξ as a function of the
cross-coupling capacitance on the net, such thatξi∀i ∈ n, andξi ≥ 0, an equivalent node based linear
programming model for crosstalk noise optimization by gatesizing can be formulated for maximizing
the weighted sum of the gate sizes, under delay and noise margin constraints. The linear programming
68
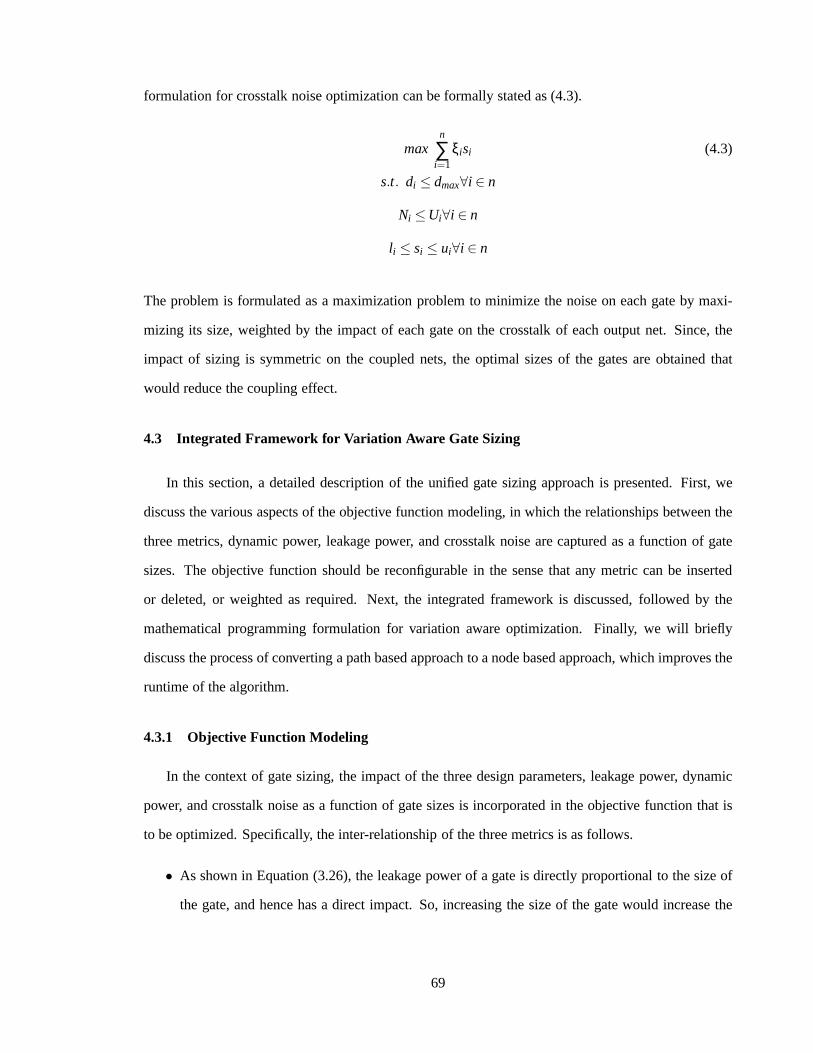
formulation for crosstalk noise optimization can be formally stated as (4.3).
maxn
∑i=1
ξisi (4.3)
s.t. di ≤ dmax∀i ∈ n
Ni ≤Ui∀i ∈ n
l i ≤ si ≤ ui∀i ∈ n
The problem is formulated as a maximization problem to minimize the noise on each gate by maxi-
mizing its size, weighted by the impact of each gate on the crosstalk of each output net. Since, the
impact of sizing is symmetric on the coupled nets, the optimal sizes of the gates are obtained that
would reduce the coupling effect.
4.3 Integrated Framework for Variation Aware Gate Sizing
In this section, a detailed description of the unified gate sizing approach is presented. First, we
discuss the various aspects of the objective function modeling, in which the relationships between the
three metrics, dynamic power, leakage power, and crosstalknoise are captured as a function of gate
sizes. The objective function should be reconfigurable in the sense that any metric can be inserted
or deleted, or weighted as required. Next, the integrated framework is discussed, followed by the
mathematical programming formulation for variation awareoptimization. Finally, we will briefly
discuss the process of converting a path based approach to a node based approach, which improves the
runtime of the algorithm.
4.3.1 Objective Function Modeling
In the context of gate sizing, the impact of the three design parameters, leakage power, dynamic
power, and crosstalk noise as a function of gate sizes is incorporated in the objective function that is
to be optimized. Specifically, the inter-relationship of the three metrics is as follows.
• As shown in Equation (3.26), the leakage power of a gate is directly proportional to the size of
the gate, and hence has a direct impact. So, increasing the size of the gate would increase the
69

leakage power dissipation of the circuit. The components like the input transition probabilities,
leakage current and the input patterns also impact the leakage power dissipation of the circuit.
• The relationship between the dynamic power dissipation andthe gate sizes is shown in Equation
(3.25). The dynamic power dissipation of a gate is primarilyaffected by the total size of its fan-
out gates in the circuit. Thus, for a gatei, the total number of gates its fan-in nets are connected
to, determine the impact of the gatei on the dynamic power of the gates that are in its fan-in.
Hence, the weight for sizing this gatei is proportional to the number of gates that it is connected
to in their fan-out.
• As discussed in the previous section, the crosstalk noise ona net primarily depends upon the
size of its driver gate and the sizes of the driver gates of thecoupled nets. Hence, crosstalk noise
has an inverse relationship with the gate size. If the driving gate of a net is sized up, the signal
strength on the net increases and hence the crosstalk noise on the net reduces. However, the
up-sizing of the gate has an adverse effect on the coupled nets. By up-sizing the driver gates of
the coupled nets, the noise on those nets can be reduced.
These performance metrics can be modeled in a single objective function, which is optimized
in the presence of delay constraints. Hence, three dimensionless normalized coefficientsθ, φ, and
ξ, referring to the impact of gate sizing on the leakage power,dynamic power, and crosstalk noise
respectively are incorporated in the objective function. The coefficientθ is directly proportional to the
size of the gate, and coefficientφ is a function of the normalized impact of the gate size on the gates
that are in its fan-in. So if a gatei is in the fan-out of a large number of gates, the impact of up-sizing
i will be higher for the circuit. However,ξ is inversely proportional to the size of the gate, and its
normalized value is a function of the maximum coupling capacitance of its corresponding net with the
aggressor nets. The higher the cross-coupling capacitancevalue higher is the coefficient value.
To incorporate the capability to select among the objectivefunctions, three constantsα, β, andγ
are multiplied to the coefficientsθ, φ, andξ, controlling the impact of these coefficients on the final
objective achievement. For example, if all the three objectives leakage power, dynamic power, and
crosstalk noise are equally weighted, thenα = β = γ = 0.33.
70
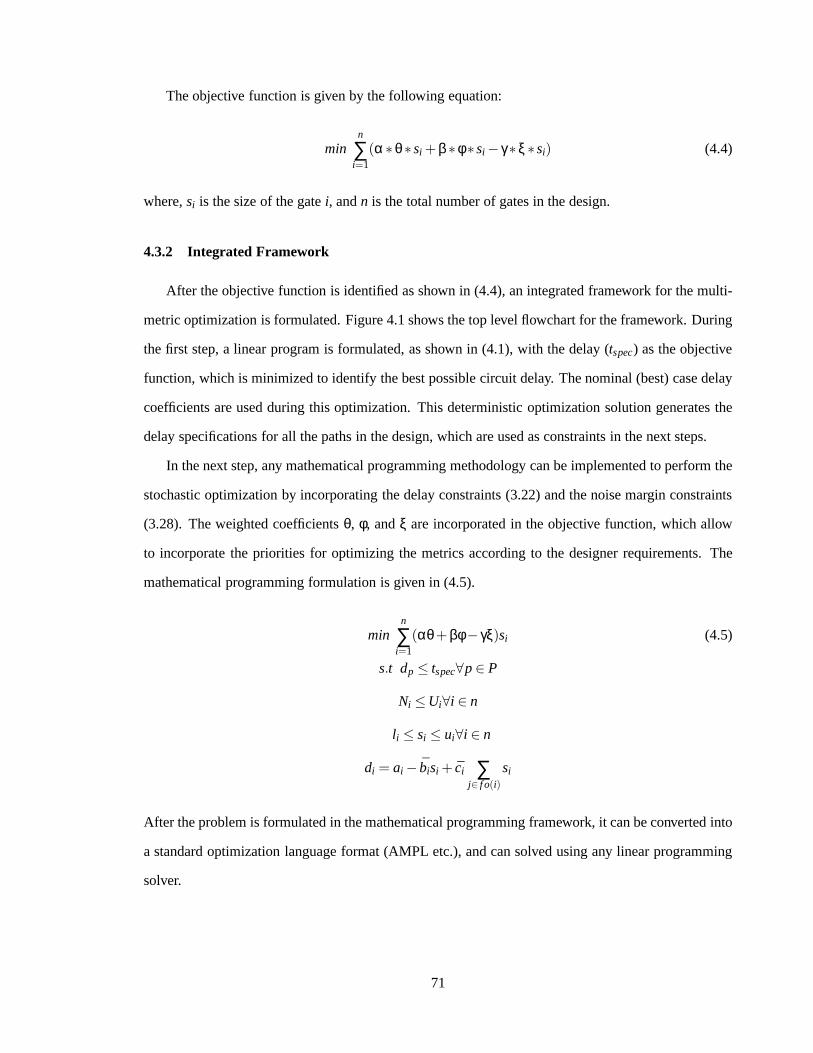
The objective function is given by the following equation:
minn
∑i=1
(α∗θ∗si + β∗φ∗si− γ∗ξ∗si) (4.4)
where,si is the size of the gatei, andn is the total number of gates in the design.
4.3.2 Integrated Framework
After the objective function is identified as shown in (4.4),an integrated framework for the multi-
metric optimization is formulated. Figure 4.1 shows the toplevel flowchart for the framework. During
the first step, a linear program is formulated, as shown in (4.1), with the delay (tspec) as the objective
function, which is minimized to identify the best possible circuit delay. The nominal (best) case delay
coefficients are used during this optimization. This deterministic optimization solution generates the
delay specifications for all the paths in the design, which are used as constraints in the next steps.
In the next step, any mathematical programming methodologycan be implemented to perform the
stochastic optimization by incorporating the delay constraints (3.22) and the noise margin constraints
(3.28). The weighted coefficientsθ, φ, andξ are incorporated in the objective function, which allow
to incorporate the priorities for optimizing the metrics according to the designer requirements. The
mathematical programming formulation is given in (4.5).
minn
∑i=1
(αθ+ βφ− γξ)si (4.5)
s.t dp≤ tspec∀p∈ P
Ni ≤Ui∀i ∈ n
l i ≤ si ≤ ui∀i ∈ n
di = ai − bisi + ci ∑j∈ f o(i)
si
After the problem is formulated in the mathematical programming framework, it can be converted into
a standard optimization language format (AMPL etc.), and can solved using any linear programming
solver.
71
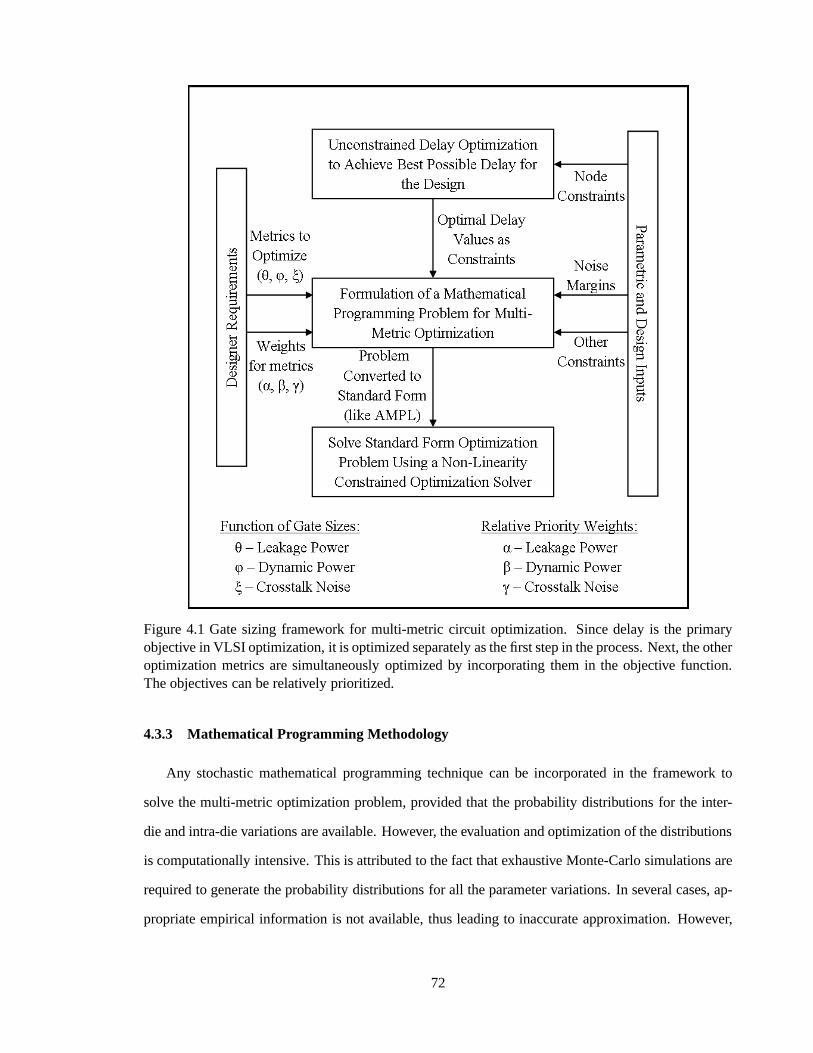
Figure 4.1 Gate sizing framework for multi-metric circuit optimization. Since delay is the primaryobjective in VLSI optimization, it is optimized separatelyas the first step in the process. Next, the otheroptimization metrics are simultaneously optimized by incorporating them in the objective function.The objectives can be relatively prioritized.
4.3.3 Mathematical Programming Methodology
Any stochastic mathematical programming technique can be incorporated in the framework to
solve the multi-metric optimization problem, provided that the probability distributions for the inter-
die and intra-die variations are available. However, the evaluation and optimization of the distributions
is computationally intensive. This is attributed to the fact that exhaustive Monte-Carlo simulations are
required to generate the probability distributions for allthe parameter variations. In several cases, ap-
propriate empirical information is not available, thus leading to inaccurate approximation. However,
72

it is possible for experts to predict the pessimistic corners, and optimistic corners for the different un-
certain parameters. Interval mathematics based techniques such as fuzzy mathematical programming
technique can use such top level information to make better decisions in such situations. Also, Buck-
ley [100] has shown that fuzzy programming based optimization guarantees solutions that are better
or at least as good as their stochastic counterparts, since they identify the supremum of all the feasible
solutions and not the averages. Thus, we choose the fuzzy mathematical programming technique as
the solution methodology to illustrate our framework.
Here, we will briefly present the methodology and the formulations. Algorithm Algorithm 4.1
shows the steps involved in the process. In the fuzzy mathematical programming method [48], the
parametric variations in the delay equation are modeled as fuzzy number triplets of the form (bi , bi−gi ,
bi +gi) and (ci , ci−hi , ci +hi). Here,gi andhi correspond to maximum variations for the coefficients
bi andci respectively. The coefficientbi approximates the variation in effective channel length (Le f f),
whereasci approximates the variations in oxide thickness (tox).
Algorithm 4.1 Multi-metric gate sizing algorithmRequire: Parasitic information from SPEF File, Design variables from DEF, CAP, and structural
Verilog files, characterized values for nominal and worst case delay coefficientsa, b, andc.Ensure: Optimal Gate sizes
1: Evaluate the nominal case delay(tspec) by solving a path constrained linear programming formula-tion, incorporating the nominal case delay coefficients in the linear delay model given in Equation(3.22)
2: Formulate and solve the nominal case multi-metric gate sizing problem through a deterministic LPformulation with noise and power objectives, and nominal case delay and noise margin constraints.Also, incorporate the spatial correlations in the modelingof the problem
3: Store the nominal case results for noise (Nnc) and gate sizes (Snc)4: Formulate and solve the worst case multi-metric gate sizingproblem through a deterministic LP
formulation with noise and power objectives, and worst casedelay and noise margin constraints.Also, incorporate the spatial correlations in the modelingof the problem
5: Store the worst case results for noise (Nwc) and gate sizes (Swc)6: Using gate size valuesSnc andSwc, and the noise resultsNnc andNwc, formulate a crisp fuzzy
non-linear program to maximize the variation parameterλ, under delay and noise constraints
In the worst case optimization scenario, the maximum possible variations are assumed and a pes-
simistic approximation is performed, and the delay equation is given by (4.6).
di = ai− (bi −gi)si +(ci +hi) ∑j∈ f o(i)
si (4.6)
73

In the nominal case optimization, the delay equation is given as follows:
di = ai −bisi +ci ∑j∈ f o(i)
si (4.7)
The nominal case (step 2) and the worst case (step 4) gate sizing formulations for fuzzy programming
are given by (4.8) and (4.9) respectively. The spatial correlations are incorporated in the modeling
by multiplying a constant multiplier to weight the variability impact of a fan-out gate on the delay
of a particular gate. The farther the fan-out gate is, the lower is the weight and hence the impact of
variations on that gate.
minn
∑i=1
(αθ+ βφ− γξ)si (4.8)
s.t dp≤ tspec∀p∈ P
Ni ≤Ui∀i ∈ n
l i ≤ si ≤ ui∀i ∈ n
di = ai −bisi +ci ∑j∈ f o(i)
si
minn
∑i=1
(αθ+ βφ− γξ)si (4.9)
s.t dp≤ tspec∀p∈ P
Ni ≤Ui∀i ∈ n
l i ≤ si ≤ ui∀i ∈ n
di = ai− (bi −gi)si +(ci +hi) ∑j∈ f o(i)
si
After the deterministic nominal (Snc, Nnc) and worst case (Swc, Nwc) problems are solved for the delay,
noise and power values using a mathematical programming solver, the noise and gate size values are
used for formulating a crisp non-linear programming model.Using a new variation parameterλ, the
fuzzy optimization problem is formulated using the symmetric relaxation method [101]. The gate
74

sizing problem in the presence of process variations is given by (4.10).
max λ (4.10)
λ(Swc−Snc)−GS+Swc≤ 0,
λ(Nwc−Nnc)−GS+Nwc≤ 0,
s.t. Dp≤ tspec ∀p∈ P
and Dp = ∑i∈p
(ai − (bi−gi ∗λ)si
+(ci +hi ∗λ) ∑j∈ f o(i)
sj)
where, the parameterλ is bounded by 0 and 1. However, for the gate sizing problem, a smaller bounds
of range between 0.5 and 0.75 can be given forλ. Such a smaller bound is sufficient due to the dual
requirement of high yield and low overhead for the gate sizing optimization in presence of variations,
and speeds up the procedure 2-3 times, without affecting thefinal solution. Physically,λ can be
considered as the variation resistance (robustness) property of the circuit, meaning the ability to meet
timing constraint even in the presence of variations. Hence, the LP tries to maximize this variation
resistance. The noise and sizing constraints ensure that the crosstalk noise and the power are between
the worst case and the nominal case values. The variation resistance tries to ensure that the optimal
solution values are closer to the nominal case values, and thus minimizes the power and crosstalk noise
of the circuit. It has been shown in the literature [102–104]that the fuzzy non-linear programming
solutions produce the most satisfying optimization results in the presence of uncertainty.
4.3.4 Paths to Nodes
An important issue in the aforementioned optimization problem is that it is intrinsically a path
based formulation. This issue can be addressed by converting a path based formulation to a node
based one, with each node corresponding to a gate [47]. If we consider two simple pathsa−→ c and
b−→ c, wherea andb are the nodes corresponding to primary inputs andc as primary output node,
75

then considering a dummy sink nodessuch thatc−→ s, the node based formulation can be gives as:
min3
∑i=1
si (4.11)
s.t. da≤ tc
db≤ tc
tc +dc≤ tspec
where,tc is the arrival time atc anddis are given by the linear delay model. The sub optimality intro-
duced due to this transformation is close to 2% for circuits with 20 levels of logic. The sub-optimality
refers to the value of dynamic power obtained when compared to the path based formulation. However,
this transformation significantly improves the runtime andthe feasibility of optimizing large circuits.
4.4 Experimental Results
In this section, we present the experiments conducted to evaluate the performance of this multi-
metric optimization framework. The framework was rigorously tested for optimization in various set-
tings like equally weighted multi-metric optimization, single metric optimization, and adaptive multi-
metric optimization where the metrics are optimized with different priorities by assigning different
weight vectors to the metrics.
4.4.1 Simulation Setup
The multi-metric optimization algorithm for gate sizing under process variations was rigorously
tested on the ITC’99 benchmark designs. The simulation setup had three important steps. During the
first step, the RTL level VHDL net lists of the benchmark circuits were extracted for generating gate
level Verilog files using the Synopsys Design Compiler tool.These gate level Verilog files and the
TSMC 180nm Standard Cell libraries (LEF, TLF, DB Files etc.)are then used to place and route the
designs and generate the DEF files, cell delay information etc using the Cadence Design Encounter
toolbox. We synthesized the benchmark circuits using TSMC 180nm libraries.
In the second step, the parasitic resistance and capacitance information (SPEF file) was extracted
from the routed designs using the Cadence Fire N’ Ice RC extractor. This information is required for
76

extracting the coupling noise of the routed designs. The SPEF file was then used to obtain the coupling
capacitance and resistance information of each net with itsaggressor nets using a PERL script that was
written to extract this coupling information for each net, with its top three aggressor nets. During the
third step, the delay coefficients for available sizes (1x - 6x) and fan-outs of the standard cells in
the TSMC 180nm standard cell library were characterized using the HSPICE simulations. Also, the
variations were assumed to be 25% of the nominal values [56],and were appropriately translated to
the coefficientsa, b andc. With all the information about the delays, coupling noise etc. available
for the benchmark designs, the nominal case and the worst case gate sizing optimization problems
were formulated. These problems were programmed in C language, which generated the optimization
models in the standard AMPL format. These extreme case problems were then solved using a Linear
programming solver called KNITRO. KNITRO is a robust non-linear programming solver for both
convex and non-convex optimization problems. It is specifically designed to solve problems with large
dimensionality. KNITRO uses interior point and active set methods for optimization, and is capable
of utilizing multiple processors. The solver is available as a part of the NEOS optimization [37] suite.
The optimal solutions of the worst case and the nominal case settings are then utilized to formulate a
crisp non-linear programming problem, and solved using KNITRO. A detailed flow of the simulation
setup is shown in Figure 4.2.
4.4.2 Optimal Noise Margins
Ideally, the noise margin is given as the difference betweenthe minimum sized victim and the
maximum sized aggressor gates. This corresponds to the maximum coupling impact on the victim net.
When the victim driver gate is sized at its minimum possible size, the signal strength on the victim net
is very low. Additionally, if the aggressor net’s driver gate is sized up to the largest possible size, the
aggressor net’s signal strength increases, thereby inducing a large cross-coupling capacitance, which
can affect the victim net’s signal integrity. Hence, a constraint to control the maximum tolerable noise
on a net is incorporated in the model.
The gate sizes considered in this simulation setup range from 0.25e−6 to 1.5e−6. Therefore, the
noise margin for a net can be given by (4.12).
N = (1.5e−6)− (0.25e−6) (1.25e−6) (4.12)
77

Figure 4.2 Flowchart for simulation setup. 180nm standard cell libraries have been used to extract therequired files for the ITC’99 benchmark circuits.
However, these ideal noise margins are not tight, and could not capture the impact of coupling noise
effectively. Thus, experiments were performed to identifythe optimal noise margins, by evaluating
the impact of different noise margin values on the objectivefunctions. The experimental results are
shown in Figure 4.3. Here, if the noise margin is below 0.65e−6, the dynamic power is adversely
affected, even though leakage power and crosstalk noise areunaffected. Thus, after averaging the
effects of noise margin on the crosstalk, and the power, a tighter noise margin constraint of 0.65e−6
was identified. This tighter noise margin can efficiently minimize the effect of coupling noise, and
78

generate better solution points. These noise margins are used as constraint in the (4.9) to control the
crosstalk noise between the nets during the gate sizing.
Figure 4.3 Effect of different noise tolerance values on theoptimality of the objectives. Tighter tol-erance values for the noise constraint derived in (4.12) have been applied and their impact on theleakage power, dynamic power and crosstalk noise has been plotted to obtain a tighter noise marginfor the optimization process.
4.4.3 Determination of Timing Specification
In the first step of the optimization process, the circuit delay is optimized, since it is the primary
optimization metric. A node constrained linear program is formulated using (4.1), and solved to
evaluate the best timing specifications for each gate in the design. The noise margin constraints ensure
that the maximum tolerable noise margins are maintained during the optimization process. However,
the delay optimization results in sub-optimal values for leakage power, dynamic power and crosstalk
noise. The optimal delay values identified during this step serve as the constraints for the node delays
during the next steps of multi-metric optimization. The optimal delay values (tspec) for the ITC’99
benchmark circuits are shown in the third column of Table 4.1.
79

4.4.4 Leakage Power, Dynamic Power, and Crosstalk Noise Optimization
We evaluated the optimization results when leakage power, dynamic power, and crosstalk noise
are simultaneously optimized with equal priority (α = β = γ = 0.33). The technological constraints of
node delays with delay values and noise margin constraints,along with the bounding constraints cor-
responding to minimum and maximum available sizes of the gates are used to formulate the worst case
and the nominal case optimization problems. For each of these problems, the respective characterized
linear delay coefficientsa, b, andc andai , bi , and ¯ci are incorporated in (4.9), which was solved using
the KNITRO solver. The deterministic nominal case (Snc, Nnc) and worst case (Swc, Nwc) power and
noise results are then utilized in formulating the fuzzy mathematical program as shown in (4.10). The
solution of the crisp non-linear problem obtained using theKNITRO solver gives the optimizations in
the leakage power, dynamic power and crosstalk noise for thecircuit.
The optimization improvements in dynamic power, leakage power, and crosstalk noise as com-
pared to the sub-optimal values obtained during the delay optimization are shown in Table 4.1. As
evident from the table, the multi-metric optimization results are significantly improved over the sub-
optimal values from unconstrained delay optimization. Theincorporation of spatial correlations during
the modeling of the problem further eliminate the pessimismby reducing the effect of variations in
circuit elements that are not in the same grid as the current element.
Table 4.1 Improvement in the optimization of metrics for multi-metric optimization with equal priority(α = β = γ = 0.33), as compared to the values obtained during unconstrained delay optimization.
ITC’99 Number Unconstrained Delay † Improvement in Metrics ExecutionBenchmark of gates tspec(ns) Leakage Power Dynamic Power Crosstalk Noise Time (secs)
b11 385 0.71 12.75% 19.8% 28.1% 2.35b12 834 0.36 14.18% 20.5% 34.76% 38.65b13 249 0.26 57.5% 66.2% 59.98% 0.848b14 4232 2.5 38.0% 17.92% 125.25% 177b15 4585 3.43 25.63% 42.0% 42.35% 213b17 21191 2.68 46.38% 57.33% 62.87% 2338b20 8900 3.59 18.95% 21.57% 72.79% 713b22 12128 2.63 14.57% 58.69% 59.41% 978
Average Savings 28.49% 38.0% 60.7%†: Percentage improvement over the unconstrained delay optimization
A notable aspect of this method is the runtime of the algorithm. As shown in column 7 of the
Table 4.1, the runtime for the algorithm is comparatively low for even 21000 gates designs. This is
attributed to the optimum modeling of the problem as a node based approach as compared to a path
80

based approach. Also, selection of the optimization solverplays an important role in controlling the
runtime. KNITRO is a fast and accurate solver, available forboth linear optimization and non-linear
optimization problems.
Next, a comparative study between the pessimistic worst case analysis and the fuzzy analysis was
performed to study the effectiveness of the mathematical programming technique being implemented
as a solution methodology for our framework. As shown in Figure 4.4, fuzzy mathematical program-
ming identified the solution points that significantly improved over the worst case values, and the
values were closer to nominal case analysis. The improvements in the optimization are notable since
the average total power savings are more than 30%, and the crosstalk noise improvement is more that
40%.
Figure 4.4 Average improvement in the metrics values for simultaneous multi-metric optimization ascompared to the deterministic worst case pessimistic analysis. The metrics leakage power, dynamicpower and crosstalk noise are weighted asα = β = γ = 0.33 respectively.
4.4.5 Single Metric Optimization Results
This framework allows for selective optimization of the metrics, depending upon the design re-
quirements. The metric to be optimized can be prioritized byassigning a high weight vector to it. For
81

example, if a designer intends to optimize only the leakage power, the coefficientsα, β, andγ will
be assigned the values as 1, 0, 0 respectively. However, whenonly leakage power is optimized, the
crosstalk noise may be affected adversely. The impact of single metric leakage power optimization
as compared to the equally weighted multi-metric optimization is shown in Figure 4.5. As shown,
when only leakage power is optimized, the optimization may result in sub-optimality introduced in
other metrics, like crosstalk noise in this case. This is intuitive, since the leakage power is directly
proportional to the gate sizes. However, since the crosstalk noise has an inverse relationship with the
gate sizes, the noise may increase as a result of optimization. Since dynamic power is affected by the
size of the fan-out gates, if the gates sized during the leakage power optimization are same as the ones
that affect the dynamic power, then dynamic power would alsoreduce. However, in the other scenario,
dynamic power would be adversely affected.
Figure 4.5 Effect of single metric leakage power optimization as compared to equally weighted multi-metric optimization. For single metric optimization the metrics are weighted asα = 1,β = 0,γ = 0,and for multi-metric optimization the metrics are weightedasα = 0.33,β = 0.33,γ = 0.33.
We also performed experiments for single metric optimization of the other two metrics, dynamic
power (with weightsα = 0,β = 1,γ = 0), and crosstalk noise (with weightsα = 0,β = 0,γ = 1). The
results for single metric dynamic power optimization as compared to equally weighted multi-metric
82

optimization are shown in Table 4.2. The dynamic power dissipation for single metric optimization is
lower than the multi-metric optimization. However, an interesting observation in this scenario is that
on the average, dynamic power dissipation is reduced at the cost of leakage power and not crosstalk
noise. This trend occurs due to the fact that during the dynamic power minimization, fewer gates are
resized from the sub-optimal sizes (after delay optimization) as compared to leakage power optimiza-
tion. This results in a decrease in dynamic power, but the leakage power is largely unaffected.
When the single metric crosstalk noise minimization is performed, the gate sizing problem trans-
lates into a maximization problem. The results for crosstalk noise minimization as compared to the
equally weighted multi-metric optimization are also shownin Table 4.2. A notable improvement (al-
most 2x) in crosstalk noise as compared to the multi-metric optimization scenario is identified. This is
due to the fact that the maximization problem satisfies the delay constraints much easily as compared
to the minimization problem. Increasing the gate sizes reduces the crosstalk noise, as well as the gate
delays. However, this increases the power dissipation of the design by more than 40%.
4.4.6 Results for Priority Based Optimization
The framework can be utilized for adaptive multi-metric optimization in situations where the de-
sign requires the metrics to be optimized with different priorities. In such scenarios, the coefficients
α, β, andγ are assigned weights corresponding to the relative priorities. We performed the exper-
iments with two such scenarios. First, an optimization is performed with equal priorities assigned
to leakage power and dynamic power, while neglecting the impact of crosstalk noise. The weights
were assigned asα = 0.5,β = 0.5,γ = 0. The results for optimization were compared with the equally
weighted multi-metric optimization scenario to identify the percentage improvement in the two met-
rics leakage power and dynamic power. Since the weights wereincreased by approximately 17% for
each metric, we evaluated if the optimality of each metric follows the same trend. The results for the
percentage improvement in metrics for the benchmarks are shown in Figure 4.6. The average dynamic
power improvement was 11.1% and average leakage power improvement was 12.7%. Although, the
improvements were not of the same order, they were coherent with the expectations.
Finally, to compare the three scenarios discussed in this section, unconstrained delay optimization,
single metric optimization, and multi-metric optimization, we compared the leakage power values
83

Table 4.2 Comparison of single metric dynamic power and crosstalk noise optimization with theequally weighted multi-metric optimization values.
Dynamic Power Optimizationα = 0,β = 1,γ = 0
ITC’99 † Improvement in MetricsBenchmark Dynamic Power Leakage Power Crosstalk Noise
b11 13.49% -15.11% -12.02%b12 8.02% -11.73% 2.88%b13 13.62% -34.76% -6.66%b14 5.00% -10.26 0.70%b15 20.57% -10.82 2.30%b20 6.42% -14.75 8.83%b22 14.32% -6.74 25.30%
Average 11.64% -14.88% 3.05%
Crosstalk Noise Optimizationα = 0,β = 0,γ = 1
ITC’99 † Improvement in MetricsBenchmark Dynamic Power Leakage Power Crosstalk Noise
b11 -19.66% -21.34% 143.20%b12 -20.69% -22.38% 197.71%b13 -35.91% -38.40% 106.84%b14 -15.81% -16.11% 97.23%b15 -19.15% -18.88% 183.50%b20 -19.15% -19.81% 146.88%b22 -10.01% -10.19% 111.26%
Average -20.05% -21.02% 140.95%†: Percentage improvement as compared to
equally weighted multi-metric optimization
obtained during the single metric leakage power optimization, and the multi-metric optimization with
leakage weighted asα = 0.3 with sub-optimal leakage power values obtained during unconstrained
delay optimization. The improvements in the metric are shown in Figure 4.7. The results indicate
that the single objective optimization identifies most optimal values for the metric, followed by the
multi-metric optimization, which is intuitive. However, such optimizations introduce sub-optimality
in other metrics like crosstalk noise and dynamic power.
4.5 Discussion
In this work, a new integrated framework for variation awaremulti-metric optimization has been
developed for optimization of several metrics like delay, leakage power, dynamic power, and crosstalk
noise. Any mathematical programming approach can be utilized to implement this framework. In this
84

Figure 4.6 The improvement in leakage power and dynamic power when optimized with prioritiesα = 0.5, β = 0.5, andγ = 0 as compared to the scenario whereα = 0.33,β = 0.33, andγ = 0.33.
Figure 4.7 Comparative study of leakage power optimizationin three different scenarios, uncon-strained delay optimization, single metric leakage power optimization, and multi-metric optimization.The coefficients corresponding to the metrics in multi-metric optimization are assigned asα = 0.3,β = 0.45 andγ = 0.25.
85

work, we identify the relationships between the delay, leakage power, dynamic power, and crosstalk
noise metrics as a function of gate sizes and model them in a unified manner. Additional metrics like
security, reliability etc. in terms of gate sizes can be incorporated in the optimization framework with-
out any modifications. The framework is completely reconfigurable in terms of design requirements
to selectively optimize one or more metrics by assigning appropriate weights to the metrics.
The experiments performed on the ITC’99 benchmark circuitsindicate that the equally weighted
multi-metric optimization achieves good results in terms of optimizing the values of all the metrics.
Also, the weights assigned to each metric in the model are approximately linearly correlated with
the average improvements in the optimization values, and hence can be used to prioritize the metrics.
Although, single metric optimization achieves maximum savings for the corresponding metric, such
an optimization introduces significant sub-optimality in the values of other metrics. Experiments and
comparative analysis of different optimization scenariosadvocate the efficacy of this framework as a
generalized post-layout multi-metric optimization tool.
86

CHAPTER 5
A MICROECONOMIC APPROACH TO SPATIAL DATA CLUSTERING
In an optimization problem, as the size of a problem increases, the most efficient way of solving
it is to form multiple partitions on the basis of certain criteria, and to solve each partition separately.
However, clustering is an optimization problem, since clusters are required to be identified on the
basis of specific objectives. In general spatial pattern clustering domain, several techniques have been
developed in a wide variety of scientific disciplines such asbiology, pattern recognition, information
systems etc. While these traditional disciplines focus on developing algorithms to perform single
metric clustering, various engineering and multi-disciplinary applications in emergency management,
computer networks, VLSI, and robotics entail simultaneousexamination of multiple metrics for spatial
pattern clustering. In this work, we develop a novel multi-objective clustering approach that is based
on the concepts of microeconomic theory. The algorithm models a multi-step, normal form game
consisting of randomly initialized clusters as players that compete for the allocation of resources (data
objects). A Nash equilibrium based methodology evaluates asolution that is socially fair for all the
players. After each step in the game, the clusters are updated using any mathematical clustering
algorithms. Extensive simulations were performed on several real data sets as well as artificially
synthesized data sets to evaluate the efficacy of the algorithm. The experimental results indicate that
our algorithm yields significantly better results as compared to the traditional algorithms. Further,
the algorithm yields a high value for thefairness index, which indicates the quality of the solution in
terms of simultaneous clustering on the basis of multiple objectives. Also, the sensitivity of the various
design parameters on the performance of our algorithm is analyzed and reported.
5.1 Spatial Data Clustering
Formally, the clustering problem can be defined as an optimization problem [12, 90]: Given a set
of input patternsX = {x1, · · · ,x j , · · · ,xN}, a positive integerK, a distance measureδ, and a criterion
87

functionJ(C,δ(., .)) onK-partitionC = {C1, · · · ,CK} of X andδ(., .), wherex j = (x j1,x j2, · · · ,x jd)T ∈
ℜd, and eachx ji is a feature in the feature space, partitionX into disjoint setsC1, · · · ,CK(K ≤N) such
that J(C,δ(., .)) is optimized (minimized or maximized). The different clustering criteriaJ, and the
distance functionsδ(., .) define the various clustering objectives, which may be conflicting in nature.
As an example, the objectives like spatial separation and connectedness follow an inverse relationship.
Similarly, the compactness of the cluster is inversely related to the equi-partitioning objective. Hence,
most of the existing clustering methodologies attempt to optimize just one of the objectives that are
identified to be the most appropriate in that context. This result in discrepancies between solutions
provided by different algorithms and could cause a clustering method to fail in the contexts where the
criterion is inappropriate.
The applications such as rescue robots deployment, ad-hoc networks, wireless and sensor net-
works, and multi-emergency resource management have necessitated the identification of new clus-
tering mechanisms that could simultaneously optimize multiple objectives, which may be competitive
in nature. As an example, let us consider a problem of establishment of an ad-hoc network of nodes
that communicate with each other over a wireless link. Although each node has identical transmission
and computing capabilities, due to power constraints, clusters are required to be created to reduce
the communication overhead. Each cluster should have a cluster head that is responsible for inter-
and intra-cluster communication. An optimal clustering mechanism needs to ensure that the nodes do
not drop out of the network. Hence, clustering should be performed on the basis of multiple criteria;
compactness for low power intra-cluster communication, and equi-partitioning for uniform power dis-
tribution. These objectives are competitive in nature and needs to be optimized simultaneously using
amulti-objective clustering technique.
In this research, we investigate a novel methodology that identifies optimal clusters in applications
with multiple conflicting objectives. This methodology consists of three components, an iterative
hill climbing based partitioning algorithm, a multi-step normal form game theoretic formulation, and
a Nash equilibrium based solution methodology. Specifically, in this clustering mechanism, initial
clusters are identified using a mathematical approach (KMeans or KMedoids) followed by a game for-
mulation with these clusters as players and resources. It then identifies a solution using the concepts of
Nash equilibrium. Since the objectives are convex in nature, as shown in [13] a Nash equilibrium solu-
88

tion always exists, and tries to achieve global optima. Also, depending upon the problem formulation,
the complexity of the Nash equilibrium lies between P and NP [13].
A brief review the existing clustering methodologies, the various application domains of game
theory, and the applications of load-sharing are discussedin Section 2.5. The rest of the chapter is
structured as follows. In Section 5.2, we discuss the motivation for identifying the approach for multi-
objective clustering. The clustering methodology is presented in detail in Section 5.3. Experimental
results are presented in Section 5.4, followed by a discussion on the applications and the possible
future research in Section 5.5.
5.2 Why Game Theory for Clustering?
Traditionally, in data clustering, a single parameter is optimized while assuming the other pa-
rameters as constraints. However, the clustering requirements of multi-disciplinary applications have
resulted in the need for new multi-metric clustering methods. In contrast to the ensemble methods that
effectively integrate the results of multiple single objective clustering methods, the fundamental basis
of game theory allows for the formulation of problems as multiple inter-related cost metrics compet-
ing against one another for simultaneous optimization. In game theory, each player’s decision is based
upon the decisions of every other player in the game, and he can optimize his gain with respect to
their gains. This results in identification of global gains,and consequently an equilibrium state for
the system. As an example, in the process of clustering the data objects with an objective of maxi-
mizing partition compactness, often clusters are formed such that some partitions have few objects,
while others having many objects, resulting in a situation of partition-imbalance. However, a cluster-
ing performed with load-sharing or equi-partitioning as objective could result in formation of clusters
with large intra-cluster distances. Thus, such situationsare convex in nature, and can be successfully
modeled in a game framework. Also, as shown in [13], if the payoff function in a game is convex, a
Nash equilibrium solution always exists and tends to identify globally optimal solutions [105]. This
is a good motivation for modeling the system in a game theoretic framework for simultaneous multi-
objective clustering.
A unique property of game theory is social equity or social fairness [13], which ensures that each
player in the game is satisfied and the overall goals are reached. As an example, for clustering on
89

the basis of three parameters, compactness, equi-partitioning, and connectedness, the other methods
identify solutions targeting the global objective as a function of these design parameters. However,
a game theoretic model ensures that each of these parametersis optimized with respect to the others.
For an elaborate discussion of game theory the readers can refer to [27,28].
5.3 Microeconomic Clustering Algorithm
In this section, a detailed description of the game theoretic algorithm is presented. Initially, one
of the mathematical clustering methods (KMeans, in this work) is briefly explained, followed by a
thorough discussion of the key components of the game theoretic model, and the model itself. An
alternative ensemble based post-mathematical partitioning game theoretic method is also presented.
The section concludes with the analysis of complexity of themodel, and the proof of progression of
algorithm.
Certain assumptions have been made during the modeling of the problem as a game theoretic
framework. Most of these assumptions are not restrictive interms of the applicability of the model,
and can be discarded with no or very little changes. In this model, the objectives being considered
are compactness and equi-partitioning, but the methodology is applicable to any type and number of
objectives, conditional upon the convexity of the problem.The notations and terminology used in the
rest of the chapter are given in Table 5.1.
5.3.1 Mathematical Partitioning
The initial set of clusters is identified using one of simplest partitioning method KMeans. This
algorithm partitions a data set of sizeN into K clusters on the basis of minimization of the total intra-
cluster variation (TICV). The steps involved in the iterative KMeans algorithm are shown in Algorithm
Algorithm 5.1 .
Let {xi , i = 1, · · · ,N} be a set of data vectors such thatxi = {xi1, · · · ,xid}. Define a booleanwik for
i = 1, · · · ,N andk = 1, · · · ,K.
wik =
1 if ith vector belongs tokth cluster
0 otherwise(5.1)
90

Table 5.1 Notations and terminology. These notations are used in the equations and algorithms de-scribed in rest of the chapter.
N Total number of data objects in a data setd Dimensionality of data setK Total number of clustersEnk Euclidean distance betweenn andk, wheren∈ N andk∈ KE Sum of the squared Euclidean distancelk Number of data objects in clusterk,∀k∈ Kl ideal Number of data objects per cluster in equi-partitioned state; l ideal = |N/K|L Sum of the squared load values;L = ∑K
k=1(lk− l ideal)2
P Total number of players;P⊂ Kpi ith player in a game;∀i ∈ Pp−i Set of players in the game other than the playerpi
R Total number of resource centers;R⊂ Kr j jth resource center in a game;∀ j ∈Rr− j Set of all the resource centers not in the current gameUi Total number of strategies of a playerpi
Si Set of all the strategies of playerpi
siu uth strategy of the playerpi ; si
u ∈ Si andu = 1, · · · ,US Strategy set of all the strategies in the game;S= {S1,S2, · · · ,SP}S−i Set of all the strategy combinations of all players other than pi
s−iv A strategy combination consisting of one strategy of all players other thanpi ; s−i
v ∈ S−i
Define a matrixW = [wik] such thatK
∑k=1
wik = 1, i.e., a data vector can belong to only one cluster (hard
partitioning). Now, letck = (ck1, · · · ,ckd) be the centroid ofkth cluster, whereck j is given by equation
5.2.
ck j =
N
∑i=1
wikxi j
N
∑i=1
wik
(5.2)
Then, the intra-cluster variation forkth cluster and the TICV based upon the Euclidean distance mea-
sure is given by Equations (5.3) and (5.4) respectively.
E(k)(W) =N
∑i=1
wik
d
∑j=1
(xi j −ck j)2 (5.3)
E(W) =K
∑k=1
N
∑i=1
wik
d
∑j=1
(xi j −ck j)2 (5.4)
91

The objective of the KMeans clustering is to identify the clusters that minimize the sum of squared
Euclidean (SSE) distance measure and hence is given as,
E(W∗) = minW{E(W)} (5.5)
Although KMeans is fast, the algorithm is sensitive to the selection of initial cluster-head positions and
Algorithm 5.1 KMeans partitioningRequire: K, data set of sizeN and dimensionalitydEnsure: the assignmentwnk ∀n∈ N, wherek∈ K
1: randomly initializeK locations ond dimension space with centroidsck,∀k∈ K2: initialize iteration numberi← 03: repeat4: i← i +15: for n = 1 toN do6: calculateEnk,∀k∈ K7: find k′, such thatEnk′ = min{Enk}8: wi
nk′ ← 1, andwink← 0,∀k 6= k′
9: end for10: updateck according to equation 5.2,∀k∈ K11: until wi
nk = wi−1nk ,∀n∈ N andk∈ K
12: return: wnk← wink,∀n∈ N andk∈ K
can easily converge to local optima if the choice of initial partitions is improper. Also, the algorithm
is applicable only for single objective clustering.
5.3.2 Multi-Step Normal Form Game Model
The KMeans identifies the partitions on the basis of minimization of SSE. However, this process
adversely affects the complementary equi-partitioning objective. A game theoretic methodology is de-
scribed in this section to perform clustering of the data by simultaneously optimizing all the conflicting
objectives. Specifically, the process involves the identification of initial clusters using the initialization
step. These clusters are then categorized as players and resource centers, and a game is formalized.
The players in the game compete for allocation of resources from the resource centers. The resource
centers consist of a discrete set of data objects. The strategy of a player is modeled as a tuple consist-
ing of the number of resource units requested from every resource center. The payoff corresponding
to every strategy is a function of the conflicting objectives. A Nash equilibrium solution to the game is
92

then evaluated, and the allocations are performed accordingly. After the reallocation, the clusters are
updated. This complete process is repeated until the stopping criteria are satisfied. The steps involved
in the algorithm are described in Algorithm Algorithm 5.2 . The following sub-sections describe the
normal form game theoretic model in details.
Algorithm 5.2 Game theoretic algorithmRequire: K, data set of sizeN and dimensionalitydEnsure: K partitions optimized on the basis of objectives
1: initialize K cluster centers ond dimensional space2: perform one iteration of Algorithm Algorithm 5.1 , steps 5-103: repeat4: loadbe f ore← getLoad();SSEbe f ore← getSSE()5: if ∃k∈ K | lk < l ideal then6: initialize a new gameG17: P←{m | lm < l ideal};R←{n | ln > l ideal}8: for all rn | n = 1, · · · ,R do9: rn.overhead← ln− l ideal;rn.consistent← 0
10: end for11: for all pm |m= 1, · · · ,P do12: perform minimum cost initial allocation of resources fromR, such thatlm≈ l ideal
13: end for14: updateln;∀n∈R15: for all rn | n = 1, · · · ,R do16: if ln > rn.overheadthen17: rn.con f lict← 118: G1.createStrategySet(); %see Algorithm Algorithm 5.3 %19: G1.createPayo f f(); %see Algorithm Algorithm 5.4 %20: G1.evaluateNashEquilibrium(); %see Algorithm Algorithm 5.5 %21: perform temporary reallocation of units to players according to Nash equilibrium22: end if23: rn.con f lict← 0;rn.consistent← 124: end for25: loada f ter← getLoad();SSEa f ter← getSSE()26: if %∆(load) > %∆(SSE) then27: commit reallocations28: update cluster centers according to step 229: else30: break31: end if32: end if33: until FALSE
93

Figure 5.1 Identification of optimum clusters using game theoretic clustering (GTKMeans) andKMeans methodologies. (a)Initial clusters identified by single iteration of KMeans, (b) final clus-ters after KMeans, (c) formulation of a game with playersp1, p2, p3 and resourcesr1, r2, (d) finalclusters after GTKMeans algorithm
5.3.2.1 Identification of Players
The steps involved during the algorithm can be described with the help of an example1 given in
Figure 5.1. During initialization, the cluster centers arerandomly generated for thed-dimensional
data set. This is followed by the identification of initial clusters by performing a single iteration of the
KMeans. As shown in Figure 5.1(a), theL and theSSEvalues of the initial clusters is not optimal.
If the iterative KMeans as shown in Algorithm Algorithm 5.1 is implemented with the objective of
minimization ofSSE, the final value of theSSEis 38716 (Figure 5.1(b)). However, the corresponding
L value is 106.8, signifying that the clusters are not equi-partitioned. Hence, a game is formulated with
the objective of simultaneous clustering of objects on the basis of compactness and equi-partitioning.
1The data is taken from German Town Data, which is a two dimensional data set with 59 observations, obtained from[106]. The SSE value for KMeans clustering for 5 clusters is the reported minimum value in literature [85].
94

The first step in the formulation of the game is defining the components of the game, i.e., the
players, the resources, the strategies, the payoff functions etc. In this model, the cluster centers with
lk < l ideal,∀k ∈ K are identified as the players in the game. Alternatively, thecluster centers with
lk > l ideal,∀k ∈ K, are considered as the resources in the game. The objective of a player is to re-
ceive the data objects from the resources in such a manner that his compactness objective and the
equi-partitioning objectives are optimized simultaneously. In a situation where multiple players are
requesting units from the same resource center, there is a conflict among the players, so every player
competes against every other player in the game in order to maximize its own utility. One such exam-
ple scenario is displayed in Figure 5.1(c), where the players p2 and p3 will compete to receive units
from the resource centerr1.
5.3.2.2 Definition of Strategy
The feasibility of a game theoretic model largely depends upon the notion of strategy, which is
a major factor in determining the computational complexityof the model. One way of defining the
strategy for a player is to create a tuple consisting of the number of units that the player can request
from every resource available in the system. For example, inFigure 5.1(c), the playerp3, which
requires 6 resource units to realize equi-partitioned situation, could have a strategy{1,5}, i.e., receive
one resource unit fromr1, and 5 units fromr2. The strategy set for the player would consist of all
possible combinations of resource units from the resource locations, and the strategy space increases
exponentially with every unit increase in the number of resource centers. Hence, such a notion of
strategy is applicable only for the games with very few resources, and an alternate notion of strategy
has to be identified for this model.
Algorithm Algorithm 5.3 outlines the steps involved in the formulation of the strategy set for a
player. Essentially, it is a two step process, in which, during the first step, the players try to receive
resource units from the resource locations on the basis of minimum cost allocation methodology, ir-
respective of the allocations made to the other players. Dueto this, a situation may arise where the
resource locations have allocated more resources than the overhead available with them. Therefore,
for every such resource location, a game needs to be formulated and solved to ensure equi-partitioning.
Hence, during step two, the cluster centers that have tried receiving resources from the resource lo-
95

cation in conflict are considered as the players in the game. The players’ strategies consist of the
number of resource units they may have to loose in order to ensure that the corresponding resource
location (for which the game has been formulated) is in consistent state, i.e., the resource location
is equi-partitioned. An example scenario described in Figure 5.2 would be helpful in improving the
understanding. As shown in Figure 5.2, the playerp1 has requested 1 resource units from location
r1 and playerp2 has requested 4 units. Due to the requests,r1 may loose 5 units, which would lead
to a situation wherelr1 < l ideal. However, the players only need to loose a total of 3 units andtry
to receive those units from other resource locations to ensure thatlr1 = l ideal. So, a game is played
between the playersp1 and p2, with player p1’s strategy set as{0},{1}, and playerp2’s strategy set
as{0},{1},{2}, with the numbers indicating the resource units the playersmay have to loose in order
to ensure that the resource center is equi-partitioned. Theplayers would receive a payoff for every
strategy, which would be a function of the additional cost incurred for receiving the resources from
the centers that are farther from the player, and the change in L value for the players and the resource.
Modeling of the strategy in the proposed manner reduces the strategy space considerably. Also, the
number of actual players per game is significantly less than the total number of players in the system,
since not all players would have requested units from the resource location that is in the conflict sit-
uation. Effectively, using this methodology, one large game is subdivided into several small games
played in multiple steps.
Algorithm 5.3 Generation of strategy setRequire: resource location in conflict (rn), rn.overhead, set of all playersPEnsure: strategy setS| S= {S1,S2, · · · SP}
1: identify the set of playersP′ that received allocation of resource units fromrn
2: for all pi | i = 1, · · · ,P′ do3: numstrategies= min(rn.overhead, units received bypi from rn)4: for j = 0 to numstrategiesdo5: Si+ = { j}%number of units a player may have to loose fromrn %6: end for7: S+ = {Si}8: end for9: returnS
96

Figure 5.2 An example for definition of strategy. Here, r1 andr2 are the two clusters with more unitsavailable with them after the initial clusters are identified. p1 and p2 are the players in the game,competing with each other in order to receive maximum resource units from r1.
5.3.2.3 Payoff Function
The players in a game play their strategies in order to optimize the equi-partitioning and the com-
paction objectives of the resource center for which the gameis played. An expected utility is associated
corresponding to each strategy combination that a player inthe game would receive. This utility is
mathematically modeled as a payoff function, which evaluates the gain or loss a player incurs when it
plays its own strategy, and the other players play their corresponding strategies. In this scenario, the
payoff for a playerpi ’s strategysiu and the playersp−i strategy combinations−i
v for a game played for
resource centerr j is affected by the following factors.
• Every resource unit that the player intends to loose fromr j is received from the other resource
locationsr− j . This increases the SSE value for the player.
• When the other playersp−i in the game plays−iv beforepi ’s strategysi
u, the cost incurred for
receiving the resources fromr− j further increases because some of the closer resource locations
might have already allocated resources to the playersp−i .
97

• The load valuelr j value forr j improves as the players try to receive units fromr− j . However,
as the total number of units lost by the players become greater than l ideal, the loadlr j starts
worsening. Hence the absolute value of change inlr j needs to be minimized.
The payoff function captures the inter-relationship of theabove mentioned criteria, and is modeled as
a geometric mean of the total loss incurred by the playerpi in terms of the difference between the SSE
before and after the other playersp−i play their strategiess−iv , and the absolute value of the loadlr j ,
corresponding to the strategysiu.
Algorithm 5.4 Payoff matrix generationRequire: strategy setS, playersP′, conflict resource (rn)Ensure: Payoff matricespoi of playerspi | i = 1, · · · ,P′
1: for all pi | i = 1, · · · ,P′ do2: rows←| Si |3: columns←∏P′
b=1,b6=i(| Sb |)4: create empty payoff matrixpoi of sizerows∗columns5: for j = 0 to columnsdo6: for k = 0 to rowsdo7: rcbe f ore←cost (as a distance measure) incurred topi for receivingk resource units from
resource locationsrm |m 6= n, rm.consistent= 08: cccost←change in the load value of system when playersp−i play their strategy combi-
nation corresponding to columnj, and receive resources units from locationsrm | m 6=n, rm.consistent= 0
9: rca f ter←cost (as a distance measure) incurred topi for receivingk resource units fromresource locationsrm | m 6= n, rm.consistent= 0, after the other playersp−i have playedtheir strategies
10: rc f inal ← rca f ter− rcbe f ore
11: ccf inal ←| rn.overhead− (cccost+k) |12: poi [k][ j]←
√rc f inal ∗ccf inal
13: end for14: end for15: end for
5.3.2.4 Nash Equilibrium Solution
The multi-objective clustering problem being modeled as a game is solved using the Nash equilib-
rium methodology. As compared to the other solution concepts available in the literature, only Nash
equilibrium method identifies the social optima. The payoffmatrices evaluated during the previous
step serve as the input to the algorithm, which generates an output as a Nash equilibrium strategy set
consisting of one strategy chosen for every player in the game. At the Nash equilibrium point, no
98

player has incentive to change its strategy unilaterally. The Nash equilibrium algorithm is explained
in Algorithm Algorithm 5.5 . After the equilibrium strategies are identified, the reallocation of re-
source units is performed accordingly. The game is then played for other resource locations in conflict
and the allocations are performed accordingly. The clustermeans are then updated, and the complete
process is repeated until there is no further improvement inone of the objectives without worsening of
the other.
Algorithm 5.5 Nash equilibrium algorithmRequire: Payoff Matricespoi of playerspi | i = 1, · · · ,P′Ensure: Nash equilibrium strategy combinationS∗
1: for all payi | i = 1, · · · ,P′ do2: identify a strategys∗i such that3: poi(s1, · · · ,s∗i , · · · ,s∗P′)≥ poi(s1, · · · ,si , · · · ,s∗P′)4: %Nash equilibrium strategy combination identified on the basis of [36]%5: end for6: S∗ = {s1, · · · ,s∗P′}7: returnS∗
5.3.3 Ensemble Based Game Theoretic Clustering
As shown in the previous sub-section, the simultaneous clustering on the basis of multiple objec-
tives is performed using multiple game iterations, where aniteration consists of multi-step games. The
complexity of this method depends upon the number of data objects as well as the number of clusters,
and thus the response time of algorithm is high for large datasets. Hence, an ensemble method that
performs the complete clustering on the basis of fast mathematical methods followed by a game theo-
retic algorithm has been presented here. In this method, during the first step, a KMeans clustering of
the data objects is performed on the basis of the objective ofminimization of the intra-cluster distance
as explained in the Algorithm Algorithm 5.1 . The clusters obtained after the KMeans algorithm
are not optimal on the equi-partitioning parameter, hence agame is formulated with the players as the
clusters with number of data objects less thanl ideal, and the resources as the clusters with the number
of data objects greater thanl ideal. The game is then played and a Nash equilibrium solution point is
identified. A reallocation of the data objects is performed if relative change in the compactness and
the equi-partitioning values is below the threshold. Since, the game is played only once in this sce-
nario, the notion of the strategy as described in the paragraph 1 of Section 5.3.2.2 can be adopted.
99

Although, post KMeans game theoretic model, referred asPKGamehenceforth, does not perform si-
multaneous optimization of multiple objectives, the methodology is fast, and the results obtained for
the experiments are promising.
5.3.4 Analysis of Game Theoretic Algorithm
In this subsection, the methodology is analyzed to evaluateits practicability. First, the compu-
tational complexity of the methodology for the extreme cases as well as the worst case scenario is
identified, then some of the unique attributes of Nash equilibrium algorithm that makes it attractive as
a solution method for this model are discussed. The discussion will conclude with a brief discussion
about the progression of algorithm.
5.3.4.1 Computational Complexity Analysis
In a normal formP-player game with an average number of strategiesS per player, the worst
case time-complexity is given byO(P∗SP) [36] when the game is played in single shot. However,
in the model discussed in section 5.B, a multi-step game has been formulated and solved. So, the
overall computational complexity of playingR such games isO(R∗P∗SP), whereR⊂ K,P⊂ K and
R+P≤ K. K is the total number of clusters. AmongR,P, andS, the complexity is largely governed
by the value ofS, which depends upon the definition of a strategy. As opposed to the natural notion
of strategy as a combination of resource requests from everyresource location, the strategy in this
context has been defined as the number of resources a player may have to loose in order to ensure
that the resource location is in consistent, equi-partitioned state. This restricts the size of strategy
set of a playerpi as | Si |= bN/Kc. Hence, the worst case time complexity of one game is given
asK ∗ bN/KcK , sinceP� K. Now, if the number of clustersK is 1, the computational complexity
would beR∗ (1∗N1) = R∗N. Similarly, if K = N, the complexity would beN ∗1N, sincel ideal = 1.
Therefore, for the extreme cases, the complexity of the system isO(N2)�O(R∗P∗SP). In the worst
case scenario, the number of players in the game is equal to the number of resources in the game.
Hence,K = N/2, and the complexity of the system is given by Equation 5.6.
(N/2)∗ (N/2)∗bN/(N/2)cN/2 = N2∗2(N−2)/2 (5.6)
100

The complexity of this algorithm depends primarily on the number of games and the number of data
objects in the data set. Hence, this methodology is ideally suited for multi-objective clustering in small
to medium sized data sets.
The Nash equilibrium solution points possess certain attributes that make the methodology appro-
priate for certain applications. A Nash solution point is socially equitable, which means that every
player in the system is satisfied with respect to every other player, and hence is in equilibrium. Social
satisfaction is important in the scenarios where every objective in a multi-objective clustering has equal
priority. Another important aspect of Nash equilibrium is that, for a mixed strategy non-cooperative
game, a Nash equilibrium solution point always exist [36]. Although, a pure strategy game has been
modeled in this work, the model can be easily extended as a mixed-strategy game by associating
probabilities corresponding to the strategies of a player.
5.3.4.2 Nature of Algorithm Execution
The algorithm consists of multiple games, one for every resource location in conflict. The player
set corresponding to a game consists of the set of clusters that have requested data objects from the
resource center in conflict. Once a game is played for a particular resource location, and players
receive the excess allocation from other resource locations, the location for which the game was played
becomes consistent in terms of equi-partitioning. however, a situation may arise at a later time that
this location again becomes inconsistent due to allocationof units to other players as a result of a
game played for some other resource location. In extreme cases, this may lead to cycling, and the
methodology would take infinitely long time to complete. In order to ensure, that such a situation does
not occur, aflag is associated with every resource for which a game is played,and is set toFALSE
initially. The flag is set toTRUE after a game is played for that resource. All the resources with
flag=TRUEare not considered for reallocation. This ensures that the algorithm progresses in forward
direction and finishes in finite number of steps. However, this may affect the quality of solution.
5.4 Experimental Results
Several single-objective clustering methodologies have been developed and employed for various
applications. However, in the multi-objective clusteringdomain very few methods have been pro-
101

posed, which significantly limits the comparative study of the performance of our algorithm. The
performance of our algorithm, referred asGTKMeanshenceforth as compared to the KMeans algo-
rithm, and a modified algorithm emulating the weighted multi-objective optimization methodology
has been evaluated in this section. The first sets of experiments were performed with real data sets
being used in the previous studies. To analyze the algorithmmore closely in terms of efficiency and
quality of the solution, artificial data sets were created tosimulate the real world scenarios, and the
method was exhaustively tested on those data sets. Also, thesensitivity of this method in terms of the
various parameters like the number of clusters, the number of data objects per clusters and the strategy
sets of the players has been investigated in this section.
5.4.1 Simulation Setup
The GTKMeans was tested on some of the data sets that have beenwidely used in literature for
the evaluation of general purpose clustering approaches. The data sets are listed as follows:
• British Town Data (BTD): A data set consisting of four principal socio-economic data compo-
nents corresponding to 50 British towns. The set was obtained from [107].
• German Town Data (GTD): A two dimensional data set containing the location coordinates of
59 German towns. The data set was obtained from [106].
• Iris Data (IRIS): A four dimensional data set consisting of the sepal length, sepal width, petal
length, and the petal width measurements on 150 samples of IRIS obtained from [107].
The real data sets available in the literature often have an intrinsic structure that a specific clustering
methodology attempts to comprehend and cluster accordingly. Due to this property, the clustering
methods that are fitting for certain data sets may not be appropriate for others since they optimize a
single objective. Hence, to better evaluate the performance of an algorithm, and analyze the sensitivity
of various attributes of it, a wider range of artificial data sets need be constructed. In this work,
704 normally distributed data sets consisting of the location coordinates of data objects on a two
dimensional grid of size 12*12 were created. The values of mean and variance were varied from;
σ =±2 and 0≤ µ≤ 10. The size of data sets was varied from 50 to 150 data objectspartitioned into
3 to 10 clusters. Also, intra-cluster similarity measures in terms of number of objects per cluster were
102

taken into consideration. As an example, a data set 68 90 would have 90 data objects partitioned
into 6 clusters, with each cluster having the number data objects ranging fromb0.8∗ (90/6)c = 12
to b(0.2∗ (90/6))+ (90/6)c = 15. For each experiment, averages of 200 repetitions were performed
with random cluster center (cluster head) initializations. The Nash equilibrium solution to the n-person
normal form game was identified using theSimplical Subdivisionalgorithm. Among the several Nash
equilibrium methodologies available in literature, the simplical subdivision method has been identified
to work consistently better than other existing methodologies. The algorithm is acceptably fast for the
moderate sized problems. Based upon the simplex method, thealgorithm starts with a given grid size,
and converges to an approximate solution point by iterativelabeling of the sub-simplexes.Gambit
[108], an open source C library of game theory analyzer software toolkit was used for identification
of Nash equilibrium solution. Gambit incorporates severalNash equilibrium algorithms for solving
normal form, extensive form, and Bayesian games. All experiments were performed on a Sunblade
1500 workstation that had 4 GB of RAM.
5.4.2 Experiments with Existing Data Sets
To evaluate the performance of GTKMeans algorithm, we compared it with the classical KMeans
algorithm for the BTD. Since both KMeans and GTKMeans methodologies have similar starting points
and both the methods identify same clusters during the initialization phase, the initial knowledge of
the environment is same for both methods. Afterward, the KMeans algorithm proceeds with an objec-
tive of cluster compaction (SSE), whereas the GTKMeans simultaneously optimizes the compaction
as well as the equi-partitioning measures (L). Figure 5.3 displays a comparative graph of GTKMeans
and KMeans performance for the clustering performed on the British town data [107]. The percent-
age improvement inSSE(Y-axis on left) andL (Y-axis on right) values from the initial clusters for
different cluster sizes is displayed in the graph. As evident from the graph, forK = 4, · · · ,10 the
percentage improvement in theL objective for GTKMeans is much higher than that of the original
KMeans algorithm, whereas the percentage improvement inSSEis more for KMeans as compared to
GTKMeans. This is due to the fact that the KMeans algorithm performs a single objective optimiza-
tion only on the basis of compaction, whereas the GTKMeans algorithm identifies clusters on the basis
of simultaneous consideration of both the clustering objectives. The average improvement inSSEand
103

L for GTKMeans is 87.3% and 62.7% respectively. Although the improvement inSSEmeasure is
95.8% in case of KMeans, the equi-partitioning measure improves by only 30.7%. Overall, the GTK-
Means algorithm showed a mean improvement of 20% higher thanthat of the KMeans algorithm for
simultaneously optimizing both the objective functions. To evaluate the performance of the PKGame
methodology, experiments were performed on the German TownData [106]. The performance of the
algorithm in optimizing the two objectives is shown in Figure 5.4. The graph displays the relative per-
formance of the PKGame and the KMeans algorithms. The PKGamemethodology outperformed the
KMeans method in terms of the average percentage improvement in theL for the clusters. The output
characteristics were similar to the previous experiment, and an average overall improvement of 18%
was noted. In an attempt to evaluate the performance of the clustering method in a multi-objective
Figure 5.3 Performance of the algorithms on the British Towndata set. KMeans and GTKMeansalgorithms are compared on the basis of their performance inoptimizing the compaction (SSE) andthe equi-partitioning (L) objectives.
setting, we modified the original KMeans algorithm to incorporate the equi-partitioning objective to
the original compaction objective. In this modified KMeans (MKMeans) method, the clustering was
performed on the basis of a function that was a weighted average of theSSEand theL values of clus-
ter. The weights were kept at 0.5 so that both objectives are equally represented in the solution. The
results from the set of experiments performed on the IRIS data set [107] are shown in Table 5.2. The
table lists the improvements in theL and theSSEvalues obtained after 200 iterations of GTKMeans,
104

Figure 5.4 Performance of the algorithms on the German Town data set. KMeans and PKGame al-gorithms are compared on the basis of their performance in optimizing the compaction (SSE) and theequi-partitioning (L) objectives.
KMeans, MKMeans, and PKGame algorithms. On average the GTKMeans method outperformed
other methods for majority of experiments. The ensemble based PKGame method also performed
well on most of the data sets. The improvement of PKGame over the KMeans method is attributed to
the fact that the former is a refinement that is performed after the latter finishes. The experiments on
the existing data sets were promising, and showed the potential applicability of this method. Overall,
the game theory based multi-metric clustering method outperformed the KMeans algorithm in terms
of simultaneous optimization of the multiple objectives. Although, the method is slower than KMeans
method in identifying clusters, it provides socially fair solutions. However, a thorough analysis of this
method required further experimentation, and hence, artificial data sets were generated to evaluate the
various sensitivity measures as well as the performance measures of the method.
5.4.3 Experiments with Artificial Data Sets
To evaluate the performance of the two microeconomics basedmethods the multi-objective clus-
tering was performed on the artificial data sets described inthe beginning of this section. An average
of the outputs for improvements inSSEandL values were plotted on graphs as shown in Figure 5.5
and Figure 5.6 respectively. From Figure 5.5, it can be identified that the KMeans algorithm performs
105

better than the game theoretic methods for the compaction objective. Also, the performance of the
MKMeans method follows the KMeans closely. This behavior isintuitive as the means based parti-
tioning methodologies optimize only theSSEattribute. However, from the Figure 5.6, it is evident
that the performance of KMeans for equi-partitioning objective is significantly inferior as compared
to the GTKMeans and PKGame methods. This follows from the fact that the two objectives are often
inversely correlated, and the unilateral improvement in one objective function adversely affects the
other objective. However, since the GTKMeans method simultaneously optimizes both the objectives,
the clustering performance was improved by more than 50 percent for both the objectives, as shown
in the graphs. Another observation was that the performanceof the ensemble based PKGame method
did not improve much for the smaller clusters, i.e.K = 3,4, but for the larger number of clusters,
the ensemble method also performed well. Since the KMeans works very well for smaller number
of clusters (3-4), the compactness values are high (also evident from graph), and hence, when game
theoretic method is applied after KMeans, theL improves at the cost ofSSE, which is not desired.
Figure 5.5 Average improvement in the compaction objectivefor the experiments on artificial datasets. The optimization in theSSEmetric compared to the worst case values is evaluated for KMeans,GTKMeans, MKMeans and PKGame.
106

Figure 5.6 Average improvement in the equi-partitioning objective for the experiments on artificialdata set. The optimization in theL metric compared to the worst case values is evaluated for KMeans,GTKMeans, MKMeans and PKGame.
5.4.4 Fairness of Clustering
The strength of the game theoretic clustering methodology lies in the fairness of optimizing each
objective with equal priority. To appropriately evaluate the performance of the algorithms, a quantita-
tive measure of the fairness of the algorithms for optimizing SSEandLOADcan be identified using the
Jain’s Fairness Index[109], or a geometric mean of the relative improvement in theclustering criteria.
According to the Jain’s index, the fairness of the methodology is identified using Equation 5.7.
f airness=
(n
∑i=1
xi)2
(n∗n
∑i=1
x2i )
(5.7)
Here,xi corresponds the improvement in theith objective. The fairness value ranges from 0 (worst
case) to 1 (best case). Similarly, The geometric mean of the improvements in the clustering criteria
identifies the average performance of the methodology, equally weighing all the criteria. Table 5.3
shows the fairness metric values for different number of clusters. As shown, the GTKMeans method
has a high Jain’s fairness index averaging 0.98 as compared to the KMeans value of 0.93. This signifies
107

that the GTKMeans method optimizes both the objectives withequal priority. Similarly, the geometric
mean of the GKT-Means is higher than the KMeans by more than 15percent. The fairness performance
of the MKMeans method and the PKGame method is also inferior to the GTKMeans fairness.
5.4.5 Sensitivity Analysis
The experimental results on the artificial data sets, shown in the previous subsections give hints
about the sensitivity of this methodology for different design attribute values. In this subsection, we
will closely analyze the sensitivity of the GTKMeans method. The number of players, number of
strategies per game, response time of the algorithm, and structure of the data set significantly affect
the practicability of this method. In the following subsections, we experimentally analyze these pa-
rameters.
5.4.5.1 Data Set Similarity Measure
In many cases, the structure of the data set has a significant impact on the performance of an
algorithm. We generated a wide range of artificial data sets in terms for number of data objects per
cluster defined as the similarity measure, and radius of a cluster asσ =±2 on a 10*10 grid. The effect
of structure on the execution time of the algorithm for different similarity measures and cluster sizes is
shown in Figure 5.7. As shown, the similarity measure does not significantly impact the performance
of the algorithm, i.e., on average, the execution time of theGTKMeans algorithm is independent of
the structure of the data set, and hence it is suitable as a general clustering methodology. The average
performance in terms of fairness of allocation is shown in Table 5.3. The geometric mean fairness is
in range 60-80 percent, which is a good measure of fairness. Hence, the structure of a data set does
not adversely affect the performance of this methodology.
5.4.5.2 Number of Players and Strategies
An important consideration during the modeling of a problemin a game theoretic framework is
the impact of the size of game. The size determines the complexity, and consequently the performance
of the system. Thus, we evaluated the average size of the gamein terms of the number of players and
the strategies for different clusters. The graph shown in Figure 5.9 displays the range of players and
108
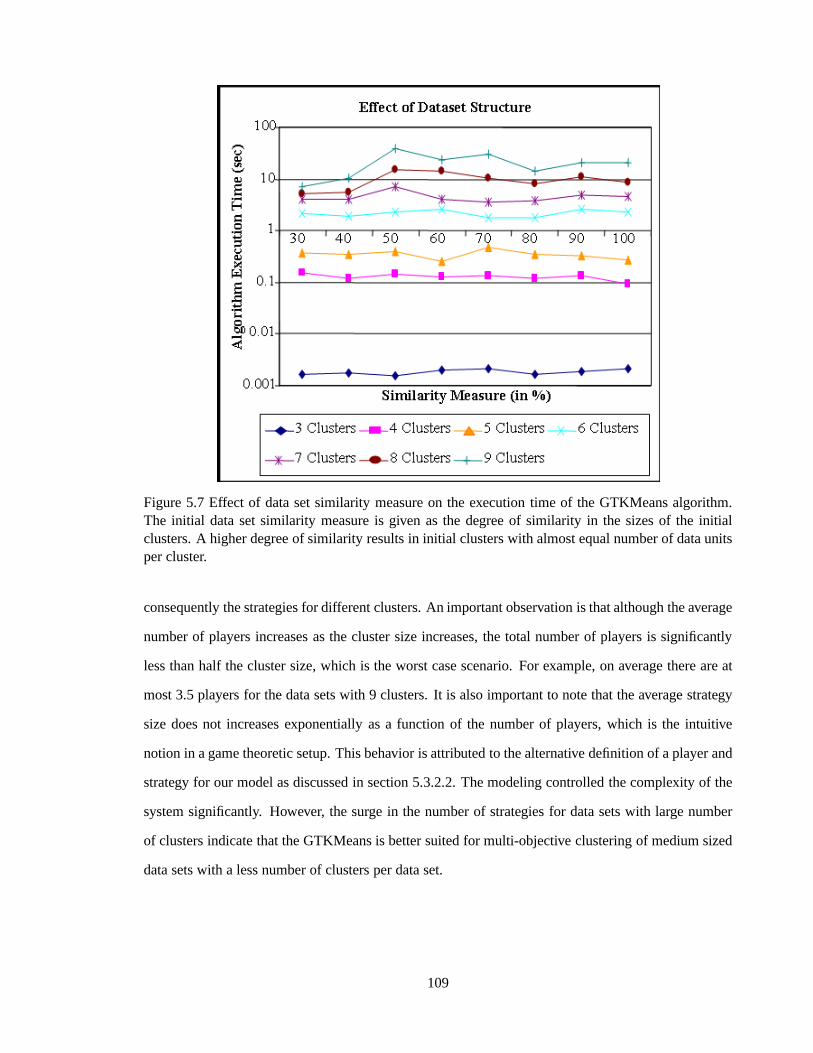
Figure 5.7 Effect of data set similarity measure on the execution time of the GTKMeans algorithm.The initial data set similarity measure is given as the degree of similarity in the sizes of the initialclusters. A higher degree of similarity results in initial clusters with almost equal number of data unitsper cluster.
consequently the strategies for different clusters. An important observation is that although the average
number of players increases as the cluster size increases, the total number of players is significantly
less than half the cluster size, which is the worst case scenario. For example, on average there are at
most 3.5 players for the data sets with 9 clusters. It is also important to note that the average strategy
size does not increases exponentially as a function of the number of players, which is the intuitive
notion in a game theoretic setup. This behavior is attributed to the alternative definition of a player and
strategy for our model as discussed in section 5.3.2.2. The modeling controlled the complexity of the
system significantly. However, the surge in the number of strategies for data sets with large number
of clusters indicate that the GTKMeans is better suited for multi-objective clustering of medium sized
data sets with a less number of clusters per data set.
109

Figure 5.8 Relationship between the execution time and the number of clusters. The algorithm execu-tion time of KMeans and GTKMeans are compared in this set of experiments. Additionally the worstcase and the average case execution times are plotted and compared.
Figure 5.9 Average number of players and strategies for different cluster sizes. For different clus-ter sizes, the average number of players and strategies per game indicate the size of the game andconsequently the execution time and the feasibility of the clustering algorithm.
110

5.4.5.3 Execution Time
The multi-objective clustering methodology presented in this work is slower than the KMeans
method by multiple orders of magnitude. Similar is the case with other heuristics based methodologies.
In order to quantify the effect of number clusters on the execution time of the algorithm, and analyze
the performance extremes, we plotted average execution time and the maximum execution time for
different number of clusters. As shown in Figure 5.8, for smaller number of clusters, i.e.,K = 3, · · · ,8,
the GTKMeans performs well and identifies the optimum clusters within 10 seconds. Also, the worst
case performance follows similar trend and is within 100 seconds. However, for larger number of
clusters, the performance decays exponentially. This is due to the fact that as the number of clusters
increase, the potential number of clusters and correspondingly the strategies increase significantly, and
the game becomes large. The time complexity of the Nash equilibrium algorithm is exponential, which
results in slower execution time for such cases.
5.5 Discussion
A novel microeconomics based algorithm for multi-objective clustering problem has been devel-
oped in this research. In this algorithm, a non-cooperativemulti-player normal form multi-step game
is formulated with the subsets of initially identified clusters as players. Any mathematical partitioning
method can be employed to identify the initial clusters and to update the clusters after an iteration of
the game. A Nash equilibrium based method is used to solve thegame theoretic formulation. This al-
gorithm is independent of the type and the number of objectives that can be simultaneously optimized.
Also, an ensemble based game theoretic optimization algorithm has been developed in this work. In
the ensemble based method, the KMeans partitioning is performed first, followed by a game theoretic
formulation based upon the sizes of the clusters. The experimental study on the existing and artifi-
cial data sets provides important insights for the game theoretic clustering algorithm. As compared
to the KMeans, this algorithm performs significantly betterin terms of the fairness toward improv-
ing the clustering criteria. Also, the complexity of the algorithm in terms of players and strategies
is much lower as compared to the classical normal form game theoretic modeling. This is attributed
a novel definition of strategy. This algorithm is not sensitive the structure of the data set. However,
the algorithm does not scale very well with the size of the data sets in cases where the number of
111
clusters increase. Overall, this model is well suited for a multi-objective clustering problem where the
objective functions are complementary and need to be optimized simultaneously.
The domain of multi-objective clustering is receiving significant attention as the newer multidis-
ciplinary research areas are emerging. This first attempt inpropounding a game theoretic solution is
attractive. The applications of this algorithm may requireseveral objectives to be considered simulta-
neously, depending upon the application area. Also, an alternate modeling of the payoff function may
improve the cost function in terms of capturing the essence of competitive objectives, and thus need
further investigation and refinement. A logical next step inresearch is to model this game theoretic
clustering approach for dynamically changing scenarios. Similarly, techniques for pruning the strategy
sets would also result in multi-fold improvement in the performance and complexity of the model.
112

Table 5.2 Performance of the algorithms on Iris data set. Theclustering algorithms KMeans, MKMeans, GTKMeans, and PKGame are compared fortheir performance on two optimization metrics, compaction(SSE) and equi-partitioning (L).
Total Average Improvement in SSE† Value (in %) Average Improvement in L‡ Value (in %)Clusters KMeans MKMeans§ GTKMeans¶ PKGame†† KMeans MKMeans GTKMeans PKGame
2 94.5 93.9 84.3 94.5 45.8 40.3 57.1 45.83 93.7 97.4 76.8 93.8 35.9 75.9 57.6 35.94 93.6 98.2 72.4 86.1 35.6 64.5 94.2 99.95 93.6 98.3 75.4 90.4 33.6 55.8 82.0 97.96 93.2 98.7 67.2 91.4 30.1 55.2 61.7 91.47 93.4 98.8 63.9 93.6 29.5 44.7 75.2 90.88 93.9 98.9 51.9 94.9 30.8 51.7 59.4 82.99 93.8 99.0 59.8 95.2 29.6 45.7 60.2 83.410 94.2 99.0 72.2 95.0 29.0 43.1 69.9 86.111 94.7 99.1 66.3 95.7 31.8 43.0 66.2 85.1
†: Sum of Squared Euclidean Distance (SSE) corresponds to the compaction objective‡: Load(L) corresponds to the equi-partitioning objective§: Modified KMeans (MKMeans) algorithm¶: Game Theoretic KMeans (GTKMeans) algorithm developed inthis research††: Post KMeans Game Theoretic (PKGame) ensemble based algorithm developed in this research
113

Table 5.3 Fairness of the clustering algorithms. The KMeans, MKMeans, GTKMeans and PKGame algorithms are compared on the basis of thequantitative measure of the fairness of the clustering. Thetwo fairness indexes used for the comparison are Geometric mean fairness index and Jain’sfairness index.
Clustering Geometric Mean Fairness Index Jain’s Fairness IndexAlgorithm 3 4 5 6 7 8 9 10 3 4 5 6 7 8 9 10
KMeans 57.1 60.5 61.2 59.4 60.1 60.9 56.9 62.0 0.89 0.94 0.95 0.93 0.93 0.95 0.93 0.96
MKMeans 64.0 65.9 65.2 64.9 63.7 62.2 62.0 62.7 0.92 0.94 0.94 0.94 0.94 0.92 0.92 0.92
GTKMeans 78.0 73.8 72.7 71.2 77.1 73.8 74.3 76.2 0.90 0.98 0.98 0.97 0.97 0.98 0.97 0.99
PKGame 57.1 66.5 56.7 46.3 36.5 41.3 41.8 44.9 0.90 0.88 0.80 0.72 0.66 0.72 0.74 0.78
114

CHAPTER 6
GAME THEORETIC APPROACH TO ROBOT TEAM FORMATION
The aggregation of robots into teams is necessitated due to the limited power and communication
capabilities in emergency environments. The formation of teams of robots significantly enhances
the performance and efficiency of search and rescue missionsin such environments. As opposed
to the classical partitioning application domains, the robot aggregation requires multiple conflicting
objectives to be optimized. We present a new method for simultaneous multi-objective partitioning
of robots into teams, which is based on the concepts of microeconomics. The method utilizes the
strengths of KMeans algorithm, game theoretic modeling, and Nash equilibrium methodology for
fast and socially fair partitioning. In this work, partitions are created to identify decentralized teams
of robots in such a manner that each robot in a team closest to its communication gateway, as well
as each team is equally represented in terms of its strength (battery power). Rigorous simulations
were performed to evaluate the performance of the method, and the results indicate that our method
performs significantly better than the KMeans methodology,and identifies good solution points.
6.1 Problem Description
In the recent years, search and rescue robotics has emerged as an important emergency response
function. Mobile robots have been shown to be a valuable resource during the exploration missions
in the event of such emergencies [110]. These robots are involved in collecting and integrating the
information, and transmitting it to the base station for further deliberation. In a centralized system,
this requires each robot to maintain a wireless connection with the base station and constantly send
the information packets. However, this communication is significantly limited by the strict constraints
of battery power, low radio range, and constantly changing environment for every robot.
For a detailed explanation of the steps involved in the multi-emergency robot deployment and the
issues faced in the process, please refer to Figures 6.1 – 6.5.
115

• Figure 6.1 shows a scenario where multiple emergency situations have emerged in a locality
in a time-overlapped manner. Often in such situations, the deployment of emergency response
personnel is not feasible, and hence robotic units play an important role in the search and rescue
missions.
• The robots deployed in the field requires two types of communication. Each unit needs to com-
municate with the base station to receive the command and control. The feedback from the
emergency location is continuously transmitted to the basestation. Also, the robots communi-
cate with each other in order to coordinate the coverage areaamong them. This ensures that the
complete terrain is covered. The deployment of robots and the interconnection network being
established in such scenario is shown in Figure 6.2.
• However, a point-to-point grid based networking scheme where each node communicates with
every other node and the base station is not feasible in thesescenarios. This is shown in Figure
6.3. Due to the limited battery power and high communicationoverhead, a few robotic units may
drop out of the system as the time progresses, resulting in a situation where the communication
with some of the emergency location would be lost.
• Thus, a partitioning mechanism may be used to form teams of robot units, such that each par-
tition has a set of robots that are close to each other and hence dissipating less power in intra-
cluster communication. Also, a partition head is decided among the nodes of the partition
(possibly the one with maximum available battery power) which is responsible for the inter-
cluster as well as the cluster to base station communication. In this manner, the communication
overhead is reduced and the robots may sustain in the field forlonger duration. If a classical
clustering scheme like KMeans is used for partitioning, theteams are formed as shown in the
Figure 6.4.
• However, the partitioning requirements in a multi-emergency rescue and response are different
from other environments, in the sense that the partitioningis required to be performed on the
basis of multiple criteria. In this particular case, the teams of robots being formed should possess
two important properties; the intra-cluster communication should be minimized to reduce the
power dissipation in communication, and each team should beequally represented in terms of
116

its capabilities. The set of capabilities could be anythingranging from the equal distribution of
the robotic units in terms of their rescue capabilities, thedistribution of robotic units that are
specialized to perform certain jobs, or a simple equal distribution of the total battery power in
each cluster to ensure that each emergency location is examined with equal capabilities. The
classical partitioning algorithms are largely single metric optimization methods, and thus can
not be used for partitioning. They often result in formationof partitions that are either too large
or too small. One such partitioning result is shown in Figure6.5, where a couple of partitions
are too large and a couple of them are too small. If the partition is too small, the robots in that
partition will have to perform all the work, as well as communication, and will soon drop out of
the network due to rapid power dissipation.
Figure 6.1 Example of a multi-emergency situation in a suburban area. Several emergency manage-ment resources are allocated to the emergency locations forsearch, rescue, response and recoveryprocess.
Although, the issue of work distribution to the robots within a team [111, 112] has received sig-
nificant attention, the development of specialized algorithms for optimal aggregation of robots into
teams has not been explored. Unlike classical application domains like data mining, bio-informatics,
computer vision and pattern recognition, computer and communication networks, and information
systems [11,12], where object and data clustering are performed on the basis of single objective, multi-
disciplinary applications like robot team formation require multiple criteria (that may be conflicting
117

Figure 6.2 An example of search and rescue robot deployment in multi-emergency scenario. Therobotic units are deployed in situations where search and rescue situations are complex and inacces-sible to humans. A primitive inter-connection network is established to monitor progress in real timeand share the information among the robots, and between robots and the base station.
Figure 6.3 Effect of high communication overhead on the search and rescue process. As a result ofhigh communication bandwidth and the limited battery powerof each robot, the robotic units may die,thereby disrupting the response from some emergency locations.
118

Figure 6.4 Partitioning of robots such that the intra-cluster communication is minimized, and eachpartition has a head node responsible for inter-cluster communication.
Figure 6.5 Partitioning results for robot team formation using KMeans algorithm. Since KMeansperforms the partitioning on the basis of a single objectiveof cluster compaction, the teams identifiedusing this algorithm are such that some of the teams are very large in size, whereas some of the teamsare very small in size.
119

in nature) to be optimized. Some of the partitioning criteria in this domain include compaction, equi-
partitioning of robots on the basis of capabilities per partition, number of units per partition, availabil-
ity of average battery power per partition, or equi-distribution of workload per partition, etc. Hence, a
technique for simultaneous optimization of conflicting objectives needs to be developed. In this work,
we have developed a novel methodology that performs simultaneous multi-objective partitioning of
robots into teams. The methodology consists of three important components:
• An iterative hill climbing partitioning algorithm
• A multi-step normal form game theoretic model
• A Nash equilibrium (NE) based solution methodology
6.2 Why Microeconomics for Robot Team Formation?
In the context of rescue robots, due to the power and communication constraints, compactness and
uniform power distribution have been considered as the objectives to be optimized. Since these two
objectives are conflicting, and thus convex in nature, the system can be naturally modeled as a game.
Also, as shown in [13], if the payoff function is convex, a Nash equilibrium solution always exists and
tends to evaluate globally optimal solutions.
In multi-emergency environments, it is desirable to ensurethat all emergencies receive resources
in a fair manner. Fairness has several connotations, but in this case it corresponds to a situation where
each emergency receives its fair share of rescue robots. Game theory exhibits a unique property social
equity or social fairness [13], which ensures that each player in the game is satisfied and the overall
goals are reached. The game theoretic social equilibrium inherently ensures the optimum values of
each objective with respect to other objectives, which is desirable in these scenarios.
6.3 Background
The real time applicability of mobile robots for urban search and rescue (USAR) was first rec-
ognized during the World Trade Center disaster [113]. The research in the domain of USAR, and
human-robot integration (HRI) [114] has identified explicit communication among the robots as a
big obstacle. This is attributed to the limited network bandwidth, limited battery power of robots, and
120

noisy communication channels. An effective solution to this problem is to cluster the robots into teams
to ensure robustness and reliability. In [115], the authorshave discussed the performance of several
rescue robots at the RoboCup Rescue Real Robot League competitions, and have identified that the
multiple robot cooperation, and teams of robots could maximize the search regions, and utilize and
enhance the abilities of robots in search and detection missions. However, much research concentrates
on the identification and optimization of task distribution, and cooperation among the robots within a
team [111].
In [112], the use of stochastic game theory to model cooperation among the robot team on the
basis of observation history has been demonstrated. Similarly, in [116], the authors propose a hybrid
robotic communication mechanism that uses robot vision andradio signals for improved communi-
cation. In [117] the multi-robot exploration problem has been addressed from a different perspective
by suggesting a KMeans based clustering of the unknown search space and allocating the space to the
robots for exploration.
The problem of object partitioning has been investigated inthe context of a wide range of applica-
tions, and reported in literature. Detailed surveys of these works can be found in [11,69]. An elaborate
discussion of these methods on the basis of partitioning criteria like compaction, equi-partitioning,
connectedness, and spatial separation can be found in [12, 78]. The KMeans [74] is the simplest and
most widely used mathematical algorithm for partitioning on the basis of compaction. It is used for
creating initial partitions in our approach discussed later. Additionally, some heuristics based tech-
niques [83, 88] and hybrid approaches [85] have been proposed in literature. However, all of these
methodologies are limited to single objective optimization. In the realm of multi-objective optimiza-
tion, the proposed models primarily consist of ensemble methods [89] that perform single objective
optimization using different methods for different objectives, and integrate the resultsa posteriori.
These methods do not exploit the real strength of simultaneous multi-objective optimization.Mi-
croeconomic optimizationmethods are capable of naturally modeling the situations ofconflict and
cooperation in a game theoretic setting as discussed in the previous section. It models optimization
problems in a framework consisting of players with conflicting objectives competing to optimize their
individual as well as the system wide utilities [27, 28]. Thegame is solved using Nash equilibrium
based methodology that identifies a socially fair solution [36].
121

In this work, we identify the robot team formation problem asa multi-step normal form non-
cooperative game. A subset of initial partitions identifiedby KMeans algorithm are modeled as play-
ers, and the remaining as resources, different combinations of robot requests by players from different
resource centers as strategies, and a function of competingobjectives compactness and uniform power
distribution as the payoff. The partitions are updated iteratively on the basis of NE solutions until the
stopping criterion is satisfied.
6.4 Microeconomic Modeling
In this section, we describe the partitioning algorithm formulti-robot team formation. Since this
is an application of the multi-objective clustering approach being presented in Chapter 5, the method-
ology follows the same steps for most part. In this section, we will briefly discuss the steps involved
in the algorithm. Please refer to Section 5.3 for detailed description of these steps.
The algorithm identifies the initial partitions using the KMeans clustering method, and if the initial
partitions are not optimal, a game is formulated with the partitions as players and resources. A Nash
equilibrium solution of the game identifies the optimal reallocation of robots to the partitions. The
notations and terminology being used in the rest of the paperare given in Table 6.1.
6.4.1 KMeans Partitioning
This methodology requires the KMeans algorithm to identifyinitial as well as the updated teams
of robots. The KMeans algorithm partitions the total numberof robotsN into partitions (K) depend-
ing upon the number of emergency locations in a region. Each team would perform the search and
rescue operations at the corresponding emergency location. The steps involved in the mathematical
partitioning process are:
• Initialize the random partition heads at the coordinate locations near the emergency locations.
• Calculate the distance (Euclidean in this case) of each robot from each of the partition heads,
given as:
E(k)(W) =N
∑i=1
wik
d
∑j=1
(xi j −ck j)2 (6.1)
122

Table 6.1 Notations for robot partitioning. The notations are used in developing the algorithm forrobot teams formation on the basis of compaction for low power dissipation in communication, andequi-partitioning for uniform power distribution.
N Total number of robots in the systemd Total number of attributes of a robot (coordinates)K Total number of partitionsEnk Euclidean distance betweenn andk, wheren∈ N andk∈ KE Sum of the squared Euclidean distancelk Number of robots in partitionk,∀k∈ Kl ideal Number of robots per partition in a uniform power distribution situation;l ideal = |N/K|L Uniform Power Distribution Measure;L = ∑K
k=1(lk− l ideal)2
P Total number of players;P⊂ Kpi ith player in a game;∀i ∈ Pp−i The set of all the players in the game other than the playerpi
R Total number of resource centers;R⊂ Kr j jth resource center in a game;∀ j ∈ Rr− j Set of all the resource centers not in the current gameUi Total number of strategies of a playerpi
Si Set of all the strategies of playerpi
siu uth strategy of the playerpi ; si
u ∈ Si andu = 1, · · · ,US Strategy set consisting of all the strategies in the game;S= {S1,S2, · · · ,SP}S−i Set of all the strategy combinations of all the players otherthanpi
s−iv A strategy combination consisting of one strategy of all theplayers other thanpi ; s−i
v ∈ S−i
E(W) =K
∑k=1
N
∑i=1
wik
d
∑j=1
(xi j −ck j)2 (6.2)
Here, Equation (6.1) corresponds to the distance measure for thekth partition and Equation (6.2)
corresponds to the total intra-partition variation.
• Assign the robot to the partition according to the sum of squared Euclidean distance (SSE)
measure, as given by Equation (6.3).
E(W∗) = minW{E(W)} (6.3)
6.4.2 Game Theoretic Partitioning of Robots
The process of identifying partitions with the objective ofminimization of SSE measure adversely
affects the complementary power distribution objective (denoted byL). Hence, a game is required
to be formulated to simultaneously optimize all the conflicting objectives. Specifically, the process
involves the identification of initial partitions using theinitialization step of KMeans algorithm. These
123

partitions are then categorized as players and resource centers, and a game is formalized. The players
in the game compete for allocation of resources (robot units) from the resource centers. The strategy
of a player is modeled as a tuple consisting of the number of robots requested from every resource
center. The payoff corresponding to the various strategiesrepresents conflicting objectives. After the
formulation of the game, a Nash equilibrium solution point is evaluated and the allocations are per-
formed accordingly. After the reallocation of robots to thepartitions according to the game theoretic
solution, the partitions are updated using the KMeans algorithm. This complete process is repeated
until optimum partitions are identified. The steps involvedin the algorithm are described in Algorithm
Algorithm 6.1 .
Algorithm 6.1 Microeconomic robot team clustering algorithmRequire: Locations of robots, initial number of partitions, initialallocation of robots to the partitions
after KMeansEnsure: Optimal Partitioning of robots into teams on the basis of power distribution and compaction
objectives1: if for each partitionk then2: The conditionlk = l ideal is satisfied, then report the solution as optimal, and exit.
Here,l ideal = number of units per cluster at the uniform power distribution state3: else4: Classify the unequal partitions as players and resources:5: Players: allk, such thatlk ≤ l ideal;6: Resources: allk, such thatlk ≥ l ideal;7: end if8: for For each resource locationdo9: Players formulate a game with their strategies, to receive units from the resource, so that the
overheads are distributed among the players and the resource achieves a consistent state (l ideal).10: The game is then solved for an equilibrium solution point using Nash equilibrium algorithm11: end for12: After the reallocation, the new partition centers are identified, and the process is repeated until
convergence
The generation of the strategy set involves the players trying to receive units from the resource
locations on the basis of minimum cost allocation methodology, irrespective of the allocations made
to the other players. However in this process, a situation may arise where location has allocated more
units than its overhead. Therefore, a game is formulated andsolved for that resource location, and
subset of partitions that have tried receiving units from itplay the game. The strategies of the players
consist of the number of units they may need to lose in order toensure that the resource location is in
consistent state, i.e., it has a uniform power distribution. Due to this alternative definition of strategy,
124

a single step game with an exponential strategy set and largenumber of players is reduced to multiple
games of with significantly smaller strategy sets and players. The details of the steps followed for
defining the strategy set for the game theoretic formulationare given in Section 5.3.2.2.
Each strategy combination in a game has an expected utility that a player would receive. The
utility is mathematically modeled as a payoff function evaluating the gain or loss a player would incur
when it plays its own strategy and the other players play their corresponding strategies. The payoff
function in this model captures the inter-relationship of the optimization criteria, and is modeled as a
geometric mean of the total loss incurred by a player when it plays a particular strategy. Specifically,
a player would have to receive units from a distant resource location if the other players request for
all the units available with the current resource location.The payoff, a function of power distribution
metric and compaction metric is the loss to the player when such a situation occurs. The algorithm for
payoff function is given in Algorithm Algorithm 5.4 in section 5.3.2.3.
The payoff matrices evaluated during the previous step are given as input to the Nash equilibrium
(NE) algorithm, which generates an output as a NE strategy set consisting of one strategy chosen
for every player in the game. At the Nash equilibrium point, no player has incentive to change its
strategy unilaterally. Mathematically, the NE point is given by Equation (6.4). After the equilibrium
strategies are identified, the reallocation of units is performed accordingly. The game is then played
for other locations in conflict and the allocations are performed accordingly. The partition medoids
are then updated, and the complete process is repeated untilthe relative improvement in the power
distributions does not supersede threshold decrease in thevalue of SSE.
poi(s∗1, · · · ,s∗i , · · · ,s∗P′)≥ poi(s
∗1, · · · ,si , · · · ,s∗P′) (6.4)
6.5 Experimental Results
In this section, we present the experiments that were carried out to evaluate the efficacy of the
methodology for robot team formation. Since there are no benchmarks available for multi-objective
robot partitioning, several artificial data sets were created to simulate the real world scenarios. The
performance of the microeconomic model was compared with the classical KMeans algorithm.
125

6.5.1 Simulation Tools and Setup
To simulate the locations of robots on a terrain the following setup was formulated:
• A two dimensional grid of size 12*12 was created, and normally distributed data sets consisting
of the x-y coordinates of the robot locations on the grid weregenerated.
• The values of mean and variance were varied from 0≤ µ≤ 10 andσ =±2 respectively for each
data set.
• The data sets with 35 nodes were generated, with 3 to 7 clusters per data set.
• The intra-partition similarity measures in terms of numberof robots per partition were taken
into consideration. For example, a data set 57 would have 5 partitions, each partition having
the number of robots ranging fromb0.7∗ (35/5)c = 4 to b(0.3∗ (35/5))+ (35/5)c = 9.
• Each experimental result was an average of 200 repetitions with random gateway location ini-
tializations.
• The Nash equilibrium (NE) solution to the n-person normal form game is identified using the
Simplical Subdivision algorithm, which has been identifiedto work consistently better than
other existing NE methodologies available in literature. Based upon the simplex method, the al-
gorithm starts with a given grid size, and converges to an approximate solution point by iterative
labeling of the sub-simplexes.
• Gambit [108], an open source C library of game theory analyzer software toolkit for identifica-
tion of NE solution was used as a solution methodology.
6.5.2 Analysis
Experiments were conducted to study the performance of thismethod in simultaneously optimiz-
ing the objective functions; the compaction measure (SSE) and the uniform power distribution measure
(L). As shown in Figure 6.6, for a data set 67 that consists of 6 gateways, and 35 robots distributed
among the gateways, our methodology identifies the partitions with theSSEof 58.86, and theL being
10.83, which contributes toward an improvement of 90.3% and90.2% respectively from the initial
values. However, for the KMeans algorithm, although the improvement in compaction is 1.3% higher
126

than game theoretic method, the power distribution objective is 45.1% worse. Overall, the game theory
based multi-metric optimization method outperforms the KMeans algorithm in terms of simultaneous
optimization of the multiple objectives.
Figure 6.6 Identification of optimum sizes of the clusters and the locations of the cluster centers usinggame theoretic algorithm, and KMeans algorithm. Total number of robots = 35, total number ofgateways = 6, and name of data set = 67.txt.
The average performance of the new method was also compared with the KMeans algorithm. All
35 data sets were executed and average of the outputs for improvements inSSEandL were plotted on
a graph as shown in Figure 6.7. As shown, the improvement in the compaction objective is higher for
the KMeans algorithm. This is intuitive since KMeans performs the partitioning only on the basis of
optimization of compaction objective. However, this adversely affects the uniform power distribution
objective, and is evident from the graph.
In contrast, our algorithm simultaneously optimizes both the objectives. It is important to note
that both the objectives are optimized with an average improvement of more than 50% in terms of
results. An interesting observation is that as the number ofpartitions increase, the performance of this
method improves and after certain limit it degrades. This isdue to the increasing dimensionality of the
problem. If the number of partitions are too few, the initialpartitions identified by the initial iteration
127

Figure 6.7 Average performance of algorithms on artificial data sets. The KMeans and the gametheoretic algorithm are compared for their performance on the cluster compaction (SSE) and uniformpower distribution (L) metrics.
of KMeans optimally partitions the data, and a game is not formulated often. As the partitions increase,
the KMeans initialization is unable to identify optimum clusters resulting in multiple iterations of game
formulation and hence simultaneous optimization of objectives. However, as the partitions increase
beyond a certain limit, the number of strategies per game increase and the game theoretic model in
its current form prunes the strategy set to control the dimensionality of the problem. Due to this,
occasionally the strategies that are not locally optimal but have a global effect may get pruned thereby
affecting the performance.
The response time of a microeconomic model largely determines its practicability in an applica-
tion domain. The parameters that largely govern the response time for game theoretic model in this
context include the number of players, the number of partitions, and the total number of strategies of
players. Table 6.2 shows the average values of these parameters for different number of gateways. For
smaller number of partitions, the initial KMeans clustering is often optimal and a game is not required
to be played, and hence average number of iterations of game is less than one. The results on the
simulated data sets are promising because as the number of partitions increase, the number of strate-
gies do not increase exponentially, which is a concern with most of the problems modeled in a game
theoretic framework. The linear relationship between the size of strategy set and number of partitions
is attributed to the novel definition of the strategy and the modeling of the game in this context of this
128

work. The strategy set for a player in this model does not depend on combinations of the number of
resource locations that are availing the resources, but on the number of units a player may have to lose
for keeping the resource in a consistent state.
Table 6.2 Parameters affecting the game theoretic model. The inter-relationship between the importantattributes of a game such as the number of players, number of strategies, number of clusters, totalnumber of game iterations, and the execution time of the algorithm is identified.
Partitions 3 4 5 6 7Avg. Iterations of Game 0.23 0.80 1.52 1.96 2.02Avg. Number of Players 0.22 0.60 1.39 1.60 2.13
Avg. Number of Strategies 0.32 2.08 4.71 5.27 6.77Response Time (sec.) 0.0003 0.0627 0.1447 0.1615 0.1968
6.6 Discussion
A novel microeconomic approach for multi-objective robot team formation problem has been de-
veloped in this research. It models the problem as a hybrid approach involving Kmeans and non-
cooperative multi-player normal form game with Nash equilibrium based solution. The objective
functions being considered in the model are compactness, and uniform power distribution. The sim-
ulations have been conducted using normally distributed artificial data sets. The performance of this
method as compared to the KMeans algorithm conforms to the claim that our model is better suited
for robot aggregation than the existing partitioning methods. The average complexity of the system
is non-exponential. This is the first successful attempt in the direction of robot team formation on
the basis of multiple objectives. Currently, the model is simplistic, and optimizes only two objectives
simultaneously. However, the practical implementation ofthe model may require more objectives, like
improved radio communication, minimum inter-team communication, etc. to be considered. In such
scenarios, the payoff modeling would need further investigation and refinement. Also, in practice, the
capabilities of each robot are different, and such considerations must be reflected in the modeling. It
is required to deploy robots in several real world test scenarios to efficiently and accurately evaluate
the performance of the algorithm.
129

CHAPTER 7
CONCLUSIONS AND FUTURE DIRECTIONS
Successful packing two billion transistors on a single chip[10] gives a clear idea about the level
of miniaturization, and density of the next generation VLSIcircuits. This increase in the integration
uncovers numerous issues that have to be addressed by the designers in order to realize high perfor-
mance, low power dissipating, and reliable circuits. Some of these concerns include the impact of
process variations at nanometer level, the effect of various performance metrics on each other, and the
efficiency of the circuit optimization methods. It is a challenging task to address all these issues in a
single model. The focus of this dissertation is to address all these concerns in the VLSI domain, and
to develop a framework that is capable of solving the currentas well as next generation VLSI circuit
optimization problems.
The size of an optimization problem in any engineering discipline encourages the use of clustering
mechanisms to partition a large problem into smaller problems, and solve them separately. However,
it is difficult to adapt the knowledge and intelligence from classical clustering disciplines to solve this
problem. Specifically, in situations where the clustering needs to be performed on the basis of multiple
objectives that may be competitive in nature, single objective clustering algorithms can not generate
good clusters. Thus, the development of a generalized clustering mechanism for such problems is
imperative.
In this dissertation, we have developed multi-metric optimization frameworks to solve the VLSI-
CAD circuit optimization problems and spatial pattern clustering problems, using utilitarian methods.
The specific problems being solved in this dissertation are as follows:
• A post layout gate sizing algorithm for multi-metric optimization of delay, leakage power, dy-
namic power, and crosstalk noise in the presence of process variations [118]. The algorithm
generates a deterministic equivalent of the inherently stochastic optimization problem, while
ensuring high utility levels. It is independent of the process variation distributions and can in-
130

corporate the impact of variations due to gate sizes as well as interconnects. The algorithm is
also capable of incorporating randomness in the objective functions.
• Development of a unified mathematical programming based framework for multi-metric opti-
mization of delay, leakage power, dynamic power, and crosstalk noise in the presence of process
variation. The framework can be implemented using any mathematical programming technique,
and is completely reconfigurable in terms of prioritizing orselecting the metrics to be optimized.
• Development of a simple yet effective cross-talk noise model and identification of relationships
between the different performance metrics in terms of gate sizes.
• Development of a novel game theoretic clustering approach for simultaneous multi-metric clus-
tering of spatial data objects. A general framework is developed that can incorporate any number
of conflicting clustering objectives.
• The game theoretic clustering approach is applied to solve the multi-objective robot team par-
titioning problem in multi-emergency search and rescue missions [119]. The partitioning is
performed on the basis of cluster compaction and uniform power distribution.
The utilitarian methods being applied in this dissertationpossess certain unique attributes that have
made their application suitable to solve these problems, and the identification of these methods is
an important contribution of this dissertation. The expected utility based approaches change the per-
spective of solving the stochastic gate sizing problem withrandom constraints to a deterministic risk
minimization problem with an objective of maximization of expected utility of the satisfaction of the
constraints. This transformation significantly reduces the time complexity of the algorithm, while
maintaining a high yield. This is a prime contribution of this dissertation. The modeling of a cluster-
ing problem in a game theoretic framework is novel. The new definition of strategies for the players
has contributed toward significant reduction in the time complexity of the algorithm. A novel defini-
tion of payoffs as a function of equi-partitioning and compaction is unique. The application of spatial
clustering algorithm for the robot team formation is a practical problem, and this is one of the very
few works that have addressed the problem with this perspective.
131

The approaches presented in this dissertation are novel andhave wide applicability in the various
areas of research. Some of the future directions to improve over this dissertation work, and other
interesting research ideas are listed as follows.
• The multi-metric optimization model for VLSI circuit optimization presented in this disserta-
tion incorporates four metrics that have been optimized. Additional metrics like security and
reliability etc. can be incorporated easily once the relationship between the metrics in terms of
gate sizes is identified.
• The expected utility based methods can be utilized for various circuit optimization techniques
like buffer insertion or repeater insertion and wire sizing. These methods also find applications
in solving the multi-metric optimization problems using gate sizing at the logic level or RTL
level.
• The expected utility based optimization presented in this dissertation assumes that scarce infor-
mation in terms of only mean and variance of the process variations is available. However, if
more information in terms of coefficient of correlations is also available, the model can be fur-
ther extended to incorporate such information and formulate a linear programming equivalent
model with quadratic constraints [94].
• The VLSI multi-metric optimization problem contains an objective function that is deterministic
in nature. However, the expected utility based method is capable of solving the problems with
random objectives also. This is an interesting future work for multi-metric optimization with
different levels of randomness in the individual metrics. Such a solution will give a frontier of
solution points.
• The game theoretic spatial clustering algorithm in its current form is capable of clustering
medium sized data sets. This is attributed to the non-linearincrease in the number of strategies
as the number of players increase. However, if better techniques are incorporated to aggressively
prune the strategy set, the algorithm would be able to cluster larger data sets.
• An alternative notion of applying the game theoretic methodto the clustering problem is to con-
sider the objectives as the players. It would be interestingto see the changes in the optimization
132

performance, since the number of players in that scenario would be constant, but the strategy set
may be larger.
• The game theoretic clustering approach has several useful applications. One such application is
in the domain of ad-hoc and sensor networks. The ad-hoc networks need clusters to be formed
with the objective of minimizing inter- as well as intra-cluster communication. To satisfy these
requirements, each cluster designates one of the nodes as a gateway for inter-cluster communi-
cation and one node as a cluster head for intra-cluster communication. Game theoretic clustering
approach can be utilized to solve this clustering problem.
133

REFERENCES
[1] A.J. Strojwas. Conquering Process Variability: A Key Enabler for Profitable Manufacturingin Advanced Technology Nodes.International Symposium on Semiconductor Manufacturing,2006.
[2] ITRS. International Technology Roadmap for Semiconductors.http://www.itrs.net/Links/2007ITRS/ExecSum2007.pdf, 2007.
[3] K.T. Tang and E.G. Friedman. Interconnect Coupling Noise in CMOS VLSI Circuits.Proceed-ings of the International Symposium on Physical Design, pages 48–53, 1999.
[4] S. Borkar. Design Challenges of Technology Scaling.IEEE MICRO, pages 23–29, 1999.
[5] S. Borkar, T. Karnik, S. Narendra, J. Tschanz, A. Keshavarzi, and V. De. Parameter Variationsand Impact on Circuits and Microarchitecture.Proceedings of Design Automation Conference,pages 338–342, 2003.
[6] H. Chang and S.S. Sapatnekar. Statistical Timing Analysis under Spatial Correlations.IEEETransactions on Computer Aided Design, 24(9):1467–1482, 2005.
[7] C. Visweswariah, K. Ravindran, K. Kalafala, S.G. Walker, and S. Narayan. First-Order In-cremental Block-Based Statistical Timing Analysis.Proceedings of the Design AutomationConference, pages 331–336, 2004.
[8] H. Chang, V. Zolotov, S. Narayan, and C. Visweswariah. Parameterized Block-Based StatisticalTiming Analysis with Non-Gaussian Parameters, Non-LinearDelay Functions. IEEE/ACMDesign Automation Conference, pages 71–76, 2005.
[9] L. Cheng, J. Xiong, and L. He. Non-Linear Statistical Static Timing Analysis for Non-GaussianVariation Sources.Proceedings of the 44th Annual Conference on Design Automation, pages250–255, 2007.
[10] Intel Corporation. World’s First Two Billion Transistor Microprocessor.http://www.intel.com/technology/architecture-silicon/2billion.htm, 2008.
[11] A.K. Jain, M.N. Murty, and P.J. Flynn. Data clustering:a review. ACM Computing Surveys,31(3):264–323, 1999.
[12] R. Xu and D. Wunsch. Survey of Clustering Algorithms.IEEE Transactions on Neural Net-works, 16(3):645–678, 2005.
[13] A. Vetta. Nash Equilibria in Competitive Societies, with Applications to Facility Location,Traffic Routing and Auctions.IEEE Symposium on Foundations of Computer Science, pages416–425, 2002.
134

[14] O.H. Kwon. Perspective of the Future Semiconductor Industry: Challenges and Solutions.Proceedings of the Design Automation Conference, 2007.
[15] J.W. Friedman. Game Theory with Applications to Economics. Oxford University Press, 1986.
[16] U. Gupta and N. Ranganathan. Multievent Crisis Management using Noncooperative MultistepGames.IEEE Transactions on Computers, 56(5):577, 2007.
[17] N. Ranganathan, U. Gupta, R. Shetty, and A.K. Murugavel. An Automated Decision SupportSystem Based on Game Theoretic Optimization for Emergency Management in Urban Envi-ronments.Journal of Homeland Security and Emergency Management, 4(2), 2007.
[18] U. Gupta and N. Ranganathan. Social Fairness in Multi-Emergency Resource Management.IEEE International Symposium on Technology and Society, pages 1–9, 2006.
[19] U. Gupta and N. Ranganathan. FIRM: A Game Theory Based Multi-Crisis Management Systemfor Urban Environments.Proceedings of the International Conference on Sharing Solutions forEmergencies and Hazardous Environments, American NuclearSociety, pages 595–602, 2006.
[20] A. Lazar and N. Semret. A Resource Allocation Game with Application to Wireless Spectrum.Technical report, Columbia University, 1996.
[21] Z. Liu, V. Misra, and L. Wynter. Dynamic Offloading in a Multi-Provider Environment: a Be-havioral Framework for Use in Influencing Peering.Proceedings of IEEE International Sym-posium on Cluster Computing and the Grid, pages 449–458, 2004.
[22] Y.K. Kwok, S. Song, and K. Hwang. Selfish Grid Computing:Game-Theoretic Modeling andNAS Performance Results.Proceedings of IEEE International Symposium on Cluster Comput-ing and the Grid, 2005.
[23] D.C. Grosu and A.T.M.Y. Leung. Load Balancing in Distributed Systems: an Approach usingCooperative Games.IEEE International Parallel and Distributed Processing Symposium, pages52–61, 2002.
[24] N. Hanchate and N. Ranganathan. Simultaneous Interconnect Delay and Crosstalk NoiseOptimization Through Gate Sizing using Game Theory.IEEE Transactions on Computers,55(8):1011–1023, 2006.
[25] A.K. Murugavel and N. Ranganathan. A Game Theoretic Approach for Power OptimizationDuring Behavioral Synthesis.IEEE Transactions on Very Large Scale Integration Systems,11(6):1031–1043, 2003.
[26] A.K. Murugavel and N. Ranganathan. Gate Sizing and Buffer Insertion using Economic Modelsfor Power Optimization.International Conference on VLSI Design, pages 195–200, 2004.
[27] F. Forgo, J. Szep, and F. Szidarovszky.Introduction to the Theory of Games: Concepts, Meth-ods, Applications. Kluwer Academic Publishers, 1999.
[28] E. Rasmusen.Games and Information: An Introduction to Game Theory. Blackwell Publishers,2001.
[29] Game Theory .net. A Resource for Students and Educatorsof Game Theory.http://www.gametheory.net/Dictionary.
135

[30] W.F. Lucas. Some Recent Developments in n-Person Game Theory.SIAM Review, 13(4):491–523, Oct. 1971.
[31] D. Dutta, A. Goel, and J. Heidermann. Oblivious AQM and Nash Equilibria.ACM SIGCOMMComputer Communications Review, 32(3), July 2002.
[32] J. Von Neumann and O. Morgenstern. Theory of Games and Economic Behavior.Wiley, NewYork, 1944.
[33] S.J. Russell and P. Norvig. Artificial Intelligence: A Modern Approach.Prentice-Hall Seriesin Artificial Intelligence, page 932, 1995.
[34] M. Friedman and L.J. Savage. The Utility Analysis of Choices Involving Risk.The Journal ofPolitical Economy, 56(4):279–304, 1948.
[35] J. Von Neumann. Zur Theorie der Gesellschaftsspiele.Mathematische Annalen, 100:295–320,1928.
[36] J.F. Nash Jr. Equilibrium Points in N-Person Games.Proceedings of National Academy ofScience of the United States of America, 36(1):48–49, 1950.
[37] E.D. Dolan, R. Fourer, J.J. More, and T.S. Munson. The NEOS Server for Optimization: Ver-sion 4 and Beyond.Mathematics and Computer Science Division, Argonne National Labora-tory, 2002.
[38] C. Visweswariah. Optimization Techniques for High-Performance Digital Circuits.IEEE/ACMInternational Conference on Computer-Aided Design, pages 198–207, 1997.
[39] J. Cong, L. He, C.K. Koh, and P.H. Madden. Performance Optimization of VLSI InterconnectLayout. VLSI Journal on Integration, 21(1-2):1–94, 1996.
[40] J.M. Rabaey. Digital Integrated Circuits: A Design Perspective.Prentice-Hall Electronics AndVLSI Series, page 702, 1996.
[41] B.C. Paul, A. Agarwal, and K. Roy. Low-Power Design Techniques for Scaled Technologies.Integration, the VLSI Journal, 39(2):64–89, 2006.
[42] T. Xiao and M. Marek-Sadowska. Gate Sizing to EliminateCrosstalk Induced Timing Violation.Proceedings of the International Conference on Computer Design, pages 186–191, 2001.
[43] T. Xiao and M. Marek-Sadowska. Crosstalk Reduction by Transistor Sizing.Proceedings ofthe Asia and South Pacific Design Automation Conference, pages 137–140, 1999.
[44] S. Bhardwaj, Y. Cao, and S. Vrudhula. Statistical Leakage Minimization Through Joint Selec-tion of Gate Sizes, Gate Lengths and Threshold Voltage.Proceedings of the Asia and SouthPacific Design Automation Conference, pages 953–958, 2006.
[45] A. Srivastava, D. Sylvester, and D. Blaauw. Statistical Optimization of Leakage Power Consid-ering Process Pariations using Dual-Vth and Sizing.Proceedings of the 41st Annual Conferenceon Design Automation-Volume 00, pages 773–778, 2004.
[46] R. Rao, A. Srivastava, D. Blaauw, and D. Sylvester. Statistical Analysis of Subthreshold Leak-age Current for VLSI Circuits.IEEE Transactions on VLSI Systems, 12(2):131–139, 2004.
136

[47] M. Mani and M. Orshansky. A New Statistical Optimization Algorithm for Gate Sizing.Pro-ceedings of the IEEE International Conference on Computer Design, pages 272–277, 2004.
[48] V. Mahalingam, N. Ranganathan, and J.E. Harlow III. A Fuzzy Optimization Approach forVariation Aware Power Minimization during Gate Sizing.IEEE Transactions on VLSI Systems,2008, to appear.
[49] M. Mani, A. Devgan, and M. Orshansky. An Efficient Algorithm For Statistical Minimiza-tion Of Total Power Under Timing Yield Constraints.Proceedings of the Design AutomationConference, pages 309–314, 2005.
[50] R.W. Brodersen, M.A. Horowitz, D. Markovic, B. Nikolic, and V. Stojanovic. Methods for TruePower Minimization.Proceedings of the International Conference on Computer Design, pages35–42, 2002.
[51] F. Gao and J.P. Hayes. Total Power Reduction in CMOS Circuits via Gate Sizing and MultipleThreshold Voltages.Proceedings of the Design Automation Conference, pages 31–36, 2005.
[52] D. Nguyen, A. Davare, M. Orshansky, D. Chinnery, B. Thompson, and K. Keutzer. Minimiza-tion of Dynamic and Static Power Through Joint Assignment ofThreshold Voltages and SizingOptimization.Proceedings of ISLPED, pages 158–163, 2003.
[53] D. Sinha and H. Zhou. Yield Driven Gate Sizing for Coupling-Noise Reduction Under Un-certainty. Proceedings of the Asia and South Pacific Design Automation Conference, pages192–197, 2005.
[54] D. Sinha and H. Zhou. Gate Sizing for Crosstalk Reduction Under Timing Constraints byLagrangian Relaxation.Proceedings of the IEEE/ACM Conference on Computer Aided Design,pages 14–19, 2004.
[55] N. Hanchate and N. Ranganathan. Statistical Gate Sizing for Yield Enhancement at Post LayoutLevel. IEEE/ACM International Symposium on VLSI Design, pages 245–252, 2007.
[56] V. Mehrotra, S.L. Sam, D. Boning, A. Chandrakasan, R. Vallishayee, and S. Nassif. A Method-ology for Modeling the Effects of Systematic Within-Die Interconnect and Device Variation onCircuit Performance.Proceedings of the Design Automation Conference, 2000.
[57] E. Jacobs and M. Berkelaar. Gate Sizing Using a Statistical Delay Model.Proceedings of theDesign Automation and Test in Europe, pages 283–291, 2000.
[58] S. Nakagawa, D. Sylvester, J.G. McBride, and S.Y. Oh. On-Chip Cross Talk Noise Model forDeep-Submicrometer ULSI Interconnect.Hewlett-Packard J, pages 39–45, 1998.
[59] A. Davoodi and A. Srivastava. Variability Driven Gate Sizing for Binning Yield Optimization.Proceedings of the 43rd Annual Conference on Design Automation, pages 959–964, 2006.
[60] S. Neiroukh and X. Song. Improving the Process-Variation Tolerance of Digital Circuits usingGate Sizing and Statistical Techniques.Proceedings of the Design, Automation and Test inEurope, pages 294–299, 2005.
[61] X. Bai, C. Visweswariah, N. Strenski, H. Philip, and J. David. Uncertainty-Aware CircuitOptimization.Proceedings of the Design Automation Conference, pages 58–63, 2002.
137

[62] A. Agarwal, D. Blaauw, V. Zolotov, S. Sundareswaran, M.Zhao, K. Gala, and R. Panda. Path-Based Statistical Timing Analysis Considering Inter-and Intra-Die Correlations.Proceedingsof ACM/IEEE Workshop on Timing Issues in the Specification and Synthesis of Digital Systems,pages 16–21, 2002.
[63] M. Hashimoto and H. Onodera. A Performance Optimization Method By Gate Sizing using Sta-tistical Static Timing Analysis.Proceedings of the 2000 International Symposium on PhysicalDesign, pages 111–116, 2000.
[64] M.R. Guthaus, N. Venkateswarant, C. Visweswariah, andV. Zolotov. Gate Sizing using Incre-mental Parameterized Statistical Timing Analysis.Proceedings of the IEEE/ACM InternationalConference on Computer-Aided Design, pages 1029–1036, 2005.
[65] S. Raj, S. Vrudhula, and J. Wang. A Methodology to Improve Timing Yield in the Presence ofProcess Variations.Proceedings of the Design Automation Conference, pages 448–453, 2004.
[66] J. Singh, V. Nookala, Z.Q. Luo, and S. Sapatnekar. Robust Gate Sizing by Geometric Program-ming. Proceedings of the Design Automation Conference, pages 315–320, 2005.
[67] K. Agarwal, D. Sylvester, D. Blaauw, F. Liu, S. Nassif, and S. Vrudhula. Variational DelayMetrics for Interconnect Timing Analysis.Proceedings of the Design Automation Conference,1, 2004.
[68] Y. Liu, S.R. Nassif, L.T. Pileggi, and A.J. Strojwas. Impact of Interconnect Variations on theClock Skew of a Gigahertz Microprocessor.Proceedings of the 37th Conference on DesignAutomation, pages 168–171, 2000.
[69] P. Scheunders. A Comparison of Clustering Algorithms Applied to Color Image Quantization.Pattern Recognition Letters, 18(11-13):1379–1384, 1997.
[70] E. Kolatch. Clustering Algorithms for Spatial Databases: A Survey. Online Available,http://citeseer.nj.nec.com/436843.html, 2001.
[71] P. Berkhin. Survey of Clustering Data Mining Techniques. Accrue Software, 10:92–1460, 2002.
[72] F. Murtagh. A Survey of Recent Advances in HierarchicalClustering Algorithms.The Com-puter Journal, 26(4):354–359, 1983.
[73] A. Baraldi and P. Blonda. A Survey of Fuzzy Clustering Algorithms for Pattern Recognition.II. IEEE Transactions on Systems, Man and Cybernetics, Part B, 29(6):786–801, 1999.
[74] J. MacQueen. Some Methods for Classification and Analysis of Multivariate Observations.Pro-ceedings of the Fifth Berkeley Symposium on Mathematical Statistics and Probability, 1:281–297, 1967.
[75] E. Vorhees. The Effectiveness and Efficiency of Agglomerative Hierarchical Clustering in Doc-ument Retrieval.PhD thesis Department of Computer Science, Cornell University, 1985.
[76] G.J. McLachlan and T. Krishnan.The EM Algorithm and Extensions. Wiley, 1997.
[77] M. Ester, H.P. Kriegel, J. Sander, and X. Xu. A Density-Based Algorithm for Discovering Clus-ters in Large Spatial Databases with Noise.Proceedings of the 2nd International Confferenceon Knowledge Discovery and Data Mining, pages 226–231, 1996.
138

[78] W. Gale, S. Das, and C.T. Yu. Improvements to an Algorithm for Equipartitioning. IEEETransactions on Computers, 39(5):706–710, 1990.
[79] Y.T. Wang and R.J.T Morris. Load Sharing in DistributedSystems. IEEE Transactions onComputers, 34:204–217, 1985.
[80] D. Grosu and A.T. Chronopoulos. Algorithmic MechanismDesign for Load Balancing in Dis-tributed Systems.IEEE Transactions on Systems, Man and Cybernetics, Part B, 34(1):77–84,2004.
[81] M. Demirbas, A. Arora, V. Mittal, and V. Kulathumani. A Fault-Local Self-Stabilizing Clus-tering Service for Wireless Ad Hoc Networks.IEEE Transactions on Parallel and DistributedSystems, 17(9):912–922, 2006.
[82] A.D. Amis and R. Prakash. Load-Balancing Clusters in Wireless Ad Hoc Networks.Proceed-ings 3rd IEEE Symposium on Application-Specific Systems andSoftware Engineering Technol-ogy, pages 25–32, 2000.
[83] S. Kirkpatrick, C.D. Gelatt Jr, and M.P. Vecchi. Optimization by Simulated Annealing.Science,220(4598):671, 1983.
[84] K. Krishna and M.N. Murty. Genetic K-Means Algorithm.IEEE Transactions on Systems, Manand Cybernetics, Part B, 29(3):433–439, 1999.
[85] M. Laszlo and S. Mukherjee. A Genetic Algorithm using Hyper-Quadtrees for Low-Dimensional K-Means Clustering.IEEE Transactions on Pattern Analysis and Machine In-telligence, 28(4):533–543, 2006.
[86] J. Handl and J. Knowles. Evolutionary Multiobjective Clustering. Proceedings of the EighthInternational Conference on Parallel Problem Solving fromNature, pages 1081–1091.
[87] F. Glover. Future Paths for Integer Programming and Artificial Intelligence. Computers &Operations Research, 13:533–549, 1986.
[88] M. Dorigo, G.D. Caro, and L.M. Gambardella. Ant Algorithms for Discrete Optimization.Artificial Life, 5(2):137–172, 1999.
[89] A. Topchy, A.K. Jain, and W. Punch. Clustering Ensembles: Models of Consensus and WeakPartitions. IEEE Transactions on Pattern Analysis and Machine Intelligence, 27(12):1866–1881, 2005.
[90] J. Handl and J. Knowles. Multiobjective Clustering andCluster Validation, Chapter 1.Studiesin Computational Intelligence, Springer-Verlag, Berlin,Germany, pages 1–24, 2005.
[91] D. Grosu and A.T. Chronopoulos. A Game-Theoretic Modeland Algorithm for Load Balancingin Distributed Systems.IEEE International Parallel and Distributed Processing Symposium,pages 146–153, 2002.
[92] R.R. Schaller. Moore’s Law: Past, Present and Future.IEEE Spectrum, 34(6):52–59, 1997.
[93] H. Chang, V. Zolotov, S. Narayan, and C. Visweswariah. Parameterized Block-Based StatisticalTiming Analysis with Non-Gaussian Parameters, Non-LinearDelay Functions.Proceedings ofthe Design Automation Conference, pages 71–76, 2005.
139

[94] E. Ballestero. Stochastic Linear Programming with Scarce Information: An Approach fromExpected Utility and Bounded Rationality Applied to the Textile Industry. Engineering Opti-mization, 38(4):425–440, 2006.
[95] M. Berkelaar and J. Jess. Gate Sizing in MOS Digital Circuits with Linear Programming.Proceedings of the Design, Automation and Test in Europe, pages 217–221, 1990.
[96] R.H. Byrd, J. Nocedal, and R.A. Waltz. KNITRO: An Integrated Package for Nonlinear Opti-mization.Large-Scale Nonlinear Optimization, pages 35–59.
[97] N. Ranganathan, U. Gupta, and V. Mahalingam. Simultaneous Optimization of Total Power,Crosstalk Noise, and Delay Under Uncertainty.Proceedings of ACM Great Lakes Symposiumon VLSI, 2008.
[98] N. Ranganathan, J.E. Harlow III, V. Mahalingam, and U. Gupta. Statistical Gate Sizing forMulti-Metric Optimization of Delay, Power and Crosstalk Noise at Post Layout Level.Semi-conductor Research Corporation Technical Report, 1596.001, 2007.
[99] P. Gargini, J. Glaze, and O. Williams. The SIA’s 1997 National Technology Roadmap forSemiconductors: SIA roadmap preview.Solid State Technology, 41(1):73–76, 1998.
[100] J.J. Buckley. Stochastic Versus Possibilistic Programming.Fuzzy Sets and Systems, 34(2):173–177, 1990.
[101] R.E. Bellman and L.A. Zadeh. Decision Making in Fuzzy Environment.Management Science,pages 141–164, 1970.
[102] Masatoshi Sakawa.Genetic Algorithms and Fuzzy Multiobjective Optimization. Kluwer Aca-demic Publishers, 2002.
[103] N.R. Gasimov and K. Yenilmez.Fuzzy Linear Programming Problems with Fuzzy MembershipFunctions. 2000.
[104] J.G. Klir and B. Yuan.Fuzzy Sets and Fuzzy Logic. Prentice Hall, 1995.
[105] C. Papadimitriou. Algorithms,Games, and the Internet. Proceedings of the Thirty-Third AnnualACM Symposium on Theory of Computing, pages 749–753, 2001.
[106] H. Spath.Cluster Analysis Algorithms for Data Reduction and Classification of Objects. EllisHorwood, 1980.
[107] Y. Chien. Interactive Pattern Recognition. M. Dekker New York, 1978.
[108] R. McKelvey, A. McLennan, and T. Turocy. Gambit: Software Tools for Game Theory.TheGambit Project, 2002.
[109] R. Jain, D.M. Chiu, and W. Hawe. A Quantitative Measureof Fairness and Discrimination forResource Allocation in Shared Computer System.Digital Equipment Corp. Eastern ResearchLab, DEC-TR-301, 1984.
[110] L.M. Branscomb and R.D. Klausner. Making the Nation Safer: The Role of Science and Tech-nology in Countering Terrorism.Committee on Science and Technology for Countering Terror-ism, National Research Council, 2002.
140

[111] B.P. Gerkey and M.J. Mataric. Sold!: Auction Methods for Multirobot Coordination. IEEETransactions on Robotics and Automation, 18(5):758–768, 2002.
[112] R. Emery-Montemerlo, G. Gordon, J. Schneider, and S. Thrun. Game Theoretic Control forRobot Teams.Proceedings of the 2005 IEEE International Conference on Robotics and Au-tomation, pages 1163–1169, 2005.
[113] J. Casper and R.R. Murphy. Human–Robot Interactions During the Robot-Assisted UrbanSearch and Rescue Response at the World Trade Center.IEEE Transactions on Systems, Manand Cybernetics, Part B, 33(3):367–385, 2003.
[114] R.R. Murphy. Human–Robot Interaction in Rescue Robotics. IEEE Transactions on Systems,Man, and Cybernetics, Part C, 34(2), 2004.
[115] N. Sato, F. Matsuno, T. Yamasaki, T. Kamegawa, N. Shiroma, and H. Igarashi. CooperativeTask Execution by a Multiple Robot Team and its Operators in Search and Rescue Operations.Proceedings of IEEE/RSJ International Conference on Intelligent Robots and Systems, pages1083–1088, 2004.
[116] Y. Meng, J.V. Nickerson, and J. Gan. Multi–Robot Aggregation Strategies with Limited Com-munication. IEEE/RSJ International Conference on Intelligent Robots and Systems, pages2691–2696, 2006.
[117] A. Solanas and M.A. Garcia. Coordinated Multi-Robot Exploration Through UnsupervisedClustering of Unknown Space.Proceedings of IEEE/RSJ International Conference on Intelli-gent Robots and Systems, 1, 2004.
[118] U. Gupta and N. Ranganathan. An Expected-Utility Based Approach to Variation Aware VLSIOptimization Under Scarce Information.IEEE International Symposium on Low Power Elec-tronics and Design, 2008, to appear.
[119] U. Gupta and N. Ranganathan. A Microeconomic Approachto Multi-Robot Team Formation.Proceedings of the 2007 IEEE/RSJ International Conferenceon Intelligent Robots and Systems,pages 3019–3024, 2007.
141

LIST OF PUBLICATIONS
• Upavan Gupta and Nagarajan Ranganathan, “An Expected-Utility Based Approach to VariationAware VLSI Optimization Under Scarce Information”,IEEE International Symposium on LowPower Electronics and Design (ISLPED’08), 2008 (to appear). (chapter 3)
• Nagarajan Ranganathan, Upavan Gupta, and Venkatraman Mahalingam, “Simultaneous Opti-mization of Total Power, Crosstalk Noise and Delay Under Uncertainty”, ACM Great LakesSymposium on VLSI (GLSVLSI’08), pages 171–176, 2008. (chapter 4)
• Upavan Gupta and Nagarajan Ranganathan, “A Microeconomic Approach to Multi-ObjectiveSpatial Clustering”,IEEE International Conference on Pattern Recognition (ICPR’08), 2008(to appear). (chapters 5, 6)
• Upavan Gupta and Nagarajan Ranganathan, “A Microeconomic Approach to Multi-Robot TeamFormation”,IEEE/RSJ International Conference on Intelligent Robots and Systems (IROS’07),pages 3019–3024, 2007. (chapters 5, 6)
• Upavan Gupta and Nagarajan Ranganathan, “Multievent Crisis Management Using Noncooper-ative Multistep Games”,IEEE Transactions on Computers, 56(5): 577–589, 2007.
• Nagarajan Ranganathan, Upavan Gupta, Rashmi Shetty, and Ashok Murugavel, “An AutomatedDecision Support System Based on Game Theoretic Optimization for Emergency Managementin Urban Environments”,Journal of Homeland Security and Emergency Management, BerkeleyElectronic Press, 4(2), Article 1, 2007.
• Upavan Gupta and Nagarajan Ranganathan, “Social Fairness in Multi-Emergency ResourceManagement”,IEEE International Symposium on Technology and Society, ISTAS‘06, 2006.
• Upavan Gupta and Nagarajan Ranganathan, “FIRM: A Game Theory Based Multi-Crisis Man-agement System for Urban Environments”,Proceedings of the International Conference onSharing Solutions for Emergencies and Hazardous Environments, American Nuclear Society,Salt Lake City, Utah, pages 595–602, 2006.
142

ABOUT THE AUTHOR
Upavan Gupta received the Bachelor of Computer Applications (Honors) degree from the Inter-
national Institute of Professional Studies, Indore, India, in 2002, and the M.S. degree in Computer
Science from the University of South Florida, Tampa, in 2004. He is currently pursuing the Ph.D.
degree in the Department of Computer Science and Engineering, at the University of South Florida.
His research interests include the development of multi-metric optimization methodologies and im-
plementing those in different domains of computer science and engineering. He is a recipient of the
IEEE Computer Society R.E. Merwin Scholarship. He is a student member of the IEEE and the IEEE
Computer Society.


