
US Ski Resort Pricing and Volumes: Downhill RacingJanuary 2018

US Ski resorts have dramatically increased prices. Casual skiers have been particularly
hard hit
2
Vail Resorts Effective Ticket Price
31.2
2000 2001 20172002
32.0
20162014 20152009 20132010 201220112003 2004
34.2
2005 2006 2007 2008
+4.7% +5.6%
48.7
55.8 58.2
41.837.7
48.1
34.1
49.0
39.3
56.0
63.4
46.2 47.2
67.965.6
Effective Ticket Price Excluding Pass Holders vs. Inflation (2008 = 100)
2015
80
2016
160
2011
180
2010 2013
120
2012
100
2017
140
20142008 2009
176
113
Indexed US CPIIndexed Vail Resorts Effective Ticket Price (excl. pass holders)
6.5% CAGR
1.7% CAGR
Ticket prices for casual skiers have increased at 4.5x the rate of inflation
since 2008
Average ticket prices have increased at 2.25x the rate of inflation since 2008 (US CPI = 2.1%)

These price increases have led to very strong financial metrics
3
Vail Resorts Margins and ROIC
2000
0
5
20102004 2016
10
2006 20142001 2003 2005 2007 2009 2011 2013
15
20152002 2008 2012
20
2017
EBIT Margin
ROIC
Source: Bloomberg

And high valuations which assume continued price increases
4
Price / BookFY1 P/E
4.7x
30.7x
21.5x
EV / EBIT EV / EBITDA
15.3x
Vail Resorts Valuation Metrics
Source: Bloomberg
Price increases at 2x+ inflation cannot continue indefinitely. Long term
growth must be volume driven
Implies company can
continue to earn returns c.
4x it’s cost of capital on
incremental investments in
perpetuity

What has enabled this? US Resorts are exploiting a perceived lack of competition (from Vail
Resorts 10-K)
5

But these price increases have come at the cost of significant declines in industry volumes
6
Total Skier Days (NSAA)
52,000
54,000
56,000
58,000
60,000
62,000
0
2012
55,658
20142010 2017
55,949
57,641
2008
55,068
57,156
20092007 2015
52,792
57,09856,491
59,214
56,904
53,578
54,761
56,137
59,227
60,540
54,787
50,966
2016
57,354
60,502
2013
54,28753,710
-0.4%
-1.6%
2011
59,787
Total Skier Days 3 Year Rolling Average
Total Skier Days / 1,000 US Residents
100
0
150
50
200
-1.2%
2017
167195
2012 20162015
193 185
20142013
180 174
-2.2%
192177 176 163
199 191 193
162183
170194189 180
167 168
2010200920082007 2011
187
3 Year Rolling AverageTotal Skier Days / Person Skiing in the US has become significantly less popular despite a major economic
expansion since the end of the crisis and continued population growth
Source: NSAA, Bloomberg

As prices continue to increase, skiers will continue to seek out alternatives
• Other types of vacations (e.g. beach)
• Alternative mountain sports (e.g. backcountry skiing)
• New capacity in US (possible given price umbrella)
• Travel to other geographies (e.g. Europe)
• Regulation (e.g. antitrust regulation preventing further acquisitions)
• Recession
7
Example of a threat to US ski industry seen in following pages – NOT THE ONLY ONE (or even the most likely to
have an impact)
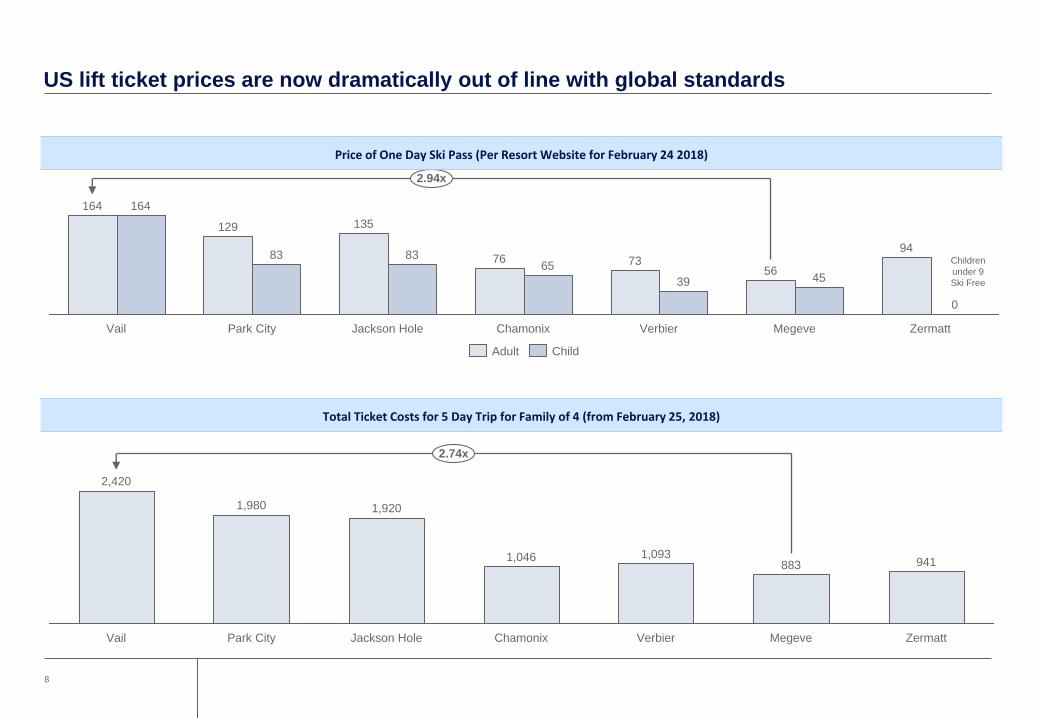
US lift ticket prices are now dramatically out of line with global standards
8
2.94x
Vail
129
83
164
Park City Jackson Hole
135
164
Chamonix
83
MegeveVerbier
65
39 45
73
0
Zermatt
7656
94
Adult Child
Price of One Day Ski Pass (Per Resort Website for February 24 2018)
Total Ticket Costs for 5 Day Trip for Family of 4 (from February 25, 2018)
1,920
Jackson HoleVail
1,980
2,420
Park City
2.74x
1,046 1,093883 941
Chamonix Verbier ZermattMegeve
Children
under 9
Ski Free
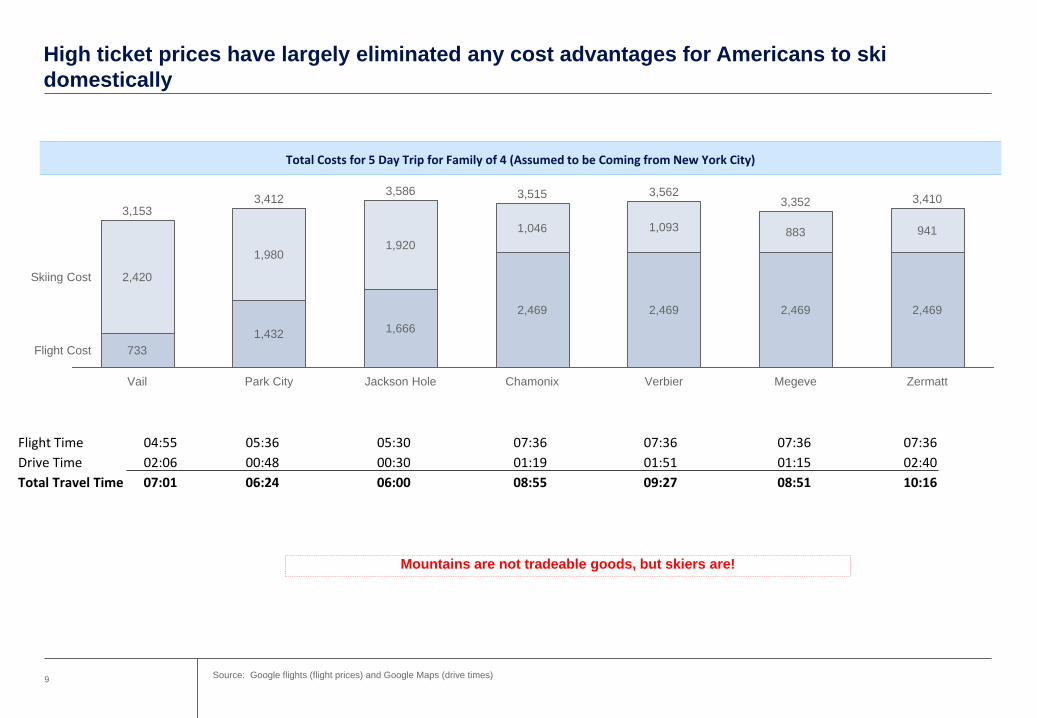
High ticket prices have largely eliminated any cost advantages for Americans to ski
domestically
9
Total Costs for 5 Day Trip for Family of 4 (Assumed to be Coming from New York City)
3,562
VerbierChamonix
3,410
Megeve Zermatt
3,352
1,666
1,920
2,469
1,093
2,469
1,046
2,469
883
1,980
941
1,432
2,469
733
2,420Skiing Cost
Flight Cost
Park City
3,4123,586
Vail
3,153
3,515
Jackson Hole
Flight Time 04:55 05:36 05:30 07:36 07:36 07:36 07:36
Drive Time 02:06 00:48 00:30 01:19 01:51 01:15 02:40
Total Travel Time 07:01 06:24 06:00 08:55 09:27 08:51 10:16
Mountains are not tradeable goods, but skiers are!
Source: Google flights (flight prices) and Google Maps (drive times)

Are US Resorts a “Luxury Product”?
Europe has a superior product to the US along the most utilized quantitative metrics
10
Comparison of US vs. European Resort Size (KM of Trails)
1.7x
Megeve
412
140
360
Zermatt
445
Km of Trails
VerbierChamonixVail Park City
234 265
Comparison of US vs. European Resort Size (Skiable Acres)
Verbier
Skiable Acres
3.6x
Vail Jackson Hole
2,500
ChamonixPark City
5,289
26,000
7,300
15,000
Vertical Drop
3,1003,450
Vail
4,139
Park City
6,922
Jackson Hole
1.7x
Vertical Drop
3,835
6,837
Chamonix Verbier
5,580
Megeve Zermatt
Source: Resort websites, Wikipedia, OnTheSnow, Snow-Forecast.com

Are US Resorts a “Luxury Product”?
European amenities are generally superior to those in the US
11
US Ski Lunch (Granite Grill, Jackson Hole) Zermatt Ski Lunch (Chez Vrony)
Not a “luxury product”
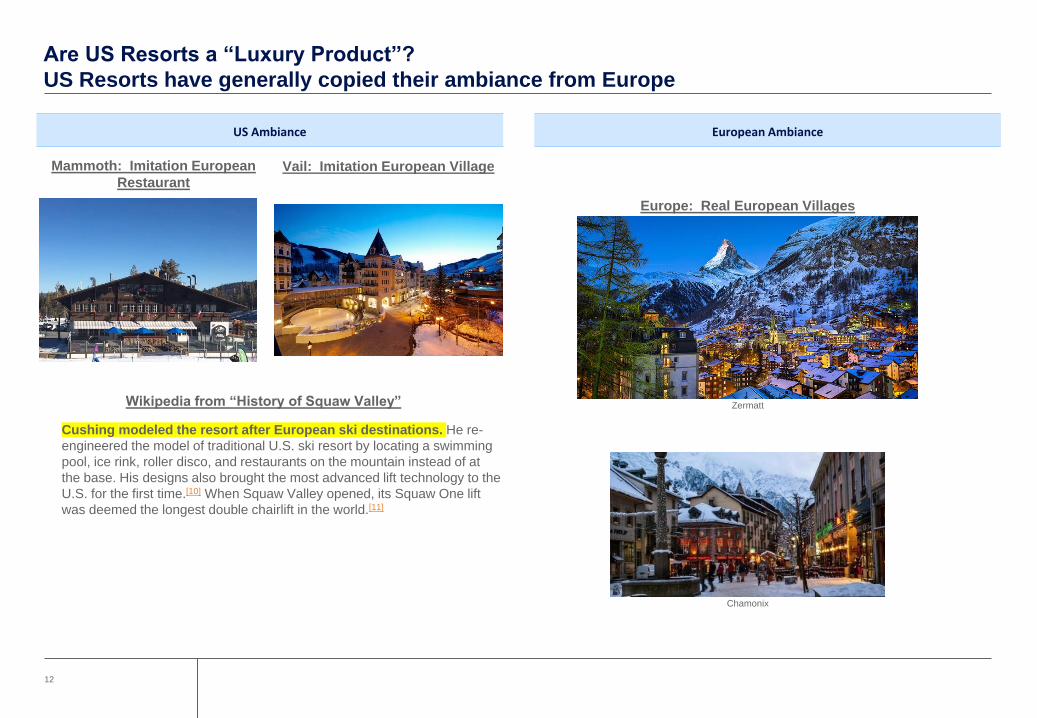
Are US Resorts a “Luxury Product”?
US Resorts have generally copied their ambiance from Europe
12
Mammoth: Imitation European
RestaurantVail: Imitation European Village
Europe: Real European Villages
Zermatt
Chamonix
Cushing modeled the resort after European ski destinations. He re-
engineered the model of traditional U.S. ski resort by locating a swimming
pool, ice rink, roller disco, and restaurants on the mountain instead of at
the base. His designs also brought the most advanced lift technology to the
U.S. for the first time.[10] When Squaw Valley opened, its Squaw One lift
was deemed the longest double chairlift in the world.[11]
Wikipedia from “History of Squaw Valley”
US Ambiance European Ambiance

Are US Resorts a “Luxury Product”?
European and US après ski scenes are not comparable
13
European Apres Ski (La Follie Douce, Megeve) American Après Ski


