Download - U.S. Shale Reserves and Production
Tinker, 2013
Bureau of Economic Geology Jackson School of Geosciences, The University of Texas at Austin
IOGCC Nov, 2013
U.S. Shale
Reserves and Production
Scott W. Tinker
John Browning, Svetlana Ikonnikova , William Fisher, Qilong Fu,
Gürcan Gülen, Susan Horvath, Frank Male, Ken Medlock, Tad Patzek, Eric Potter, Forrest Roberts, and Katie Smye

Tinker, 2013
The Role of Shale
Reserves and Production Forecasting
Implications and Considerations
Outline

Tinker, 2013
U.S. Energy Mix (%)
QAd8174
Source: EIA, 2012
Oil
Natural gas
Coal
Nuclear energy
Hydro electricity
Renewables

Tinker, 2013
U.S. Energy Mix (%)
QAd8174
Source: EIA, 2012
Oil
Natural gas
Coal
Nuclear energy
Hydro electricity
Renewables
Oil
Natural gas
Coal
Nuclear energy
Hydro electricity
Renewables
Tinker, 2013
Th
ou
sa
nd
ba
rre
ls/y
ear
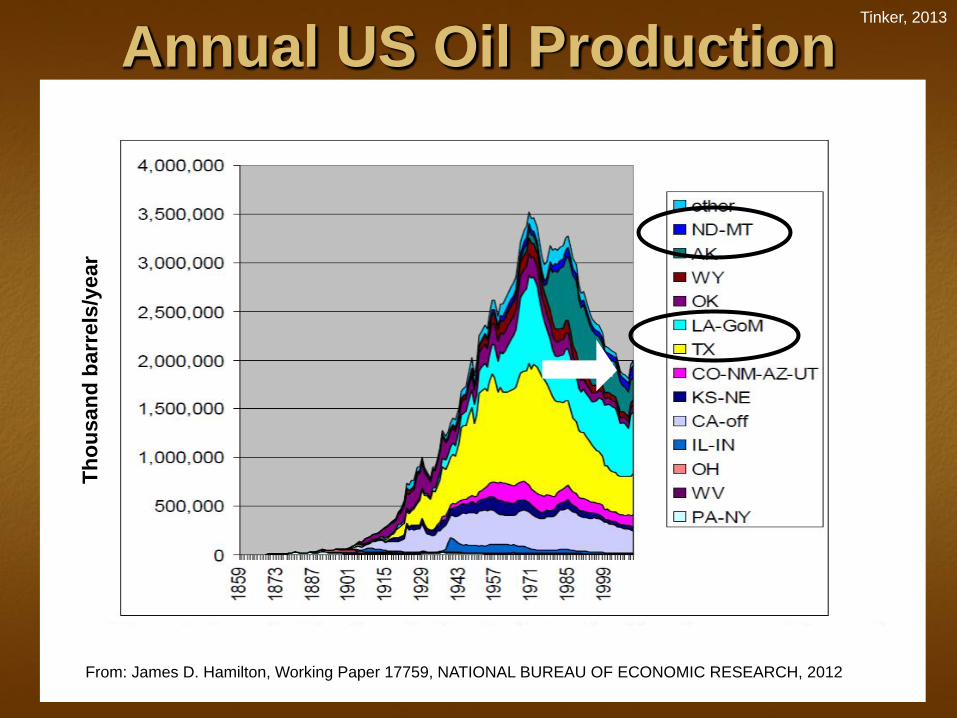
From: James D. Hamilton, Working Paper 17759, NATIONAL BUREAU OF ECONOMIC RESEARCH, 2012
Annual US Oil Production Annual US Oil Production

Tinker, 2013
Long-Term Oil Supply Resources and Cost
0 2000 4000 10,000 6000 8000
140
20
0
Resources (billion barrels)
Pro
du
cti
on
co
st
(2
00
8 $
)
MB
/d
Coal
to
liquids
Gas
to
liquids
Oil shales
Shale oil
Pro-
duced MENA
Other conventional
oil
Deepwater and
ultra-deepwater
40
60
80
100
120
Heavy
oil
&
bitumen
EOR
Arctic
CO2 EOR
140
100
120
Source: IEA World Energy Outlook (2009)
2X
Tinker, 2013
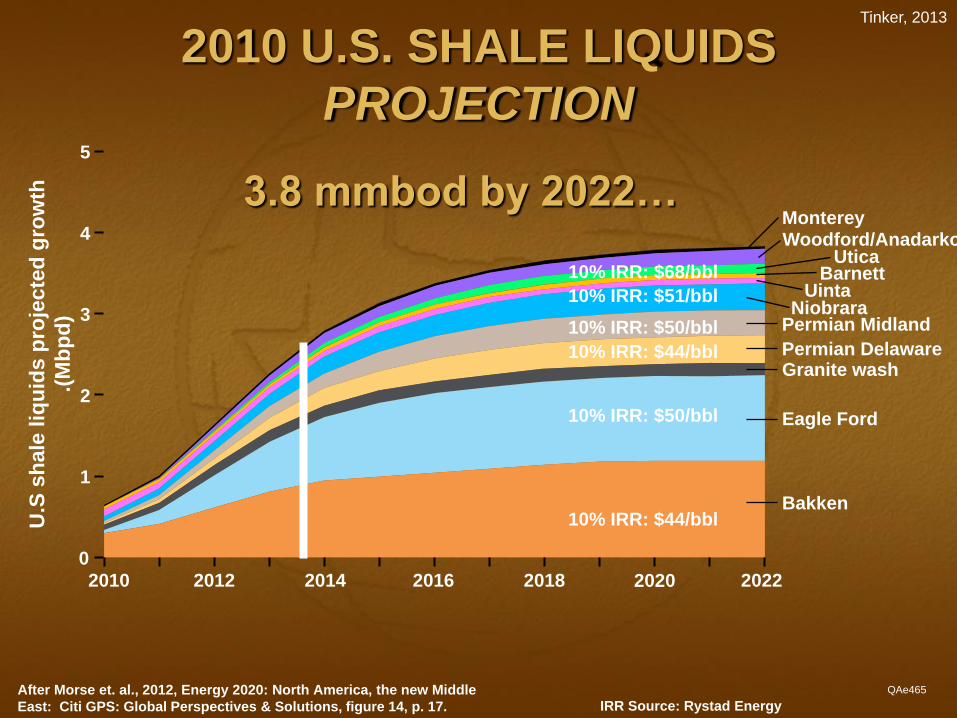
Monterey Woodford/Anadarko
Utica Barnett
Uinta Niobrara
Permian Midland
Permian Delaware Granite wash
Eagle Ford
Bakken
2010 U.S. SHALE LIQUIDS
PROJECTION 5
4
3
2
1
0
2010
U.S
sh
ale
liq
uid
s p
roje
cte
d g
row
th
.(M
bp
d)
2012 2014 2016 2018 2022 2020
After Morse et. al., 2012, Energy 2020: North America, the new Middle
East: Citi GPS: Global Perspectives & Solutions, figure 14, p. 17.
QAe465
3.8 mmbod by 2022…
10% IRR: $44/bbl
10% IRR: $50/bbl
10% IRR: $68/bbl
10% IRR: $44/bbl
10% IRR: $50/bbl
10% IRR: $51/bbl
IRR Source: Rystad Energy

Tinker, 2012
US Shale and Tight Oil Production
QAe2254
0.0
2.0
2.5
2007 2009
Year
2011 2013
1.5
1.0
Milli
on
ba
rre
ls p
er
da
y
0.5
Source: U.S. Energy Information Administration
Bonespring (TX Permian)
B a kk en ( ND )
E a g l e F o r d ( T X )
Granite Wash (OK and TX)
Wolfcamp (TX Permian)
Monterey (CA)
Niobrara-Codell (CO)
Sprayberry (TX Permian)
Austin Chalk (LA and TX)
Woodford (OK)
Right on Pace…

Tinker, 2013
Annual US Oil Production
From: James D. Hamilton, Working Paper 17759, NATIONAL BUREAU OF ECONOMIC RESEARCH, 2012
1.4 Bby
shale oil
by 2022
Th
ou
sa
nd
ba
rre
ls/y
ear

Tinker, 2013
Natural Gas Supply
Resources and Cost
QAe980
Source: IEA World Energy Outlook (2009)
0 100 200 400 300 500 1,000 1,100 600 700 800 900
Resources (trillion cubic meters)
Pro
du
cti
on
co
st
(200
8 $
/Mb
tu)
LNG
Sour
Arc
tic
De
ep
Wa
ter
Shale C
oa
l B
ed
M
eth
an
e
Pro
du
ce
d
Co
nv
en
tio
na
l
Tight
15
10
5
0
4X
Tinker, 2013
5
10
15
20
25
30
Mark
ete
d P
rod
ucti
on
(Tcf)
0 0
50
100
150
200
250
300
Pro
ved
Reserv
es (T
cf)
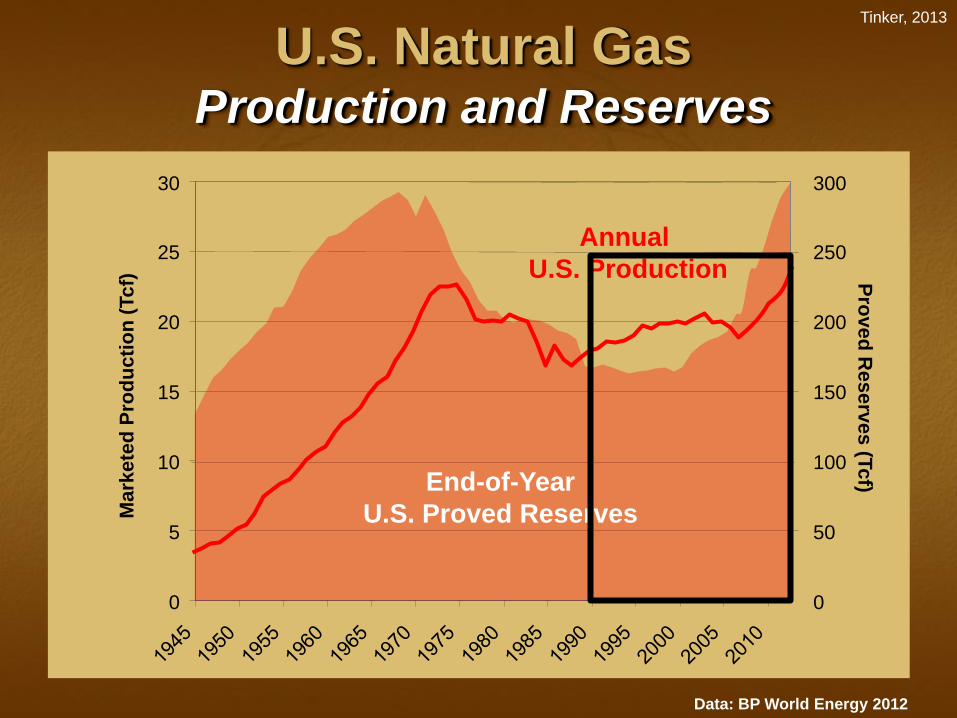
U.S. Natural Gas Production and Reserves
Data: BP World Energy 2012
End-of-Year
U.S. Proved Reserves
Annual
U.S. Production

Tinker, 2013
U.S. Natural Gas Production (TcF)
http://www.eia.gov/energy_in_brief/about_shale_gas.cfm
0
5
10
15
20
25
1990 1995 2000 2005 2010
Shale gas
Coalbed methane
Tight gas
Non-associated offshore Alaska
Associated with oil
Non-associated onshore
14 TcF
9 TcF
23 TcF

Tinker, 2013
U.S. Natural Gas Production (TcF)
http://www.eia.gov/energy_in_brief/about_shale_gas.cfm
0
5
10
15
20
25
1990 1995 2000 2005 2010
Shale gas
Coalbed methane
Tight gas
Non-associated offshore Alaska
Associated with oil
Non-associated onshore
14 TcF
9 TcF
23 TcF Conventional Gas
Total Natural Gas
From a 2004 Tinker Talk to the IPAA US Natural Gas 2004 forecast
Unconventional Gas
1949 1955 1961 1967 1973 1979 1985 1991 1997 2003 2009 2015
0
5,000
10,000
15,000
20,000
25,000
An
nu
al
Na
tura
l G
as P
rod
ucti
on
(B
cf)
EIA (1949-1990) and NPC (1991-2015)
15 TcF
10 TcF
25 TcF
An Anticipated Evolution

Tinker, 2013
0
30
35
2007 2009 Year
2011 2013
25
20
Billio
n c
ub
ic f
eet
per
day
10
5
15
Woodford (OK)
Bakken (ND) Eagle Ford (TX)
Rest of US
Fayetteville (AR)
Haynesville (LA and TX)
Barnett (TX) Antrim (MI, IM, and OH)
Marcellus (PA and WV)
10
TcF
/Year
5
2013 Dry Shale Gas Production
QAe2255 Source: U.S. Energy Information Administration

Tinker, 2013
2013 Dry Shale Gas Production
QAe2255 Source: U.S. Energy Information Administration
Model: Rice University, Medlock, 2012
Actual

Tinker, 2013
2013 Dry Shale Gas Production
2010 forecast is low to actual. Why?
In spite of continued popular prognostications
about the poor economics of shale, the reality is
that parts of several basins are economic, and
technology and price allow for continued drilling
and production.
Rigorous, integrated, bottom-up geologic,
engineering and economic studies provide a
realistic look at the future.
Tinker, 2013
The Role of Shale
Reserves and Production Forecasting
Implications and Considerations
Outline

Tinker, 2013
Reserves and Production
Forecasting
3-year project, funded by the Alfred P. Sloan Foundation
Multidisciplinary team of geoscientists, engineers, and economists.
Four plays: Barnett, Fayetteville, Haynesville, Marcellus
Rapidly developing, some mature, others just starting
Uncertainties about well performance and drivers
Low price environment
Bureau of Economic Geology Program
Goal: Contribute to the objective understanding of
the capability of U.S. shale gas to contribute to
natural gas supply for the next 20 years

Tinker, 2013
Framing Questions
What is the resource base in place?
What portion of that resource is recoverable?
What pace of drilling activity will be necessary to sustain production at various levels?
How achievable is this activity level, given advances in technology and prices?
What impact will these levels of production have on infrastructure, roads, water, regulation, jobs, taxes…

Tinker, 2013
U.S. Shale Gas Plays

Tinker, 2013
Orange dots are 20 nm in diameter
T.P. Sims #2; 7625’
200 nm
0.2 m
After Reed, BEG
Barnett Shale
Nanopores in Organics

Tinker, 2013
Ikonnikova S., et al. 2013. SPE Res. Eval & Eng (resubmitted)
Tinker, 2013
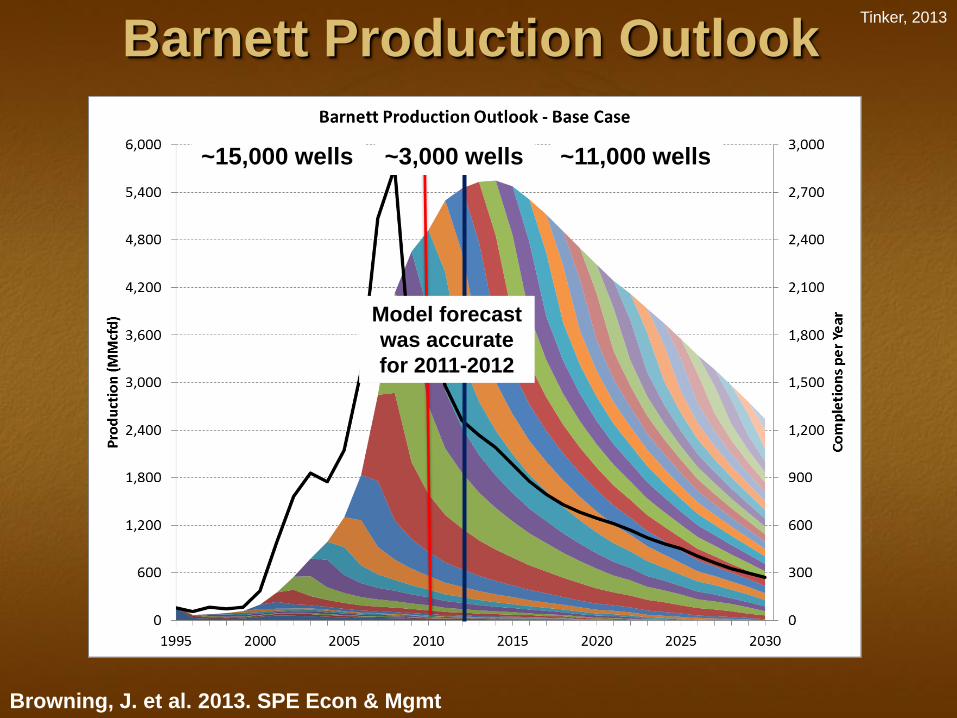
Barnett Production Outlook
Model forecast
was accurate
for 2011-2012
~15,000 wells ~11,000 wells ~3,000 wells
Browning, J. et al. 2013. SPE Econ & Mgmt
Tinker, 2013
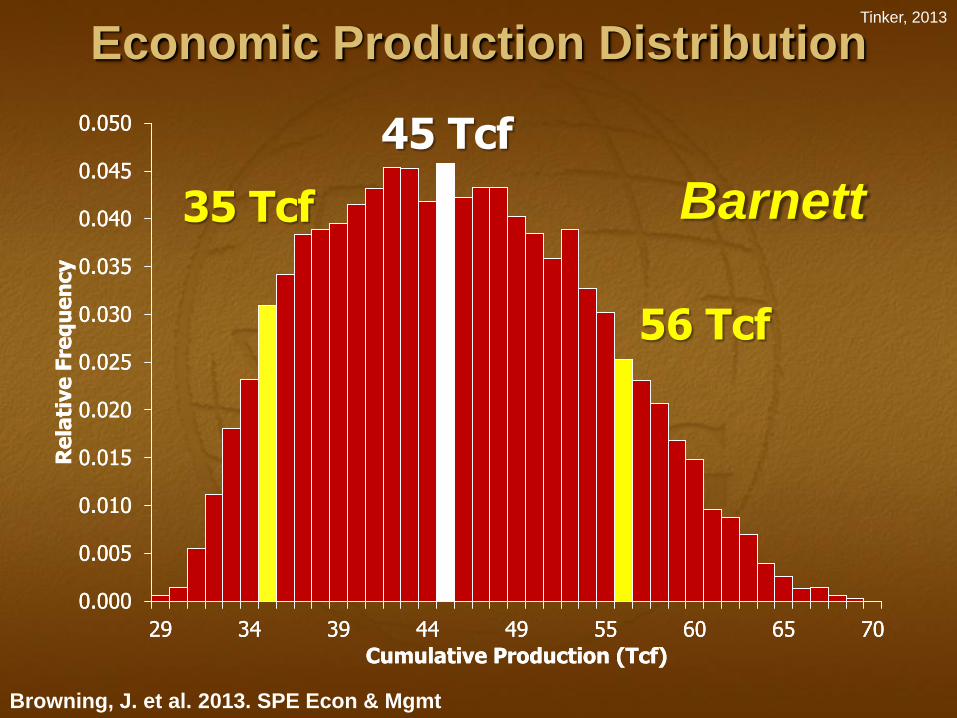
Economic Production Distribution
0.000
0.005
0.010
0.015
0.020
0.025
0.030
0.035
0.040
0.045
0.050
29 34 39 44 49 55 60 65 70
Re
lati
ve
Fre
qu
en
cy
Cumulative Production (Tcf)
Barnett
0.000
0.005
0.010
0.015
0.020
0.025
0.030
0.035
0.040
0.045
0.050
29 34 39 44 49 55 60 65 70
Re
lati
ve
Fre
qu
en
cy
Cumulative Production (Tcf)
35 Tcf
56 Tcf
45 Tcf
Browning, J. et al. 2013. SPE Econ & Mgmt

Tinker, 2013
The Role of Shale
Reserves and Production Forecasting
Implications and Considerations
Outline
Tinker, 2013
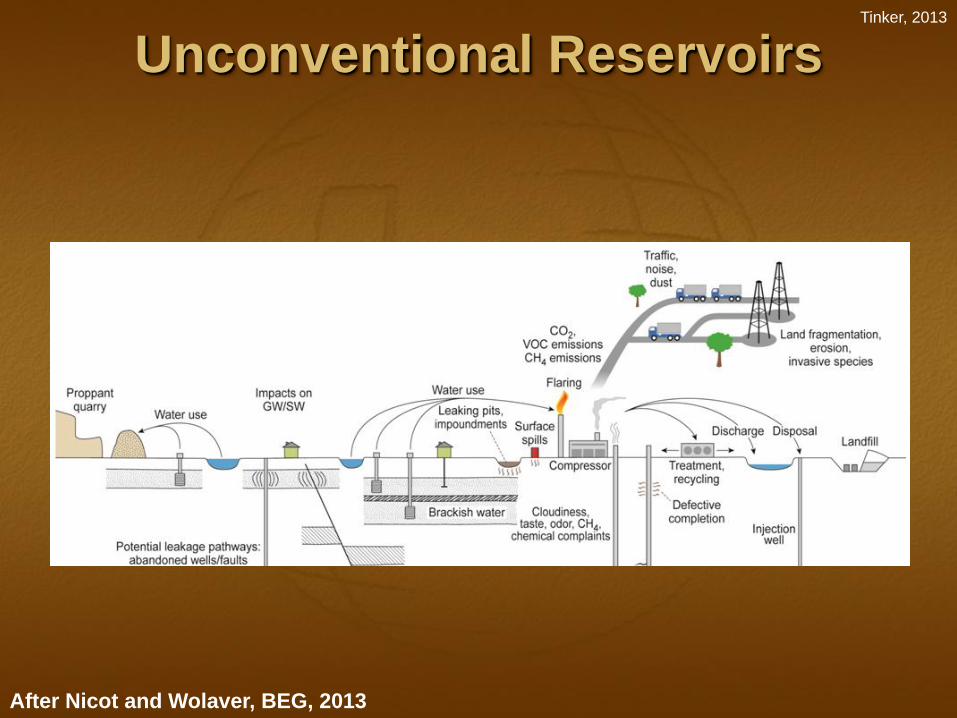
After Nicot and Wolaver, BEG, 2013
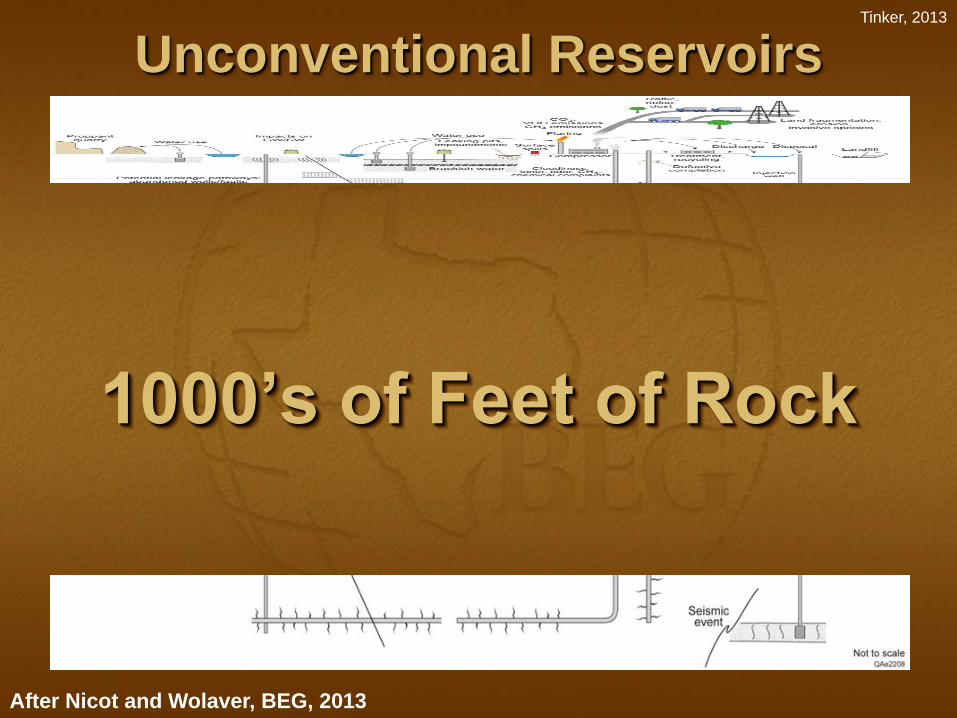
Unconventional Reservoirs
Tinker, 2013
After Nicot and Wolaver, BEG, 2013
Unconventional Reservoirs
1000’s of Feet of Rock

Tinker, 2013
Unconventional Reservoirs

Tinker, 2013
Emissions Considerations
Infrared cameras and Organic/Toxic Vapor Analyzer to detect leaks
Electric or CNG motors
“Green completions”
Well pad location to account for wind
Capture gas and limit flaring/venting
After Nicot and Wolaver, BEG, 2013
Tinker, 2013
Water Considerations
Harvest rain water (impoundments)
Re-use and recycle brackish, flowback and formation water
Chemicals that perform with high TDS
Biodegradable chemicals
“Dry” fracturing
After Nicot and Wolaver, BEG, 2013
Tinker, 2013
Surface Considerations
Location selection
Noise control/sound barriers
Mobile water tanks and centralized impoundments instead of pits
Use of waste heat/stranded natural gas
Well pad footprint
Re-vegetate pad to limit erosion
Multi-well pads After Nicot and Wolaver, BEG, 2013

Tinker, 2013
Subsurface Considerations
Cement all gas producing zones
Subsurface characterization for disposal
Disclosure of all chemicals
Baseline data ahead of drilling Thermal
Chemical
Conductive
Hydro
Seismic
After Nicot and Wolaver, BEG, 2013
Tinker, 2013 Unconventional Summary
“Trade Offs”
Environmental Risks and Impacts Traffic/noise/light
Surface
Groundwater
Quakes
Local and atmospheric emissions
Energy Security and Economic Benefits Available
Affordable
Reliable
Atmospheric emissions
Jobs and Taxes
These are not mutually exclusive!
Tinker, 2013
• Balance of Trade
Exports: Natural gas, liquids, products
Imports: Oil
• Regulation and Planning
Infrastructure
Resources
Permitting
• Emissions
• Energy Security
Unconventional Reservoirs Implications


