Download - U.S. homeownership rate and trends (Q1 2015)

U.S. homeownership rate declines to
63.7 percent, a 20-year low Residential vacancies and homeownership Q1 2015
1.
2.
3.
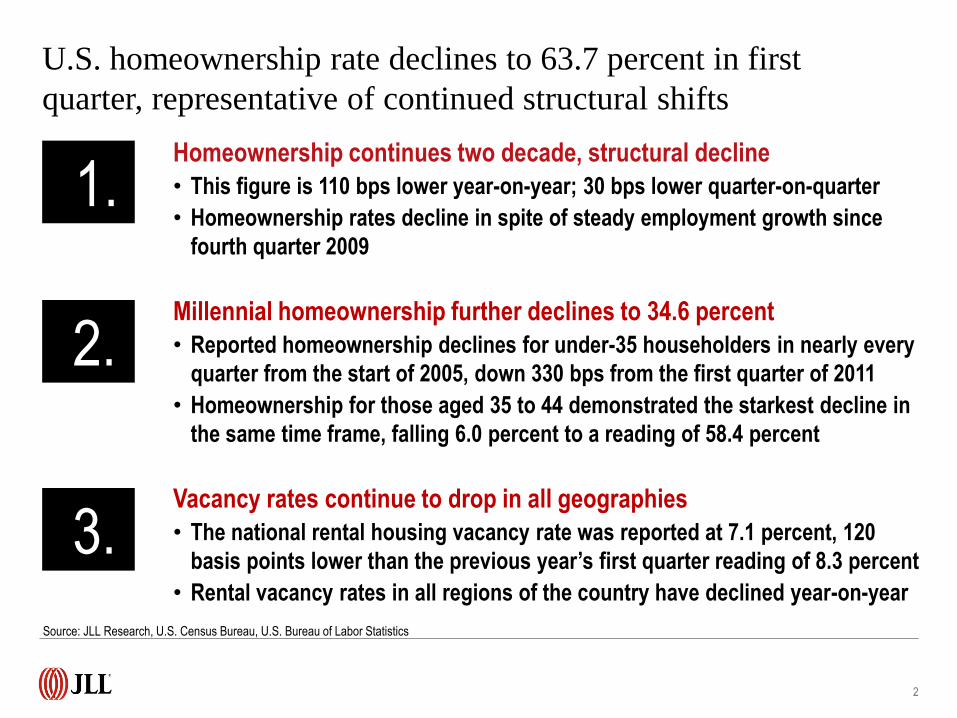
Homeownership continues two decade, structural decline
• This figure is 110 bps lower year-on-year; 30 bps lower quarter-on-quarter
• Homeownership rates decline in spite of steady employment growth since
fourth quarter 2009
Millennial homeownership further declines to 34.6 percent
• Reported homeownership declines for under-35 householders in nearly every
quarter from the start of 2005, down 330 bps from the first quarter of 2011
• Homeownership for those aged 35 to 44 demonstrated the starkest decline in
the same time frame, falling 6.0 percent to a reading of 58.4 percent
Vacancy rates continue to drop in all geographies
• The national rental housing vacancy rate was reported at 7.1 percent, 120
basis points lower than the previous year’s first quarter reading of 8.3 percent
• Rental vacancy rates in all regions of the country have declined year-on-year
U.S. homeownership rate declines to 63.7 percent in first
quarter, representative of continued structural shifts
Source: JLL Research, U.S. Census Bureau, U.S. Bureau of Labor Statistics
2
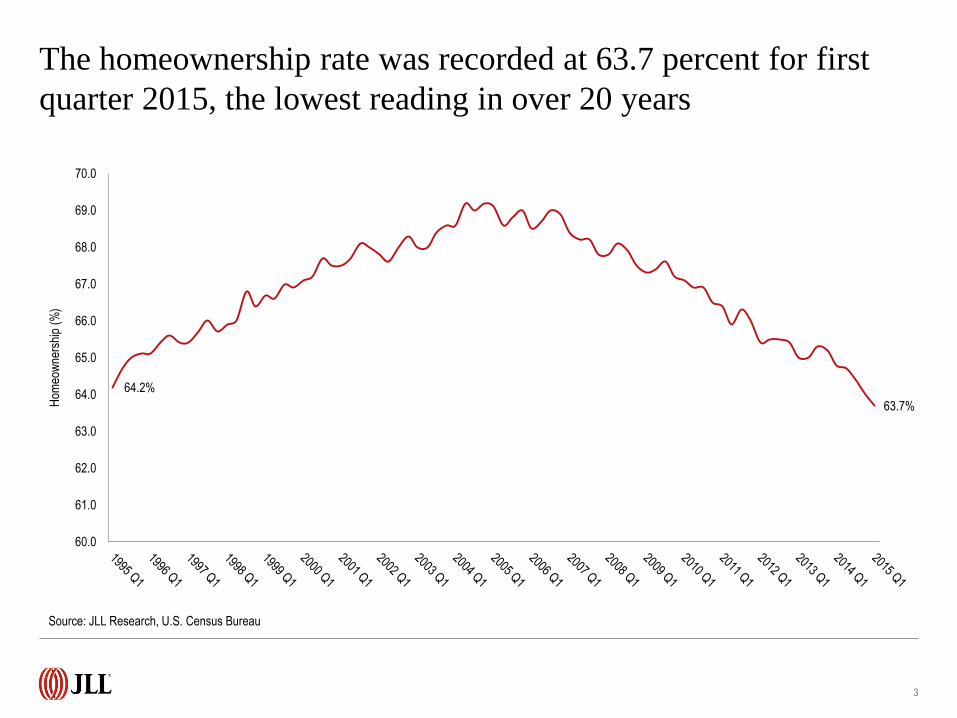
The homeownership rate was recorded at 63.7 percent for first
quarter 2015, the lowest reading in over 20 years
3
Source: JLL Research, U.S. Census Bureau
64.2%
63.7%
60.0
61.0
62.0
63.0
64.0
65.0
66.0
67.0
68.0
69.0
70.0
Hom
eow
ners
hip
(%)

… And this shift is happening across geographies
4
Homeownership declines in excess of 1.0 percent year-over-year in Northeast, Midwest and South
Source: JLL Research, U.S. Census Bureau
55.0
57.0
59.0
61.0
63.0
65.0
67.0
69.0
71.0
73.0
75.0
Hom
eow
ners
hip
(%)
U.S. Northeast Midwest South West
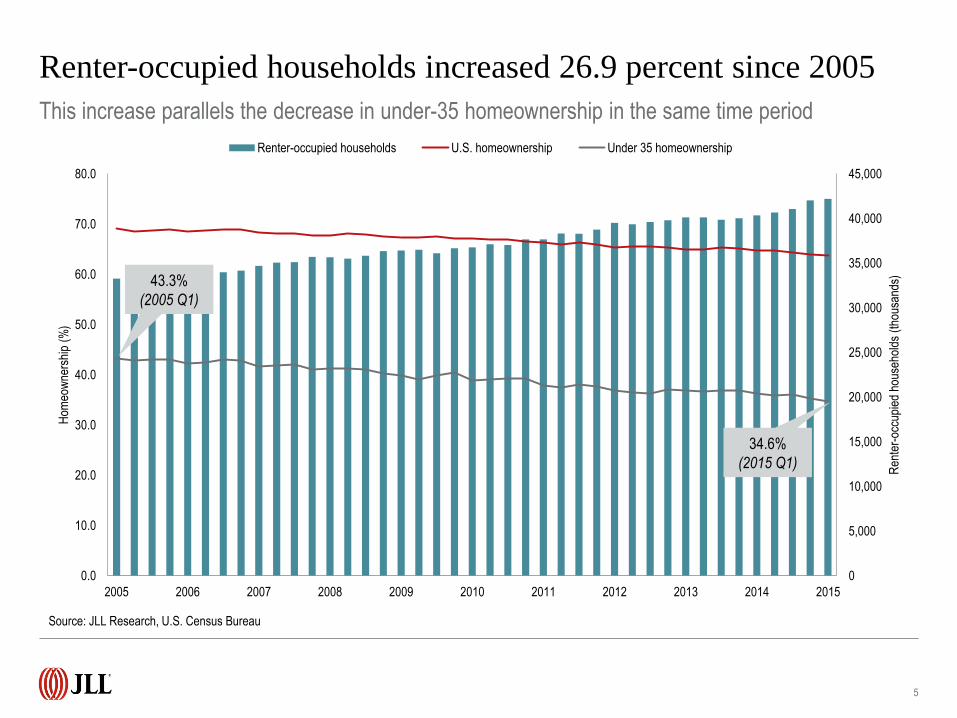
Renter-occupied households increased 26.9 percent since 2005
5
This increase parallels the decrease in under-35 homeownership in the same time period
Source: JLL Research, U.S. Census Bureau
0
5,000
10,000
15,000
20,000
25,000
30,000
35,000
40,000
45,000
0.0
10.0
20.0
30.0
40.0
50.0
60.0
70.0
80.0
2005 2006 2007 2008 2009 2010 2011 2012 2013 2014 2015
Ren
ter-
occu
pied
hou
seho
lds
(tho
usan
ds)
Hom
eow
ners
hip
(%)
Renter-occupied households U.S. homeownership Under 35 homeownership
43.3%
(2005 Q1)
34.6%
(2015 Q1)
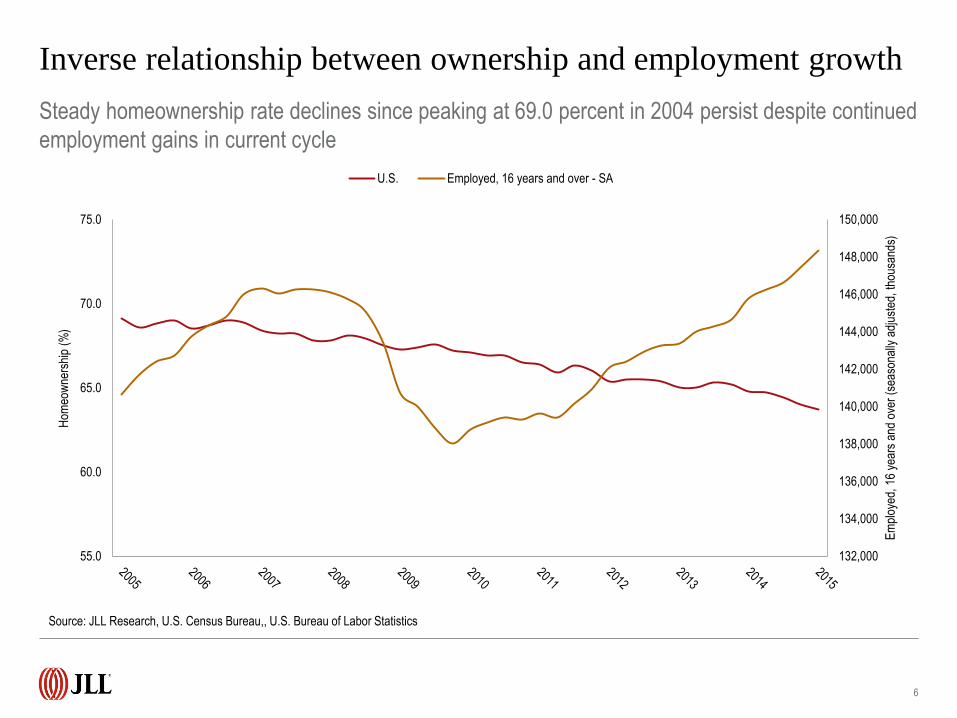
Inverse relationship between ownership and employment growth
6
Steady homeownership rate declines since peaking at 69.0 percent in 2004 persist despite continued
employment gains in current cycle
Source: JLL Research, U.S. Census Bureau,, U.S. Bureau of Labor Statistics
132,000
134,000
136,000
138,000
140,000
142,000
144,000
146,000
148,000
150,000
55.0
60.0
65.0
70.0
75.0
Em
ploy
ed,
16 y
ears
and
ove
r (s
easo
nally
adj
uste
d, th
ousa
nds)
Hom
eow
ners
hip
(%)
U.S. Employed, 16 years and over - SA

Cities outpacing suburbs in rate of homeownership declines
7
The share of U.S. homebuyers making their first purchase dropped in 2014 to the lowest level in
three decades
Source: JLL Research, U.S. Census Bureau, National Association of Realtors (NAR)
Percent Change,
2005 - 2015
-7.8% U.S.
-8.5% Cities
-8.1% Suburbs
69.1 67.1
63.7
54.1 52.6 49.5
76.9 74.2
70.7
0.0
10.0
20.0
30.0
40.0
50.0
60.0
70.0
80.0
90.0
Hom
e ow
ners
hip
(%)
U.S. Cities Suburbs

Homeownership rates slide across all age cohorts
8
Pronounced declines of over 7.0 percent nationally over a decade, as well as throughout age
cohorts—notably from the millennial and gen x segment
Source: JLL Research, U.S. Census Bureau
-7.2
-18.1
-15.6
-8.1
-6.0
-1.4
-20.0
-18.0
-16.0
-14.0
-12.0
-10.0
-8.0
-6.0
-4.0
-2.0
0.0
U.S. Under 35 years 35 to 44 years 45 to 54 years 55 to 64 years 65 years and over
Dec
line
in h
omeo
wne
rshi
p 20
05 -
201
4 (%
)
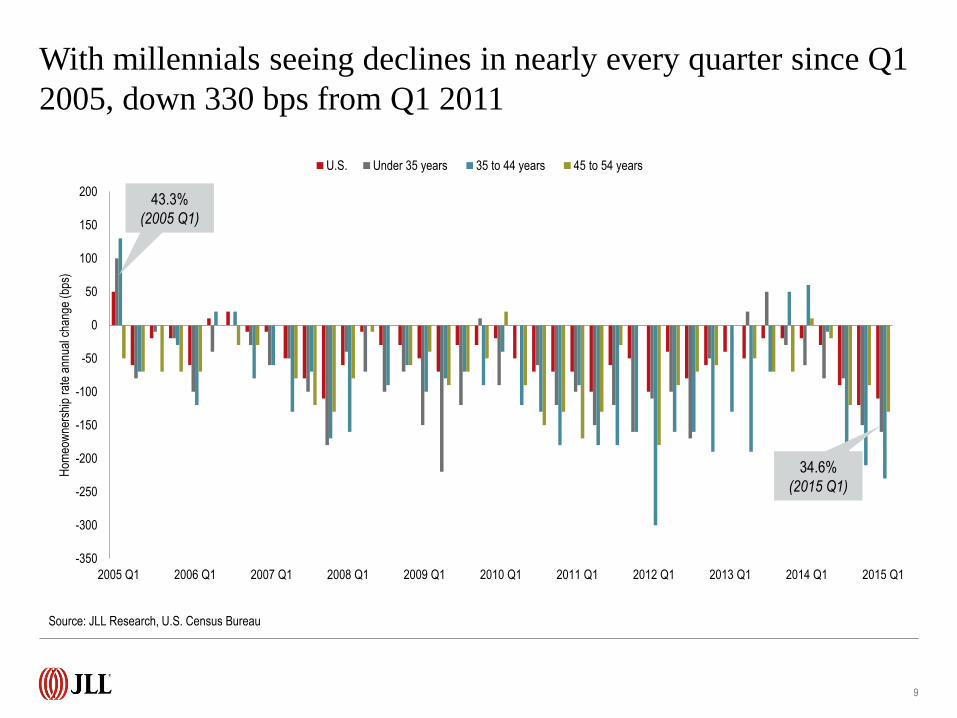
With millennials seeing declines in nearly every quarter since Q1
2005, down 330 bps from Q1 2011
9
-350
-300
-250
-200
-150
-100
-50
0
50
100
150
200
2005 Q1 2006 Q1 2007 Q1 2008 Q1 2009 Q1 2010 Q1 2011 Q1 2012 Q1 2013 Q1 2014 Q1 2015 Q1
Hom
eow
ners
hip
rate
ann
ual c
hang
e (b
ps)
U.S. Under 35 years 35 to 44 years 45 to 54 years
43.3%
(2005 Q1)
34.6%
(2015 Q1)
Source: JLL Research, U.S. Census Bureau

… And these declines continued this quarter
10
Millennial homeownership declined 2.0 percent in the first quarter alone, a rate exceeding the U.S.
average by a multiple of four
Source: JLL Research, U.S. Census Bureau, Urban Land Institute
-0.5
-2.0
-0.7
-0.6
0.0
-0.6
-2.5
-2.0
-1.5
-1.0
-0.5
0.0
U.S. Under 35 years 35 to 44 years 45 to 54 years 55 to 64 years 65 years and over
Dec
line
in h
omeo
wne
rshi
p, Q
-o-Q
(%
)
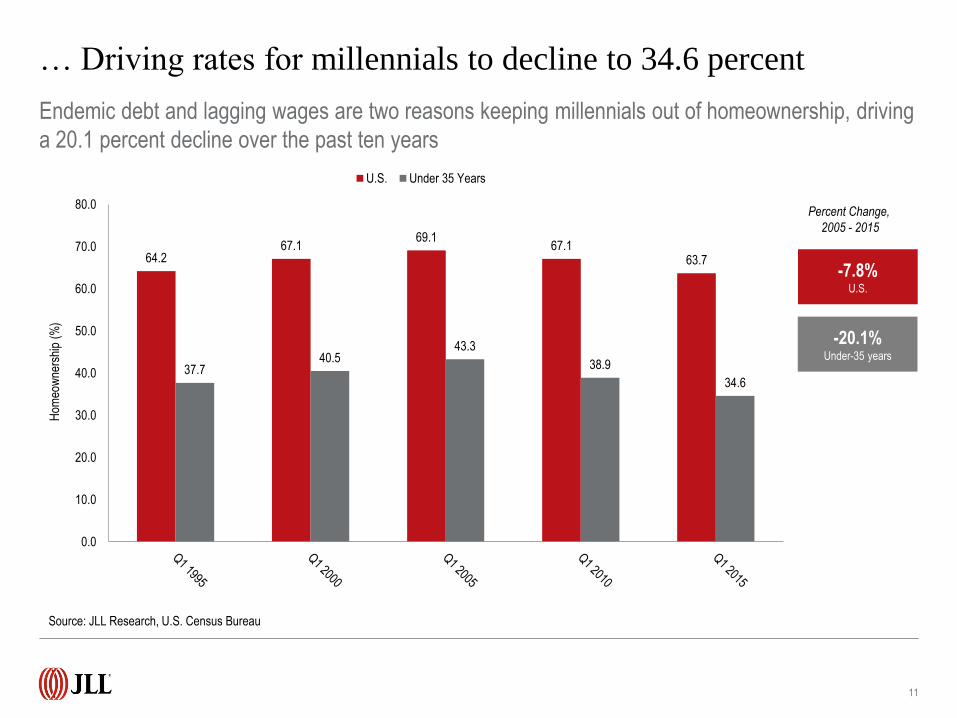
… Driving rates for millennials to decline to 34.6 percent
11
Endemic debt and lagging wages are two reasons keeping millennials out of homeownership, driving
a 20.1 percent decline over the past ten years
Source: JLL Research, U.S. Census Bureau
64.2 67.1
69.1 67.1
63.7
37.7 40.5
43.3
38.9
34.6
0.0
10.0
20.0
30.0
40.0
50.0
60.0
70.0
80.0
Hom
eow
ners
hip
(%)
U.S. Under 35 Years
-7.8% U.S.
-20.1% Under-35 years
Percent Change,
2005 - 2015
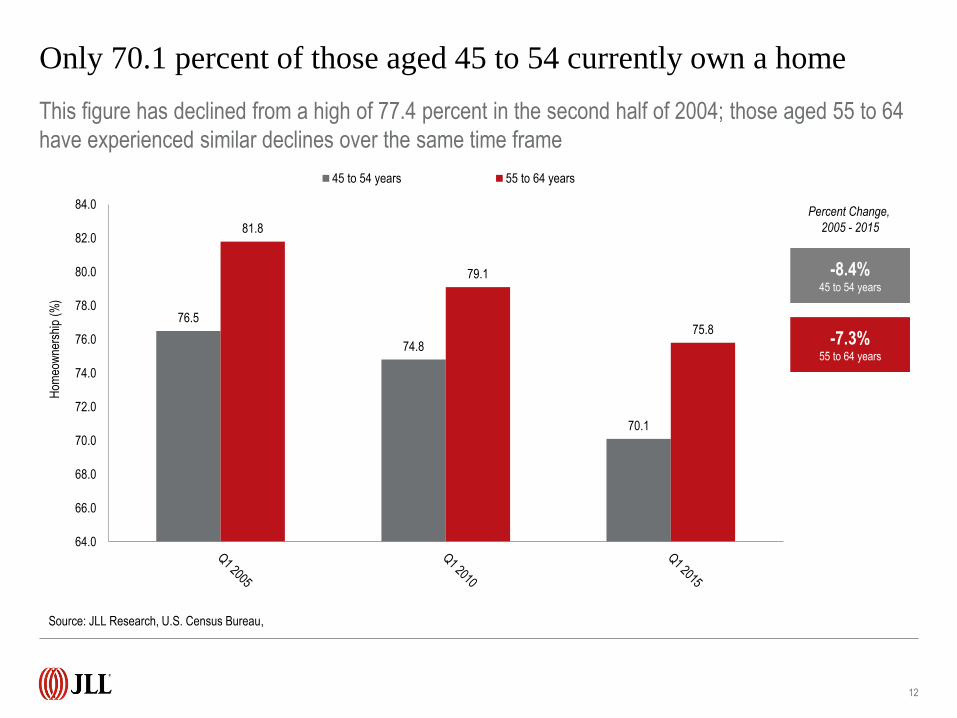
Only 70.1 percent of those aged 45 to 54 currently own a home
12
This figure has declined from a high of 77.4 percent in the second half of 2004; those aged 55 to 64
have experienced similar declines over the same time frame
Source: JLL Research, U.S. Census Bureau,
76.5
74.8
70.1
81.8
79.1
75.8
64.0
66.0
68.0
70.0
72.0
74.0
76.0
78.0
80.0
82.0
84.0
Hom
eow
ners
hip
(%)
45 to 54 years 55 to 64 years
-7.3% 55 to 64 years
-8.4% 45 to 54 years
Percent Change,
2005 - 2015

Those below median family income now below 50.0 percent
13
Those with means actively choosing mobility and freedom, whereas those with comparatively less are unable to
grow wealth through the traditional means of homeownership and thus renting
Source: JLL Research, U.S. Census Bureau
-5.1% U.S.
-4.4% Above or equal to
median family income
67.1 66.4 65.4 65.0 64.8
63.7
82.0 81.5 80.3 80.0 79.8
78.4
52.2 51.4
50.4 50.0 49.8 48.9
48.0
53.0
58.0
63.0
68.0
73.0
78.0
83.0
Hom
eow
ners
hip
(%)
U.S. Above or equal Below
-6.3% Below median
family income
Percent Change,
2010 - 2015

U.S. vacancy rates reported at 7.1 percent for rental housing
14
Year-on-year vacancies in metros are declining at the fastest rate–14.8 percent
Source: JLL Research, U.S. Census Bureau
0.0
2.0
4.0
6.0
8.0
10.0
12.0
Ren
tal v
acan
cy (
%)
U.S. Metros Cities

Tightening vacancies across regions led by Northeast, Midwest
15
Rental vacancies have declined in each region by at least 70 bps compared to rates from Q1 2014
Source: JLL Research, U.S. Census Bureau
4.0
6.0
8.0
10.0
12.0
14.0
16.0
Ren
tal v
acan
cy (
%)
U.S. Northeast Midwest South West

COPYRIGHT © JONES LANG LASALLE IP, INC. 2015
For more information, please contact:
Sean Coghlan
Director
Investor Research
+1 215 988 5556
Mike Morrone
Research Analyst, Multifamily
Investor Research
+1 312 228 2304
Or, find more multifamily real estate research at jll.com.
>>> Click here to check it out.


