
Uranium Investigation in an Alluvial Aquifer with DP Methods
Wes McCall, PG
Tom Christy, PE
Geoprobe Systems
Tom Christopherson, Prgrm. Mgr. Well Stds.
Howard Isaacs, Prgrm. Mgr. Mon. & Compliance
Nebraska, DHHS
HPT logging at Clarks
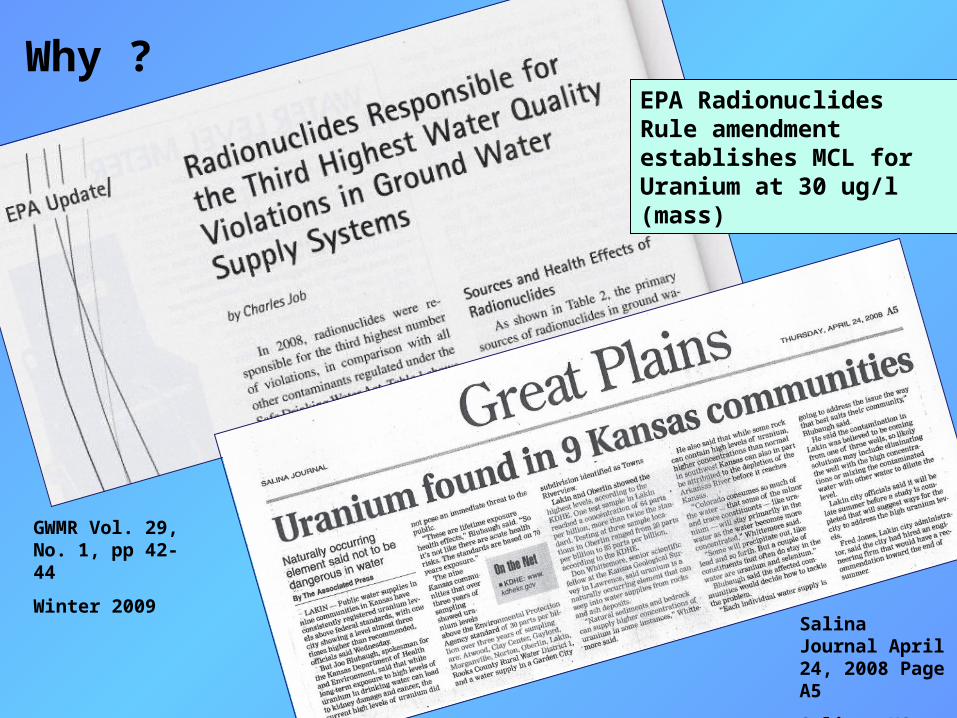
GWMR Vol. 29, No. 1, pp 42-44
Winter 2009
Salina Journal April 24, 2008 Page A5
Salina, KS
EPA Radionuclides Rule amendment establishes MCL for Uranium at 30 ug/l (mass)
Why ?

Where ?
Village of Clarks
Merrick County, NE
Alluvial deposits of the Platte River
Local bedrock is the Niobrara Chalk.
Nebraska Geologic Bedrock Map after Burchett & Pabian, 1991.

Background on Clarks PWS
Wells
• Old, shallow wells in town abandoned due to natural Uranium between 100-200ug/L
• Two new, deeper PWS wells installed outside of town after test wells indicate U nondetect
• New north PWS well exceeds U MCL at initial sampling event
• Short time later south PWS well exceeds U MCL
New Clarks PWS South

New Wells
-120
-100
-80
-60
-40
-20
0
0 50 100 150 200
South PWS well and 4” test well construction based on drillers logs
Gravel Pack
Concrete
Bentonite Seal
Dep
th (
feet
)
psi
PWS 4” Test

How ?• Hypothesis: Elevated oxygen in zone(s) of aquifer leading to dissolution of Uranium into the groundwater
• HPT logging for hydrogeology
• HPT logs guide well placement
• Install wells using DP methods
• Develop wells
• Low flow sampling - DHHS
• Nebraska DHHS Lab analysisGeoprobe Model 8040 advances 2.25” rods for DP well installation

Hydraulic Profiling Tool (HPT) Logs
Geoprobe 6625 Unit advanced HPT probe to obtain logs

HPT Operational Theory
• Hammer or push probe at constant rate (2cm/sec)
• Inject water at low flow rate (~300ml/min)
• Measure injection pressure with in-line transducer
Flow
Water

HPT Probe
Injection Screen
E-log Wenner Array

Basics of an HPT Log(South PWS Well)
Flow
• Electrical Conductance – EC (mS/m)
Higher EC >>> clay
Lower EC >>> sand/gravel
• Pressure (psi /100 max)
Higher P >>> lower perm
Lower P >>> higher perm
Hydrostatic P >>> rising baseline
• Flow (ml/min) --- ~ constant
Higher flow >>> higher perm
Lower flow >>> lower perm
De
pth
(ft
)
Pressure
EC
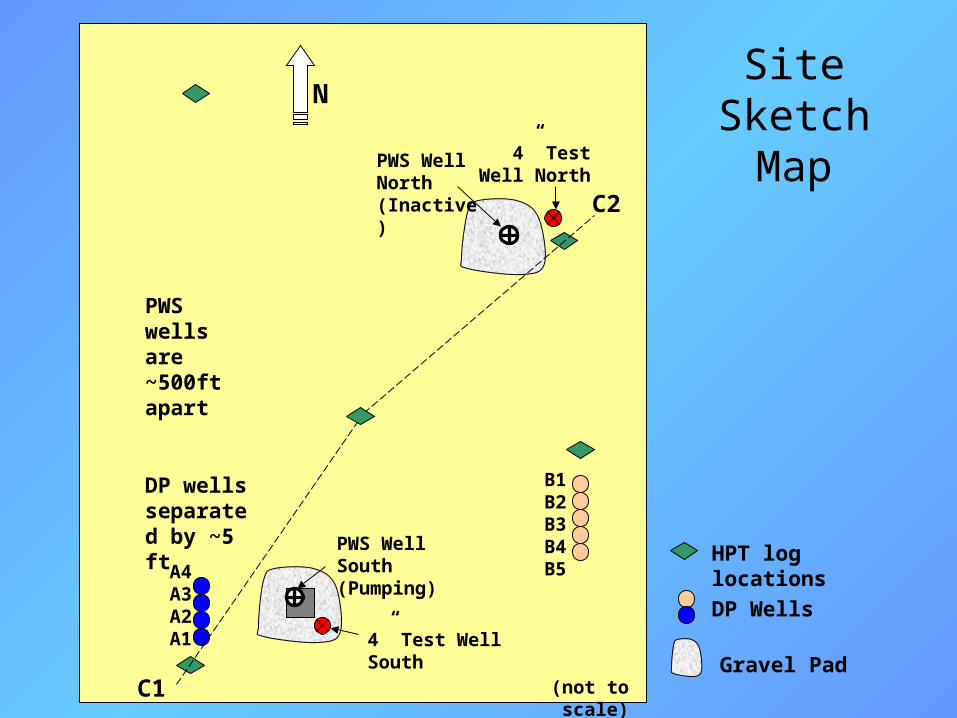
N
A4A3A2A1
B1B2B3B4B5
PWS Well South (Pumping)
4” Test Well South
PWS Well North (Inactive)
4” Test Well North
C1
C2
PWS wells are ~500ft apart
DP wells separated by ~5 ft
Site Sketch Map
(not to scale)
HPT log locations
DP Wells
Gravel Pad
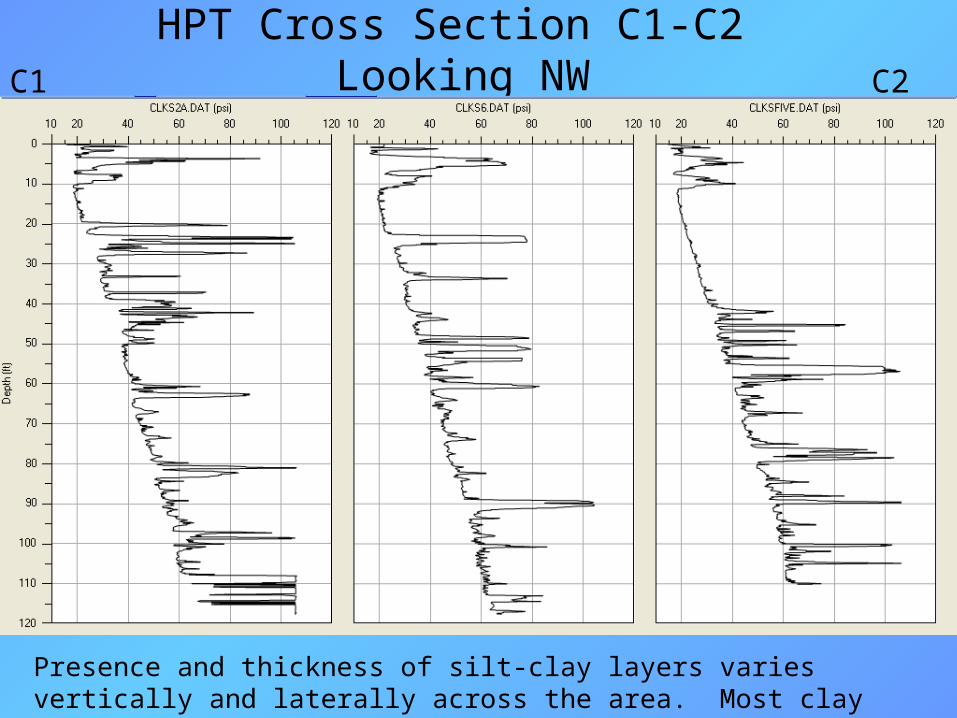
HPT Cross Section C1-C2 Looking NWC1 C2
Presence and thickness of silt-clay layers varies vertically and laterally across the area. Most clay layers are not continuous.
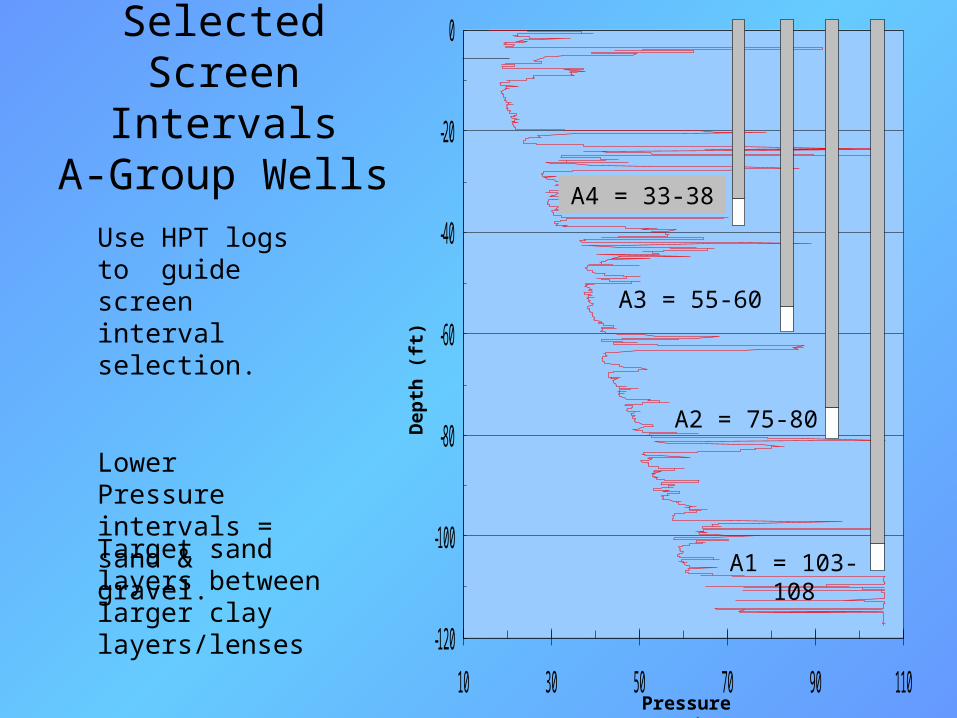
Selected Screen Intervals
A-Group Wells
-120
-100
-80
-60
-40
-20
0
10 30 50 70 90 110
Dep
th (
ft)
Pressure (psi)
A1 = 103-108
A4 = 33-38
A3 = 55-60
A2 = 75-80
Use HPT logs to guide screen interval selection.
Lower Pressure intervals = sand & gravel.
Target sand layers between larger clay layers/lenses

-120
-100
-80
-60
-40
-20
0
0 20 40 60 80 100 120
Selected Screen Intervals
B-Group Wells
Dep
th (
ft)
Pressure (psi)
B1 = 105-110
B4 = 35-40
B3 = 65-70
B2 = 83-88
B5 = 15-20
Does ground water chemistry change with depth?
DO?
ORP?
Uranium ?
Cations & Anions?
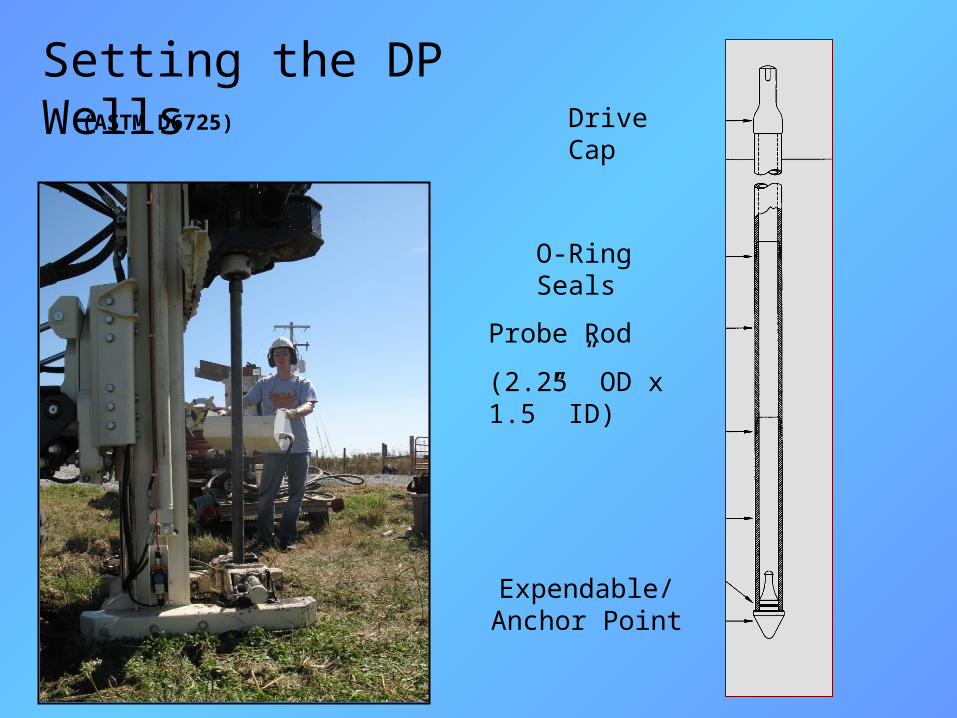
Setting the DP WellsDrive Cap
O-Ring Seals
Probe Rod
(2.25” OD x 1.5” ID)
Expendable/Anchor Point
(ASTM D6725)

ProtectorDP Well Construction
Tremie Grouting
25% solids bentonite grout ¾” PVC
Grout barrier: fm natural collapse
Nominal ¾” Prepacked Screen x 5ft
(not to scale)
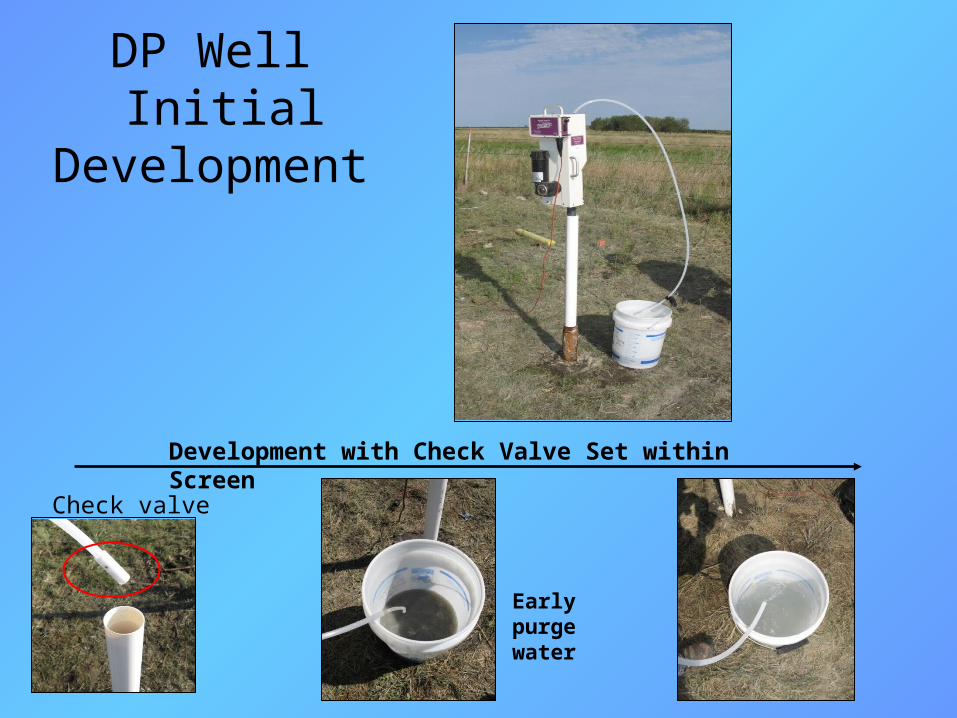
DP Well Initial
Development
Development with Check Valve Set within Screen
Check valve
Early purge water
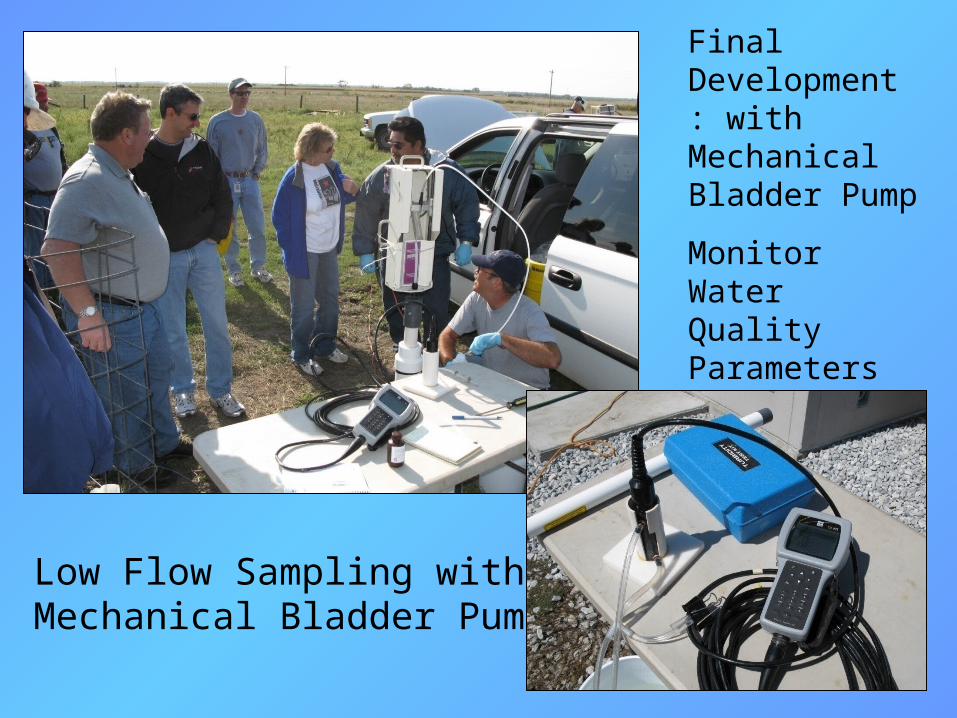
Low Flow Sampling with Mechanical Bladder Pump
Final Development : with Mechanical Bladder Pump
Monitor Water Quality Parameters
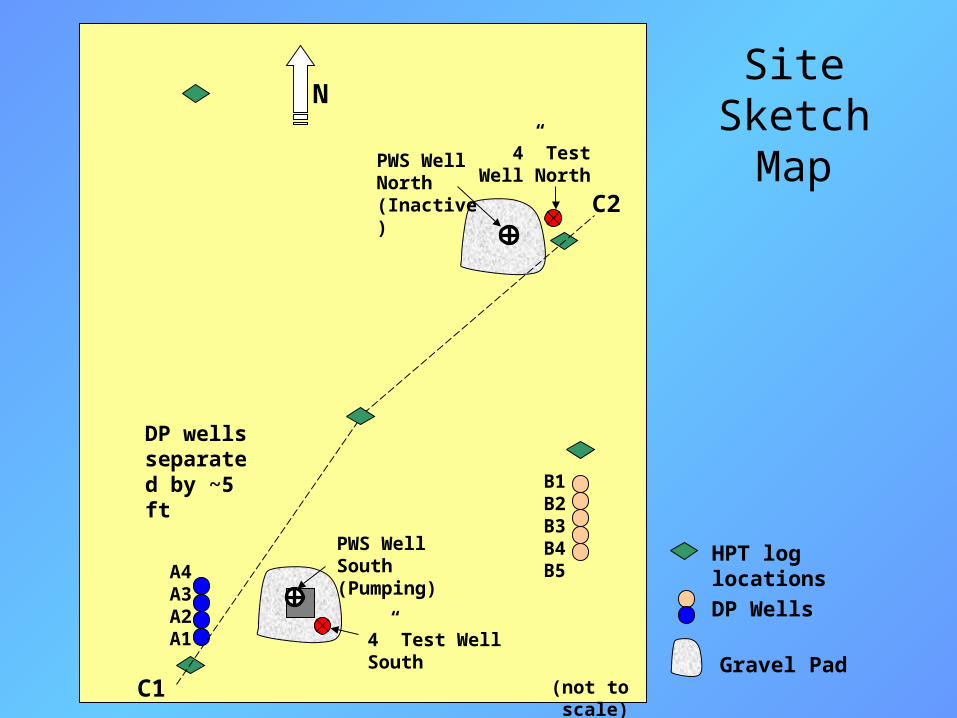
N
A4A3A2A1
B1B2B3B4B5
PWS Well South (Pumping)
4” Test Well South
PWS Well North (Inactive)
4” Test Well North
C1
C2
DP wells separated by ~5 ft
Site Sketch Map
(not to scale)
HPT log locations
DP Wells
Gravel Pad
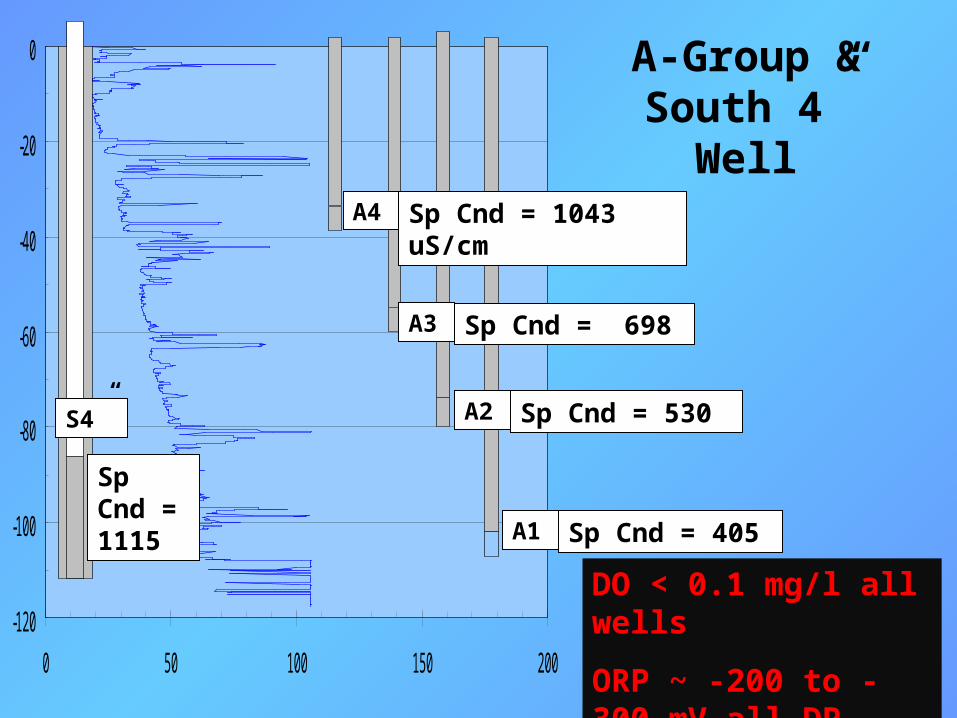
-120
-100
-80
-60
-40
-20
0
0 50 100 150 200
A-Group & South 4” Well
A4
S4”
A1
A2
A3
Sp Cnd = 1043 uS/cm
Sp Cnd = 698
Sp Cnd = 530
Sp Cnd = 405
Sp Cnd = 1115
DO < 0.1 mg/l all wells
ORP ~ -200 to -300 mV all DP wells
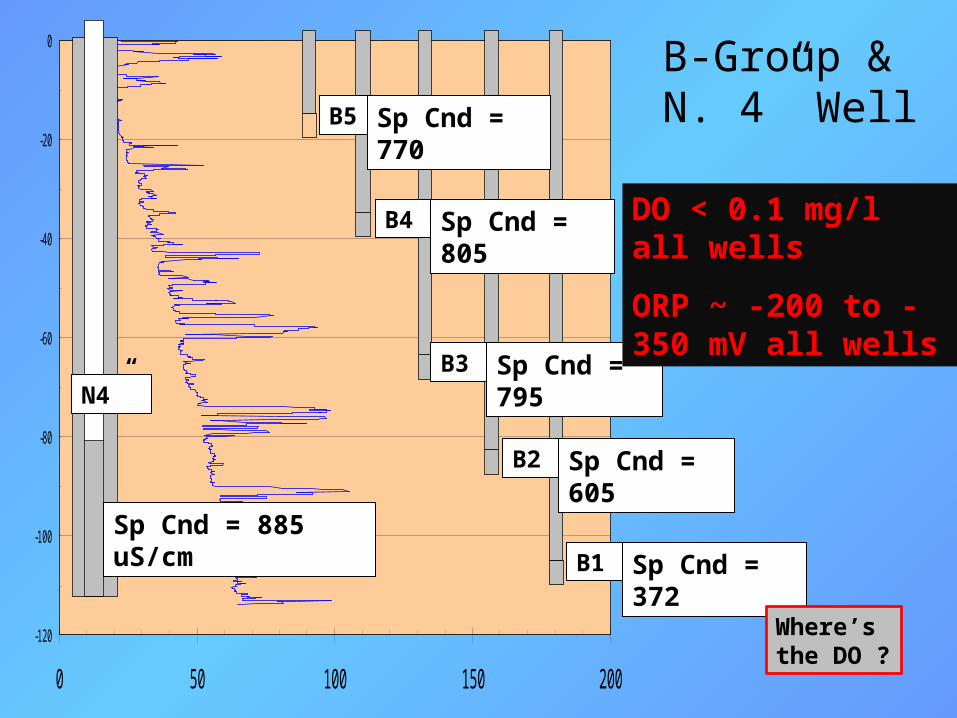
-120
-100
-80
-60
-40
-20
0
0 50 100 150 200
B5
N4”
B4
B3
B2
B1
Sp Cnd = 770
Sp Cnd = 805
Sp Cnd = 795
Sp Cnd = 605
Sp Cnd = 372
Sp Cnd = 885 uS/cm
B-Group & N. 4” Well
DO < 0.1 mg/l all wells
ORP ~ -200 to -350 mV all wells
Where’s the DO ?
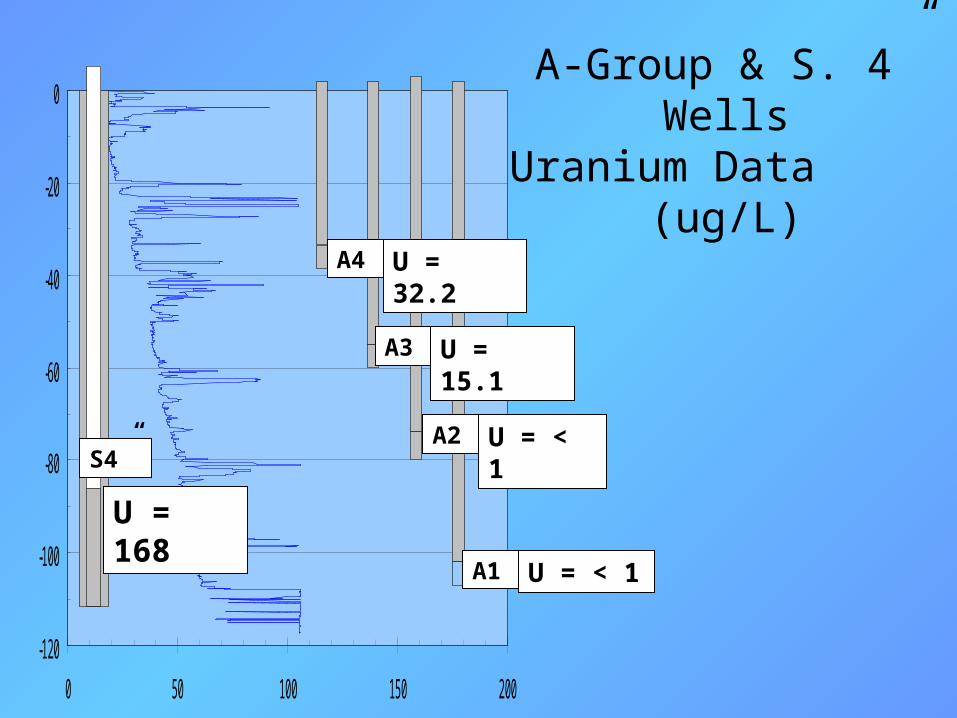
-120
-100
-80
-60
-40
-20
0
0 50 100 150 200
A4
S4”
A1
A2
A3
A-Group & S. 4” WellsUranium Data
(ug/L)
U = 32.2
U = 15.1
U = < 1
U = < 1
U = 168
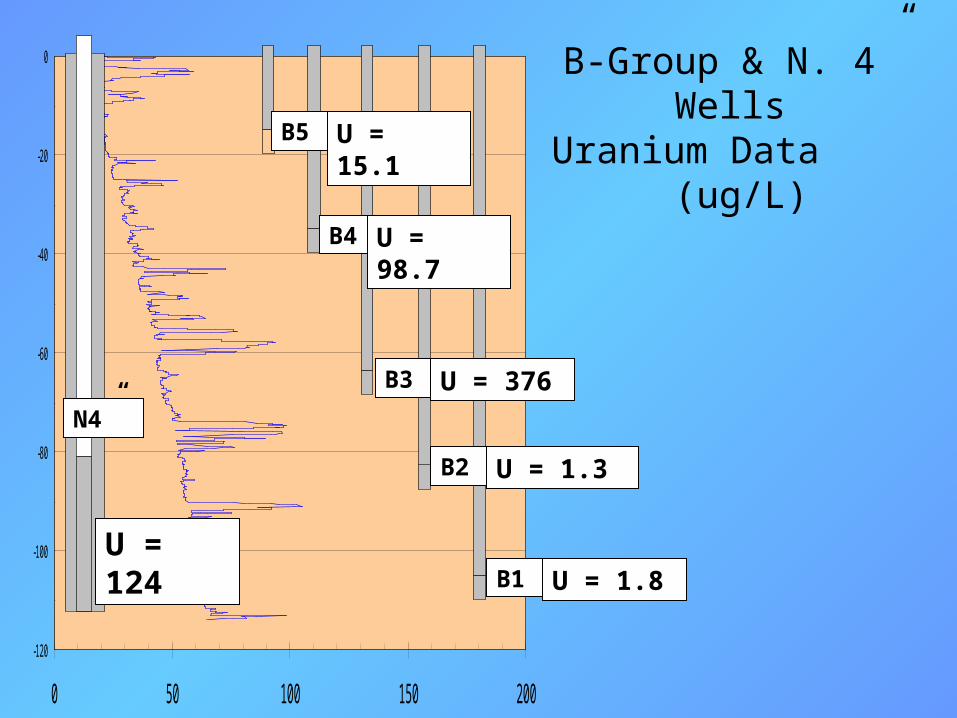
-120
-100
-80
-60
-40
-20
0
0 50 100 150 200
B5
N4”
B4
B3
B2
B1
U = 15.1
U = 1.8
U = 1.3
U = 376
U = 98.7
U = 124
B-Group & N. 4” WellsUranium Data
(ug/L)

What does this mean ?
-120
-100
-80
-60
-40
-20
0
0 50 100 150 200
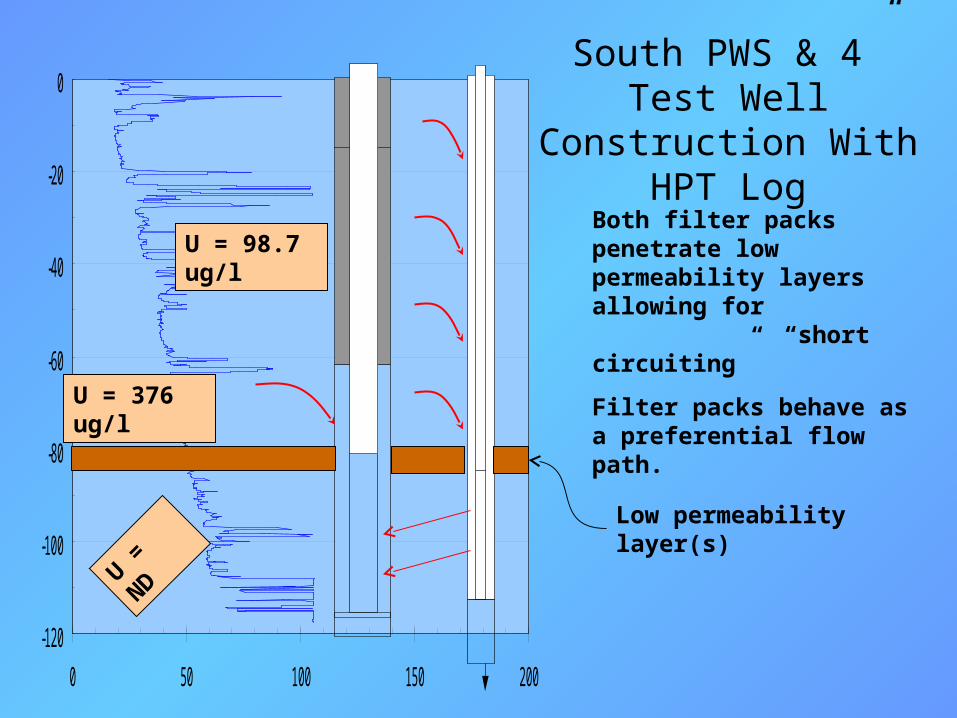
Low permeability layer(s)
South PWS & 4” Test Well Construction With
HPT Log
Both filter packs penetrate low permeability layers allowing for “short circuiting”
Filter packs behave as a preferential flow path.
U = 376 ug/l
U = 98.7 ug/l
U = N
D

-120
-100
-80
-60
-40
-20
0
0 50 100 150 200
Summary - Conclusions• HPT logs provide detailed
information on hydrogeology
• DP wells yield discrete interval samples for water quality assessment
• Uranium can be mobile in low DO and low ORP environments … dependent on water chemistry
• Uranium distribution at this site is heterogeneous in vertical and horizontal dimensions
• Investigate before Investing
Uranium ?
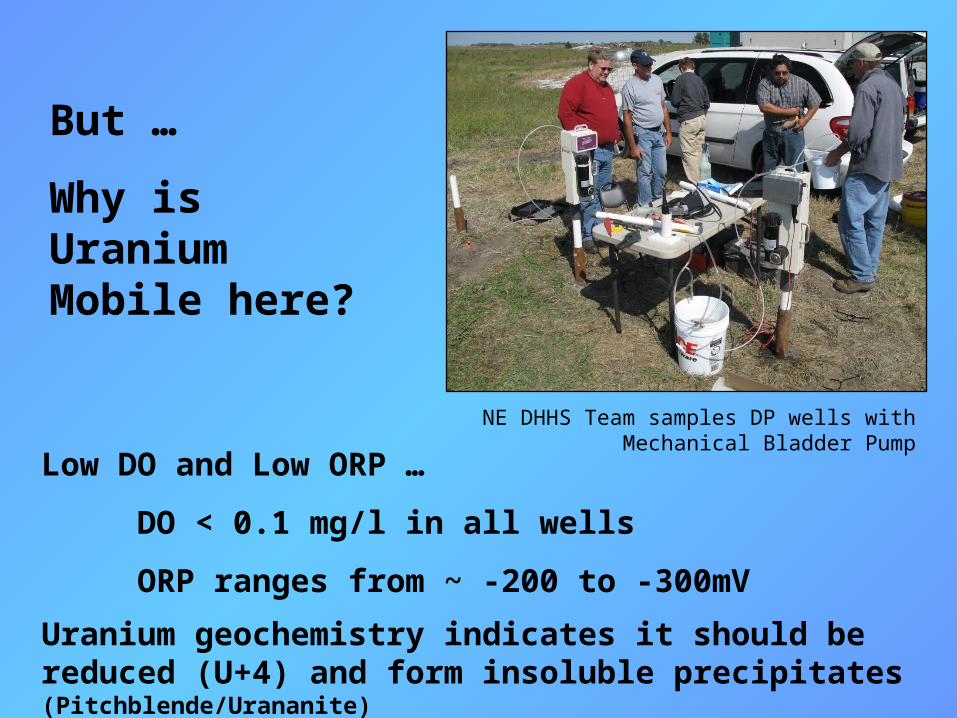
Low DO and Low ORP …
DO < 0.1 mg/l in all wells
ORP ranges from ~ -200 to -300mV
Uranium geochemistry indicates it should be reduced (U+4) and form insoluble precipitates (Pitchblende/Urananite)
But …
Why is Uranium Mobile here?
NE DHHS Team samples DP wells with Mechanical Bladder Pump
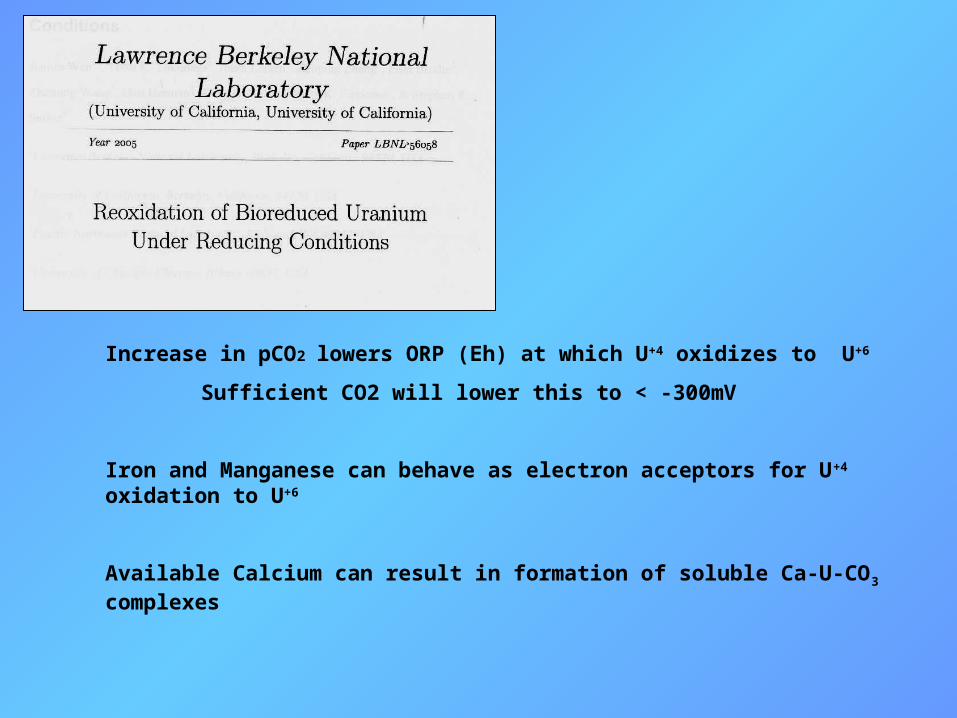
Increase in pCO2 lowers ORP (Eh) at which U+4 oxidizes to U+6
Sufficient CO2 will lower this to < -300mV
Iron and Manganese can behave as electron acceptors for U+4 oxidation to U+6
Available Calcium can result in formation of soluble Ca-U-CO3 complexes
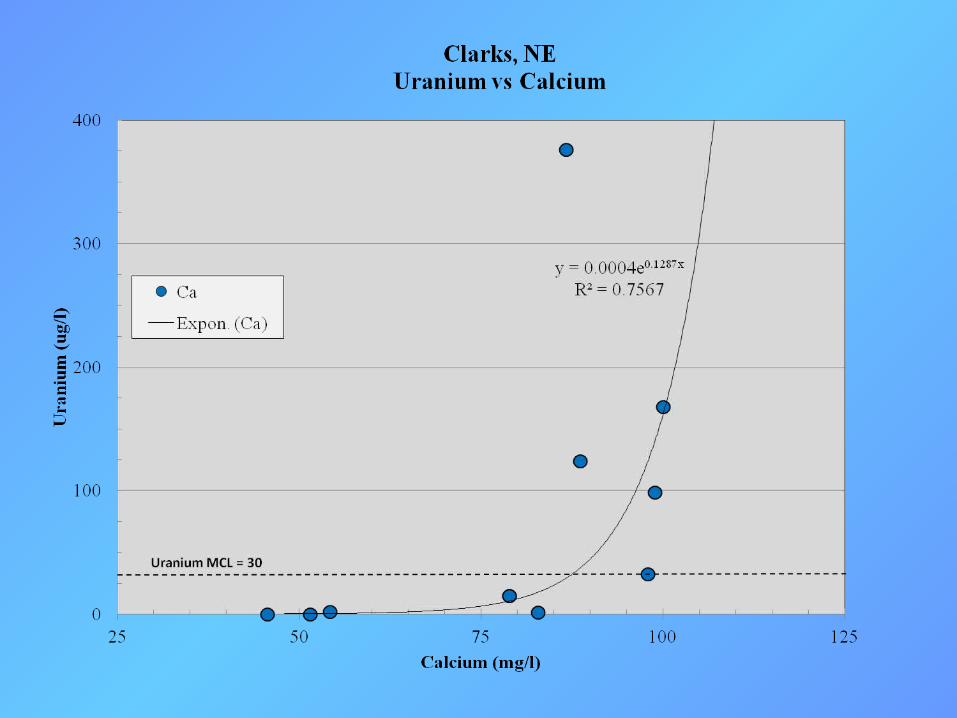

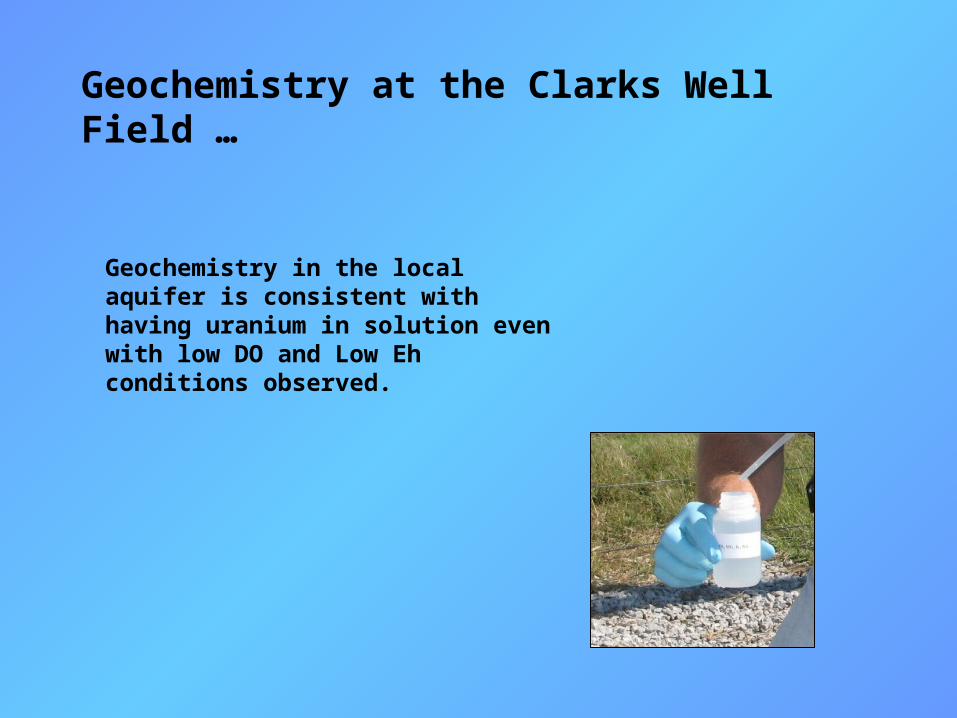
Geochemistry at the Clarks Well Field …
Geochemistry in the local aquifer is consistent with having uranium in solution even with low DO and Low Eh conditions observed.


-120
-100
-80
-60
-40
-20
0
0 50 100 150 200
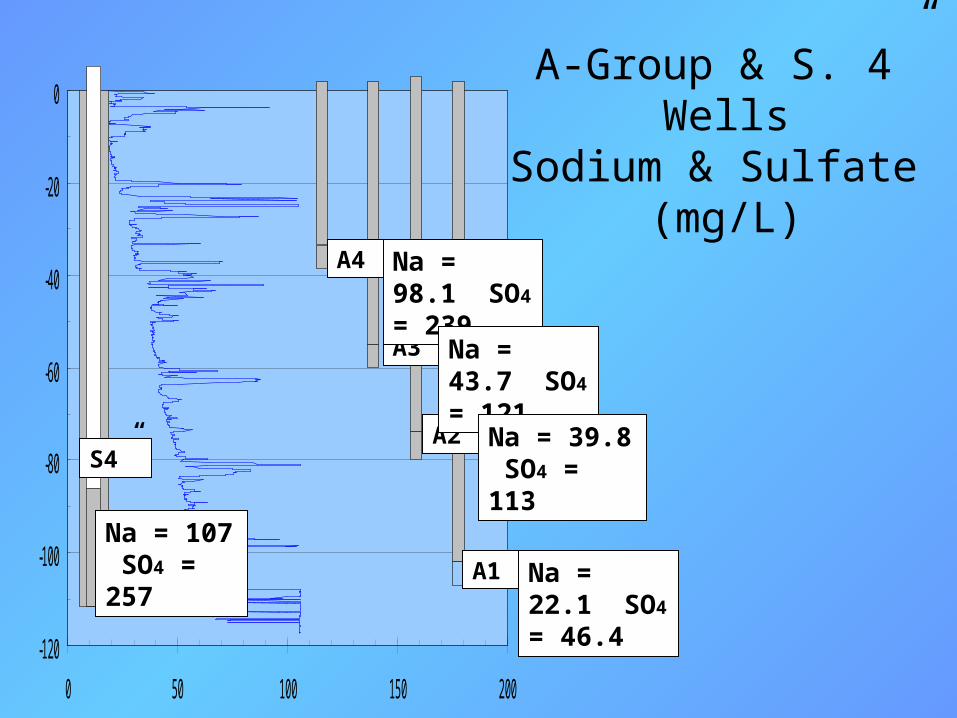
A-Group & S. 4” WellsSodium & Sulfate
(mg/L)
A4
S4”
A1
A2
A3
Na = 98.1 SO4 = 239
Na = 43.7 SO4 = 121
Na = 39.8 SO4 = 113
Na = 22.1 SO4 = 46.4
Na = 107 SO4 = 257
-120
-100
-80
-60
-40
-20
0
0 50 100 150 200
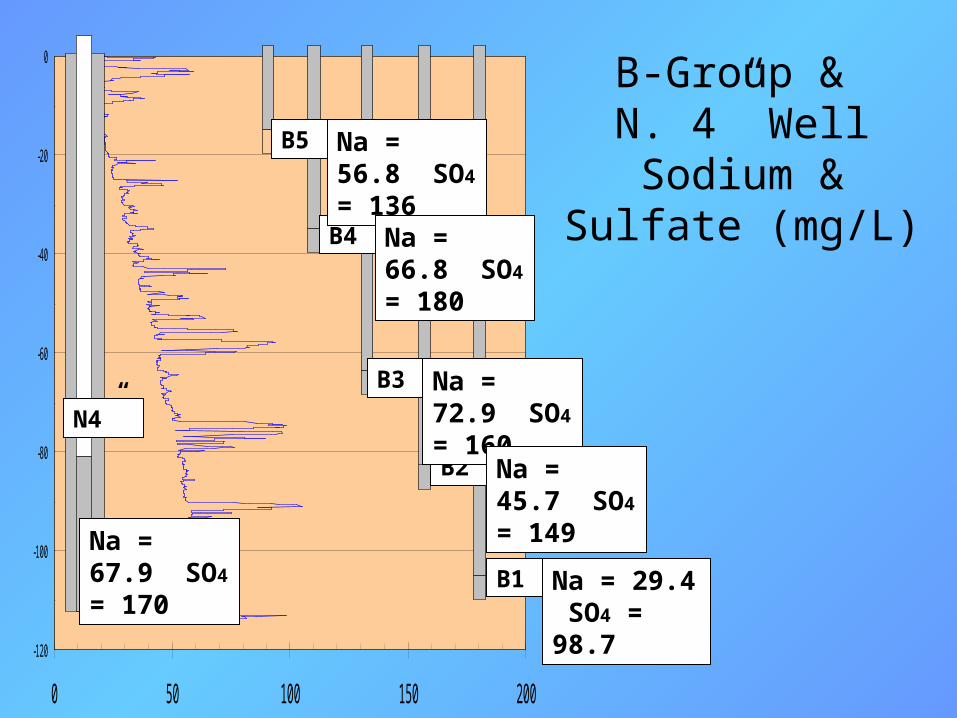
B-Group & N. 4” Well
Sodium & Sulfate (mg/L)
B5
N4”
B4
B3
B2
B1
Na = 56.8 SO4 = 136
Na = 66.8 SO4 = 180
Na = 72.9 SO4 = 160
Na = 45.7 SO4 = 149
Na = 29.4 SO4 = 98.7
Na = 67.9 SO4 = 170


