
“Update on Planned Giving Tax Strategies”
Hampton Roads Gift Planning CouncilJanuary 8, 2015
Jennifer Pierson, Manager Estate, Gift and Trust Services

Items to cover
Comparing Planned Giving Techniques – 2013
Charitable Stats from 2013 and 2014 (mid year)
Charitable Giving Trends
Impact of “NEW” tax law on Planned Giving

Planned Giving TechniquesNumber of Vehicles Established and the % Change over 2012
Donor Advised Fund – 217,367 [5.7%]Charitable Remainder Unitrust – 90,380 [-1.0%]Private Foundation – 84,350 [7.3%]Charitable Lead Trusts – 6,480 [-.3%]Charitable Remainder Annuity Trusts – 13,660 [-6.5%]Pooled Income Funds – 1,230 [-7.2%]
Source: IRS and National Philanthropic Trust
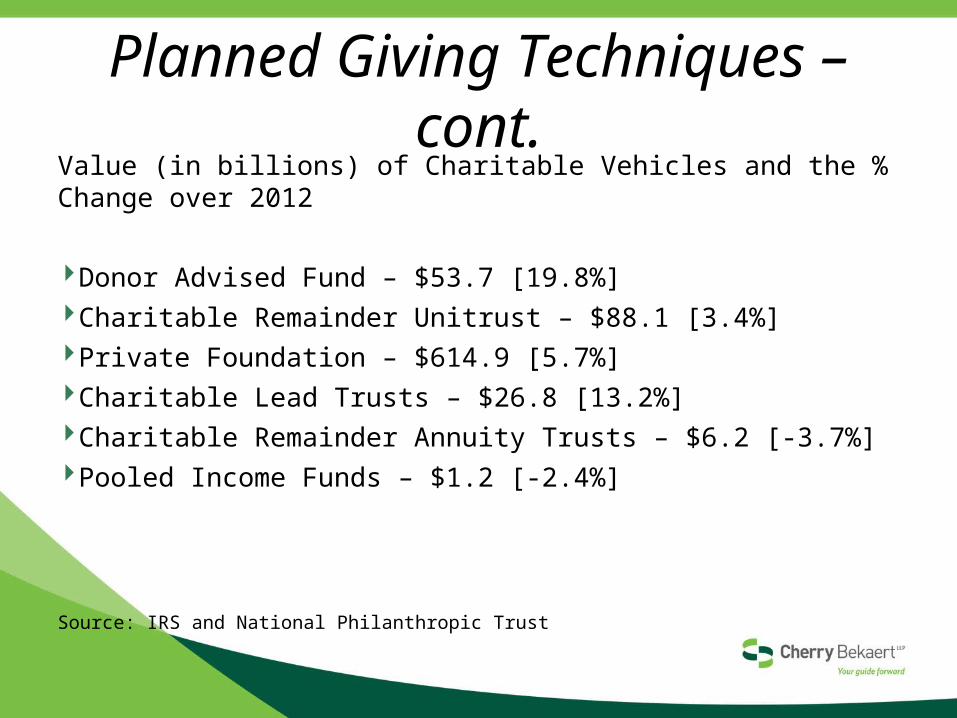
Planned Giving Techniques – cont.Value (in billions) of Charitable Vehicles and the % Change over 2012
Donor Advised Fund – $53.7 [19.8%]Charitable Remainder Unitrust – $88.1 [3.4%]Private Foundation – $614.9 [5.7%]Charitable Lead Trusts – $26.8 [13.2%]Charitable Remainder Annuity Trusts – $6.2 [-3.7%]Pooled Income Funds – $1.2 [-2.4%]
Source: IRS and National Philanthropic Trust

Charitable Giving 2013 (billions)
Individuals - $241.32 72% Foundations - 50.28 15% Bequests - 26.81 8% Corporations - 16.76 5%
Total - $335.17 100%
Source: IRS & Giving USA Foundation

Charitable Giving 2013 – Change over 2012
Individuals - 4.2% Foundations - 5.7% Bequests - 8.7% Corporations - (1.9%)
Overall 4.4%*
Source: IRS & Giving USA Foundation*3.0% increase adjusted for inflation

Charitable Giving Sectors (Billions) - 2013
Religion- $103.89 [31%] Education- $53.62 [16%] Human Services- $40.21 [12%] Public Society/Benefit- $23.46 [7%] Health- $33.51 [10%] Arts, Culture, and Humanities- $16.75 [5%] International Affairs- $13.40 [4%] Environment/Animals- $10.05 [3%]

Individual Giving – % of Disposable Income (40 years)
Disposable Income – As defined by Bureau of Economic Analysis (US Department of Commerce)
1972 - 2.2%1982 - 2.0%1992 - 1.8%2002 - 2.2%2013 - 2.0%
Source: Giving USA Foundation

Individual Giving – 2013 Giving Trends
Last 4 Years – 12.3% increase since 2009 (end of recession)
Key Factors 95.4% of households give to charity Per capita by individuals - $1,016 Per US household - $2,974 As financial situations improve…so does giving
Source: Giving USA Foundation

Corporate Giving – 2013 Giving Trends
Decline – Slower growth in pre-tax profits
Corporate Giving as % of pre-tax profits = .8%
Source: Giving USA Foundation

2013 Giving Trends – Gift Recipient Educational gifts – most growth Religious giving remains slow
Declining affiliations Increase in religious-oriented charities
International affairs slowed Fewer disaster-relief contributions
Public-society benefits, arts, environment/animal, and health orgs All experienced growth
Source: Giving USA Foundation

Charitable Receipts – Mid 2014
Percentage or responding organizations reporting change in charitable receipts, mid-2014 compared with mid-2013

What Lies Ahead? Substantial growth in Donor Advise Funds (DAF)
gifts in 2013 +9.9% to Community Foundations Consistent with prior years Grant payouts continue to be HIGH >20%
Projections – DAF “will” continue to grow DAF grant-making at $10 to $53 billion in assets Private Foundations at $54.7 to $614.9 billion in assets
Source: NPTrust.org

Comparison of DAF and PFsDonor Advised Fund Private Foundation
Start-up Costs Nominal; Services provided by custodian
Substantive legal, accounting & admin.
Income Tax Deduction Limitation
Cash: 50% AGISecurities: 30% AGI
Cash: 30% AGISecurities: 20% AGI
Estate Tax Deduction 100% 100%
Excise Taxes None 2% of annual income
Required Distribution None 5% of average FMV annually
Donor’s Responsibilities Recommend charitable beneficiaries
Manage assets, keep records, prepare federal & state filings, select charities, administer grants & verify non-profit status
Public Exposure Donor may remain anonymous
Form 990-PF is public record
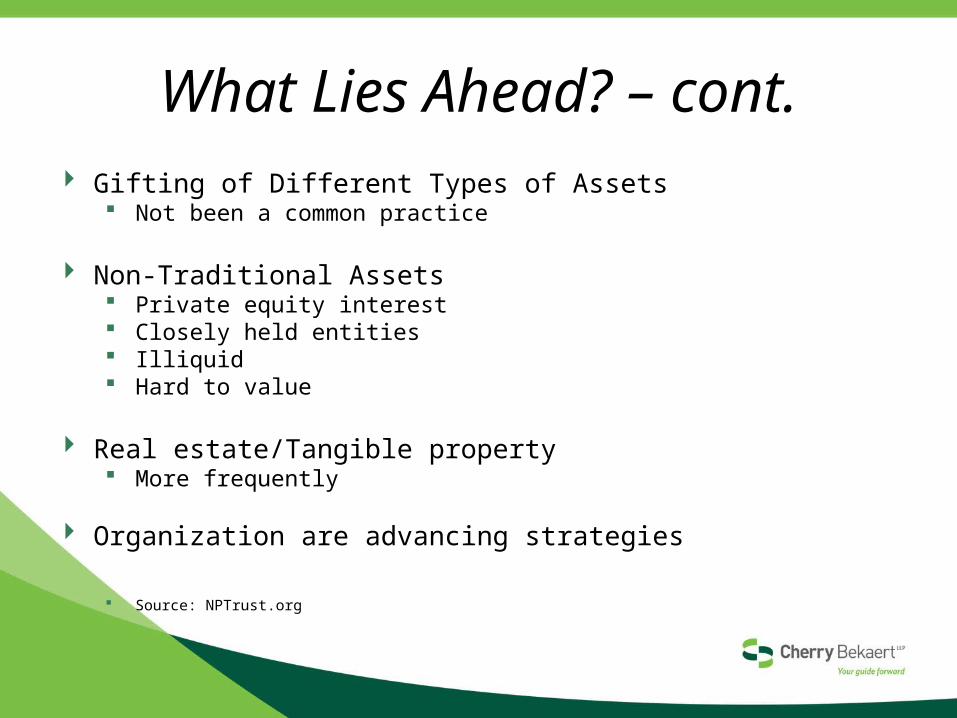
What Lies Ahead? – cont. Gifting of Different Types of Assets
Not been a common practice
Non-Traditional Assets Private equity interest Closely held entities Illiquid Hard to value
Real estate/Tangible property More frequently
Organization are advancing strategies
Source: NPTrust.org

2013 Estate Tax Return – Charitable Bequests
# of Returns - 10,568
# Charitable Bequest - 2,527
# of Virginia residence - 266
# of Charitable bequest - 63
Source: IRS

Estates and Trusts – 2001 to 2013
Total income increased $58 million (2003) to $175 million (2008) Declined to $87 million in 2010 $161 million in 2013
Types of Returns 2001 to 2013
• Complex trusts - 1.2 to 1.5 million annually• Simple trusts – 700,000 annually• Estates (Form 1041) – 400,000 annually• Grantor trusts – 600,000 annually (largest decline)• Bankruptcy estate, charitable trusts, etc. – 37,000 annually
Source: IRS (SOI)

Impact of Charitable Giving - Estate & Gift Tax
$14,000 Gift annual exclusion Exemption
$5.34 million for 2014 $5.43 million for 2015
Top Rate 40%
Portability Allows Surviving Spouse to use Deceased Spouse
Unused Exemption Many estates (2011, 2012 and 2013) filed returns in order
to obtain decedent’s exemption

Tax Rate Changes – “Continue” to Impact on Charitable Giving
Discretionary Trusts 2013 returns caught fiduciaries “off guard”
Top Rate 39.6% - > $ 12,150 Taxable Income (2014)
Net Investment Income Tax – 3.8% Big impact for capital gains
65 Day Rule

Individuals – 2015 Rates New 39.6% rate applies…
MFJ > $464,850 AGI Singles > $413,200 AGI HH > $439k AGI MFS > $232,425 AGI
Medicare 3.8% Surtax * applies… Taxpayers MAGI > $200k/$250k Net Investment Income
Supplemental Medicare Tax * .9% applies… Taxpayers MAGI > $200k/$250k Part of FICA (Hospital Insurance Tax)
* The Patient Protection and Affordable Care Act

Charitable Organizations 2013 – 1,536,084 charitable organizations in US
Public charities in 2012 Reported over $1.65 trillion in revenue Over $3 trillion in total assets
Source of revenue 73% - Program services 21% - Contributions, gifts & government grants 6% -Dues, event income, rental income, etc.
Foundations in US 86,192 in 2012 5.3% increase over prior year
Online giving 2013 increased by 13.5% Of all 2013 charitable giving – online giving represented 6.4%

Conclusion Charitable giving on the rise
Tax law continues to impact charitable giving
Focus on planning for the 3.8%


