
American Water Works AssociationAmerican Water Works Association2009 Annual Conference and Exposition
Update of LBWD’s SeawaterUpdate of LBWD’s Seawater Desalination ResearchDesalination Research
Tai J. Tseng, Robert C. Cheng, and Kevin L. WattierLong Beach Water DepartmentLong Beach Water Department
June 16, 2009
Presentation Outline
Long Beach OverviewLong Beach Overview
Research Fouling Control
Post Treatment
ConclusionConclusion
2009 ACE LBWD 2

Presentation Outline
Long Beach OverviewLong Beach Overview
Research Fouling Control
Post Treatment
ConclusionConclusion
2009 ACE LBWD 3

Long Beach Water Departmentg pCalifornia’s 5th most populous city (~500,000 residents)70,000 AF of drinking water per year8,000 AF of reclaimed water per yearOperate largest GW treatment plant in US900+ miles of drinking water lines750+ miles of sewer lines
2009 ACE LBWD 4

LBWD’s Resource Mix
20092009 2015201520092009 20152015
Conservation15% Imports
Conservation14%
Reclaimed
Reclaimed12%
30%Imports42%
6%
Desal10%
Groundwater33%
Groundwater38%
2009 ACE LBWD 5

LBWD’s Desalination ProgramgA $20 M, 10A $20 M, 10--year investment year investment Leverage various partnerships for technical input and other supportLeverage various partnerships for technical input and other supportLeverage various partnerships for technical input and other supportLeverage various partnerships for technical input and other supportFederal / State / Local FundingFederal / State / Local Funding
Post treatment / DistributionPretreatment NF2 or RO
•Under Ocean Floor Intake and Discharge
•Prototype•UV/ClO2 for disinfection and
•DBP Control•Stability of Disinfectant Residual•Mitigation of WQ impacts due
2009 ACE LBWD 6
Discharge biofouling control •Mitigation of WQ impacts due to integration of new source

Presentation Outline
Long Beach OverviewLong Beach Overview
Research Fouling Control
Post Treatment
ConclusionConclusion
2009 ACE LBWD 7

Fouling ControlgLooking for ways to help meet primary disinfection while
Energy R
minimizing O&M costs through controlling fouling.
Recovery
UV2nd Pass NF
Energy Recovery
1st Pass NFCartridge
Filter
Disinfectant
Pre-Treatment
Recovery
Cartridge Filter
Disinfectant
2009 ACE LBWD 8
2nd Pass NF1st Pass NFClO2

Fouling ControlInitial Bench Testing using SEPA Cell
g
• System operated in recirculation mode.
• ClO2 generated using Cl2 gas &using Cl2 gas & NaClO2.
2009 ACE LBWD 9

Fouling ControlRapid deterioration in salt rejection after ClO2 exposure
g
• Salt rejection 5.0 100%ClO2
decreased by ~ 50% in 4 days suggest the ClO2 3 0
3.54.04.5
ClO
2 (m
g/L)
60%70%80%90%
n
Rejection
suggest the ClO2was rapidly destroying the PA 1.5
2.02.53.0
entra
tion
of C
30%40%50%60%
Rej
ectio
membrane.
0.00.51.0
11/16 11/17 11/18 11/19 11/20 11/21
Con
ce
0%10%20%
2009 ACE LBWD 10
11/16 11/17 11/18 11/19 11/20 11/21

Fouling Controlg
Many ways to generate ClO2.Many ways to generate ClO2.2NaClO2 + Cl2(g) 2ClO2(g) + 2NaCl.2NaClO2 + HOCl 2ClO2(g) + NaCl + NaOH.2NaClO2 HOCl 2ClO2(g) NaCl NaOH.5NaClO2 + 4HCl 4ClO2(g) + 5NaCl + 2H2O.Electrolytic generation.
Depending on the generation method, free Cl2 may be present. The key is to 2 y p ygenerate ClO2 without generating free Cl2.
2009 ACE LBWD 11
2

Fouling ControlRevised Bench SEPA Cell testing
g
• Operated in once-thru mode.• Acid / chlorite method (“free Cl2” free).
2009 ACE LBWD 12

Fouling ControlSEPA Cell testing using ClO2 generated via acid
g
generation method over 14 days• Salt rejection was
90%
100%
0 9
1.0
stable thru the 14 day test period.
• Provided 60%
70%
80%
90%
(%)
0 6
0.7
0.8
0.9
l (m
g/L)Rejection
ClO2Provided reasonable assurance to 30%
40%
50%
60%R
ejec
tion
0.3
0.4
0.5
0.6
lO2 R
esid
uaid l
proceed to testing on full-scale
0%
10%
20%
7/1 7/6 7/11 7/16 7/210.0
0.1
0.2 Cl
2009 ACE LBWD 13
7/1 7/6 7/11 7/16 7/21

Fouling ControlgPrototype testing of ClO2 began in April
1.6Feed
• Target dose is 0.5
1.0
1.2
1.4
l (m
g/L)
FeedConcentratePermeate
mg/L.• Interestingly, ClO2
was 100% rejected
0 4
0.6
0.8
O2 R
esid
ualwas 100% rejected
by membranes. • This can impact
0.0
0.2
0.4
3/28 4/17 5/7 5/27 6/16
Cl
how we use ClO2 to assist in meeting CT
2009 ACE LBWD 14
3/28 4/17 5/7 5/27 6/16CT.
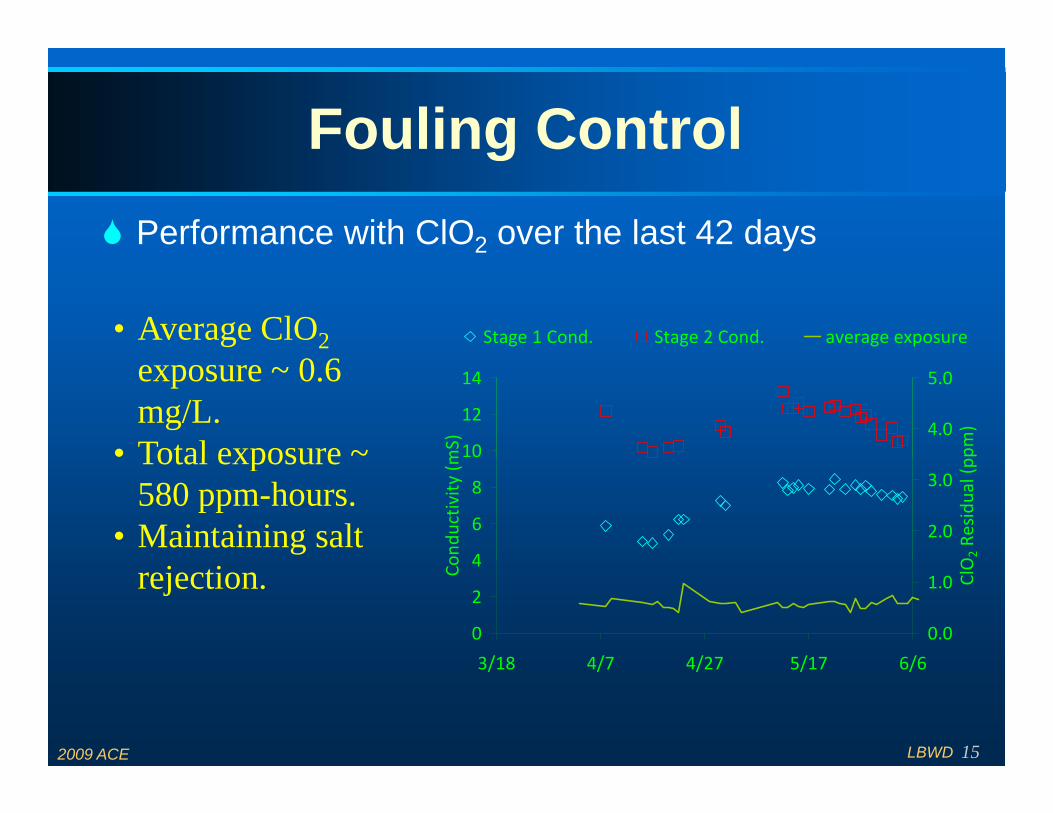
Fouling ControlPerformance with ClO2 over the last 42 days
g
• Average ClO2 Stage 1 Cond. Stage 2 Cond. average exposure
exposure ~ 0.6 mg/L.
• Total exposure ~ 10
12
14
mS)
4.0
5.0
pm)
Total exposure 580 ppm-hours.
• Maintaining salt 4
6
8
ondu
ctivity
(m
2.0
3.0
O2 R
esidual (p
rejection.0
2
4
3/18 4/7 4/27 5/17 6/6
Co
0.0
1.0 ClO
2009 ACE LBWD 15
3/18 4/7 4/27 5/17 6/6

Fouling ControlCF DP with and without ClO2
g
18
20
With C lO2 Without C lO2
12
14
16
sure (PSI)
Generator malfunction
6
8
10
eren
tial P
res
2
4
6
Diffe
2009 ACE LBWD 16
0
4/1 4/6 4/11 4/16 4/21

Fouling ControlCloser examination of cartridge filter ΔP
g
Cartridge
Train 1
Filter
Initially No ClO2Started ClO2
Pre-TreatmentCartridge
Filter
Stopped ClO2
Train 2
Initially With ClO
Train 2
2009 ACE LBWD 17
Initially With ClO2Stopped ClO2Started ClO2

Fouling ControlShort experiments to evaluate ClO2
g
16 180
T1 DP T2 DP T1 Flow T2 Flow
10
12
14
(psi
)
120
140
160
)
Stopped ClO2 Injection
6
8
10
ta P
ress
ure
60
80
100
120
Flow
(GP
M)
Started ClO2 Injection
Stopped ClO2 Injection
0
2
4Del
0
20
40
60
Started ClO2 Injection
2009 ACE LBWD 18
0
04/2
4
04/2
5
04/2
6
04/2
7
04/2
8
04/2
9
04/3
0
0

Presentation Outline
Long Beach OverviewLong Beach Overview
Research Fouling Control
Post Treatment
ConclusionConclusion
2009 ACE LBWD 19
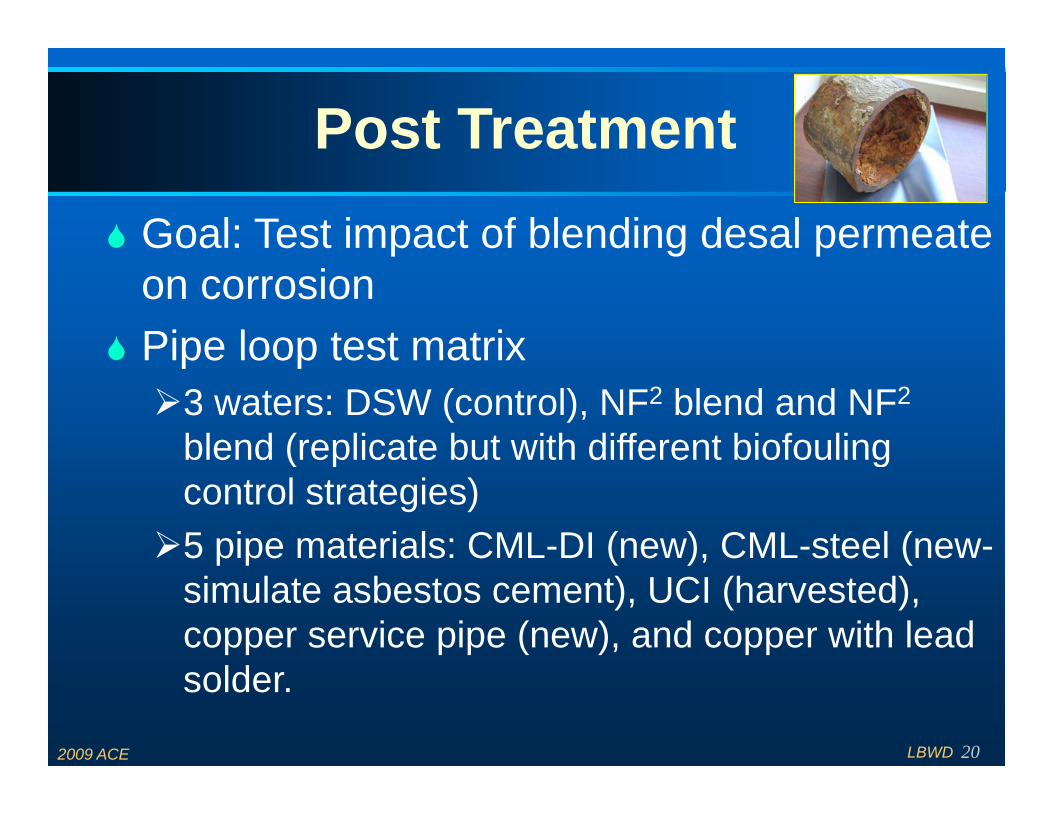
Post TreatmentGoal: Test impact of blending desal permeate p g pon corrosion Pipe loop test matrixPipe loop test matrix
3 waters: DSW (control), NF2 blend and NF2
blend (replicate but with different biofoulingblend (replicate but with different biofouling control strategies)5 pipe materials: CML-DI (new), CML-steel (new-p p ( ), (simulate asbestos cement), UCI (harvested), copper service pipe (new), and copper with lead
2009 ACE LBWD 20
solder.

Post Treatment
Pipes both harvestedPipes both harvestedPipes, both harvested Pipes, both harvested and new, were and new, were conditioned withconditioned withconditioned with conditioned with distribution system distribution system water to condition thewater to condition thewater to condition the water to condition the pipes prior to pipes prior to installationinstallationinstallation.installation.
2009 ACE LBWD 21

Post Treatment
Finished Pipe LoopFinished Pipe LoopFinished Pipe Loop.Finished Pipe Loop.Pipe loops are enclosed in Pipe loops are enclosed in temperature controlledtemperature controlledtemperature controlled temperature controlled environment.environment.3 Trains:3 Trains:
Each Train has 4 pipe Each Train has 4 pipe materials operated in materials operated in parallel.parallel.parallel.parallel.
Copper with lead solder is Copper with lead solder is outside.outside.
2009 ACE LBWD 22

Post TreatmentPipe loop 1 Pipe loops 2 & 3Pipe loop 1 Pipe loops 2 & 3
6 months Preconditioning DSW DSW
Phase 1‐ 6 months DSW NF2:DSW ratio 50:50
Phase 2 4 months DSW NF2:DSW ratio 75:25
6 months Preconditioning DSW DSW
Phase 1‐ 6 months DSW NF2:DSW ratio 50:50
Phase 2 4 months DSW NF2:DSW ratio 75:25Phase 2‐ 4 months DSW NF2:DSW ratio 75:25
Phase 3‐ 2 months DSW TBD
Phase 2‐ 4 months DSW NF2:DSW ratio 75:25
Phase 3‐ 2 months DSW TBD
Jan Feb Mar Apr May Jun Jul Aug Sep Oct Nov Dec Jan Feb Mar AprOffsite ConditioningOnsite Conditioning
2009 2010
Onsite ConditioningPhase 1 TestingPhase 2 TestingPhase 3 Testing
2009 ACE LBWD 23

Post Treatment
Chlorine residual hasChlorine residual has2.0
L)
DSW-CastTrain 1-CastTrain 2 Cast Chlorine residual has Chlorine residual has
reached a stable level in reached a stable level in cast iron, ductile iron and cast iron, ductile iron and t l it l i
1.0
1.5
tal c
hlor
ine
(mg/ Train 2-Cast
steel pipessteel pipes
0.0
0.5
2/16/09 3/8/09 3/28/09 4/17/09 5/7/09
Tot
2/16/09 3/8/09 3/28/09 4/17/09 5/7/09
1.5
2.0
(mg/
L)
1.5
2.0
(mg/
L)
0.5
1.0
Tota
l chl
orin
e
DSW-DuctileTrain 1-DuctileT i 2 D til
0.5
1.0
Tota
l chl
orin
e
DSW-SteelTrain 1-SteelTrain 2 Steel
2009 ACE LBWD 24
0.02/11/09 2/26/09 3/13/09 3/28/09 4/12/09 4/27/09 5/12/09
Train 2-Ductile
0.02/16/09 3/8/09 3/28/09 4/17/09 5/7/09 5/27/09
Train 2-Steel

Post Treatment
Iron samples takenIron samples taken
12000
14000DSW-CastTrain 1-CastTrain 2 Cast
Iron samples taken Iron samples taken from Unlined Cast Iron from Unlined Cast Iron Pipe after 6 hours of Pipe after 6 hours of t ti h th tt ti h th t
8000
10000
n (u
g/L)
Train 2-Cast stagnation shows that stagnation shows that iron release gradually iron release gradually decreased during decreased during
2000
4000
6000
Iron
conditioning period conditioning period and is ready for and is ready for blending studyblending study
02/11/09 2/26/09 3/13/09 3/28/09 4/12/09 4/27/09
blending study.blending study.
2009 ACE LBWD 25
Post Treatment
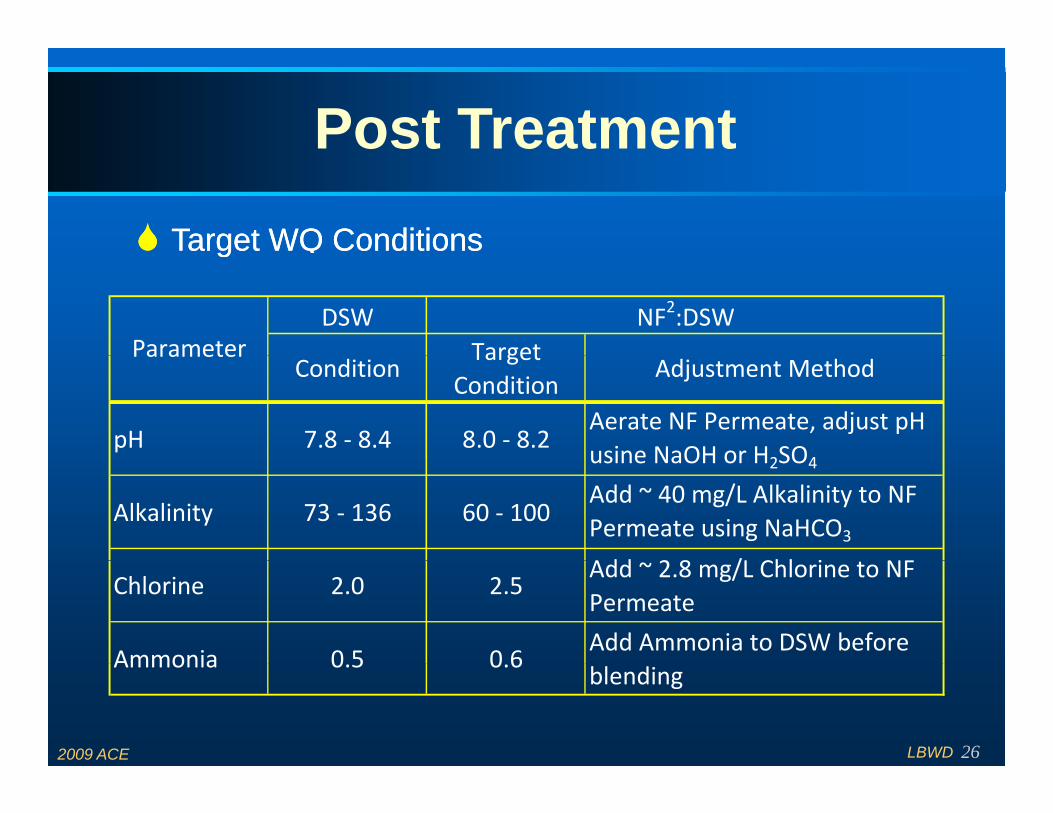
Target WQ ConditionsTarget WQ Conditionsgg
DSWTargetParameter
NF2:DSW
ConditionTarget
ConditionAdjustment Method
pH 7.8 ‐ 8.4 8.0 ‐ 8.2Aerate NF Permeate, adjust pH usine NaOH or H2SO4
Parameter
usine NaOH or H2SO4
Alkalinity 73 ‐ 136 60 ‐ 100Add ~ 40 mg/L Alkalinity to NF Permeate using NaHCO3
Add 2 8 /L Chl i NFChlorine 2.0 2.5
Add ~ 2.8 mg/L Chlorine to NF Permeate
Ammonia 0 5 0 6Add Ammonia to DSW before
2009 ACE LBWD 26
Ammonia 0.5 0.6blending

Post Treatment
Parameters Monday Tuesday Wednesday Thursday FridayParameters Monday Tuesday Wednesday Thursday FridaypH, Conductivity, and ORP X X XTotal and Free Chlorine X X XAlkalinity X X XDO X X XTemperature X X XSulfide XT l d F A i X X XTotal and Free Ammonia X X XMetals X X XAnions and Cations X X XColiform, HPC XColiform, HPC XColor, Turbidity, and TDS XTOC, DOC, and UV254* XHAA9 and TTHM** X
2009 ACE LBWD 27
Iodide, Iodine, IA, and NDMA ** X*Twice a month, **Once a month

Presentation Outline
Long Beach OverviewLong Beach Overview
Research Pre-Treatment
Post Treatment
ConclusionConclusion
2009 ACE LBWD 28

ConclusionsGeneration method for ClO2 is key. 2 y“Free chlorine” free ClO2 have been successfully applied onto PA membranes for y580 ppm-hours without noticeable damage to the membranes. ClO2 is rejected during the desalination process.The application of chlorine dioxide controlled biofouling in cartridge filter system.
2009 ACE LBWD 29

ConclusionsPost treatment testing facility construction is g ycomplete.CI, DI, and Steel preconditioning stability. g yDuring preconditioning, pipes were superchlorinated and may have destabilized scale. However, more recent data suggest the new scale formation is stronger than previous
lscale.Blending studies have began and will proceed for the next 6 months
2009 ACE LBWD 30
for the next 6 months.

AcknowledgementgFunding partners:
US Bureau of ReclamationCa Dept of Water ResourcesLos Angeles Dept of Water and PowerLos Angeles Dept of Water and Power
Dian Tanuwidjaja, UCLA/LBWDDuPont (ClO2 analytical support) ( 2 y )CH2M (ClO2 design & technical support)Yan Zhang, DXV WaterB&V (Post Treatment design & technical support)LBWD WQ Lab Staff
2009 ACE LBWD 31


