
Universal Access: An internationalUniversal Access: An internationalcomparisoncomparison
The views expressed in this paper are those of the author and do not necessarily reflect the opinions of the ITU orits Membership. Dr Kelly can be contacted by e-mail at [email protected]
Dr Tim Kelly, ITUSession 2: Course on
Telecom Policy, Regulationand Management,
University of Witwatersrand,6-7 May, 1999

Universal Access: An international comparison
Universal Access: An internationalcomparison
lWhat is Universal Service / UniversalAccess?lThe “myth” of subsidised accesslDefining affordabilitylPricing strategies
⇒For universal access⇒For universal service
lTargets for the year 2010
Universal Access: An international comparison
Universal accesslAvailability ...lAccessibility ...lAffordability ...
of basic telephone service“to promote the extension of the benefits ofthe new telecommunication technologies toall the world’s inhabitants”ITU Constitution, Article 1

Universal Access: An international comparison
Universal access andUniversal service
l Universal service:telephone in everyhomel Universal access:
telephone withinreasonabledistance foreveryone
0102030405060708090
100
GDP per capita
Percentage of households with a telephone
Universal access
Universal service
Universal Access: An international comparison
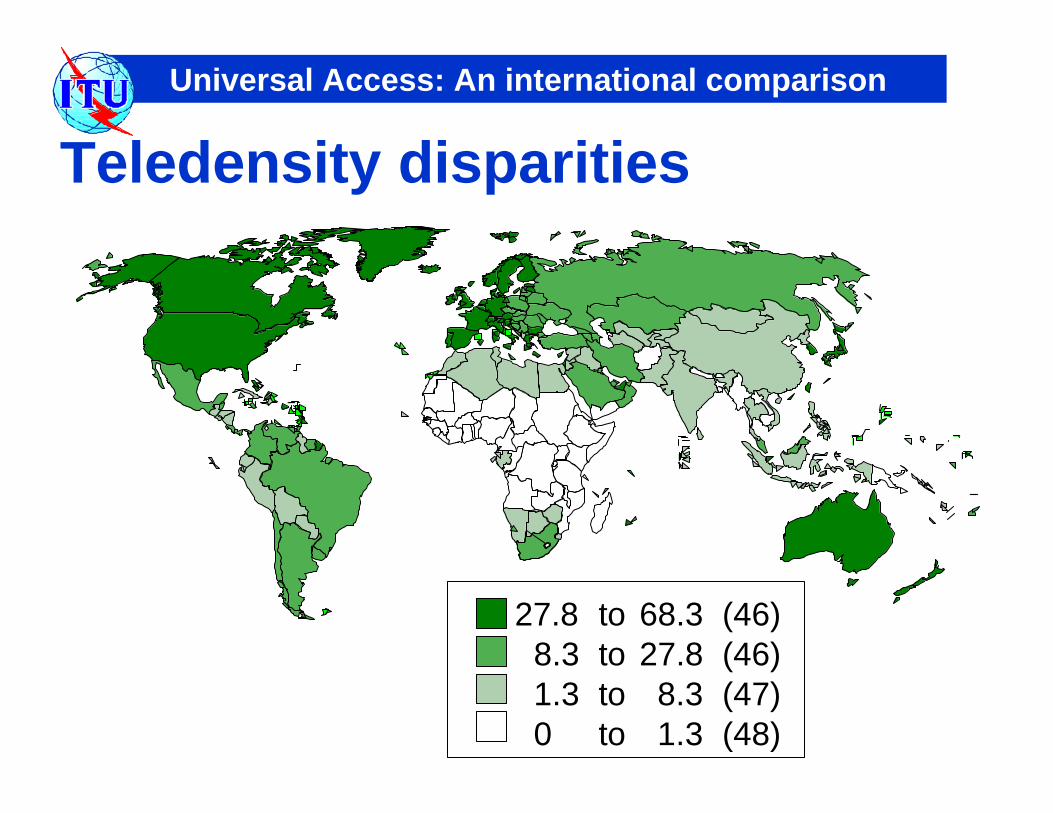
Teledensity disparities
27.8 to 68.3 (46)8.3 to 27.8 (46)1.3 to 8.3 (47)0 to 1.3 (48)

Universal Access: An international comparison
05
1015
202530354045
Teledensity
Num
ber
of e
cono
mie
s
Teledensity <1: 43 economies
1-5: 36 economies
5-10: 26 economies
1 5 10 20 30 40 50 60 70 80
The nature of the problem
Source: ITU World Telecommunication Indicators Database.
Universal Access: An international comparison
0200400600800
1'0001'2001'4001'6001'8002'000
<1 1-5 5-10 10-20 20-30 30-40 40-50 >50Teledensity band
Pop
ulat
ion,
mill
ion
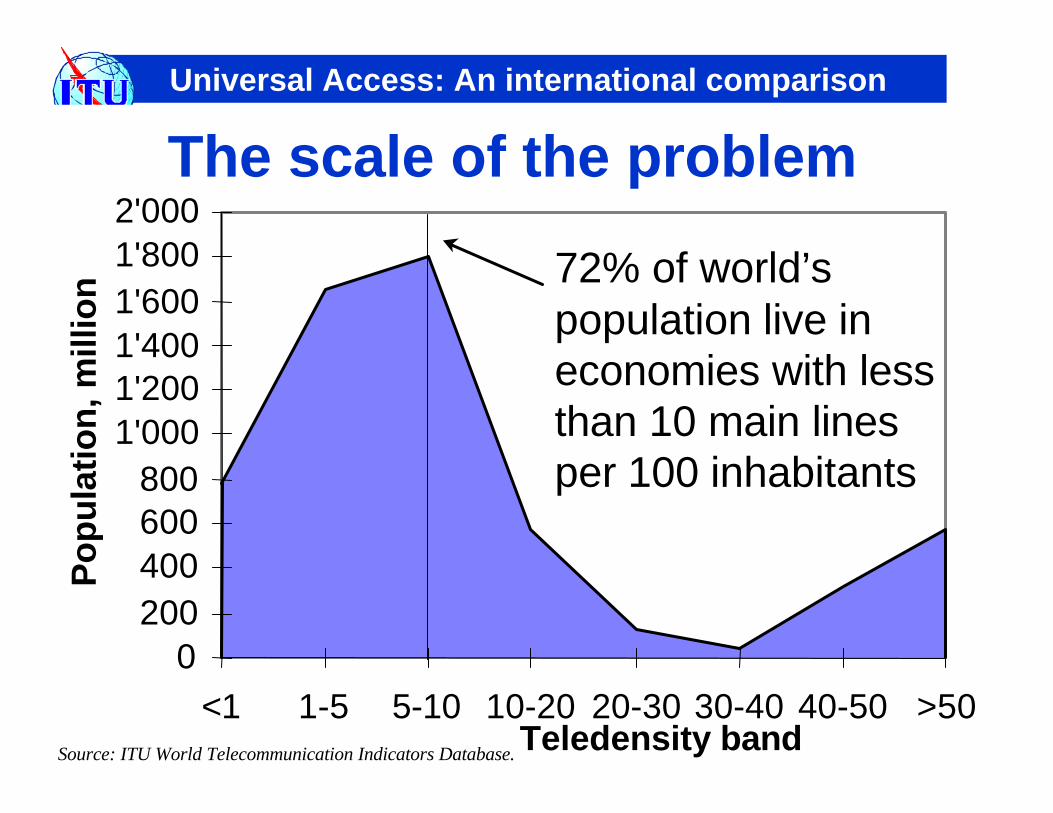
The scale of the problem
Source: ITU World Telecommunication Indicators Database.
72% of world’spopulation live ineconomies with lessthan 10 main linesper 100 inhabitants

Universal Access: An international comparison
Teledensity transition
<1 1-10 5- 10- 20- 30- 40- >50 10 20 30 40 50
0
10
20
30
40
50
No. of countries:
Average
Best
1 10 20 30 40 50
43 37 29 28 22 17 19 25
Tele-density:
Years
Source: ITU World Telecommunication Development Report 1998: Universal Access.

Universal Access: An international comparison
Have telephone
29%
No access18%
NearbyPublic phone
36%
Neigh-bours 6%
Nearby5%
Not Near-by 6%
Anot
her
phon
e South Africa9 million
households
Source: Statistics South Africa.<http://www.statssa.gov.za/>
Teledensity: 10.7Cellular density: 3.7Total telephone
density: 14.4Household
telephonepenetration: 29%
Universal accesspenetration (% ofhouseholds withaccess totelephone): 82%
Measures of Accessibility: SA

Universal Access: An international comparison
8
16
17
18
23
27
29
31
46
55
N. Prov.
E. Cape
North West
M'langa
Free State
Kwazulu-Natal
RSA
Northern Cape
Gauteng
Western Cape
South Africa . % of households with a telephone, By province, 1996Source: Statistics South Africa.
Measures ofAccessibility: byprovince

Universal Access: An international comparison
The “myth” of subsidisedaccessl It is commonly argued that telephone
access should be priced at a low rate sothat as many people as possible canafford itlBut,
⇒ this may result in ‘subsidies’ from non-telephoneusers to telephone owners, who are typicallybusiness, government and richest 1% of population
⇒ if revenues do not cover costs, then the waitinglist will grow

Universal Access: An international comparison
“Socially desirable” pricing
• Rates are keptartificially low
• Affordable price,maybe < break-even
• Initial group oftelephone users areclustered in thelargest city and arenot poor
Percentage of households in Lima, Peru with a telephone, by income, 1996100%
84%
37% 36%
7%
A B Lima C D
A = Richest 25%B = Second 25%C = Third 25%D = Poorest 25%
Source: OSIPTEL.
• May not generateenough revenue fornetwork expansion

Universal Access: An international comparison
Defining affordabilitylRelative affordability, e.g., <5 per cent of
average family income⇒BUT, initial telephone users are are not necessarily
“average⇒In low income countries, costs for network
installation may be high, but incomes are low
l“Best practice” cost of operating anetwork⇒Methodology must be refined for residential and
business users⇒Costs must be split between one-time & recurring
Universal Access: An international comparison
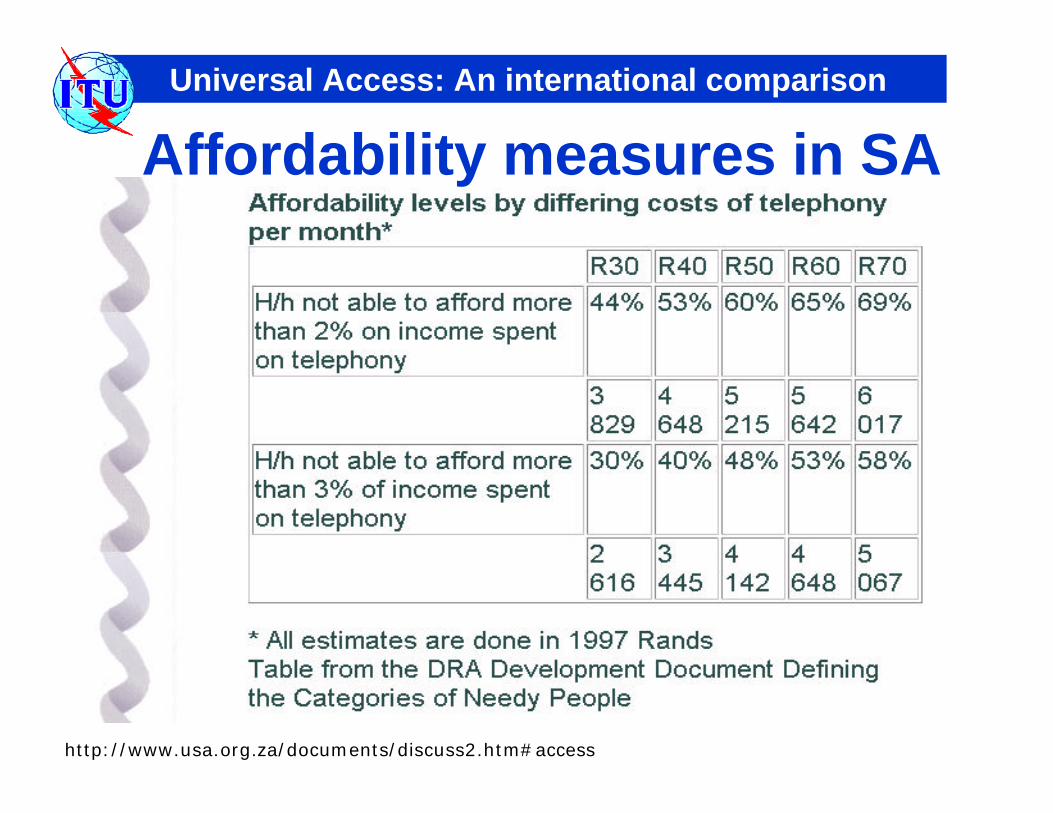
http://www.usa.org.za/documents/discuss2.htm#access
Affordability measures in SA

Universal Access: An international comparison
-
20
40
60
80
100
0% 2% 4% 6% 8% 10%Telephone charges as % of household expenditure
Per
cent
of h
ouse
hold
s w
ith
tele
phon
e
Telephone charges relative tohousehold income, 1995
Note: The annual telephone charges data are a basket based on one tenth of the installation charge, annual subscription in the largest local network, 700 local calls and 130 long-distance calls. Taxes are included.
Source: TU World Telecommunication Development Report 1998: Universal Access.

Universal Access: An international comparison
Establish average operatingcosts for telephone network
US$ 200 - 400 per subscriberper year
Derive an average tariff US$ 64 - 122 per year
Determine how manyhouseholds can afford service
Where 5% of household income> US$ 1’340 - 3’200
Choose a policy for families thatcannot afford service
Financial assistance, widespreadpayphones, etc.
Methodology for determiningaverage and best practice costs
Source: TU World Telecommunication Development Report 1998: Universal Access.
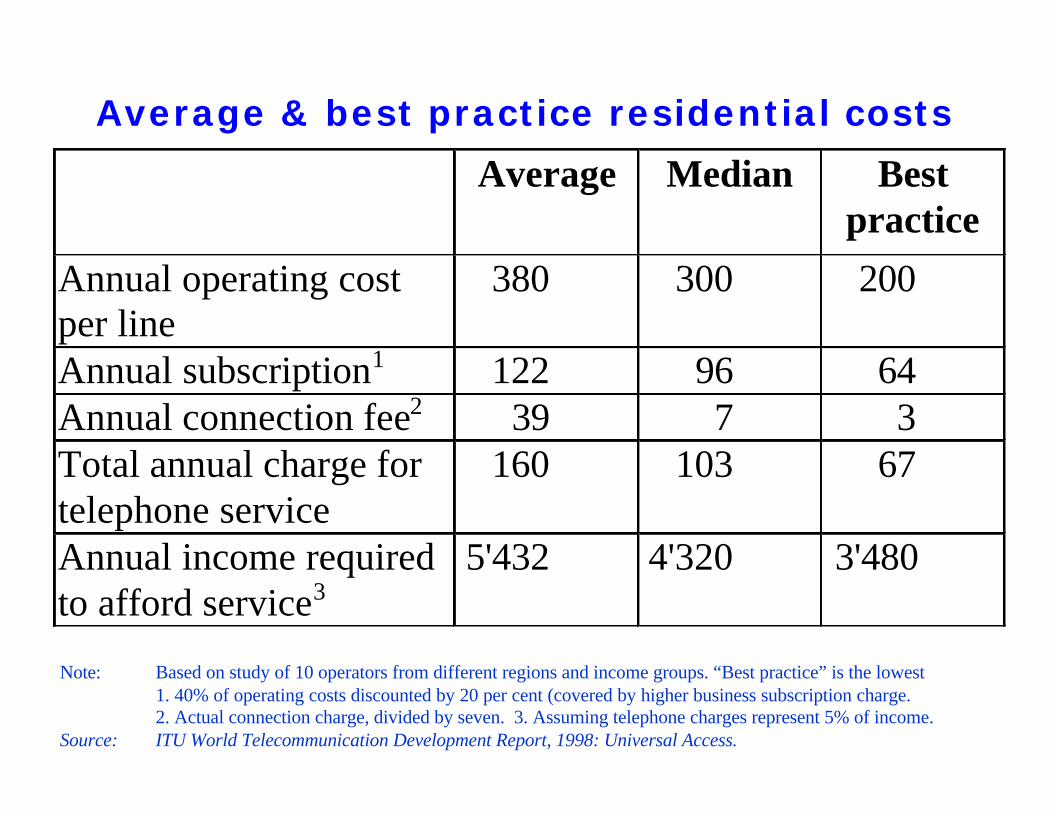
Average Median Bestpractice
Annual operating costper line
380 300 200
Annual subscription1 122 96 64Annual connection fee2 39 7 3Total annual charge fortelephone service
160 103 67
Annual income requiredto afford service3
5'432 4'320 3'480
Average & best practice residential costs
Note: Based on study of 10 operators from different regions and income groups. “Best practice” is the lowest1. 40% of operating costs discounted by 20 per cent (covered by higher business subscription charge.2. Actual connection charge, divided by seven. 3. Assuming telephone charges represent 5% of income.
Source: ITU World Telecommunication Development Report, 1998: Universal Access.

Universal Access: An international comparison
Global measures ofAffordability
Source: ITU World Telecommunication Development Report, 1998: Universal Access.
0
100
200
300
400
500
600
700
WithService
OnWaitlist
Couldafford
Couldnot
afford
~1'500 million households in the world
Without telephone service

Universal Access: An international comparison
Pricing strategies forextending Universal Accessl Installation charges initially high, but
coming down over timelResidential subscription charges should
reflect cost of servicing line (typicallyUS$5-10 per month)lSet separate charges for residential and
business subscriberslLower prices for payphone or community
telephone accesslTariff options, e.g., for low-volume users

Universal Access: An international comparison
$0
$500
$1'000
$1'500
$2'000
$2'500
'92 '93 '94 '95 '96 '92 '93 '94 '95 '960
5
10
15
20
Installation charge (left scale)
Teledensity (right scale)
Telecom Argentina TeleBrás
Installation charges and teledensityin Argentina and Brazil, US$
Source: ITU World Telecommunication Development Report, 1998: Universal Access.

… lead to fastergrowth rates
Monthly residential subscription charges, US$
$-
$2
$4
$6
$8
$10
1990 1991 1992 1993 1994 1995 1996
UruguayMalaysia
Hungary
MoroccoPercentage of households with telephone
0
10
20
30
40
50
60
70
1990 1991 1992 1993 1994 1995 1996
MalaysiaHungaryUruguay
Morocco
Higher monthlysubscription
charges ...
Source: ITU World TelecommunicationDevelopment Report, 1998: Universal Access.

Universal Access: An international comparison
Demand-side measures forextending Universal Access
lTariff cross-subsidies⇒Traditional method, but may not benefit those for
which it is intended
lUniversal Service Fund⇒Targeted assistance for special needs (e.g., rural areas,
disabled), but may create administrative burden
lDirect Financial Assistance to users⇒Targeted assistance using non-telecom-specific
criteria, but may be difficult to control abuses
lCommunity-wide initiatives⇒e.g., Payphone in every village, community

Universal Access: An international comparison
Supply-side measures forextending Universal Access
lMarket liberalisation⇒e.g., allowing new suppliers to enter market, liberalising
equipment market, giving financial autonomy to PTO,encouraging foreign investment, Build/Transfer/Operateconcessions
lPayphone liberalisation⇒e.g., permitting private installation and ownership of
payphones, community telephone shops, telecentres
lTechnical solutions⇒e.g., Mobile cellular, Wireless Local Loop, GMPCS,
combined cable TV/telephony

Universal Access: An international comparison
Pricing strategies to achieveUniversal ServicelTargeted tariff options
⇒e.g., for low-volume users, the elderly, thedisabled, foreign migrants
lPrepaid calling cards⇒for fixed-line and mobile networks
lSupport for incoming calls⇒e.g., to allow families to receive calls from
family members working abroad, for instancethrough voicemail, email, telecentres, call-turnaround, foreign sales of calling cards etc

Universal Access: An international comparison
Achieving Universal service
0%
20%
40%
60%
80%
100%
1960 1970 1980 1990 1996
France Japan
Sweden
Canada
Australia
USA
0%
20%
40%
60%
80%
100%
1970 1980 1990 1998
Mauritius
SouthAfrica
Botswana
SADC*
Percentage of households with a telephone

Universal Access: An international comparison
% of house-YearDEVELOPED holds with 90%ECONOMIES telephone reached
1 Canada 98.7 19712 United States93.9 1970 3 Australia 96.8 1986 4 Japan 96.1 † 19895 New Zealand 96.0 19766 Austria 90.0 19957 Belgium 92.0† 19948 Denmark ‡ 19829 Finland 90.0 198710 France 97.0 198511 Germany 94.7† 199512 Greece 98.1† 199313 Italy 97.5 199214 Luxembourg ‡ 198915 Netherlands 96.5 199016 Spain 94.7† 199417 Sweden ‡ 197518 UK 91.1 1994
% of house- YearDEVELOPINGholds with 90%ECONOMIES telephone reached
19 Bahrain ‡ 199220 Brunei ‡ 199321 Cyprus ‡ 199022 Hongkong ‡ 198623 Israel 95.0 198924 Korea (Rep.) 95.2 199025 Kuwait ‡ 199326 Macau ‡ 199227 Malta ‡ 198728 Qatar ‡ 198329 Singapore ‡ 198330 Taiwan-China ‡ 199031 UAE 93.5 † 1995
Note: % of households with telephone obtained fromcensus surveys and refer to year 1996. † Residentialtelephone lines per 100 households. ‡ Residentialtelephone lines per 100 households is greater than100 due to 2nd telephone lines.
Source: ITU World Telecommunication DevelopmentReport 1998.
Achieving Universal service

Universal Access: An international comparison
1996 2010 1996 2010 1996 2010
WORLD 12.80 34.4 1.55
Developing 5.07 10 16.3 >50 0.84 2 Low income 2.44 5 8.5 >20 0.57 1 excluding China 1.22 4.1 0.21
TeledensityHousehold telephonepenetration
Payphonesper 1’000people
Year 2010 GoalsGoal: Provide reasonable access to telecommunications
for all of humanity by the year 2010
Source: ITU World Telecommunication Development Report, 1998


