
Unilever Nigeria Plc
Unaudited Interim Financial Statements
For the Six Months ended 30 June 2017

Unilever Nigeria Plc
Unaudited Interim Financial Statements for the Six Months Ended 30 June 2017
Contents Page
- Income statement 2 - 3
- Statement of other comprehensive income 4
- Statement of financial position 5 - 6
- Statement of changes in equity 7
- Statement of cash flows 8
- Notes to the financial statements 9
1
Unilever Nigeria Plc
Unaudited Interim Financial Statements for the Six Months Ended 30 June 2017
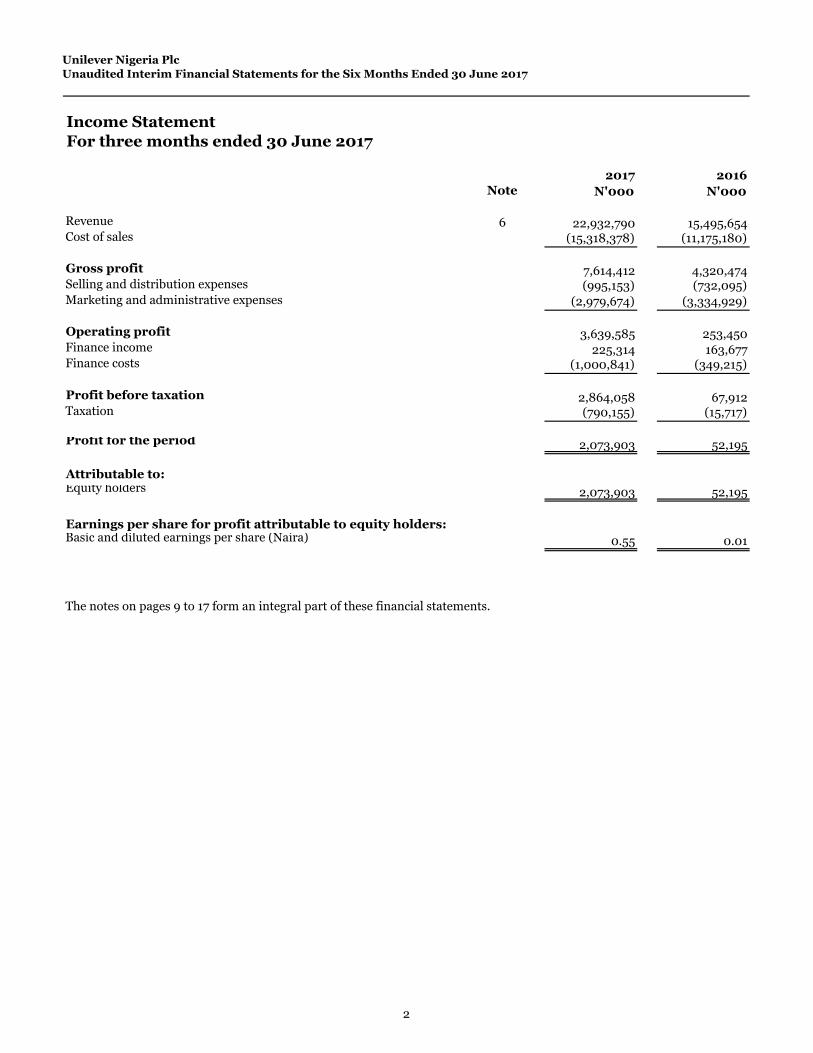
Income Statement
For three months ended 30 June 2017
2017 2016
Note N'000 N'000
Revenue 6 22,932,790 15,495,654Cost of sales (15,318,378) (11,175,180)
Gross profit 7,614,412 4,320,474Selling and distribution expenses (995,153) (732,095) Marketing and administrative expenses (2,979,674) (3,334,929)
Operating profit 3,639,585 253,450Finance income 225,314 163,677Finance costs (1,000,841) (349,215)
Profit before taxation 2,864,058 67,912Taxation (790,155) (15,717)
Profit for the period 2,073,903 52,195
Attributable to:Equity holders 2,073,903 52,195
Earnings per share for profit attributable to equity holders:Basic and diluted earnings per share (Naira) 0.55 0.01
The notes on pages 9 to 17 form an integral part of these financial statements.
2

Unilever Nigeria Plc
Unaudited Interim Financial Statements for the Six Months Ended 30 June 2017
Income Statement
For six months ended 30 June 2017
2017 2016
Note N'000 N'000
Revenue 6 45,105,104 32,277,813Cost of sales (31,197,498) (21,924,751)
Gross profit 13,907,606 10,353,062Selling and distribution expenses (1,942,193) (1,502,375) Marketing and administrative expenses 7 (5,571,070) (6,689,438)
Operating profit 6,394,343 2,161,249Finance income 8 374,977 220,856Finance costs 9 (1,725,220) (894,891)
Profit before taxation 5,044,100 1,487,214Taxation 10 (1,367,107) (393,615)
Profit for the period 3,676,993 1,093,599
Attributable to:Equity holders 3,676,993 1,093,599
Earnings per share for profit attributable to equity holders:Basic and diluted earnings per share (Naira) 0.97 0.29
The notes on pages 9 to 17 form an integral part of these financial statements.
3

Unilever Nigeria Plc
Unaudited Interim Financial Statements for the Six Months Ended 30 June 2017
Statement of Other Comprehensive Income
For three months ended 30 June 2017
2017 2016
N'000 N'000
Items that will not be reclassified to income statement:
Remeasurement on post employment benefit obligations - -
Tax effect - -
Other comprehensive income - -
Profit for the period 2,073,903 52,195
Total comprehensive income 2,073,903 52,195
Attributable to:Equity holders 2,073,903 52,195
Statement of Other Comprehensive Income
For six months ended 30 June 2017
2017 2016
N'000 N'000
Items that will not be reclassified to income statement:
Remeasurement on post employment benefit obligations - -
Tax effect - -
Other comprehensive income - -
Profit for the period 3,676,993 1,093,599
Total comprehensive income 3,676,993 1,093,599
Attributable to:Equity holders 3,676,993 1,093,599
The notes on pages 9 to 17 form an integral part of these financial statements.
4

Unilever Nigeria Plc
Unaudited Interim Financial Statements for the Six Months Ended 30 June 2017
Statement of Financial Position
As at 30 June 2017
Note
30 June 2017 31 December
2016
N'000 N'000Assets
Non-current assets
Property, plant and equipment 11 30,049,344 29,272,186
Intangible assets 823,007 940,124
Other non- current assets 96,658 140,160
Employee loan receivable 103,735 111,671
Retirement benefit surplus 17 531,273 484,621
31,604,017 30,948,762
Current assets
Assets held for sale 171,411 171,411 Inventories 12 9,825,491 9,878,499
Trade and other receivables 13 33,907,843 18,945,578
Employee loan receivable 67,736 72,918
Cash and bank balances 14 15,117,369 12,474,141
59,089,850 41,542,547
Total assets 90,693,867 72,491,309
Liabilities
Current liabilitiesTrade and other payables 15 47,680,086 32,476,502
Income tax 879,168 502,855
Bank overdrafts 14 943,807 -
Loans and borrowings 18,547,103 20,501,276
Deferred income 32,756 32,756
68,082,920 53,513,389
Non-current liabilities
Deferred tax liabilities 4,334,966 3,942,337
Retirement benefit obligations 17 2,500,059 2,613,268
Long service award obligations 17 206,867 181,166
Other employee benefits 76,044 74,150
Deferred income 46,403 62,781
Loans and borrowings 457,999 414,275
7,622,338 7,287,977
Total liabilities 75,705,258 60,801,366
5

Unilever Nigeria Plc
Unaudited Interim Financial Statements for the Six Months Ended 30 June 2017
Statement of Financial Position (continued)
As at 30 June 2017
Note
30 June 2017 31 December
2016
N'000 N'000Equity
Ordinary share capital 20 1,891,649 1,891,649
Share premium 20 45,717 45,717
Retained earnings 13,051,243 9,752,577
Total equity 14,988,609 11,689,943
Total equity and liabilities 90,693,867 72,491,309
His Majesty N.A. Achebe CFR, MNI Yaw Nsarkoh Adesola Sotande-Peters
Chairman Managing Director Finance Director
FRC/2013/NIM/00000001568 FRC/2014/IODN/00000007035 FRC/2015/ICAN/00000010834
The financial statements on pages 2 to 17 were approved for issue by the Board of Directors on 13 July 2017 and signed on
its behalf by:
The notes on pages 9 to 17 form an integral part of these financial statements.
6

Unilever Nigeria Plc
Unaudited Interim Financial Statements for the Six Months Ended 30 June 2017
Statement of Changes in Equity
For six months ended 30 June 2017
Share Share Retained
capital premium earnings Total
N'000 N'000 N'000 N'000
Balance at 1 January 2016 1,891,649 45,717 6,065,887 8,003,253
Total comprehensive income for the period
Profit for the period - - 1,093,599 1,093,599
Other comprehensive income
Remeasurement on post employment benefit obligations,
net of tax - - - -
- - 1,093,599 1,093,599
Transactions with owners
Dividend declared - - (189,165) (189,165)
Balance at 30 June 2016 1,891,649 45,717 6,970,321 8,907,687
Balance at 1 January 2017 1,891,649 45,717 9,752,580 11,689,946
Total comprehensive income for the period
Profit for the period - - 3,676,993 3,676,993
Other comprehensive income
Remeasurement on post employment benefit obligations,
net of tax - - - -
- - 3,676,993 3,676,993
Transactions with ownersDividend declared - - (378,330) (378,330)
Balance at 30 June 2017 1,891,649 45,717 13,051,243 14,988,609
The notes on pages 9 to 17 form an integral part of these financial statements.
7

Unilever Nigeria Plc
Unaudited Interim Financial Statements for the Six Months Ended 30 June 2017
Statement of Cash FlowsFor six months ended 30 June 2017
30 June
2017
30 June
2016Note N'000 N'000
Cash flows from operating activities
Cash generated from operations 18 8,046,626 8,678,098
Retirement benefits paid (441,955) (356,877)
Long service award obligations paid (5,277) (1,571)
Tax paid (598,165) (159,301)
Net cash flow generated from operating activities 7,001,229 8,160,349
Cash flows from investing activities
Interest received 374,977 220,856Purchase of property, plant and equipment 11 (1,938,990) (788,664)Proceeds from sale of property, plant and equipment 4,363 -
Net cash used in investing activities (1,559,650) (567,808)
Cash flows from financing activities
Drawdown of long-term loan 3,341,272 -
Repayment of long-term loan (217,316) (225,850)Repayment of short-term loan (5,000) -
Interest payment (1,725,220) (800,300)Dividend paid (135,895) (74,374)
Net cash flow used in financing activities 1,257,841 (1,100,524)
Net increase/(decrease) in cash and cash equivalents 6,699,421 6,492,017
Cash and cash equivalents at the beginning of the period 7,474,141 (7,100,428)
Cash and cash equivalents at the end of the period 14 14,173,562 (608,411)
The notes on pages 9 to 17 form an integral part of these financial statements.
8

Unilever Nigeria Plc
Unaudited Interim Financial Statements for the Six Months Ended 30 June 2017
Notes to the financial statements Page
General information 10
Basis of preparation 10
Significant accounting policies 10
Estimates 10
Financial risk management 10 - 11
Segment reporting 12 - 13
Marketing and administrative expenses 13
Income taxes 13
Property, plant and equipment 14
Inventories 15
Trade and other receivables 15
Cash and cash equivalents 15
Trade and other payables 15 - 16
Retirement benefit obligations 16
Cash flows from operating activities 16
Related party transactions 17
Share capital and premium 17
9

Unilever Nigeria Plc
Unaudited Interim Financial Statements for the Six Months Ended 30 June 2017
1. General information
Unilever Nigeria Plc is incorporated in Nigeria under the Companies and Allied Matters Act 1990 as a public
limited liability company and is domiciled in Nigeria. The Company's shares are listed on the Nigerian Stock
Exchange (NSE). The Company is principally involved in the manufacture and marketing of foods and food
ingredients, and home and personal care products. It has manufacturing plants in Lagos and Agbara.
2. Basis of preparation
These interim financial statements for the six months ended 30 June 2017 have been prepared in accordance with
IAS 34, ‘Interim financial reporting’. The interim financial statements should be read in conjunction with the
annual financial statements for the year ended 31 December 2016, which have been prepared in accordance with
IFRS.
3. Significant accounting policies
The accounting policies adopted are consistent with those of the previous financial year.
4. Estimates
The preparation of interim financial statements requires management to make judgements, estimates and
assumptions that affect the application of accounting policies and the reported amounts of assets and liabilities,
income and expense. Actual results may differ from these estimates.
In preparing these condensed interim financial statements, the significant judgements made by management in
applying the group’s accounting policies and the key sources of estimation uncertainty were the same as those that
applied to the financial statements for the year ended 31 December 2016.
5. Financial risk management
Financial risk factors
Unilever’s activities expose it to a variety of financial risks: market risk (foreign exchange risk), credit risk and
liquidity risk. Unilever’s overall risk management programme focuses on the unpredictability of financial markets
and seeks to minimise potential adverse effects on Unilever’s financial performance.
Risk management is carried out by a Treasury Department under policies approved by the Finance Director.
Unilever's Treasury Department identifies, evaluates and manages financial risks in close co-operation with
Unilever’s operating units. These policies are mostly Unilever Global Policies adapted for local use.
The condensed interim financial statements do not include all financial risk management information and
disclosures required in the annual financial statements; they should be read in conjunction with the Company’s
annual financial statements as at 31 December 2016. There have been no changes in the risk management structure
since year end or in any risk management policy.
5.1. Financial risk factors
(a) Market risk
(i) Foreign exchange risk
Unilever is exposed to foreign exchange risk arising from various currency exposures, primarily with respect to the
Euro and USD. Foreign exchange risk arises from future commercial transactions, recognised assets and liabilities.
The Company manages this risk mainly by hedging foreign exchange currency contracts. At 30 June 2017, the
unhedged financial assets and liabilities amounted to N13.9 billion (2016: N10 billion).
10

Unilever Nigeria Plc
Unaudited Interim Financial Statements for the Six Months Ended 30 June 2017
5. Financial risk management (continued)
5.1. Financial risk factors
(ii) Cash flow and fair value interest rate risk
2017 2016
N'000 N'000
19,005,102 20,915,551
943,807 -
19,948,909 20,915,552
(b) Credit risk
(c) Liquidity risk
Credit risk arises from cash and cash equivalents and deposits with banks and financial institutions, as well as credit
exposures to wholesale and retail customers, including outstanding receivables and committed transactions. For
banks and financial institutions, only parties classified as "International Golden Circle" (preferred choice for the
Unilever group) are accepted. Exposure limit with the banks is set at a maximum of N6.6 billion. Risk control
assesses the credit quality of wholesale customers, taking into account their financial position, past experience and
other factors. Individual risk limits are set based on internal or external ratings in accordance with limits set by the
board or external ratings. The utilisation of credit limits is regularly monitored.
Unilever’s interest rate risk arises from bank overdrafts and bank loans. Overdrafts issued at variable rates expose
Unilever to cash flow interest rate risk. Borrowings issued at fixed rates expose Unilever to fair value interest rate
risk.
Unilever analyses its interest rate exposure on a dynamic basis. Various scenarios are simulated taking into
consideration refinancing, renewal of existing positions and alternative financing. Based on these scenarios, Unilever
calculates the impact on profit and loss of a defined interest rate shift. For each simulation, the same interest rate
shift is used for all currencies. The scenarios are run only for liabilities that represent the major interest-bearing
positions.
The following table shows the split in fixed and floating rate exposures:
Fixed rate (bank loans)
Floating rates (bank overdrafts)
Concentration of credit risk with respect to trade receivables is limited, due to the Company’s customer base being
diverse. Credit terms for customers are determined on individual basis. Credit risk relating to trade receivables is
managed by reference to the customers' credit limit, inventory balance, cash position and secondary sales to final
consumers.
Liquidity risk is the risk that Unilever will face difficulty in meeting its obligations associated with its financial
liabilities. Unilever’s approach to managing liquidity is to ensure that it will have sufficient funds to meet its
liabilities when due without incurring unacceptable losses. In doing this management considers both normal and
stressed conditions. A material and sustained shortfall in our cash flow could undermine Unilever's credibility,
impair investor confidence and also restrict Unilever’s ability to raise funds.
Where current libilities exceed current assets, the Company seeks to manage its liquidity requirements by
maintaining access to bank lending which are renewable annually.
At the reporting date, Unilever held cash in bank was N15.1 billion (2016: N12.5 billion). Unilever also had N0.9
billion overdraft (2015: Nil).
11

Unilever Nigeria Plc
Unaudited Interim Financial Statements for the Six Months Ended 30 June 2017
6. Segment reporting
Food
Products
Personal
Care
Home
Care Total
N'000 N'000 N'000 N'000
Revenue 10,234,541 6,089,976 6,608,273 22,932,790
Depreciation and amortisation 319,567 190,156 206,339 716,062
Segmental operating profit 1,634,527 972,612 1,055,387 3,662,526
Finance income 225,314
Finance cost (1,000,841)
Amortisation of prepaid benefit on employee loan (22,941)
Profit before taxation 2,864,058
Revenue 8,252,660 3,517,963 3,725,031 15,495,654
Depreciation and amortisation 368,893 157,252 166,508 692,653
Segmental operating loss 138,507 59,043 62,519 260,069
Finance income 163,677
Finance cost (349,214)
Amortisation of prepaid benefit on employee loan (6,620)
Loss before taxation 67,912
Revenue 20,725,348 12,123,852 12,255,904 45,105,104
Depreciation and amortisation 582,943 341,008 344,722 1,268,673
Segmental operating profit 2,943,601 1,721,939 1,740,694 6,406,233
Finance income 374,977
Finance cost (1,725,220)
Amortisation of prepaid benefit on employee loan (11,890)
Profit before taxation 5,044,100
Revenue 16,864,992 7,915,932 7,496,889 32,277,813
Depreciation and amortisation 664,849 312,061 295,541 1,272,451
Segmental operating profit 1,136,158 533,280 505,050 2,174,488
Finance income 220,856
Finance cost (894,890)
Amortisation of prepaid benefit on employee loan (13,240)
Profit before taxation 1,487,214
The chief operating decision-maker has been identified as the Leadership Team (LT) of Unilever Nigeria Plc. The
Leadership Team reviews Unilever’s monthly financial and operational information in order to assess performance
and allocate resources. Management has determined the operating segments based on these reports. The Leadership
Team consider the business from a product category perspective. Unilever is segmented into Food Products (FP),
Personal Care (HC) and Home Care (PC) products.
Foods – including sale of tea, savoury and spreads.
Home Care – including sales of fabric care, household cleaning and water purification products.
There are no intersegmental sales and Nigeria is the company's primary geographical segment as it comprises 96% of
the company's sales.
The Leadership Team assesses the performance based on operating profits for each operating segment that is
reviewed. Total financing (including interest income and expense), income taxes and retirement benefit obligations
are managed on an entity-wide basis and are not allocated to operating segments.
Personal Care – including sale of skin care and oral care products.
3 months ended 30 June 2017
3 months ended 30 June 2016
6 months ended 30 June 2017
6 months ended 30 June 2016
12

Unilever Nigeria Plc
Unaudited Interim Financial Statements for the Six Months Ended 30 June 2017
6. Segment reporting (continued)
Domestic
(within
Nigeria)
Export
(outside
Nigeria) Total
N'000 N'000 N'000
22,694,479 238,311 22,932,790
14,825,226 670,428 15,495,654
44,343,945 761,159 45,105,104
30,919,568 1,358,245 32,277,813
7. Marketing and administrative expenses
2017 2016
N'000 N'000
Brand and marketing 1,551,168 2,127,661
Overheads 3,419,703 3,829,513
Service Fees 600,199 732,264
5,571,070 6,689,438
8. Finance income
2017 2016
N'000 N'000
Interest on call deposits and bank accounts 363,087 49,714
Exchange gain difference on bank accounts - 157,902
Interest income from employee loans 11,890 13,240
374,977 220,856
9. Finance cost
2017 2016
N'000 N'000
Interest on third party bank loans 567,561 729,135 Interest on intercompany loan 681,845 - Exchange loss difference on bank accounts 314,757 2,079 Interest cost on defined benefit plans 161,057 163,677
1,725,220 894,891
10. Income Taxes
6 months ended 30 June 2016
Income tax expense is recognised based on management’s estimate of the weighted average annual income tax rate
expected for the period. The estimated average tax rate used for the period ended 30 June 2017 is 26% (the estimated
tax rate for the six months ended 30 June 2016 was 26%).
The company has 97 customers, and no single customer accounted for more than 10% of the company's revenue.
Turnover over by geographical location
3 months ended 30 June 2017
3 months ended 30 June 2016
6 months ended 30 June 2017
13

Unilever Nigeria Plc
Unaudited Interim Financial Statements for the Six Months Ended 30 June 2017
11. Property, plant and equipment (PPE)
Capital
work-in-
progress
Lease
hold
land Buildings
Plant
and
machinery
Furniture
and
equipment
Motor
vehicles Total
N'000 N'000 N'000 N'000 N'000 N'000 N'000
Cost
At 1 January 2016 1,293,407 1,733,593 7,128,492 24,147,641 1,368,682 721,760 36,393,575
Additions 4,228,146 - - - - - 4,228,146
Transfers (1,763,662) 80,549 121,503 1,076,401 199,042 286,167 -
Disposals - - (2,595) (203) (85,560) (88,358)
Write off (2,656) - - - - - (2,656)
At 31 December 2016 3,755,235 1,814,142 7,249,995 25,221,447 1,567,521 922,367 40,530,707
Additions 1,938,990 - - - - - 1,938,990 Transfers (1,840,355) 114,504 172,627 1,270,226 217,232 65,766 - Disposals (300) -9,976 -10,276 Reclassification between PPE
heads - (1,514,563) 1,514,563 (8,370) 8,370 - -
At 30 June 2017 3,853,870 414,083 8,937,185 26,483,303 1,792,823 978,157 42,459,421
Depreciation / impairmentAt 1 January 2016 - 27,777 803,936 7,328,489 368,396 496,058 9,024,656
Depreciation charge for the year - - 208,314 1,831,950 145,797 127,383 2,313,444
Impairment charge - - - - - -
Reclassification of impairment - - - - - -
Impairment reversal - - - - - -
Disposals - - - (303) (79,276) (79,579)
At 31 December 2016 - 27,777 1,012,250 9,160,439 513,890 544,165 11,258,521
Depreciation charge for the period - (17,466) 138,406 877,396 79,641 73,579 1,151,556Reclassification between PPE
heads - - - 4,544 -4,544 - -
At 30 June 2017 - 10,311 1,150,656 10,042,379 588,987 617,744 12,410,077
Net book value:At 1 January 2016 1,293,407 1,705,816 6,324,556 16,819,152 1,000,286 225,702 27,368,919
At 31 December 2016 3,755,235 1,786,365 6,237,745 16,061,008 1,053,631 378,202 29,272,187
At 30 June 2017 3,853,870 403,772 7,786,529 16,440,924 1,203,836 360,413 30,049,344
(i) Leasehold land on finance lease
2017 2016N'000 N'000
Cost – capitalised finance leases 414,083 1,814,142
Accumulated depreciation (10,311) (27,777)
Net book value 403,772 1,786,365
The Company has non - cancellable finance lease agreements with the Federal Government of Nigeria which was paid once and in
advance. There are no finance lease liabilities and no future finance charges to the income statement.
The lease terms are between 50 and 99 years. The following amounts represents owned land where the Company is a lessee under
a finance lease:
14

Unilever Nigeria Plc
Unaudited Interim Financial Statements for the Six Months Ended 30 June 2017
12. Inventories
2017 2016N'000 N'000
Raw and packaging materials 5,884,586 6,008,148
Work in progress 387,853 563,706
Finished goods 1,594,055 1,397,021
Engineering spares and other inventories 965,996 744,396
Goods in transit 993,001 1,165,228
9,825,491 9,878,499
13. Trade and other receivables
2017 2016N'000 N'000
Trade receivables: gross 7,067,088 4,336,828
Less impairment (276,081) (307,723)
Trade receivables: net 6,791,007 4,029,105Advances and prepayments 8,690,280 3,152,550
Unclaimed dividend held with registrar 212,236 212,236
Interest receivable - 79,628Other receivables 2,007,753 1,921,107
11,574,068 9,077,172
Deposit for imports 4,632,499 473,780
33,907,843 18,945,578
14. Cash and cash equivalents
2017 2016N'000 N'000
Cash at bank and in hand 11,328,934 5,702,282
Fixed deposit 3,788,435 6,771,859
Cash and bank balances 15,117,369 12,474,141
Short term bank loan - (5,000,000)
Bank overdrafts (943,807) -
Cash and cash equivalents 14,173,562 7,474,141
15. Trade and other payables
2017 2016N'000 N'000
Trade payables 13,162,389 8,173,171 Amount due to related companies (Note 19(iii)) 25,495,409 15,998,593 Dividend payable (Note 16(i)) 2,983,259 2,990,997 Accrued liabilities 554,592 732,608 Accrued brand and marketing expenses 653,533 367,784 Accrued shipping and freight charges 503,760 581,851 Non trade payables 4,327,144 3,631,498
47,680,086 32,476,502
Due from related parties (Note 19(iii))
Advances and prepayments include insurance premium and advances to vendors.
For the purposes of the statement of cash flows, cash and cash equivalents include bank overdrafts and short term bank loan.
15

Unilever Nigeria Plc
Unaudited Interim Financial Statements for the Six Months Ended 30 June 2017
16. Trade and other payables (continued)
2017 2016N'000 N'000
(i) Dividend payable
As at 1 January 2,990,997 3,351,652 Dividend declared 378,330 189,165 Dividend paid to Registrar (378,330) (186,388)
Payment made from cash with Registrar (3,869) (184,429)
Statute barred dividend - (61,231)
Payment made from unclaimed dividend investment - (117,772)
As at 30 June/31 December 2,987,128 2,990,997
17. Retirement benefit obligations
The amounts recognised in the statement of financial position are determined as follows:
2017 2016N'000 N'000
Present value of funded retirement benefit obligations (1,417,990) (1,237,335)
Fair value of plan assets 1,949,263 1,721,956
Retirement benefit surplus 531,273 484,621Present value of unfunded retirement benefit obligations (2,500,059) (2,613,268)
Long service award obligations (206,867) (181,166)
Net liability in the statement of financial position (2,175,653) (2,309,813)
The amounts recognised within the income statement were as follows:
Current
Service Cost
Net
Interest
Cost Total
N'000 N'000 N'000
3 Months Ended 30 June 2017 73,378 80,521 153,898
3 Months Ended 30 June 2016 98,247 88,343 186,590
6 Months Ended 30 June 2017 146,755 161,041 307,795
6 Months Ended 30 June 2015 184,038 206,731 390,769
18. Cash flows from operating activities
2017 2016N'000 N'000
Profit before tax 5,044,100 1,487,214
Adjustment for non-cash items:
- Depreciation of fixed assets 1,151,556 1,155,527 - Impairment charge - 320,677
- Assets write off - 4,072 - Amortisation of intangible assets 117,117 116,924 - Loss on disposals on fixed assets 2,738 - - Finance income (374,977) (220,856)
- Finance expense 1,725,220 894,891 - Net charge in retirement benefit obligations (159,861) 325,864 - Change in employee loan receivable 13,118 26,234 - Long service award obligations 25,701 34,297
- Other employee benefits 1,894 6,571
- Deferred Income (16,378) (16,377)Changes in working capital:
- Increase in trade and other receivables (14,783,696) (4,048,930) - Increase/(decrease) in inventory 53,008 (242,390) - Increase in trade and other payables 15,203,584 8,742,248 - Decrease in other non-current assets 43,502 92,122
Cash flows generated from operating activities 8,046,626 8,678,088
16

Unilever Nigeria Plc
Unaudited Interim Financial Statements for the Six Months Ended 30 June 2017
19. Related party transactions
(i) Sale of finished goods to related parties
2017 2016N'000 N'000
Unilever Ghana Limited 218,680 364,974
Unilever Cote D'Ivoire 542,479 339,724
761,159 704,698
(ii) Purchases of finished goods for resale from related parties
2017 2016N'000 N'000
Unilever Ghana Limited 779,940 1,394,881
Unilever South Africa (Pty) Limited 159,003 -
938,943 1,394,881
(iii) Outstanding related party balances as at 30 June were:
2017 2016N'000 N'000
Receivables from related parties:
Unilever Cote D'Ivoire 6,518,544 3,446,340
Unilever Ghana Limited 3,061,803 2,136,456
Unilever UK Plc 1,903,460 293,918
Other related parties 90,261 141,812
11,574,068 6,018,526
2017 2016N'000 N'000
Payables to related parties:
Unilever UK Plc 3,859,929 1,291,290
Unilever Cote D'Ivoire 127,511 82,974
Unilever Ghana Limited 8,708,660 6,945,210
Unilever Asia Private 8,561,279 4,837,178
Unilever Finance International AG 736,080 114,138
Unilever NV 1,620,039 1,106,103
Other related parties (settlement on behalf of the Company) 1,881,911 1,621,700
25,495,409 15,998,593
20.Number of
ordinary
shares
Ordinary
shares
Share
premium(thousands) N'000 N'000
Balance as at 31 December 2016 and 30 June 2017 3,783,296 1,891,649 45,717
The authorised number of ordinary shares is 6,053,274,000 with a par value of 50kobo per share. Of these, 3,783,296,250
ordinary shares have been issued and fully paid.
Share capital and share premium
17


