
Electronic copy available at: http://ssrn.com/abstract=1263992
1
Understanding Organizational Behavior with Wearable Sensing Technology
Benjamin N. Waber, Daniel Olguín Olguín, Taemie Kim, and Alex (Sandy) Pentland
Massachusetts Institute of Technology
Media Laboratory
20 Ames St.
Cambridge, MA 02139
Tel: (617) 253-4662
Fax: (617) 253-6285
e-mail: {bwaber, dolguin, taemie, pentland}@media.mit.edu
This work was supported in part by Hitachi, Ltd., Cisco Systems, Inc., members of the MIT Media Laboratory Things That Think Consortium,
and Analog Devices, Inc. We would also like to thank Koji Ara, Emily Bromberg, Nathan Davis, Inna Koyrakh, Akshay Mohan, and Sasank Reddy for their invaluable help with this project.

Electronic copy available at: http://ssrn.com/abstract=1263992
2
Understanding Organizational Behavior with Wearable Sensing Technology
ABSTRACT
We describe how recent advances in wearable sensing technology allow for unprecedented
accuracy in studies of human behavior, particularly organizational behavior. We use one such
platform, the Sociometric badge, to understand organizational behavior in two studies. In the
first, we describe the collection of data over a period of one month in a German bank’s
marketing division. We found that physical proximity had a high negative correlation with e-
mail activity, and by combining behavioral data and electronic communication data we were able
to very accurately predict self-reports of personal and group interaction satisfaction and
performance. Next we describe an experiment at a data server configuration firm, and we
discovered behavioral variables that had extremely high correlations with objective productivity
measures. In both studies the fine-grained behavioral variables measured by the Sociometric
badge played a critical role in predicting outcomes.
3
INTRODUCTION
Studying organizational behavior in detail over long periods of time has long been a challenge to
the social science community (Baker, 2000; Cross & Parker, 2004; Aral, Brynjolfsson, & Van
Alstyne, 2006). Human observers have been employed in the past, but their observations are
subjective and it is difficult for them to remain unobtrusive in an organizational environment. In
addition, it is prohibitively expensive to employ a large number of these observers for more than
a short period of time. Surveys have also been used extensively (Barahona & Pentland, 2006),
but these too suffer from subjectivity and memory effects.
To mitigate some of these problems, e-mail and more generally electronic
communication has recently been employed to examine relationship structure (i.e. social network
structure) (Grippa, Zilli, Laubacher, & Gloor, 2006; Aral et al., 2006). This research has led to a
greater understanding of how organizations function and what management practices lead to
greater productivity, but important communications are usually face-to-face (Kirkman, Rosen,
Tesluk, & Gibson, 2004). Furthermore, recommendations based on these findings are usually
done by experts after the experiment, not in a real time fashion which is critical for many tasks.
Using only electronic communication information it is impossible to observe user
behavior in the physical world, which has been found to be highly predictive of performance and
satisfaction (Bateman & Organ, 1983). Until recently, technology to unobtrusively and
quantitatively measure behavior has been glaringly absent.
What is necessary to alleviate these problems is a device that could automatically record
the behavior of hundreds of individuals with high accuracy over long periods of time (Pentland,

4
2006). This device would replace expensive and time-consuming observational methods with
reliable and objective computer-mediated ones. This could potentially remove two large
limitations in the analysis of human behavior: the number of people that can be observed, and the
frequency with which they can be observed.
This technology would also allow for many new types of behavioral data to be collected.
Beyond purely relational data, these devices could record behaviors such as movement, location,
and speaking patterns. This may uncover new relationships between behavior and organizational
outcomes.
In this paper we introduce a wearable sensing platform and demonstrate how it can be
used to recognize and predict properties of commercial organizations. We will then examine
how this technology has yielded powerful results in two studies. We show how we can detect
and predict information overload from data collected using our sensing platform combined with
e-mail data. We also uncover four basic behaviors based on personal activity level and speaking
time that allow for extremely accurate predictions of productivity. We then discuss the
implications of this and other findings and argue for additional research employing wearable
sensors.
Wearable Computing Background
There has been extensive work in the field of wearable computing on sensing devices. Eagle and
Pentland introduced a system for sensing complex social systems with data collected from
mobile phones (Eagle & Pentland, 2006b). Similar to our approach, they demonstrated that by
using Bluetooth proximity information, they were able to recognize social patterns in daily user
5
activity, infer relationships, identify socially significant locations, and model organizational
rhythms.
Our research group (the Human Dynamics Group) at the MIT Media Laboratory has
developed several socially aware platforms to measure different aspects of social context so that
we could automate collection of face-to-face interaction data. One of these platforms was the
SocioMeter (Choudhury, 2004), which learned social interactions from sensory data and
modeled the structure and dynamics of social networks using an infrared (IR) transceiver, a
microphone, and two accelerometers. In Social Motion (Gips, 2006), Gips used IR tranceivers
and radio frequency (RF) scanners capable of detecting other devices within a fixed proximity to
infer the underlying social structure of groups of people.
The “wearable badge” form factor is particularly useful in organizational contexts. First,
most organizations already require individuals to wear identification badges that have RFID tags
embedded in them in the workplace. It is not hard to extend the sensing functionality of these
badges further with accelerometers, IR transceivers, and microphones. Second, wearable badges
are less obtrusive than sensors that have to be in physical contact with the user or require a long
setup period to function. The success of products that employ this form factor for wearable
sensors, such as the nTag (http://www.ntag.com/) and Vocera systems (http://www.vocera.com/)
implies that this technology is broadly acceptable to users in a wide variety of contexts.
We have created a wearable Sociometric badge that has advanced sensing, processing, and
feedback capabilities (Olguin Olguin, 2007). In particular, the badge is capable of:
Recognizing common daily human activities (such as sitting, standing, walking, and
running) in real time using a 3-axis accelerometer (Olguin Olguin & Pentland, 2006).
6
Extracting speech features in real time to capture nonlinguistic social signals such as
interest and excitement, the amount of influence each person has on another in a social
interaction, and unconscious back-and-forth interjections, while ignoring the words
themselves in order to assuage privacy concerns (Pentland, 2005).
Performing indoor user localization by measuring received signal strength and using
triangulation algorithms that can achieve position estimation errors as low as 1.5 meters,
which also allows for detection of people in close physical proximity (Sugano, Kawazoe,
Ohta, & Murata, 2006; Gwon, Jain, & Kawahara, 2004).
Communicating with Bluetooth enabled cell phones, PDAs, and other devices to study
user behavior and detect people in close proximity (Eagle & Pentland, 2006a).
Capturing face-to-face interaction time using an IR sensor that can detect when two
people wearing badges are facing each other within a 30°-cone and one meter distance.
Choudhury (Choudhury, 2004) showed that it was possible to detect face-to-face
conversations of more than one minute using an earlier version of the Sociometric badge
with 87% accuracy.
This represents a fundamental shift from earlier work in organizational behavior, since with this
technology we are able to objectively quantify behavior at a level of detail unimaginable just a
few years ago. In addition, we can examine radically different behavioral features than is
possible using traditional observational and survey methods.
The management and psychology fields have not extensively studied objective behavioral
and conversational data such as the kind we present here due to the lack of tools with which to
measure such quantities. Therefore we must carefully define what we consider “communication”
in order to place our results in the context of previous work.
7
Organizational Behavior Background
There are several environmental, organizational, and psychological factors that affect face-to-
face communication. For instance, Zahn (Zahn, 1991) studied the effects of hierarchical
relationships and physical arrangements on face-to-face communication in an office environment.
Mutual exposure and physical distance were used as predictors of communication time.
Electronic communication channels, which include telephone, fax, e-mail, instant
messaging, and video conferencing, have also been examined. Most previous studies have
attempted to extract social network structures by looking at e-mail only (Bird, Gourley, Devanbu,
Gertz, & Swaminathan, 2006). However, (Grippa et al., 2006) compared the social networks
implied by four different media: e-mail, face-to-face, chat, and phone in order to identify to what
extent the network implied by e-mail differs from the network implied by other communication
media. They found that e-mail alone defined 72% of a social network’s density, the total number
of edges implied by merging email and chat explained 85% of the overall network density, and
the complete network’s density was entirely described by combining e-mail and face-to-face
communication.
Many researchers have focused on a quantity that has been found to be closely related to
communication: task interdependence (Wageman, 1995). Task interdependence is defined as the
degree to which individuals must cooperate with other people to complete a task (Van der Vegt
& Van de Vliert, 2002). Task interdependence has frequently been linked to outcome
interdependence, i.e. the degree to which the rewards of individuals are based on the
performance of the group as a whole (Van der Vegt & Van de Vliert, 2002). One of the key
findings in the literature is that when task and outcome interdependence are not congruous (e.g.

8
highly interdependent tasks are coupled with low interdependent outcomes) then performance
decreases (Van der Vegt & Van de Vliert, 2002).
There are conflicting results in the literature when examining the relationships between
task interdependence, job satisfaction, and performance. While Brass (Brass, 1985) found a
negative correlation between task interdependence and these features, Kiggundu (Kiggundu,
1981) found a positive correlation. Van der Vegt and Van de Vliert (Van der Vegt & Van de
Vliert, 2002) suggest that this may be due to differences in the organizations they studied in
terms of their outcome interdependence levels.
There has also been substantial research on the effect of official role on job performance
and satisfaction (Pruden & Reese, 1972; Dyne & Ang, 1998; Kalleberg, 2000). However, the
effects of the social role of employees have not been thoroughly studied. Social role is often
represented by the centrality of individual employees in the social network. There are multiple
measures of centrality: in-degree, out-degree, betweenness, and closeness (Cross & Parker,
2004). We chose to use betweenness as our centrality measure because betweenness measures
the extent to which an individual can play the part of a “broker” or “gatekeeper” with the
potential to exert social control over others (Scott, 2006).
The relationship of betweenness with job performance has not always been consistent in
the literature. (Roberts & O'Reilly, 1979; Baldwin, Bedell, & Johnson, 1997; Mehra, Kilduff, &
Brass, 2001; Cross & Parker, 2004) all found a positive relationship between network centrality
and individual performance. However, (Sparrowe, Liden, Wayne, & Kraimer, 2001) found that
this depended on the type of communication network: advice network or hindrance network.
Advice networks are comprised of relations through which individuals share resources such as

9
information, assistance, and guidance that are related to the completion of their work. Hindrance
networks exhibit negative exchange relations with behaviors such as interference, threats,
sabotage, and rejection (Sahlins, 1972) as well as affective responses to such behaviors,
including annoyance and anger (Pagel, Erdly, & Becker, 1987). Through an experimental study
Sparrowe found individuals who were central in their work group’s advice networks had higher
levels of performance than individuals who were not central players in such a network. In
contrast, individuals who were central in a hindrance network had lower levels of performance
(Sparrowe et al., 2001).
Roberts and O’Reilly (Roberts & O'Reilly, 1979) examined the relationship of
betweenness with job satisfaction and found that peripheral actors had less satisfaction than those
with two or more links. Freeman (Freeman, 1977) states that participants in an organization are
sensitive to their roles as relayers or coordinators of information vital to the solution of problems.
People who are intermediaries pass messages and gain a sense of importance in contributing to a
solution, leading them to higher satisfaction levels: the greater the betweenness, the greater their
sense of participation and potency (Freeman, 1977). However (Baldwin et al., 1997) found that,
similar to job performance, job satisfaction is positively correlated with advice network features,
but is negatively correlated with friendship or hindrance network features.
METHODOLOGY
Detecting Face-to-Face Interactions
IR can be used as a proxy for the detection of face-to-face interaction between people. In order
for one badge to be detected through IR, two Sociometric badges must have a direct line of sight

10
to each other. The receiving badge's IR sensor must be within the transmitting badge's IR signal
cone of height less than one meter and radius r such that:
for the IR sensor described above. Figure 1 shows a receiving badge's IR sensor within the
specified range. Every time an IR signal is detected by a badge we say that face-to-face
interaction may occur.
Figure 1: Face-to-face interaction is detected when the receiving badge’s IR sensor is within the
transmitting badge’s IR signal cone.
We define the total amount of face-to-face interaction time per person as the total number
of consecutive IR detections per person multiplied by the IR transmission rate, which in our
experiments was once every two seconds.
Measuring Physical Proximity and Location Using Bluetooth
Sociometric badges can detect other Bluetooth devices in close proximity in an omni-directional
fashion (within a 10 meter radius). In the past, this functionality has been used to identify
location, behavioral patterns, and social ties (Eagle & Pentland, 2006a). It is possible to
determine approximate location from base stations and other mobile badges using Bluetooth
technology. If a person is detected within the Bluetooth transceiver's range, it does not

11
necessarily mean that they are interacting with each other. However we can ascertain that they
are in close proximity to each other, easily reachable for face-to-face interaction.
Initially we hypothesized that Bluetooth detections could be used to recognize office
level locations and conversational groups. However the large range of the Bluetooth receivers
made this task extremely difficult, limiting the resolution of our data. This has caused us to take
a different approach to the analysis. Since closer devices are detected more often, we say that
two people are in close proximity to each other only if their Bluetooth IDs are detected for more
than 15 minutes during one hour. In our experiments, each badge was detectable over Bluetooth
every ten seconds, and each badge performed a Bluetooth scan every five seconds. This
accounts for the limited Bluetooth detection rate.
Detecting Physical Activity Levels
The badge’s 3-axis accelerometer signal is sampled at fs = 250 Hz, which should be able to
capture the range of human movement and could be as low as 30 Hz since 99% of the
acceleration power during daily human activities is contained below 15 Hz (Mathie, Coster,
Lovell, & Celler, 2004). The range of values for the accelerometer signal varies between -3g and
+3g, where g = 9.81 m/s2 is gravitational acceleration. To normalize the signals, a calibration
procedure is necessary to obtain the absolute value of gravity and the zero gravity point g0. To
obtain these values we slowly rotated one badge in all directions.
The accelerometer samples recorded from each badge ai are normalized as follows:

12
The acceleration Signal Vector Magnitude (SVM) provides a measure of the degree of
movement intensity that includes the effect of signal variations in the three axes of acceleration
(Karantonis, Narayanan, Mathie, Lovell, & Celler, 2006). The SVM is calculated on the
normalized ith
acceleration sample as follows:
To distinguish between periods of activity and rest the average SVM is calculated over one-
minute segments:
where T = 60 is the time segment (in seconds) over which the average SVM is calculated, and k
= 1...K is the number of minutes a person was wearing the badge during the day. When the
badge is not being worn SVM(k) ≤ 1, since only the component of gravitational acceleration is
detectable. Individual daily activity level is defined as the average SVM(k) score over the entire
day, and we define average energy as the average SVM(k) score over a specific period of time.
The standard deviation of energy is similarly the standard deviation of SVM(k) over a specific
period of time.
Detecting Speech and Conversations
Objective social signaling measures based on non-linguistic vocal attributes to determine social
context have been developed within our research group (Pentland, 2005). We take a similar
approach to characterize the interaction between individuals and determine the percentage of
13
time that an individual is engaged in a conversation. By examining the variation in pitch and
volume in the audio signal, we are able to distinguish speaking from non-speaking signals
(Koyrakh, Waber, Olguin Olguin, & Pentland, 2008).
We are also able to detect conversations by using the mutual information (MI) between
the speaking and non-speaking signals of many subjects (Koyrakh, Waber, Olguin Olguin, &
Pentland, 2008). By using proximity information derived from our Bluetooth and 2.4 GHz
radios, we are also able to distinguish between phone conversations and face-to-face interactions,
although in our analysis we ignore phone conversations because of the scarcity of this kind of
data.
E-mail Analysis
E-mail has been frequently used to measure social ties between individuals (Aral et al., 2006).
Not only is it easy to measure, but in the modern workplace employees are interacting with each
other more and more frequently through e-mail. This data is also easily quantifiable, since we
know exactly who sent an e-mail to whom and when. Because e-mail only captures digital
interactions, it is unclear whether this accurately represents “real world'' interactions. In our
analysis we compare and combine e-mail data with the data collected by the Sociometric badges.
In general, large scale unidirectional e-mails have little value when analyzing one-on-one
interaction. Therefore we only consider reciprocated e-mails when examining relationships
between individuals.
Combining Face-to-Face and Electronic Communication
A key methodological question is how to combine social network data from multiple sources, for
instance it is unclear how many e-mails are equivalent to face-to-face interactions detected over

14
IR. However, if we normalize the values such that the greatest number of monthly pairwise (IR
detections)/(e-mails) is 1, then we can posit that this will offer a better solution than simply
adding the two adjacency matrices together. Ideally, we would use a weighting factor that would
discount the e-mail ties by some multiplicative factor because of the intuition that e-mail
indicates weaker social ties than face-to-face interaction, but currently we cannot justify
choosing a particular factor. We remove mass e-mails and individuals in the “cc” field, since
this does not represent the kind of social information we would like to capture. As a default, we
define “total communication'' as the sum number of IR detections and e-mail exchanges. In
future work we plan to study this relationship in greater detail.
Relational Data Analysis
Relational data (i.e. IR detections, e-mail exchanges, Bluetooth proximity) must be placed into
an adjacency matrix in order to analyze it under a social network framework. In relational data
there are two participants: a sender i and a receiver j. We define the matrix A with elements aij
such that:
where aij is the amount of communication measured between i and j. This procedure creates a
symmetric matrix and a social network representation.
We define the “betweenness'' of a node o in a social network as the proportion of all paths
between any two nodes in the network that pass through o (Scott, 2006). Mathematically, we
have:

15
where αvt is the number of unique paths in the social network from node v to node t that pass
through o and bo is the betweenness of o.
STUDY 1: GERMAN BANK
We deployed the research platform described above for a period of one month (20
working days) in the marketing division of a bank in Germany that consisted of 22 employees
distributed into four teams. Each employee was instructed to wear a Sociometric badge every
day from the moment they arrived at work until they left their office. In total we collected 2,200
hours of data (100 hours per employee) and 880 reciprocal e-mails. We obtained these e-mail
logs as well as self-reported individual and group performance satisfaction data as part of a case
study on the impact of electronic communications on the business performance of teams (Oster,
2007). This data gave us a very detailed picture of the inner operations of the division.
The employee pool had exactly the same number of men as women, but all of the
managers were men. The division contained four functional teams consisting of either three or
four employees. Each of these teams was overseen by a manager, who was in turn supervised by
a mid-level manager. These mid-level managers were responsible for two teams, and they
reported directly to the division manager. The division's organizational chart is shown in figure 2.

16
Figure 2: Organizational chart of the German bank’s marketing division
The bank division itself also had a very interesting physical layout. The division was split
across two floors, and some teams were co-located in a single room while others had employees
from multiple teams in them. There were 6 rooms on the second floor and 4 rooms on the third
floor. In fact, one of the reasons this division took such an interest in the experiment was to
determine precisely what effect this physical layout had on the interactions that occurred within
the division.
Experimental Procedure
The Sociometric badges logged IR detections (containing the transmitting badge's ID) every time
they were facing other badges, Bluetooth devices' IDs, motion data from the accelerometer, and
audio signals. The audio signal was sampled at 8 kHz and averaged over 64 samples so that the
raw speech signal could not be reconstructed in order to maintain privacy. All collected data was
anonymized and each participant had access only to their own data upon request.
In addition to the 22 wearable badges, 14 badges were used as base stations and placed in
fixed locations across two floors of the bank's building to roughly track the location of
interaction events as well as subjects. Base stations were continually discoverable over Bluetooth.

17
A central computer was used for data collection and was placed in the division's conference
room, where employees could easily retrieve their badges when they arrived and plug them into a
USB hub before they left for the day. This operation allowed data to be automatically transferred
via the badge's USB port and securely uploaded to a server in our laboratory once a day, while at
the same time recharged the badge's battery. In this experiment we used e-mail as a
representative proxy for electronic communication since it was the most frequently used means
of communication among employees in this organization. In future experiments we plan to
incorporate other electronic communication channels into our analysis.
At the end of each day employees were asked to respond to an online survey that
included the following questions:
Q1. What was your level of productivity today?
Q2. What was your level of job satisfaction today?
Q3. How much work did you do today?
Q4. What was the quality of your group interaction today?
We modeled our questions on those that are frequently used in the literature (Van der Vegt &
Van de Vliert, 2002). Each question could be answered according to the following 5-point scale:
(1 = very high) (2 = high) (3 = average) (4 = low) (5 = very low). In our analysis below we
flipped the scale (i.e. |previous value - 6|) for ease of interpretation. Each person had to enter
their badge number when they answered the survey. In the following sub-sections we list our
hypotheses with regards to this experiment and describe our results.
Hypotheses
18
There is a large amount of research that assumes that face-to-face and electronic communication
are equivalent (Aral et al., 2006). Therefore, we hypothesize that:
Hypothesis 1: The greater the amount of face-to-face interaction an individual has the
greater amount of electronic communication they have.
There has been extensive research on the occurrence of communication overload and its
effects (Gardner & Winder, 1998; Baum, Calesnick, Glenn, & Gatchel, 1982; Johansen, Vallee,
& Spangler, 1979; Kerr & Hiltz, 1982; Hiltz & Turoff, 1985). Individuals who become
overloaded with communication responsibilities have difficulty focusing on the tasks at hand and
coping with their other responsibilities (Kerr & Hiltz, 1982). Subsequently, their overall level of
satisfaction with their situation will decrease (Gardner & Winder, 1998). If we are able to
capture both face-to-face and electronic communication, then we should be able to gauge the
degree of communication overload experienced by an individual. This leads us to:
Hypothesis 2: The greater the amount of total communication an individual has the lower
level of satisfaction the individual will have.
Similarly, Brass found that people with higher betweenness had lower levels of
satisfaction (Brass, 1981). Brass explains this negative correlation by the strong relationship
between job satisfaction and job characteristics, such as autonomy and task variety. Since
individuals with low centrality tend to be in jobs with high autonomy and low task
interdependencies, individual compensation structures are more pleasing (Van der Vegt, Emans,
& Van de Vliert, 2002). Hence we posit:
Hypothesis 3: The more central an individual is in an organization, the lower their level
of satisfaction will be.

19
Results
Over the course of the experiment, the average number of different people in close proximity to
an individual per hour was measured using the method described in the methodology section
above. The range of values for this measure was 0.13 to 4.12 people per hour. The total number
of e-mail exchanges during the study was in the range of 15 to 149.
We found that the overall number of people in close proximity had a high negative
correlation with the number of e-mails exchanged (r = -0.55, p < 0.01). We also found no
significant correlation between face-to-face interactions detected over IR and e-mail activity.
Consequently the greater the number of people who are in close proximity to an individual, the
lower volume of electronic communication the individual will have. This is contrary to H1.
However, when we restricted attention to same-status individuals (employee-employee,
manager-manager) that were proximate to each other we obtained a high correlation between
these quantities (r = 0.65, p < 0.001). This has powerful implications for previous work that has
used e-mail communication as a proxy for the social network of an organization, since in the past
e-mail has been used as a proxy for all communication channels (Aral et al., 2006). Thus it may
be that only in very “flat” organizations is e-mail a reasonable proxy for face-to-face interactions.
When we examined the total communication (e-mail and face-to-face) of each individual,
we found that it had a very high correlation with monthly averages of questions Q2 (job
satisfaction) and Q4 (group interaction satisfaction) in the survey described in the experimental
procedure section above (r = −0.48, −0.53, and p < 0.05 in both cases). This is consistent with
hypothesis 2, namely that as an individual engages in more and more communication, their
satisfaction level decreases. It is important to note that this relationship was not found when
examining face-to-face and e-mail data separately; the data had to be combined. This result

20
stresses the importance of capturing face-to-face communication, since if only e-mail data is
collected significant measures of social context are lost.
We also found that total communication betweenness was highly negatively correlated
with the monthly average of Q4 (group interaction satisfaction) (r = -0.49, p < 0.05) and
therefore is consistent with hypothesis 3. While we also found this negative relationship between
total communication and Q4, total communication betweenness and total communication were
not significantly correlated. It should also be noted that betweenness was not correlated with
performance. In line with the results of hypothesis 2, this strong negative correlation was found
only in the communication network of total communication, not in separate observations of face-
to-face and e-mail. Hence we can understand that the individual's role in the communication
network, including both co-present and electronic communication, is a strong indicator of an
employee's satisfaction level.
A multi-linear regression was fit to model question Q4 (group interaction satisfaction)
using total communication and total communication betweenness. The results are listed below in
table 1. The combination of these two measures has good explanatory power, although their
coefficients were both only close to significance.
Total Model: r = 61, F = 5.40 (p = 0.01), N = 22
Variable β p
Intercept 3.81 < 0.0001
Total Communication
Betweenness
-0.19 0.12
Total Communication -0.17 0.06
Table 1: Multi-linear regression for Q4.
21
Discussion
We can attribute the negative correlation between proximity and e-mail to several factors. First,
if you are in close proximity to another individual, it may make more sense to interact with them
in the real world rather than to send them an e-mail. Second, proximity information also picks
up on informal relations, while in this particular organization e-mail is used mainly for business
purposes. Therefore wearable sensing technology is required in order to have a full view of the
social network.
The fact that total communication had moderately high correlations with job and group
interaction satisfaction seems to imply that this organization exhibits low outcome
interdependence and is a competitive context (Van der Vegt & Van de Vliert, 2002; Tjosvold,
1989).
Our confirmation of hypothesis 3, particularly with regards to group interaction
satisfaction, indicates that groups in this organization require dense communication. Individuals
that span multiple groups would therefore be in an uncomfortable position that required them to
spend too much time coordinating between these groups. Another explanation is that individuals
have different task dependencies that may conflict with those of the people that they work with.
We can then view social connections in this conflicting sense as belonging to a hindrance
network, while those that connect two individuals with similar tasks dependencies belong to an
advice network (Sparrowe et al., 2001). This nicely agrees with our finding that betweenness in
this combined network did not have a significant correlation with job performance, since
Sparrowe’s work implies that an organization without strong advice or hindrance networks will
not have actors of high betweenness that are also highly productive (Sparrowe et al., 2001).
STUDY 2: CHICAGO DATA SERVER CONFIGURATION FIRM
22
The results that we obtained from study 1 were extremely interesting, but we also wanted to see
how these relationships played out at a finer grained level. We can ask, for instance, if
communication during a critical task significantly impacts performance, versus communication
over longer periods of time. Below we present details of this fine-grained analysis, but we are in
the process of analyzing this data at a higher level as well.
We deployed our Sociometric badge platform described above for a period of one month
(20 working days) at a Chicago-area data server configuration firm that consisted of 28
employees, with 23 participating in the study. Each employee was instructed to wear a
Sociometric badge every day from the moment they arrived at work until they left their office.
In total we collected 1,900 hours of data, with a median of 80 hours per employee. All of these
employees were male, and since this was a recently formed department none had been employed
for over a year. Still, there were five recognized experts, and in our analysis we controlled for
skill level differences. Electronic communication was not extensively utilized in this firm for
task-related communication, so we did not collect this data. Now we will explain the actual task
structure for these employees, and in the analysis below we examine employee behavior at the
task level rather than at the individual level. This allows for a much finer-grained analysis than
would otherwise be possible.
Task Structure and Productivity Data
Salesman in the field used an automated program to request a computer system configuration for
a potential customer. These configurations are automatically assigned a difficulty (basic,
complex, or advanced, in ascending order of difficulty) based on the configuration characteristics.
Employees in the department are then assigned a configuration task in a first come first served

23
fashion. This configuration task may require them to use a computer aided design (CAD)
program in order to satisfy the customer’s needs. Finally, the employee submits the completed
configuration as well as price back to the salesman, and the employee is placed at the back of the
queue for task assignment. The exact start and end time of the task is logged, and the number of
follow-ups that are required after the configuration is completed is also recorded in the database.
We were able to obtain this data in addition to the badge data, although in our analysis we only
examined tasks where the employee was wearing the Sociometric badge for the entire task
duration.
We omitted tasks that took no time to complete, as this was due to preconfigured systems
being purchased rather than actual work by the employee. We also omitted instances where an
employee only completed one task in the available data, since then we were unable to control for
behavioral differences in our analysis. In our final dataset we have 133 basic tasks, 8 complex
tasks, and 29 advanced tasks. In our analysis we only consider basic tasks, although we note that
both complex and advanced tasks exhibited similar trends with the basic tasks.
Hypotheses
Initial examination of the data showed four clusters of behavior:
1. Low variation in physical activity, no speaking
2. Low variation in physical activity, speaking
3. High variation in physical activity, no speaking
4. High variation in physical activity, speaking
Here “low variation” is when the standard deviation of energy was below the mean, whereas in
“high variation” it was above the mean. There were 60 tasks in group 1, 19 tasks in group 2, 22
24
tasks in group 3, and 32 tasks in group 4. Note that variation in physical activity, as well as
speaking/not speaking behavior, was not correlated with the average activity level.
Variation in activity level is known to be an indicator of activation of the autonomic nervous
system, commonly known as the “fight or flight system” (Eston, Rowlands & Ingledew, 1998;
Sung, Marci & Pentland, 2005; Stoltzman, 2006). The “nervous energy” of an active autonomic
nervous system spills over into more frequent body movements, more frequent gestures, as well
as more frequent vocalizations (Valbonesi et al., 2002). Activation of the autonomic nervous
systems is also an important indicator of stress (Picard, 1997). The negative relationship
between stress and productivity is well documented (Karasek & Theorell, 1992). Therefore we
hypothesize that:
Hypothesis 4: Behavioral clusters 1-4 will exhibit completion times and follow-ups that
increase according to group number.
Another way to phrase hypothesis 4 is that group 1 will have the shortest completion times and
the fewest number of follow-ups, group 2 will have the second shortest completion times and the
second lowest number of follow-ups, and so on.
Results
We processed the Sociometric badge data from this experiment as described above. All data was
analyzed on a per-minute basis, since we wanted to control for the effects of task length. We
also controlled for differences in personal skill and behavioral tendencies by normalizing the
extracted features by each individual’s per-minute averages for basic tasks. Therefore, we are
not comparing whether individuals with certain behavioral signatures are more effective, but
25
rather whether increases or decreases of a certain behavior in any individual indicate increased or
decreased performance.
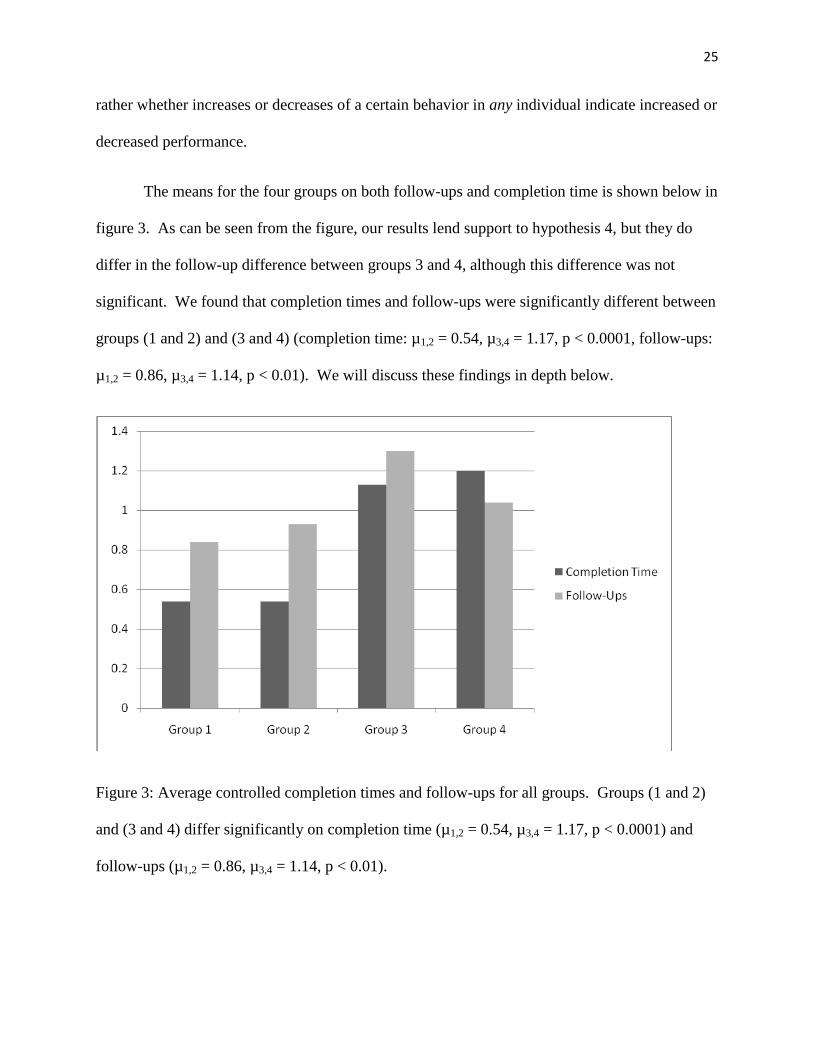
The means for the four groups on both follow-ups and completion time is shown below in
figure 3. As can be seen from the figure, our results lend support to hypothesis 4, but they do
differ in the follow-up difference between groups 3 and 4, although this difference was not
significant. We found that completion times and follow-ups were significantly different between
groups (1 and 2) and (3 and 4) (completion time: µ1,2 = 0.54, µ3,4 = 1.17, p < 0.0001, follow-ups:
µ1,2 = 0.86, µ3,4 = 1.14, p < 0.01). We will discuss these findings in depth below.
Figure 3: Average controlled completion times and follow-ups for all groups. Groups (1 and 2)
and (3 and 4) differ significantly on completion time (µ1,2 = 0.54, µ3,4 = 1.17, p < 0.0001) and
follow-ups (µ1,2 = 0.86, µ3,4 = 1.14, p < 0.01).
26
Over all behavioral groups, completion time has a high significant correlation with the
standard deviation of activity (r = 0.50, p < 0.001). However, this effect is not apparent at lower
activity levels, and we speculate that there is a threshold effect whereby variation in activity level
is correlated with completion time only when the amount of variation exceeds a baseline amount.
This relationship between completion time and variation in activity is also shared by variation in
speaking behavior, as cases in which the subject spoke to others had a much higher correlation
with completion time (r = 0.59, p < 0.00005) than cases in which the subject did not speak to
others (r = 0.39, p < 0.001). However this apparent relationship may be due to having many
more low-activity non-speaking cases.
We also discovered that overall the number of follow-ups is highly correlated with
completion time (r = 0.57, p < 0.001). This effect is much stronger in non-speaking cases (r =
0.67, p < 0.00005) than in speaking cases (r = 0.45, p < 0.001). This has huge practical
implications, since predicting follow-ups is extremely important in this organization for
understanding how employee time will be allocated in the near term. We discuss why this effect
may be present below, but further study on this finding is certainly warranted and necessary to
determine the precise underlying causal factors.
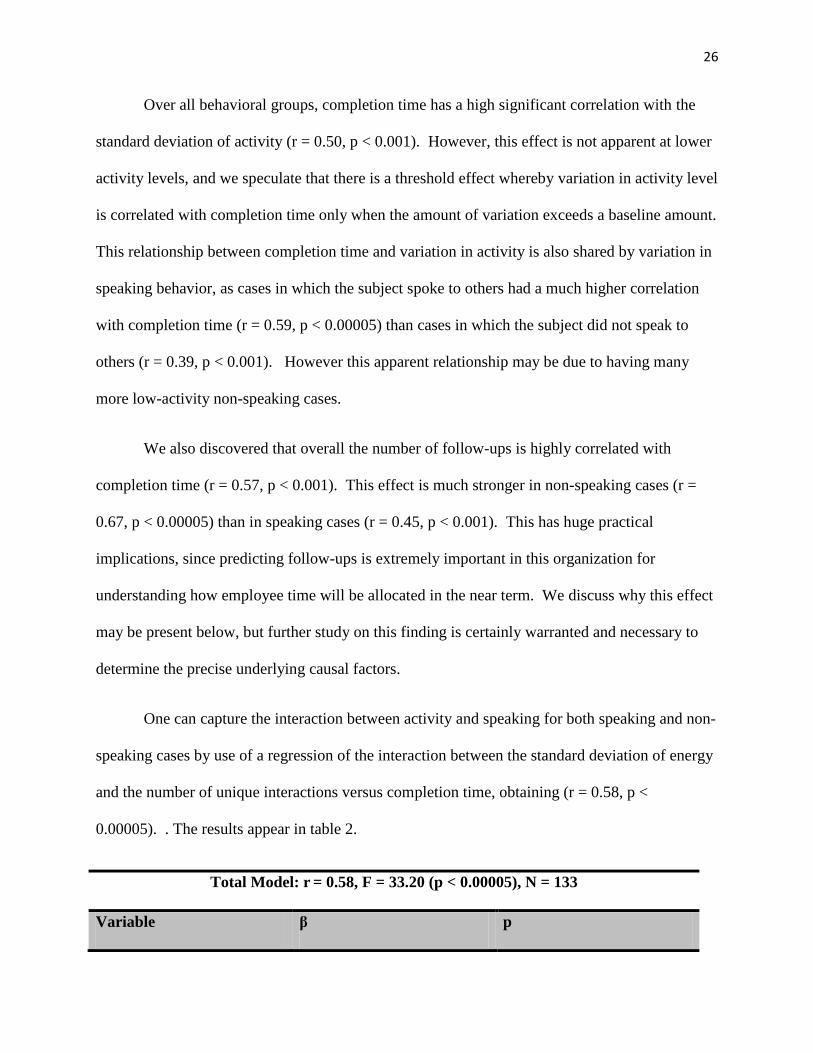
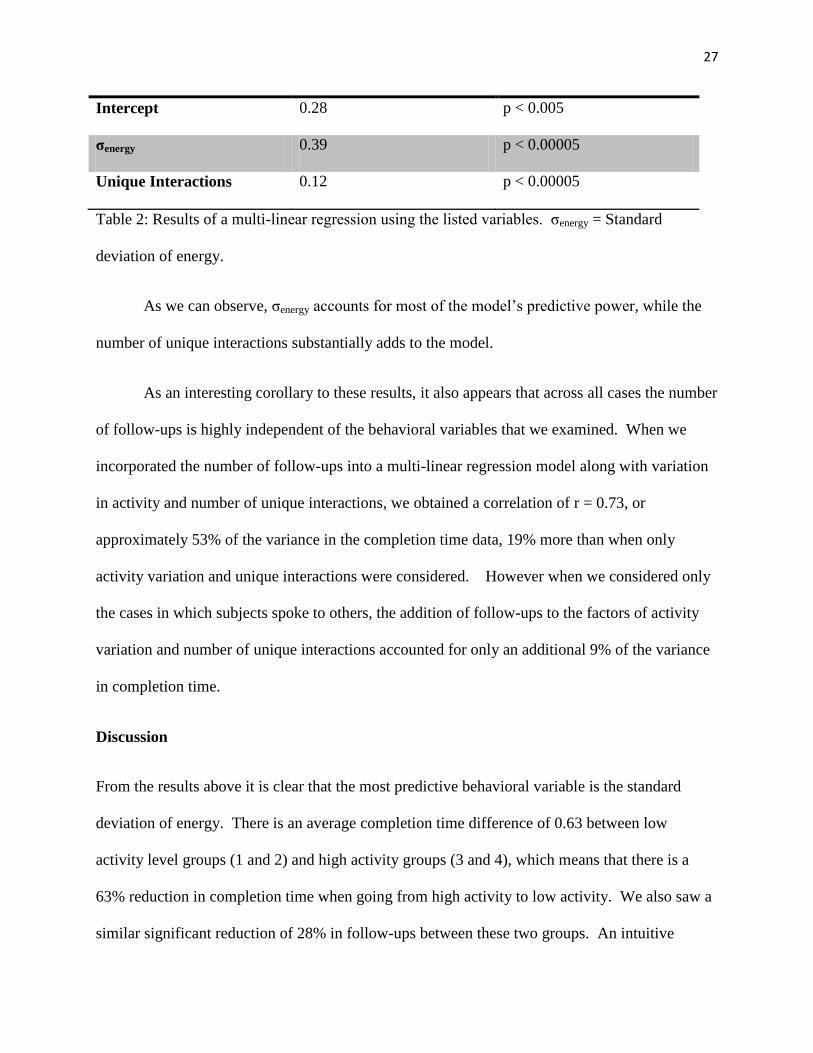
One can capture the interaction between activity and speaking for both speaking and non-
speaking cases by use of a regression of the interaction between the standard deviation of energy
and the number of unique interactions versus completion time, obtaining (r = 0.58, p <
0.00005). . The results appear in table 2.
Total Model: r = 0.58, F = 33.20 (p < 0.00005), N = 133
Variable β p
27
Intercept 0.28 p < 0.005
σenergy 0.39 p < 0.00005
Unique Interactions 0.12 p < 0.00005
Table 2: Results of a multi-linear regression using the listed variables. σenergy = Standard
deviation of energy.
As we can observe, σenergy accounts for most of the model’s predictive power, while the
number of unique interactions substantially adds to the model.
As an interesting corollary to these results, it also appears that across all cases the number
of follow-ups is highly independent of the behavioral variables that we examined. When we
incorporated the number of follow-ups into a multi-linear regression model along with variation
in activity and number of unique interactions, we obtained a correlation of r = 0.73, or
approximately 53% of the variance in the completion time data, 19% more than when only
activity variation and unique interactions were considered. However when we considered only
the cases in which subjects spoke to others, the addition of follow-ups to the factors of activity
variation and number of unique interactions accounted for only an additional 9% of the variance
in completion time.
Discussion
From the results above it is clear that the most predictive behavioral variable is the standard
deviation of energy. There is an average completion time difference of 0.63 between low
activity level groups (1 and 2) and high activity groups (3 and 4), which means that there is a
63% reduction in completion time when going from high activity to low activity. We also saw a
similar significant reduction of 28% in follow-ups between these two groups. An intuitive
28
explanation of these results is that when more difficult jobs come, employees respond with
arousal of their autonomic nervous system response, resulting in an increased number of bursts
of activity and speaking behavior. In plain English, it may be that when a difficult task presents
itself the employee responds by searching through books for information that would be helpful to
complete the task and talking to others for advice.
What we see from the findings above is that there appear to be three behavioral factors
that mediate performance: interpersonal, individual, and task.
Interacting with others may be done for two reasons: soliciting information on a difficult
task or for social reasons. If a task is so difficult that additional information is required, then
interacting with others is a warning sign that this task will take a substantial amount of time to
complete. Therefore the interaction is a by-product of this difficulty, and the interaction itself is
not actually hindering job completion. On the contrary, it is actually aiding it.
If the interaction is a social activity, however, it is clearly detracting from completion
time, and thus the additional time it takes to complete a task is in fact due to the time spent in
conversation. This effect has been shown in previous work (Baron, 1986; Strayer & Johnston,
2001). From examining the group 2 results it also appears that these conversations affect the
number of follow-ups.
In general we expect that interactions lie somewhere along the continuum of purely social
and purely for soliciting task related information. The fact that both ends of the continuum
appear to have strong reasons for mediating productivity lends additional support to our findings,
implying that for the purposes of predicting productivity the conversation’s place on the
continuum may not even be important.

29
These behaviors are naturally also a function of the individual. We have already
mentioned the relationship between stress and variance in movement, but there is the additional
possibility that environmental distraction in an individual may trigger bursts of activity, and this
distraction subsequently lowers performance. Again, understanding causality is crucial in order
to help diagnose the underlying problem. To that end we are currently performing experiments
(Kim, Chang, Holland, & Pentland, 2008) to verify that this is indeed a general property and not
one that is restricted to our dataset.
We can see that three factors: the environment, the individual, and the task, appear to
mediate performance and break task and behavior clusters into four groups. We also found that
behavioral and job-related variables are both crucial for predicting productivity in general,
although perhaps less so in more constrained circumstances. Behavioral data does appear to
have a large amount of explicative power. In addition, job-dependent information appears to
explain portions of the productivity function that are inherently different from that explained by
behavioral data. Job-dependent information has been used frequently in the past and is typically
the only source of data. What we believe we have shown is that this data can be supplemented
by far more objective metrics that can be obtained using sensing technology.
DISCUSSION
Ensuring subject participation is always an issue with new sensing technology. While we
obtained 100% participation in study 1and in study 2 82% of the potential subject pool
participated, not all subjects wore the badges all the time. We found that a lack of feedback
caused some subjects to lose interest in the study. Remembering to put on a badge every
morning is not very difficult, but when the badge has no functionality outside of its sensing
30
capabilities, this may become a chore. Thus in future studies we will give all subjects access to
aggregated statistics in real-time (e.g. the average amount of movement for all subjects, the
average amount of speaking) in addition to monetary or other reward incentives. While this may
affect the validity of the study, it appears to be a necessary step in order to garner greater
compliance. We can also perform experiments simply to determine how this effects compliance
rates in order to choose feedback that has the maximum effect on compliance with the minimal
amount of information that confounds results.
Privacy concerns also must be discussed whenever this type of sensing technology is
employed. It is important to anonymize sensitive data so that it cannot be traced back to a
specific individual, and this anonymization must occur before the data is stored. Similarly, we
must offer tools that allow users to easily select which portions of their data to publish. Not only
will this keep users more engaged in the study, but it will prevent serious breaches of privacy and
lead to subjects that are more comfortable with their participation.
FUTURE WORK
We are currently analyzing the data from study 2 at multiple levels. In this paper, we have
presented analysis that looked at behaviors during tasks, but this behavior occurs in a larger
context. In addition, we can analyze what kinds of employees tend to be more productive from a
behavioral perspective, and it appears that longer-scale behavioral trends do account for large
portions of productivity. The applications of these findings will be different than the ones
presented in this paper, and this future work will most likely inform employee selection and
long-term evaluation rather than training and real-time interventions.
31
Further research is required to determine exactly why the four behavioral clusters that we
discovered exist. We also found that the standard deviation of movement energy is highly
predictive of completion time in general, and this clearly deservers further research to understand
its underlying factors.
The results that we presented are correlational, and ideally we would like to causally
determine whether changes in behavior yield predictable changes in performance using real-time
interventions that this wearable sensing technology affords. We believe that there are two ways
to incorporate this information into an intervention mechanism:
1. Provide real-time feedback on behavior with the goal of minimizing the occurrence of
ineffective behaviors and increasing the occurrence of effective behaviors.
2. Modify employee training programs such that workers naturally behave in the “optimal”
fashion.
We plan to take the real-time feedback approach, partially because this would also mimic an
“unproductive detection mechanism” that may be implemented in real world businesses in the
near future.
We would also like to combine the behavioral and detailed productivity data that we
collected in study 2 with electronic communication and survey data. We are currently planning
an experiment using the Sociometric badge that will encompass multiple sales divisions in a
large international electronics firm, and we will obtain electronic communication logs as well as
administer weekly surveys.
CONCLUSION
32
We have presented the application of a wearable sensing platform, the Sociometric badge, to
understanding organizational behavior in two contexts. In the first, we were able to very
accurately predict self-reports of group interaction satisfaction using behavioral data collected
using this platform, and in the second we discovered four behavioral clusters that predictably
form around certain task outcomes, and we were able to predict productivity on an individual
task basis for these clusters. This result is particularly strong because we controlled for
differences in ability as well as behavior, and thus the factors we examined indicate that if an
employee behaves in a certain way relative to their average behavior we can predict how quickly
they will complete a task. Incorporating job-related data into this model improved results
dramatically, although this was somewhat mediated in more behaviorally constrained contexts.
We have shown that behavioral data, particularly interaction and movement data, obtained using
wearable sensing devices is extremely useful for organizational behavior research, and these
results argue strongly for continued and expanded use of this technology.
BIBLIOGRAPHY
Aral, S., Brynjolfsson, E., & Van Alstyne, M. 2006. Information, technology and information worker
productivity: Task level evidence. 27th Annual Conference on Information Systems. Milwaukee, WI, USA.
Baker, W. E. 2000. Achieving success through social capital: Tapping hidden resources in your personal
and business networks. Jossey-Bass.
Baldwin, T., Bedell, M., & Johnson, J. 1997. The social fabric of a team-based M.B.A. program: Network
effects on student satisfaction and performance. The Academy of Management Journal, 40: 1369-1397.
Barahona, J. C., & Pentland, A. 2006. Advice and influence: The flow of advice and the diffusion of
innovation. The XXVI International Sunbelt Social Network Converence. Vancouver, British Columbia,
Canada.
Baron, R. S. 1986. Distraction/conflict theory: Progress and problems. Advances in experimental social
psychology, 19: 1-40.

33
Bateman, T. S., & Organ, D. W. 1983. Job satisfaction and the good soldier: The relationship between
affect and employee "citizenship". The Academy of Management Journal, 26: 587-595.
Baum, A., Calesnick, L. E., Glenn, E., & Gatchel, R. J. 1982. Individual differences in coping with crowding:
Stimulus screening and social overload. Journal of Personality and Social Psychology, 43: 821-830.
Bird, C., Gourley, A., Devanbu, P., Gertz, M., & Swaminathan, A. 2006. Mining email social networks.
Proceedings of the 2006 International Workshop on Mining Software Repositories, (pp. 137-143).
Brass, D. 1981. Structural relationships, job characteristics, and worker satisfaction and performance.
Administrative Science Quarterly, 26: 331-348.
Brass, D. 1985. Technology and the structuring of jobs: employee satisfaction, performance, and
influence. Organizational Behavior and Human Decision Processes, 35: 216-240.
Choudhury, T. 2004. Sensing and modeling human networks. PhD Thesis, MIT Media Laboratory.
Cross, R., & Parker, A. 2004. The hidden power of social networks. Boston: Harvard Business School
Publishing.
Dyne, L., & Ang, S. 1998. Organizational citizenship behavior of contingent workers in Singapore. The
Academy of Management Journal, 41: 692-703.
Eagle, N., & Pentland, A. 2006a. Eigenbehaviors: Identifying structure in routine. Ubicomp 2006: The
8th International Conference on Ubiquitous Computing.
Eagle, N., & Pentland, A. 2006b. Reality mining: Sensing complex social systems. Journal of Personal and
Ubiquitous Computing, 10: 255-268.
Eston, R. G., Rowlands, A. V., & Ingledew, D. K. 1998. Validity of heart rate, pedometry, and
accelerometry for predicting the energy cost of children’s activities. Journal of Applied Physiology, 84:
362-371.
Evans, O., & Steptoe, A. 2001. Social support at work, heart rate, and cortisol: A self-monitoring study.
Journal of Occupational Health Psychology, 6: 361-370.
Freeman, L. 1977. A set of measures of centrality based on betweenness. Sociometry, 40: 35-41.
Gardner, D., & Winder, C. 1998. Using benchmarking to improve organizational communication. Quality
Assurace, 6: 201-211.
Gips, J. 2006. Social motion: Mobile networking through sensing human behavior. Master's Thesis, MIT
Media Laboratory.
Grippa, F., Zilli, A., Laubacher, R., & Gloor, P. 2006. E-mail may not reflect the social network.
Proceedings of the North American Association for Computational Social and Organizational Science
Conference.

34
Gwon, Y., Jain, R., & Kawahara, T. 2004. Robust indoor location estimation of stationary and mobile
users. Proceedings of the 23rd Annual Joint Conference of the IEEE Computer and Communications
Societies, (pp. 1032-1043).
Hiltz, S. R., & Turoff, M. 1985. Structuring computer-mediated communication systems to avoid
information overload. Communications of the ACM, 28: 680-689.
Johansen, R., Vallee, J., & Spangler, K. 1979. Electronic meetings: Technological alternatives and social
choices. Reading, MA: Addison-Wesley.
Kalleberg, A. 2000. Nonstandard employment relations: Part-time, temporary and contract work.
Annual Review of Sociology, 26: 341-365.
Karantonis, D. M., Narayanan, M. R., Mathie, M., Lovell, N. H., & Celler, B. G. 2006. Implementation of a
real-time human movement classifier using a triaxial accelerometer for ambulatory monitoring. IEEE
Transactions on Information Technology and Biomedicine, 10: 156-167.
Karasek, R. A., & Theorell, T. 1992. Healthy work: Stress, productivity, and the reconstruction of
working life. New York: Basic Books.
Kerr, E. B., & Hiltz, S. R. 1982. Computer-mediated communication systems: Status and evaluation.
New York: Academic Press.
Kiggundu, M. 1981. Task interdependence and the theory of job design. The Academy of Management
Review, 6: 499-508.
Kim, T. J., Chang, A., Holland, L., & Pentland, A. 2008. Meeting mediator: Enhancing group collaboration
with sociometric feedback. Forthcoming.
Kirkman, B. L., Rosen, B., Tesluk, P., & Gibson, C. B. 2004. The impact of team empowerment on virtual
team performance: the moderating role of face-to-face interaction. The Academy of Management
Journal, 47: 175-192.
Koyrakh, I., Waber, B. N., Olguin Olguin, D., & Pentland, A. 2008. Indentifying speech and conversations
in wearable sensor networks. Forthcoming.
Mathie, M. J., Coster, A. C., Lovell, N. H., & Celler, B. G. 2004. Accelerometry: providing an integrated,
practical method for long-term ambulatory monitoring of human movement. Phsyiological
Measurement, 25: R1-R20.
Mehra, A., Kilduff, M., & Brass, D. 2001. The social networks of high and low self-monitors: Implications
for workplace performance. Administrative Science Quarterly, 46: 121-146.
Olguin Olguin, D. 2007. Sociometric badges: Wearable techonology for measuring human behavior.
Master's Thesis, MIT Media Laboratory.

35
Olguin Olguin, D., & Pentland, A. 2006. Human activity recognition: Accuracy across common locations
for wearable sensors. Proceedings of the 10th International Symposium on Wearable Computers
(Student Colloquium), (pp. 11-13).
Oster, D. 2007. Angewandte analyse sozialer netzwerke in unternehmen: Auswirkungen elektronischer
kommunikation auf die performanz von teams. Diploma Thesis, University of Cologne Department of
Information Systems and Information Management.
Pagel, M. D., Erdly, W. W., & Becker, J. 1987. Social networks: We get by with (and in spite of) a little
help from our friends. Journal of Personality and Social Psychology, 53: 793-804.
Pentland, A. 2005. Socially aware computation and communication. IEEE Computer, 38(3): 33-40.
Pentland, A. 2006. Automatic mapping and modeling of human networks. Physica A: Statistical
Mechanics and its Applications, 378: 59-67.
Pruden, O., & Reese, R. 1972. Interorganization role-set relations and the performance and satisfaction
of industrial salesmen. Administrative Science Quarterly, 17: 601-609.
Picard, R. 1997. Affective computing. Cambridge, MA: MIT Press.
Rau, R., Georgiades, A., Fredrikson, M., Lemne, C., & de Faire, U. 2001. Psychosocial work characteristics
and perceived control in relation to cardiovascular rewind at night. Journal of Occupational Health
Psychology, 6(3): 171-181.
Roberts, K., & O'Reilly, C. 1979. Some correlates of communication roles in organizations. The Academy
of Management Journal, 22: 42-57.
Sahlins, M. 1972. Stone age economics. New York: Academic Press.
Scott, J. 2006. Social network analysis: A handbook. London: SAGE Publications Inc.
Sinan, A., Brynjolfsson, E., & Wu, D. J. 2006. Which came first, IT or productivity? The virtuous cycle of
investment & use in enterprise systems. Proceedings of the International Conference on Information
Systems.
Sparrowe, R. T., Liden, R. C., Wayne, S. J., & Kraimer, M. L. 2001. Social networks and the performance of
individuals and groups. The Academy of Management Journal, 44: 316-325.
Strayer, D. L., & Johnston, W. A. 2001. Driven to distraction: Dual-task studies of simulated driving and
conversing on a cellular telephone. Psychological Science, 12: 462-466.
Stoltzman, W. T. 2006. Toward a social signaling framework: Activity and emphasis in speech. Master's
Thesis, MIT Media Laboratory.
36
Sugano, M., Kawazoe, T., Ohta, Y., & Murata, M. 2006. Indoor localization system using RSSI
measurement of wireless sensor network based on zigbee standard. Proceedings of the IASTED
International Conference on Wireless Sensor Networks, (pp. 1-6).
Sung, M., Marci, C., & Pentland, A. 2005. Wearable feedback systems for rehabilitation. Journal of
NeuroEngineering and Rehabilitation, 2: 17.
Tjosvold, D. 1989. Interdependence and power between managers and employees: A study of the leader
relationship. Journal of Management, 15: 49-62.
Unden, A.-L., Orth-Gomer, K., & Elofsson, S. 1991. Cardiovascular effects of social support in the work
place: twenty-four-hour ECG monitoring of men and women. Psychosomatic Medicine, 53: 50-60.
Valbonesi, L., Ansari, R., McNeill, D., Quek, F., Duncan, S., McCullough, K. E., Bryll, R. 2002. Multimodal
signal analysis of prosody and hand motion: Temporal correlation of speech and gesture. EUSIPCO
2002. Tolouse, France.
Van der Vegt, G., Emans, B., & Van de Vliert, E. 2002. Team members' affective responses to patterns of
intragroup interdependence and job complexity. Journal of Management, 26: 633-655.
Van der Vegt, G., & Van de Vliert, E. 2002. Intragroup interdependence and effectiveness: Review and
proposed directions for theory and practice. Journal of Managerial Psychology, 17: 50-67.
Wageman, R. 1995. Interdependence and group effectiveness. Administrative Science Quarterly, 40:
145-180.
Zahn, L. 1991. Face-to-face communication in an office setting: The effects of position, proximity, and
exposure. Communications Research, 18: 737-754.


