Download - TTT Diyagramı
7/27/2019 TTT Diyagramı
http://slidepdf.com/reader/full/ttt-diyagrami 1/7
Time-Temperature-Transformation
(TTT ) Diagram
T (Time) T(Temperature) T(Transformation) diagram is a plot of
temperature versus the logarithm of time for a steel alloy of
definite composition. It is used to determine when
transformations begin and end for an isothermal (constant
temperature) heat treatment of a previously austenitized alloy.
When austenite is cooled slowly to a temperature below LCT
(Lower Critical Temperature), the structure that is formed is
Pearlite. As the cooling rate increases, the pearlite transformation
temperature gets lower. The microstructure of the material is
significantly altered as the cooling rate increases. By heating and
cooling a series of samples, the history of the austenite
transformation may be recorded. TTT diagram indicates when a
specific transformation starts and ends and it also shows what
percentage of transformation of austenite at a particular
temperature is achieved.
Cooling rates in the order of increasing severity are achieved by
quenching from elevated temperatures as follows: furnace
cooling, air cooling, oil quenching, liquid salts, water quenching,and brine. If these cooling curves are superimposed on the TTT
diagram, the end product structure and the time required to
complete the transformation may be found.
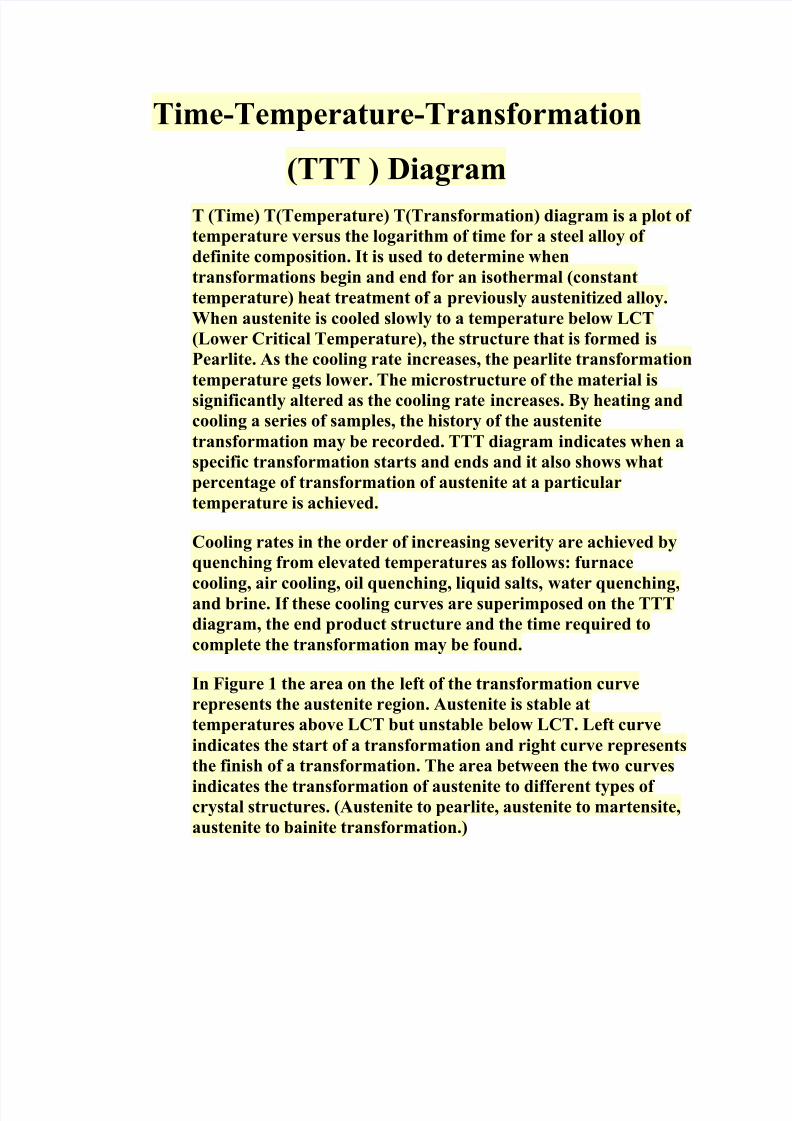
In Figure 1 the area on the left of the transformation curve
represents the austenite region. Austenite is stable at
temperatures above LCT but unstable below LCT. Left curve
indicates the start of a transformation and right curve represents
the finish of a transformation. The area between the two curves
indicates the transformation of austenite to different types of crystal structures. (Austenite to pearlite, austenite to martensite,
austenite to bainite transformation.)
7/27/2019 TTT Diyagramı
http://slidepdf.com/reader/full/ttt-diyagrami 2/7
Figure 1. TTT Diagram
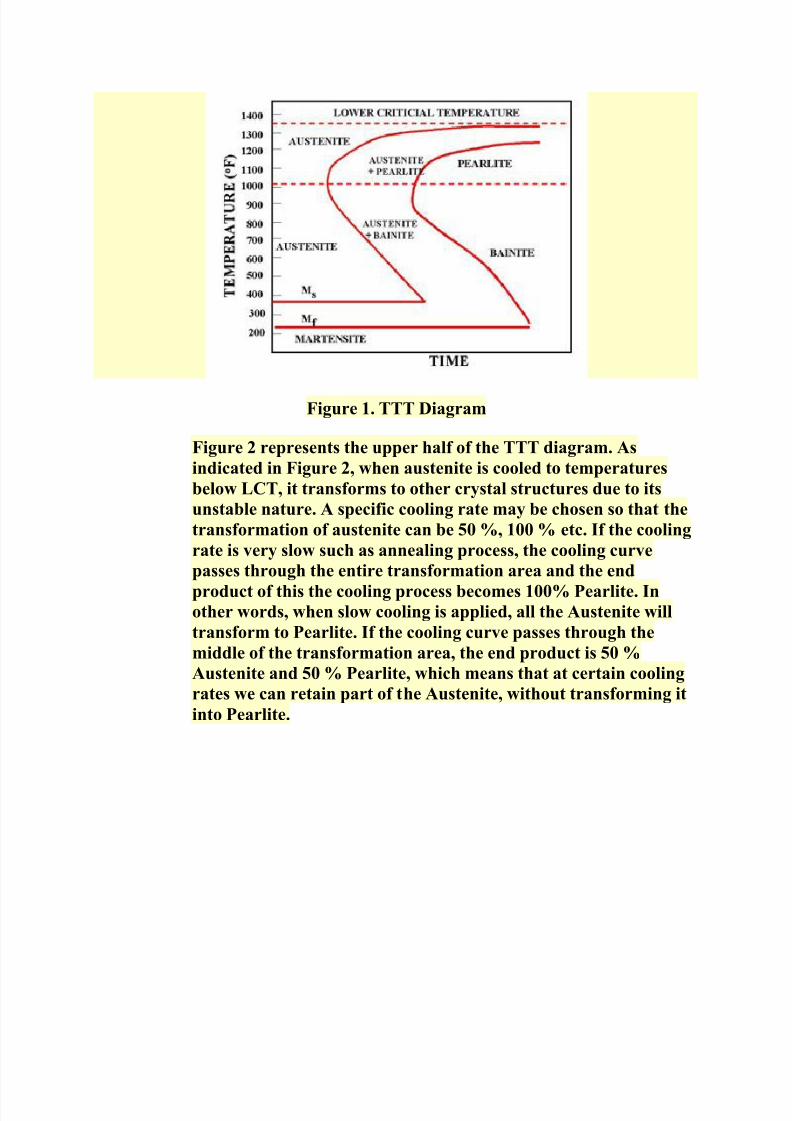
Figure 2 represents the upper half of the TTT diagram. As
indicated in Figure 2, when austenite is cooled to temperatures
below LCT, it transforms to other crystal structures due to its
unstable nature. A specific cooling rate may be chosen so that the
transformation of austenite can be 50 %, 100 % etc. If the cooling
rate is very slow such as annealing process, the cooling curve
passes through the entire transformation area and the end
product of this the cooling process becomes 100% Pearlite. Inother words, when slow cooling is applied, all the Austenite will
transform to Pearlite. If the cooling curve passes through the
middle of the transformation area, the end product is 50 %
Austenite and 50 % Pearlite, which means that at certain cooling
rates we can retain part of the Austenite, without transforming it
into Pearlite.
7/27/2019 TTT Diyagramı
http://slidepdf.com/reader/full/ttt-diyagrami 3/7
Figure 2. Upper half of TTT Diagram(Austenite-Pearlite Transformation
Area)
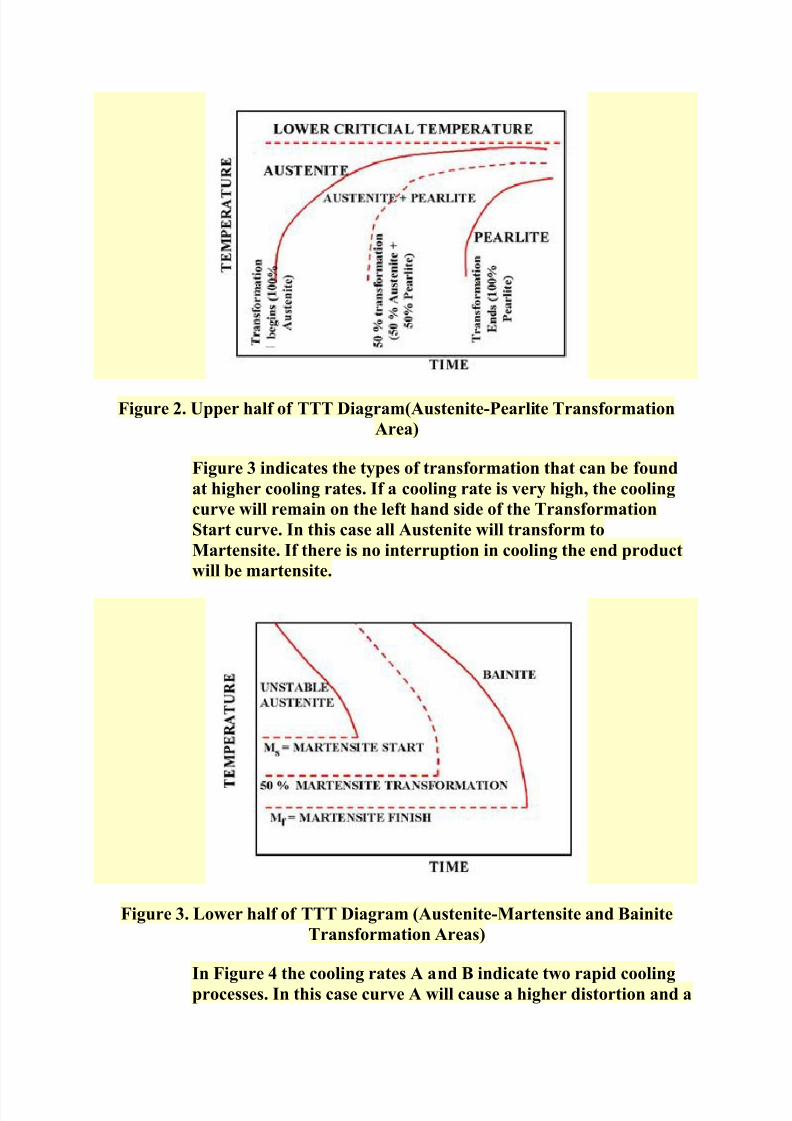
Figure 3 indicates the types of transformation that can be found
at higher cooling rates. If a cooling rate is very high, the cooling
curve will remain on the left hand side of the Transformation
Start curve. In this case all Austenite will transform to
Martensite. If there is no interruption in cooling the end product
will be martensite.
Figure 3. Lower half of TTT Diagram (Austenite-Martensite and Bainite
Transformation Areas)
In Figure 4 the cooling rates A and B indicate two rapid coolingprocesses. In this case curve A will cause a higher distortion and a

7/27/2019 TTT Diyagramı
http://slidepdf.com/reader/full/ttt-diyagrami 4/7
higher internal stresses than the cooling rate B. The end product
of both cooling rates will be martensite. Cooling rate B is also
known as the Critical Cooling Rate, which is represented by a
cooling curve that is tangent to the nose of the TTT diagram.
Critical Cooling Rate is defined as the lowest cooling rate which
produces 100% Martensite while minimizing the internal stresses
and distortions.
Figure 4. Rapid Quench
In Figure 5, a rapid quenching process is interrupted (horizontal
line represents the interruption) by immersing the material in a
molten salt bath and soaking at a constant temperature followed
by another cooling process that passes through Bainite region of
TTT diagram. The end product is Bainite, which is not as hard as
Martensite. As a result of cooling rate D; more dimensional
stability, less distortion and less internal stresses are created.
7/27/2019 TTT Diyagramı
http://slidepdf.com/reader/full/ttt-diyagrami 5/7
Figure 5. Interrupted Quench
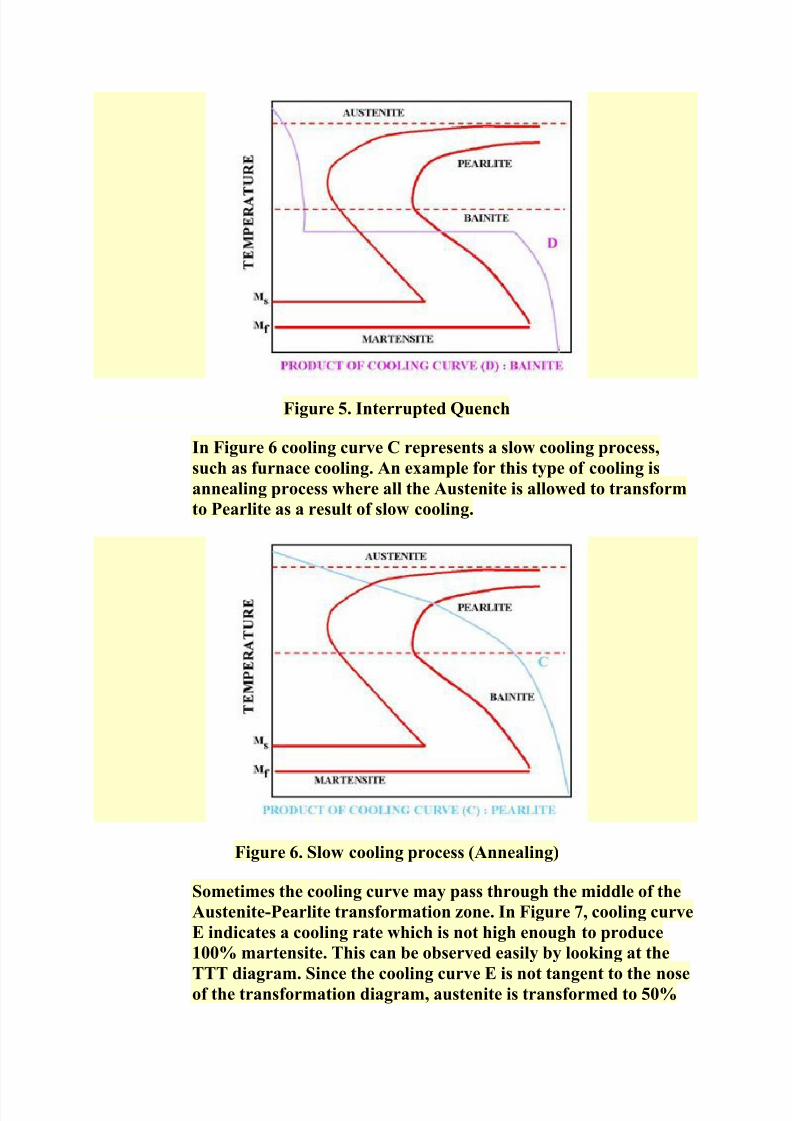
In Figure 6 cooling curve C represents a slow cooling process,
such as furnace cooling. An example for this type of cooling is
annealing process where all the Austenite is allowed to transform
to Pearlite as a result of slow cooling.
Figure 6. Slow cooling process (Annealing)
Sometimes the cooling curve may pass through the middle of the
Austenite-Pearlite transformation zone. In Figure 7, cooling curve
E indicates a cooling rate which is not high enough to produce
100% martensite. This can be observed easily by looking at the
TTT diagram. Since the cooling curve E is not tangent to the noseof the transformation diagram, austenite is transformed to 50%

7/27/2019 TTT Diyagramı
http://slidepdf.com/reader/full/ttt-diyagrami 6/7
Pearlite (curve E is tangent to 50% curve). Since curve E leaves
the transformation diagram at the Martensite zone, the remaining
50 % of the Austenite will be transformed to Martensite.
Figure 7. Cooling rate that permits both pearlite and martensite formation.
Figure 8. TTT Diagram and microstructures obtained by different types of
cooling rates

7/27/2019 TTT Diyagramı
http://slidepdf.com/reader/full/ttt-diyagrami 7/7
Figure 9. Austenite Figure 10. Pearlite
Figure 11. Martensite Figure 12. Bainite
Back to Table of Contents Last Updated: October 28, 1999
Prepared by: Serdar Z. Elgun


