
1
True Stress and True Strain
F
AoA
Lo
F
L
True stress ( ) is the force divided by the actual area: AF
By the constancy of volume: , we can obtain:oo LALAV
For engineering stress ( ) and engineering strain ( ),
the original (gauge) dimensions of specimen are employed.
However, length and cross-sectional area change in plastic
region. True stress ( ) and true strain ( ) are used for
accurate definition of plastic behaviour of ductile materials
by considering the actual (instantaneous) dimensions.
11 1 &
ooo
o
oo A
F
L
L
L
LL
LA
LF
A
F
True strain ( ) is change in length with respect to the instant length:
L
Loo LLLLLdL
0
1ln 1 & ln
True strain can also be in terms of reduction in area: AAoln
This can be rewritten for cylindrical specimens: DDoln2

2
True Stress and True Strain
Fig. 21 shows conventional vs true stress-strain diagrams for two different
steels in which the portion beyond ultimate strength is significant. When
necking starts, only way to define the gauge length is to measure it.
However, if loads at ultimate and fracture points
are recorded, this portion can be approximated by
a straight line using the fracture area.
feRA 1
RA : reduction in area
e : natural logarithm
f : true fracture strain Figure 21
x x
xx
0 0.2 0.4 0.6 0.8 1.0 1.2
30
60
90
St
St
C22 steel
1% Ni Steel
True Strain (mm / mm)
Tru
e S
tres
s(
kg /
mm
2 )
Conventional Diagram
True Diagram
True Fracture
Thus, true strain at point
of fracture is determined
by equation below:

3
True Stress and True Strain
There is an approximate linear relationship between true stress and true
strain when plotted on log-log scale, as shown in Fig. 22 for various steels.
Figure 22
For many materials, the correlation between true stress and true strain has
been found to be approximately represented by equation below:
nK
K : strength coefficient
n : strain hardening exponent
(i.e. slope of log-log plot)
n = 0 (perfectly malleable solid)
n = 1 (elastic solid)
4
Tensile Properties of Steel
Alloy content, heat treatment and fabrication (production) process are
the variables affecting tensile and other properties of steel. The following
factors influence the selection procedure of steels:
a. Rigidity is purely a design problem. Elastic modulus of steels falls within
the range of 19.6 - 20.1 * 104 kg/mm2, regardless of composition or form.
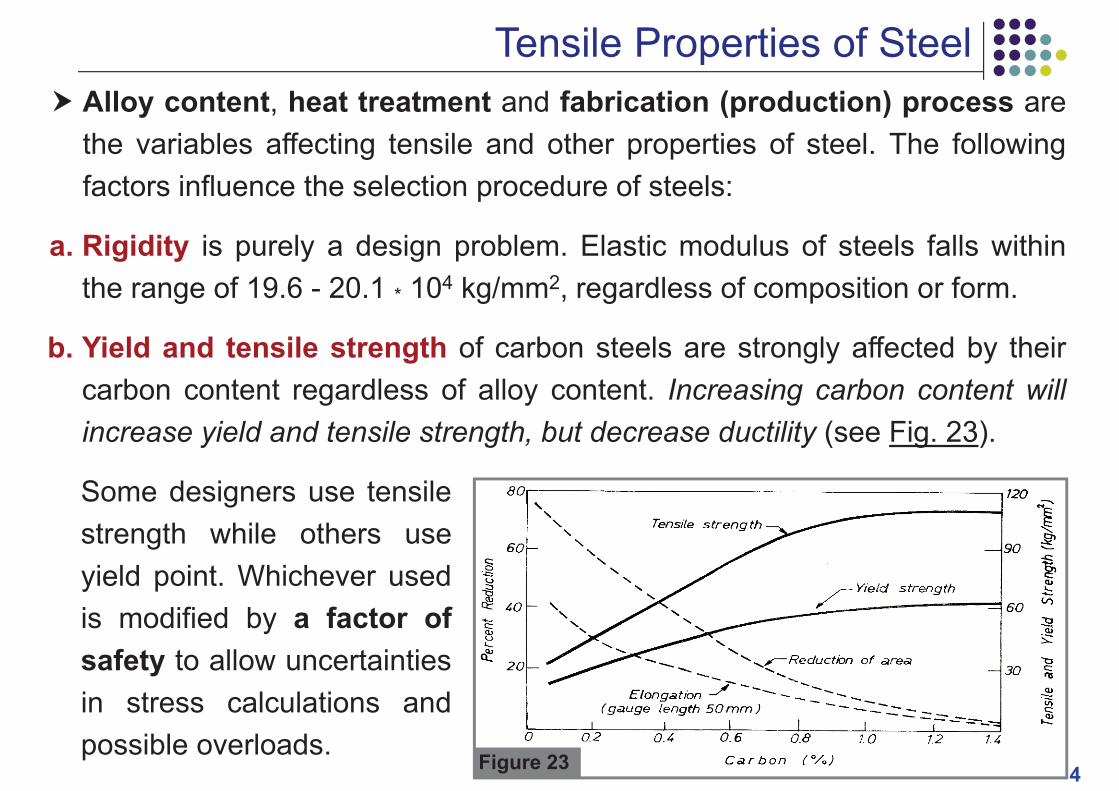
b. Yield and tensile strength of carbon steels are strongly affected by their
carbon content regardless of alloy content. Increasing carbon content will
increase yield and tensile strength, but decrease ductility (see Fig. 23).
Figure 23
Some designers use tensile
strength while others use
yield point. Whichever used
is modified by a factor of
safety to allow uncertainties
in stress calculations and
possible overloads.

5
Tensile Properties of Steel
c. Heat treatment gives useful and important properties due to hardenability
in order to obtain proper combination of strength, ductility and toughness.
Heat-treatable steel for non-cylindrical part must be picked based on ruling
section-size (i.e. the maximum diameter of round bar in which the specified
tensile strength or hardness can be produced by employed heat treatment).
d. Hardness is related to strength as: where f is a conversion
factor (0.33 - 0.36) and BHN is the Brinell Hardness Number. Steels with
the same hardness usually have the same tensile strengths.
BHNfSt
e. Ductility of carbon steels decreases as hardness increases. For the same
BHN or strength, alloys steels are more ductile than carbon steels. An alloy
steel can give better strength, ductility and toughness. Thus, it should be
preferred to carbon steel under high stress or impact loading.
f. Fabrication process is also significant for the properties of steels. When
an annealed steel is cold worked (by rolling, wire drawing or elongation in
tension), its strength and hardness increase, but its ductility decreases.

6
Factors Affecting Tension and Compression Tests
In tension or compression test, the specimen is subjected to a gradually
increasing uniaxial load until failure occurs.
The test is fundamentally dynamic, but due to the low speed of testing
involved, it is considered to be quasi-static for all practical purposes.
There are several factors affecting these tests (e.g. metallurgical factors
as well as testing and environmental conditions).
Such factors are mainly grouped into two categories:
1. Variables related to test specimen (size and shape effect)
2. Variables related to testing machine (strain rate, rigidity of machine,
load and extension measuring device, gripping arrangement)

7
Variables Related to Test Specimen
In theory, if a material is of uniform quality, the geometrically similar size of
specimens would not affect the test results considerably. However, in
practice, mechanical properties change with size.
This is called “size effect”,
which is observed in fatigue
and brittle fracture according
to the statistical distribution of
defects in microstructure.
Different sizes for the same
material would give different
property values (as in table).

8
Variables Related to Test Specimen
Shape also affects the results.
Fig. 24 shows standard tensile
test specimens (TS 138).
Figure 24
In case of compression tests,
specimens of circular section
are used for uniform straining.
Height-to-diameter ratio (h/d)
is important to avoid buckling
and ensure free shear plane
in case of brittle materials:
Type h/d Purpose
Short 0.9 Testing bearing materials
Medium 3 General purpose uses
Long 8-10 To determine stiffness

9
Variables Related to Test Specimen
Fig. 25a shows how ductility and shape of stress-strain diagram varies with
Lo/do ratio. The reduction of area is independent of Lo/do for values of > 2
and drastically reduced for values of < 2. This is called “notch sensitivity”.
The term “notch” implies any kind of stress concentration effect.
Figure 25
Small ratios convert ductile type of stress-strain curves to brittle type (as in
Fig. 25b). Stress concentrations are unimportant where static loads are
acting on ductile materials. However, brittle materials have limited capacity
of plastic flow, so a notch adversely affects strength causing sudden failure.
10
Variables Related to Testing Machine
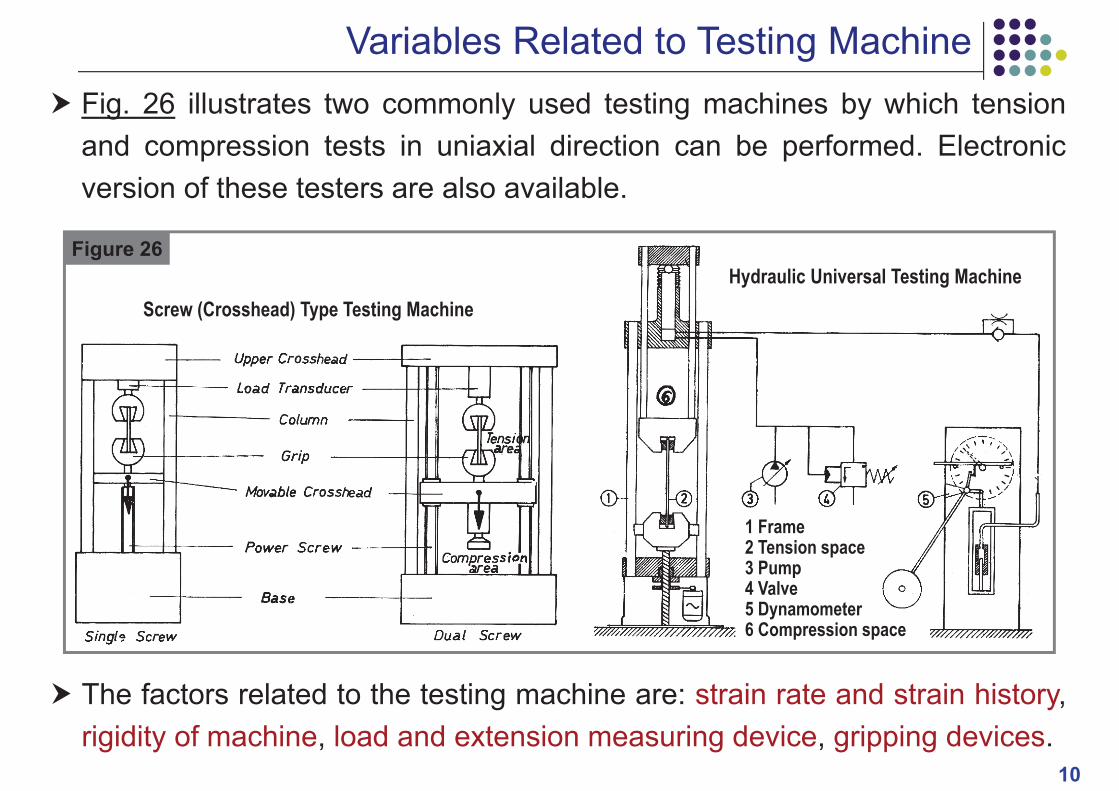
Fig. 26 illustrates two commonly used testing machines by which tension
and compression tests in uniaxial direction can be performed. Electronic
version of these testers are also available.
1 Frame2 Tension space3 Pump4 Valve5 Dynamometer6 Compression space
Figure 26
Hydraulic Universal Testing Machine
Screw (Crosshead) Type Testing Machine
The factors related to the testing machine are: strain rate and strain history,
rigidity of machine, load and extension measuring device, gripping devices.

11
Variables Related to Testing Machine
Strain rate (d /dt) is related to the speed of gripping
heads. Fig. 27 shows the effect of strain rate (curve
shifts upwards at higher speeds).
Figure 27
High strain rate
Low strain rate
stre
ss
strain
ASTM, Turkish and DIN standards for appropriate
strain rates to be used in testing various materials
are given in tables below:
Various ASTM requirements on strain rate
Material
Tested
ASTM
Ref.
Max. Crosshead Speed (mm/min)
To yield To ultimate Load rate
Metallic
materials*
E8 0.062 mm
per mm of
gauge
length
0.5 mm per
mm of gauge
length above
10 kg/mm2
Maximum 70
kg/mm2/min
to yieldSteel prod.* A370
Gray CI A48
Specified Grip Speed (mm/min)
Plastics D638 1.30 5 - 6.35 1.32 - 1.4 kg/s
Hard rubber D530
Soft rubber D142 500
* The values are also recommended in TS 138
Strain rates for metallic materials (DIN)
For determination of
upper yield point
d /dt 1 (kg/mm2s)
d /dt 0.3 (% / minute)
For determination of
lower yield pointd /dt 10 (% / minute)
For determination of
tensile strength (before
reaching max. force)
d /dt 40 (% / minute)

12
Variables Related to Testing Machine
Rigidity of machine contributes to the deformation measurements. Under
loading, not only the specimens but also components of machine elongate.
Due to the deformation of machine itself, it is also difficult to maintain
constant strain rate of the specimen, which again affects the test result.
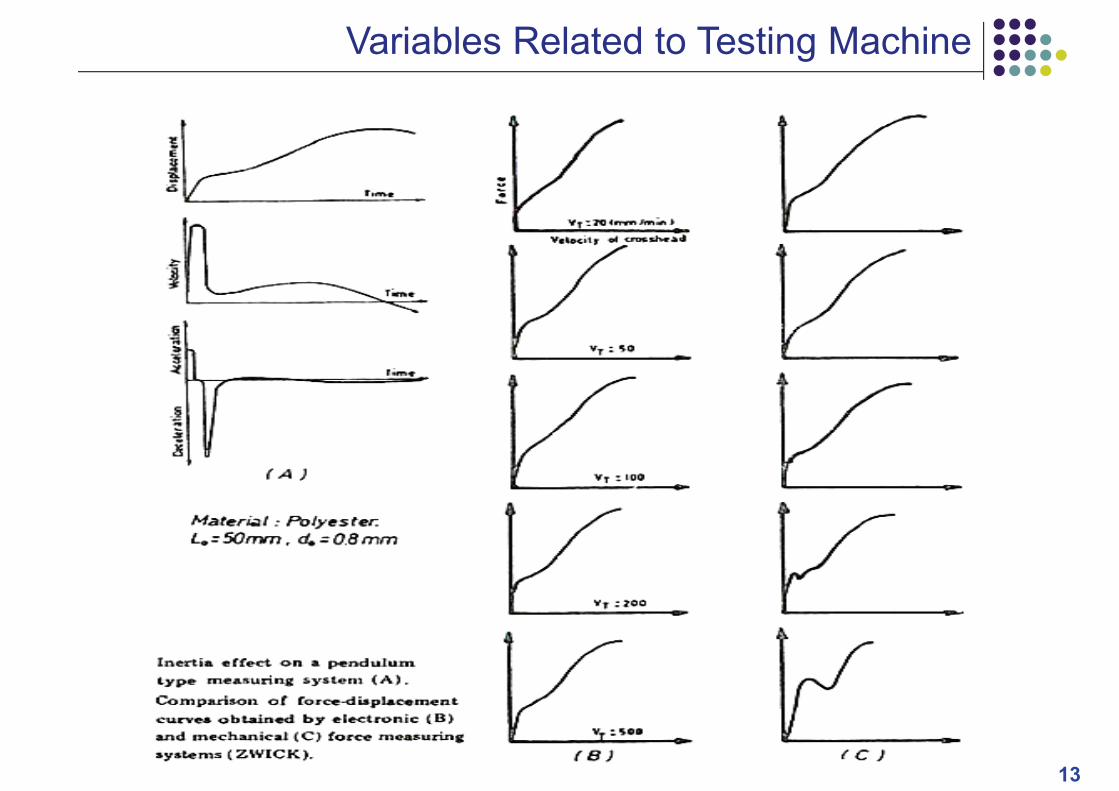
Load and extension measuring device: Mechanical systems with high
inertia will cause changes in measurements especially at high speeds
when acceleration comes into play. In contrast, electronic systems with
negligible inertia always provide the same measurement at all speeds.
Hence, it is better to use low inertia measuring devices for accurate results.
Similar to rigidity of machine, gripping devices also must be stiff and rigid
(i.e. no bending effect on the specimen should occur).
Strain history also modifies the stress-strain diagram. When a material is
subjected to a cycle of loading and unloading, some energy is dissipated
by the specimen, which is called “hysteresis effect”. It is an important
consideration in the treatment of “anelasticity” and “fatigue”.
13
Variables Related to Testing Machine


![white paper Influence of chromium additions and true ... · Influence of chromium additions and true strain rate on hardness of austenitic manganese steel ... 65Mn steel grade[12]](https://cdn.vdocuments.mx/doc/165x107/5ac0d12f7f8b9a1c768c2454/white-paper-influence-of-chromium-additions-and-true-of-chromium-additions-and.jpg)