
1
TRIP GENERATION STUDY
October 2010
2
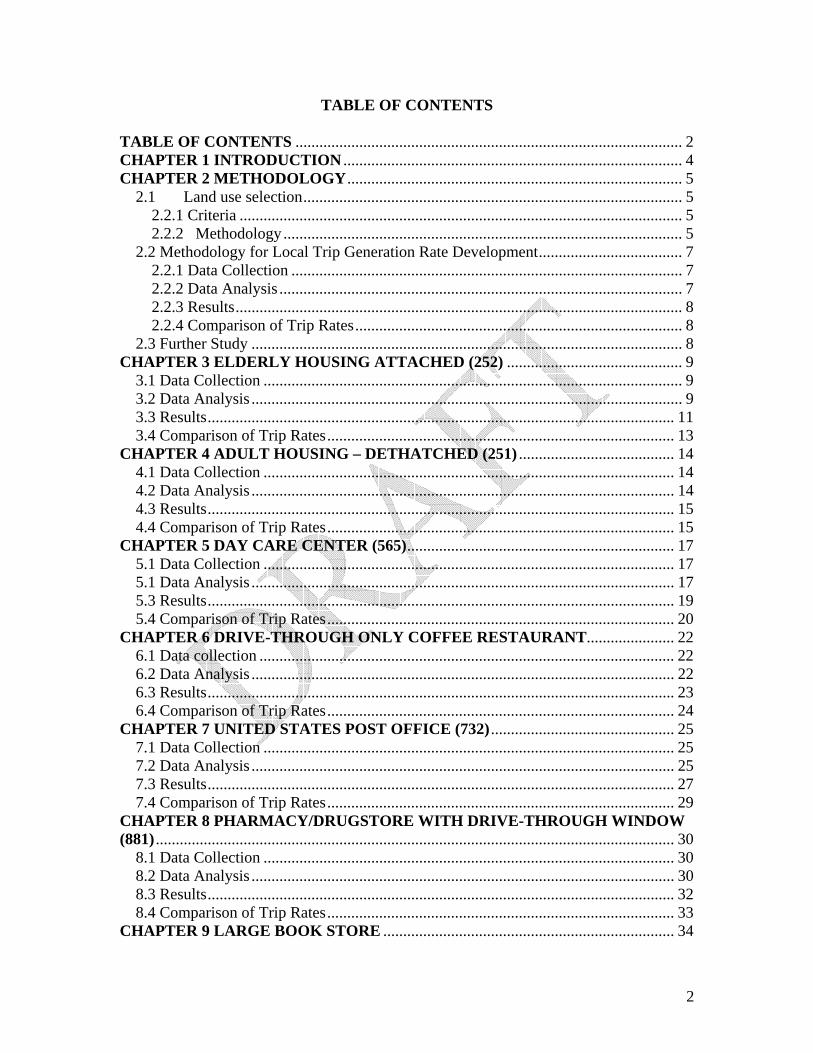
TABLE OF CONTENTS TABLE OF CONTENTS ................................................................................................. 2 CHAPTER 1 INTRODUCTION ..................................................................................... 4 CHAPTER 2 METHODOLOGY.................................................................................... 5
2.1 Land use selection............................................................................................... 5 2.2.1 Criteria ............................................................................................................... 5 2.2.2 Methodology.................................................................................................... 5
2.2 Methodology for Local Trip Generation Rate Development.................................... 7 2.2.1 Data Collection .................................................................................................. 7 2.2.2 Data Analysis ..................................................................................................... 7 2.2.3 Results................................................................................................................ 8 2.2.4 Comparison of Trip Rates.................................................................................. 8
2.3 Further Study ............................................................................................................ 8 CHAPTER 3 ELDERLY HOUSING ATTACHED (252) ............................................ 9
3.1 Data Collection ......................................................................................................... 9 3.2 Data Analysis ............................................................................................................ 9 3.3 Results..................................................................................................................... 11 3.4 Comparison of Trip Rates....................................................................................... 13
CHAPTER 4 ADULT HOUSING – DETHATCHED (251) ....................................... 14 4.1 Data Collection ....................................................................................................... 14 4.2 Data Analysis .......................................................................................................... 14 4.3 Results..................................................................................................................... 15 4.4 Comparison of Trip Rates....................................................................................... 15
CHAPTER 5 DAY CARE CENTER (565)................................................................... 17 5.1 Data Collection ....................................................................................................... 17 5.1 Data Analysis .......................................................................................................... 17 5.3 Results..................................................................................................................... 19 5.4 Comparison of Trip Rates....................................................................................... 20
CHAPTER 6 DRIVE-THROUGH ONLY COFFEE RESTAURANT...................... 22 6.1 Data collection ........................................................................................................ 22 6.2 Data Analysis .......................................................................................................... 22 6.3 Results..................................................................................................................... 23 6.4 Comparison of Trip Rates....................................................................................... 24
CHAPTER 7 UNITED STATES POST OFFICE (732) .............................................. 25 7.1 Data Collection ....................................................................................................... 25 7.2 Data Analysis .......................................................................................................... 25 7.3 Results..................................................................................................................... 27 7.4 Comparison of Trip Rates....................................................................................... 29
CHAPTER 8 PHARMACY/DRUGSTORE WITH DRIVE-THROUGH WINDOW (881) .................................................................................................................................. 30
8.1 Data Collection ....................................................................................................... 30 8.2 Data Analysis .......................................................................................................... 30 8.3 Results..................................................................................................................... 32 8.4 Comparison of Trip Rates....................................................................................... 33
CHAPTER 9 LARGE BOOK STORE ......................................................................... 34

3
9.1 Data Collection ....................................................................................................... 34 9.2 Data Analysis .......................................................................................................... 34 9.3 Results..................................................................................................................... 35 9.4 Comparison of Trip Rates....................................................................................... 35
CHAPTER 10 CLINIC (630) ......................................................................................... 37 10.1 Data Collection ..................................................................................................... 37 10.2 Data Analysis ........................................................................................................ 37 10.3 Results................................................................................................................... 38 10.4 Comparison Of Trip Rates .................................................................................... 38
CHAPTER 11 NURSING HOME (620) ....................................................................... 40 11.1 Data Collection ..................................................................................................... 40 11.2 Data Analysis ........................................................................................................ 40 11.3 Results................................................................................................................... 41 11.4 Comparison of Trip Rates..................................................................................... 41
CHAPTER 12 GENERAL OFFICE BUILDING <50.000 SQ. FT (710) .................. 43 12.1 Data Collection ..................................................................................................... 43 12.2 Data Analysis ........................................................................................................ 43 12.3 Results................................................................................................................... 44 12.4 Comparison of Trip Rates..................................................................................... 44
CHAPTER 13 CHURCH (560)...................................................................................... 46 13.1 Data Collection ..................................................................................................... 46 13.2 Data Analysis ........................................................................................................ 46 13.3 Results................................................................................................................... 48 13.4 Comparison of Trip Rates..................................................................................... 52
CHAPTER 14 PARK-AND-RIDE LOT WITH BUS SERVICE (090) ..................... 54 14.1 Data Collection ..................................................................................................... 54 14.2 Data Analysis ........................................................................................................ 54 14.3 Results................................................................................................................... 56 14.4 Comparison of Trip Rates..................................................................................... 58
APPENDIX I ITE TRIP REPORT LAND USE .......................................................... 59 APPENDIX II SAMPLE COUNT REPORT ............................................................... 63 APPENDIX III HOURLY VARIATION OF TRAFFIC ............................................ 64

CHAPTER 1 INTRODUCTION
As part of Fiscal Year 2009 Unified Planning Work Program (UPWP), the Southern New Hampshire Planning Commission (SNHPC) continued to work on a regional trip generation study. The Institute of Transportation Engineers (ITE) “Trip Generation” report provides trip rates for 162 individual land use types in 10 categories. A complete list of these land use types can be found in Appendix I. The ITE report can be used to estimate the number of vehicle trips generated by a proposed development. This document is based on trip generation studies submitted by public agencies, developers, consulting firms, and associations. It presents trip generation rates and equations for time periods such as average weekday, Saturday, Sunday, as well as for weekday morning and evening peak hours. Data is presented for the peak hours of adjacent street traffic as well as for the peak hours of the generator site itself. ITE rates represent national averages and may vary from area to area, as demonstrated by the range of rates presented in ITE Trip Generation for any land use type. There are land use types for which the trip rates are based on only a few samples, while in other cases some land use types are not represented at all. ITE encourages supplementing the data base with locally collected data. It was decided that a local trip generation study should be performed for the SNHPC region. The principal purpose of this study is to develop local trip generation rates for land use types in the region for which ITE data is lacking. A secondary purpose of the study is to compare locally gathered data with that provided in the ITE trip report.

5
CHAPTER 2 METHODOLOGY
This study includes two steps 1) land use selection; 2) local trip generation rates development. The following section describes the methodologies these two steps. 2.1 Land use selection
2.2.1 Criteria The following criteria were used to select sites for the trip generation study:
• Land uses selected must exist in the Southern New Hampshire region encompassing the Towns of Auburn, Bedford, Candia, Chester, Deerfield, Derry, Goffstown, Hooksett, Londonderry, New Boston, Raymond, Weare and the City of Manchester. Sites outside the region could be selected if insufficient sites exist in the SNHPC region.
• Land uses selected should be valuable to the regional needs. • Land uses selected should have small sample sizes in the ITE trip report. • Land uses selected should be sites for which data can be captured readily and
accurately. 2.2.2 Methodology An initial list of all land use types included in ITE Trip Generation was compiled (Appendix I). From this list, land use types were then selected for inclusion in the study using the above-mentioned criteria. Letters were sent to Town officials and private consultants requesting input on the land use types to be included. Five towns and two consultants responded to these requests. After combining the SNHPC list with all other requests, a revised list was prepared. This list included a total of 66 land use types of which seven did not exist in the ITE Trip Generation. The list was finalized by eliminating land use types judged to be hard to find in the region or for which data could not be accurately collected. Table 2.1 shows the land use types included in the study. The list has been refined as a part of this study, which has been designed as an annual on-going project for the SNHPC.
Table 2.1 Selected Land Uses Included in the Trip Generation Study ITE Code Land Use
90 Park-and-Ride Lot w/ Bus Service 110 General Light Industrial 130 Industrial Park 150 Warehousing 210 Single-Family Detached Housing 220 Apartment 230 Residential Condominium/Townhouse 231 Low-Rise Residential Condominium Townhouse 232 High-Rise Residential Condominium Townhouse
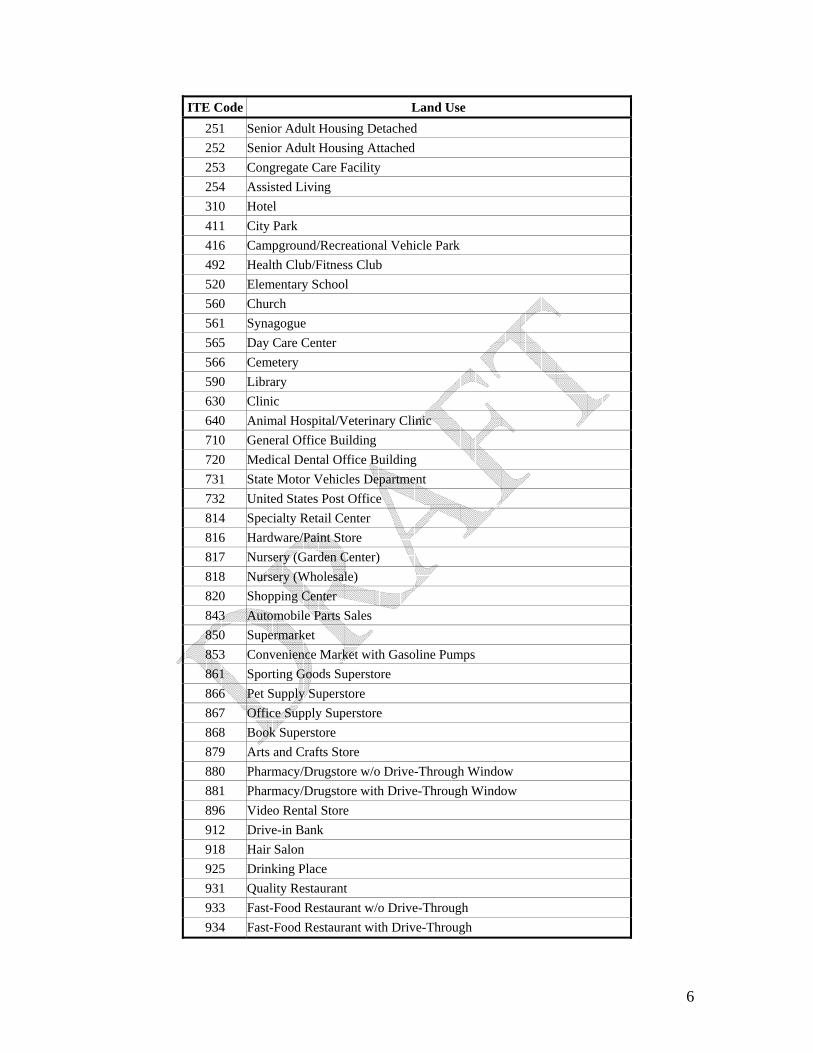
6
ITE Code Land Use 251 Senior Adult Housing Detached 252 Senior Adult Housing Attached 253 Congregate Care Facility 254 Assisted Living 310 Hotel 411 City Park 416 Campground/Recreational Vehicle Park 492 Health Club/Fitness Club 520 Elementary School 560 Church 561 Synagogue 565 Day Care Center 566 Cemetery 590 Library 630 Clinic 640 Animal Hospital/Veterinary Clinic 710 General Office Building 720 Medical Dental Office Building 731 State Motor Vehicles Department 732 United States Post Office 814 Specialty Retail Center 816 Hardware/Paint Store 817 Nursery (Garden Center) 818 Nursery (Wholesale) 820 Shopping Center 843 Automobile Parts Sales 850 Supermarket 853 Convenience Market with Gasoline Pumps 861 Sporting Goods Superstore 866 Pet Supply Superstore 867 Office Supply Superstore 868 Book Superstore 879 Arts and Crafts Store 880 Pharmacy/Drugstore w/o Drive-Through Window 881 Pharmacy/Drugstore with Drive-Through Window 896 Video Rental Store 912 Drive-in Bank 918 Hair Salon 925 Drinking Place 931 Quality Restaurant 933 Fast-Food Restaurant w/o Drive-Through 934 Fast-Food Restaurant with Drive-Through
7
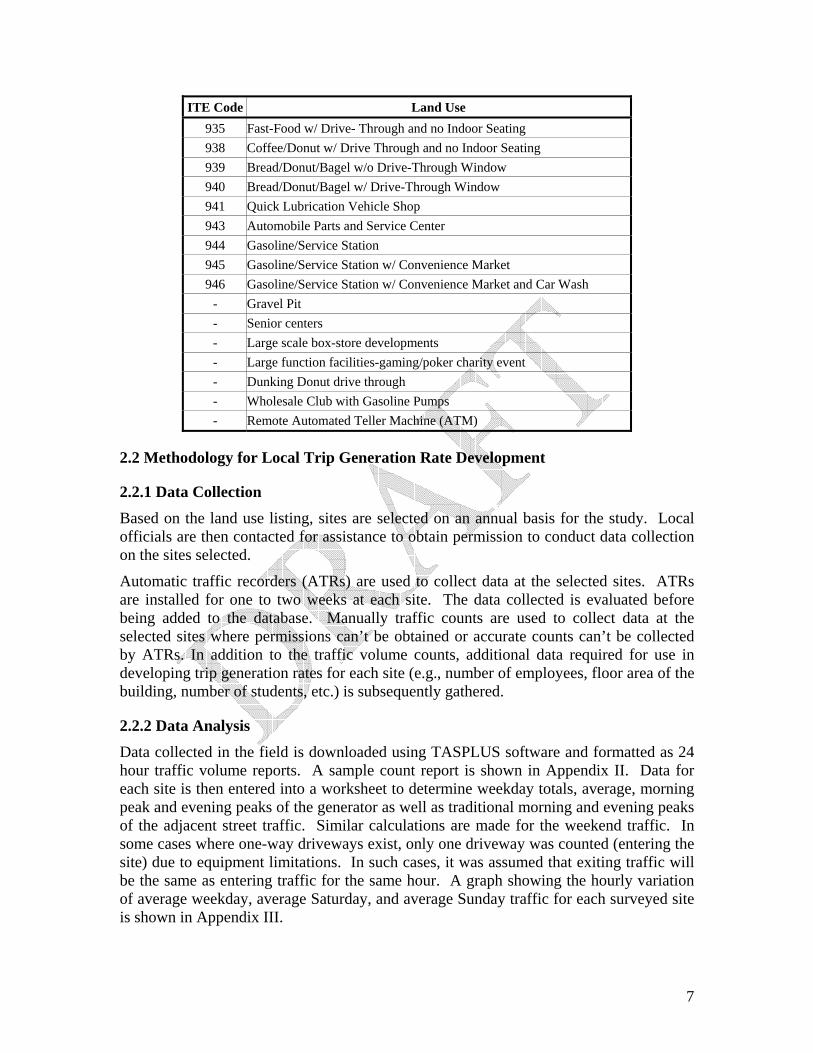
ITE Code Land Use 935 Fast-Food w/ Drive- Through and no Indoor Seating 938 Coffee/Donut w/ Drive Through and no Indoor Seating 939 Bread/Donut/Bagel w/o Drive-Through Window 940 Bread/Donut/Bagel w/ Drive-Through Window 941 Quick Lubrication Vehicle Shop 943 Automobile Parts and Service Center 944 Gasoline/Service Station 945 Gasoline/Service Station w/ Convenience Market 946 Gasoline/Service Station w/ Convenience Market and Car Wash
- Gravel Pit - Senior centers - Large scale box-store developments - Large function facilities-gaming/poker charity event - Dunking Donut drive through - Wholesale Club with Gasoline Pumps - Remote Automated Teller Machine (ATM)
2.2 Methodology for Local Trip Generation Rate Development
2.2.1 Data Collection Based on the land use listing, sites are selected on an annual basis for the study. Local officials are then contacted for assistance to obtain permission to conduct data collection on the sites selected.
Automatic traffic recorders (ATRs) are used to collect data at the selected sites. ATRs are installed for one to two weeks at each site. The data collected is evaluated before being added to the database. Manually traffic counts are used to collect data at the selected sites where permissions can’t be obtained or accurate counts can’t be collected by ATRs. In addition to the traffic volume counts, additional data required for use in developing trip generation rates for each site (e.g., number of employees, floor area of the building, number of students, etc.) is subsequently gathered.
2.2.2 Data Analysis Data collected in the field is downloaded using TASPLUS software and formatted as 24 hour traffic volume reports. A sample count report is shown in Appendix II. Data for each site is then entered into a worksheet to determine weekday totals, average, morning peak and evening peaks of the generator as well as traditional morning and evening peaks of the adjacent street traffic. Similar calculations are made for the weekend traffic. In some cases where one-way driveways exist, only one driveway was counted (entering the site) due to equipment limitations. In such cases, it was assumed that exiting traffic will be the same as entering traffic for the same hour. A graph showing the hourly variation of average weekday, average Saturday, and average Sunday traffic for each surveyed site is shown in Appendix III.

8
2.2.3 Results As stated earlier, additional data collected for the land uses in the study is applied to the traffic data to calculate the trip rates per unit (e.g., trips per employee, trips per 1000 sq. ft., etc.). Graphical plots and statistical calculations will be performed when sufficient samples have been added to the data base. As the project continues, these calculations will be completed and the results will be reported and added to the data base.
2.2.4 Comparison of Trip Rates This study is designed to compare locally generated trip rates with trip rates in the ITE data base. ITE trip rates represent an average of nationally collected trip data. Local trip rates may vary from these nationally averaged rates based on factors such as location (i.e., CBD, outer limits of the city, suburb, rural area, etc.), the existing transportation system (i.e., freeway, major arterial, local streets, etc.) and the presence of any other major trip generators. The trip rates in this report represent a weighted average and may vary after more data is collected.
2.3 Further Study
As mentioned earlier, the Trip Generation Study is designed as a multiyear project. The reliability of the data and observations drawn from it will increase with the number of sites studied. Due to time and fiscal constraints, a limited number of sites can be surveyed each year. Periodically, an updated version of this report will be prepared as additional data is collected.

9
CHAPTER 3 ELDERLY HOUSING ATTACHED (252)
Senior adult housing consists of attached independent living developments, including retirement communities, age-restricted housing and active adult communities. These developments may include limited social or recreational services. However, they generally lack centralized dining and on-site medical facilities. Residents in these communities live independently, are typically active (requiring little to no medical supervision) and may or may not be retired.
3.1 Data Collection Sites selected were shown in table 3.1 and data were collected at the sites.
Table 3.1 Selected Survey Site
3.2 Data Analysis Trip summary at the sites is presented in table 3.2.
Table 3.2 Trip Summary at the Sites Site 1 Edward J Roy Apartments 27 College Rd, Goffstown, NH 03045
Daily Trip Ends (In + Out) 204 AM Peak Trip Ends (In + Out) 22 at 11:00 AM PM Peak Trip Ends (In + Out) 20 at 1:00 PM 7-9 AM Peak Hour Trip Ends (In + Out) 11
Weekday
4-6 PM Peak Hour Trip Ends (In + Out) 14 Daily Trip Ends (In + Out) 164 AM Peak Trip Ends (In + Out) 15 at 11:00 AM Saturday
PM Peak Trip Ends (In + Out) 20 at 3:00 PM Daily Trip Ends (In + Out) 175 AM Peak Trip Ends (In + Out) 15 at 11:00 AM Sunday PM Peak Trip Ends (In + Out) 19 at 3:00 PM
Site 2 Carlton Crossing 10 Colby Ct. Bedford, NH
Daily Trip Ends (In + Out) 134 AM Peak Trip Ends (In + Out) 18 at 11:00 AM
Land Use Site Address
Edward J Roy Apartments 27 College Road, Goffstown, NH 03045
Carlton Crossing 10 Colby Ct, Bedford, NH 03110
Hollyberry Hill 319 Londonderry Tpk, Hooksett, NH 03106
Senior Adult Housing - Attached
West View Terrace 9 Lindsay Rd, Hooksett, NH 03106

10
PM Peak Trip Ends (In + Out) 13 at 2:00 PM 7-9 AM Peak Hour Trip Ends (In + Out) 6 4-6 PM Peak Hour Trip Ends (In + Out) 10 Daily Trip Ends (In + Out) 114 AM Peak Trip Ends (In + Out) 12 at 9:00 AM
Saturday
PM Peak Trip Ends (In + Out) 11 at 1:00 PM Daily Trip Ends (In + Out) 119 AM Peak Trip Ends (In + Out) 13 at 11:00 AM Sunday PM Peak Trip Ends (In + Out) 13 at 12:00 PM
Site 3 Hollyberry Hill 319 Londonderry Tpk, Hooksett, NH
Daily Trip Ends (In + Out) 114 AM Peak Trip Ends (In + Out) 13 at 11:00 AM PM Peak Trip Ends (In + Out) 11 at 12:00 PM 7-9 AM Peak Hour Trip Ends (In + Out) 8
Weekday
4-6 PM Peak Hour Trip Ends (In + Out) 7 Daily Trip Ends (In + Out) 81 AM Peak Trip Ends (In + Out) 8 at 11:00 AM
Saturday
PM Peak Trip Ends (In + Out) 10 at 3:00 PM Daily Trip Ends (In + Out) 97 AM Peak Trip Ends (In + Out) 12 at 11:00 AM Sunday PM Peak Trip Ends (In + Out) 12 at 2:00 PM
Site 4 West View Terrace 9 Lindsay Rd, Hooksett, NH
Daily Trip Ends (In + Out) 102 AM Peak Trip Ends (In + Out) 11 at 10:00 AM PM Peak Trip Ends (In + Out) 9 at 12:00 PM 7-9 AM Peak Hour Trip Ends (In + Out) 4
Weekday
4-6 PM Peak Hour Trip Ends (In + Out) 6 Daily Trip Ends (In + Out) 71 AM Peak Trip Ends (In + Out) 10 at 11:00 AM
Saturday
PM Peak Trip Ends (In + Out) 7 at 12:00 PM Daily Trip Ends (In + Out) 78 AM Peak Trip Ends (In + Out) 9 at 11:00 AM Sunday PM Peak Trip Ends (In + Out) 14 at 12:00 PM

11
3.3 Results Average vehicle trip ends per unit and directional distribution for each site are presented in Table 3.3.
Table 3.3 Trip Rates for Senior Adult Housing - Attached
Site: Edward J Roy Apartments Number of Dwelling Units: 60 Occupied Dwelling Units: 60
Trip Basis Unit Average Vehicle Trip Ends per Unit Directional Distribution
Daily Occupied Dwelling Unit 3.4 50% in, 50% out AM Peak Hour of Generator Occupied Dwelling Unit 0.37 55% in, 45% out PM Peak Hour of Generator Occupied Dwelling Unit 0.33 55% in, 45% out One Hour Between 7 am - 9 am Occupied Dwelling Unit 0.18 36% in, 64% out
Weekday
One Hour Between 4 pm – 6 pm Occupied Dwelling Unit 0.23 57% in, 43% out Daily Occupied Dwelling Unit 2.73 50% in, 50% out AM Peak Hour of Generator Occupied Dwelling Unit 0.25 53% in, 47% out Saturday
PM Peak Hour of Generator Occupied Dwelling Unit 0.33 40% in, 60% out Daily Occupied Dwelling Unit 2.92 50% in, 50% out AM Peak Hour of Generator Occupied Dwelling Unit 0.25 57% in, 43% out Sunday
PM Peak Hour of Generator Occupied Dwelling Unit 0.32 58% in, 42% out Site: Carlton Crossing Number of Dwelling Units: 28 Occupied Dwelling Units: 28
Daily Occupied Dwelling Unit 4.78 50% in, 50% out AM Peak Hour of Generator Occupied Dwelling Unit 0.64 50% in, 50% out PM Peak Hour of Generator Occupied Dwelling Unit 0.46 45% in, 65% out One Hour Between 7 am - 9 am Occupied Dwelling Unit 0.21 50% in, 50% out
Weekday
One Hour Between 4 pm – 6 pm Occupied Dwelling Unit 0.35 50% in, 50% out Daily Occupied Dwelling Unit 4.07 50% in, 50% out Saturday
AM Peak Hour of Generator Occupied Dwelling Unit 0.43 50% in, 50% out

12
PM Peak Hour of Generator Occupied Dwelling Unit 0.39 50% in, 50% out Daily Occupied Dwelling Unit 4.25 50% in, 50% out AM Peak Hour of Generator Occupied Dwelling Unit 0.46 55% in, 45% out Sunday
PM Peak Hour of Generator Occupied Dwelling Unit 0.46 45% in, 55% out Site: Hollyberry Hill Number of Dwelling Units: 44 Occupied Dwelling Units: 44
Daily Occupied Dwelling Unit 2.59 50% in, 50% out AM Peak Hour of Generator Occupied Dwelling Unit 0.30 40% in, 60% out PM Peak Hour of Generator Occupied Dwelling Unit 0.25 55% in, 45% out One Hour Between 7 am - 9 am Occupied Dwelling Unit 0.18 40% in, 60% out
Weekday
One Hour Between 4 pm – 6 pm Occupied Dwelling Unit 0.16 40% in, 60% out Daily Occupied Dwelling Unit 1.84 50% in, 50% out AM Peak Hour of Generator Occupied Dwelling Unit 0.18 60% in, 40% out Saturday
PM Peak Hour of Generator Occupied Dwelling Unit 0.23 30% in, 70% out Daily Occupied Dwelling Unit 2.20 50% in, 50% out AM Peak Hour of Generator Occupied Dwelling Unit 0.27 40% in, 60% out Sunday
PM Peak Hour of Generator Occupied Dwelling Unit 0.27 50% in, 50% out Site: West View Terrace Number of Dwelling Units: 30 Occupied Dwelling Units: 30
Daily Occupied Dwelling Unit 3.4 50% in, 50% out AM Peak Hour of Generator Occupied Dwelling Unit 0.37 45% in, 55% out PM Peak Hour of Generator Occupied Dwelling Unit 0.30 45% in, 55% out One Hour Between 7 am - 9 am Occupied Dwelling Unit 0.13 25% in, 75% out
Weekday
One Hour Between 4 pm – 6 pm Occupied Dwelling Unit 0.20 50% in, 50% out Daily Occupied Dwelling Unit 2.37 50% in, 50% out AM Peak Hour of Generator Occupied Dwelling Unit 0.33 60% in, 40% out Saturday
PM Peak Hour of Generator Occupied Dwelling Unit 0.23 70% in, 30% out Daily Occupied Dwelling Unit 2.60 50% in, 50% out Sunday
AM Peak Hour of Generator Occupied Dwelling Unit 0.30 55% in, 45% out

13
PM Peak Hour of Generator Occupied Dwelling Unit 0.47 55% in, 45% out
3.4 Comparison of Trip Rates Table 3.4 shows that the weekday average trip rate and Saturday and Sunday trip rates are close to the ITE report. The weekday morning and evening peak trip rates are much higher than that in the ITE report.
Table 3.4 Comparison of Trip Rates for Elderly Housing - Attached
ITE LAND USE CODE 253 ELDERLY HOUSING - ATTACHED
Trip Basis Unit Average Vehicle Trip Ends per Unit
ITE Trip Rates Average [Range]
Daily Occupied Dwelling Unit 3.42 [2.59-4.78] 3.48 AM Peak Hour of Generator Occupied Dwelling Unit 0.40 [0.30-0.64] 0.06[0.02-0.37] PM Peak Hour of Generator Occupied Dwelling Unit 0.33 [0.25-0.46] 0.11[0.03-0.25] One Hour Between 7 am - 9 am Occupied Dwelling Unit 0.18 [0.13-0.21] 0.07[0.02-0.31]
Weekday
One Hour Between 4 pm – 6 pm Occupied Dwelling Unit 0.23 [0.16-0.35] 0.10[0.03-0.32] Daily Occupied Dwelling Unit 2.65 [1.84-4.07] 2.51 AM Peak Hour of Generator Occupied Dwelling Unit 0.28 [0.18-0.43] Saturday
PM Peak Hour of Generator Occupied Dwelling Unit 0.29 [0.23-0.39] 0.30 Daily Occupied Dwelling Unit 2.90 [2.20-4.25] 2.70 AM Peak Hour of Generator Occupied Dwelling Unit 0.30 [0.25-0.46] Sunday PM Peak Hour of Generator Occupied Dwelling Unit 0.36 [0.27-0.47] 0.55

14
CHAPTER 4 ADULT HOUSING – DETHATCHED (251)
Senior adult housing consists of detached independent living developments, including retirement communities, age-restricted housing and active adult communities. These developments may include amenities such as golf courses, swimming pools, 24-hour security, transportation and common recreational facilities. However, they generally lack centralized dining and on-site health facilities. Detached senior adult housing communities may or may not be gated. Residents in these communities are typically active (requiring little to no medical supervision). The percentage of retired residents varies by development.
4.1 Data Collection Data were collected at the following site.
Table 4.1 Selected Survey Sites Land Use Site Address Senior Adult Housing – Detached Hillcrest Terrace 200Alliance Way, Manchester, NH 03102
4.2 Data Analysis Trip summary at the sites is shown in table 4.2.
Table 4.2 Trip Summary at the Sites Land Use: Senior Adult Housing- Detached Site: Hillcrest Terrace Address: 200Alliance Way, Manchester, NH 03102
Daily Trip Ends (In + Out) 617
AM Peak Trip Ends (In + Out) 52 at 11:00 AM Weekday
PM Peak Trip Ends (In + Out) 65 at 3:00 PM Daily Trip Ends (In + Out) 476 AM Peak Trip Ends (In + Out) 42 at 11:00 AM Saturday PM Peak Trip Ends (In + Out) 51 at 2:00PM Daily Trip Ends (In + Out) 440 AM Peak Trip Ends (In + Out) 47 at 11:00 AM Sunday PM Peak Trip Ends (In + Out) 51 at 3:00 PM

15
4.3 Results Average vehicle trip ends per unit and directional for each site are shown in Table 4.3.
Table 4.3 Senior Adult Housing - Detached
4.4 Comparison of Trip Rates The weekday average trip rate is very close to that in the ITE report. The weekday morning and evening peak trip rates (0.40 and 0.33) are much higher than that in the ITE report (0.06 and 0.11). Locally collected data is also out of range of the ITE numbers. Saturday and Sunday trip rates are also close to the ITE average.
Land Use: Senior Adult Housing- Detached Site: Hillcrest Terrace No. of Dwelling units: 205
Trip Basis Unit Average Vehicle Trip Ends per Unit
Directional Distribution
Daily Dwelling Units 3.01 50% in, 50% out
AM Peak Hour of Generator Dwelling Units 0.26 54% in, 46% out PM Peak Hour of Generator Dwelling Units 0.32 49% in, 51% out One Hour Between 7 am - 9 am Dwelling Units 0.14 64% in, 36% out
Weekday
One Hour Between 4 pm – 6 pm Dwelling Units 0.25 47% in, 53% out Daily Dwelling Units 2.32 49% in, 51% out
AM Peak Hour of Generator Dwelling Units 0.20 52% in, 48% out Saturday
PM Peak Hour of Generator Dwelling Units 0.25 46% in, 54% out Daily Dwelling Units 2.15 49% in, 51% out AM Peak Hour of Generator Dwelling Units 0.23 56% in, 44% out Sunday PM Peak Hour of Generator Dwelling Units 0.25 47% in, 53% out

16
Table 4.4 Comparison of Trip Rates for Elderly Housing - Attached
ITE LAND USE CODE 253 ELDERLY HOUSING - ATTACHED
Trip Basis Unit Average Vehicle Trip Ends per Unit
ITE Trip Rates Average [Range]
Daily Occupied Dwelling Unit 3.42 [2.59-4.78] 3.48 AM Peak Hour of Generator Occupied Dwelling Unit 0.40 [0.30-0.64] 0.06[0.02-0.37] PM Peak Hour of Generator Occupied Dwelling Unit 0.33 [0.25-0.46] 0.11[0.03-0.25] One Hour Between 7 am - 9 am Occupied Dwelling Unit 0.18 [0.13-0.21] 0.07[0.02-0.31]
Weekday
One Hour Between 4 pm – 6 pm Occupied Dwelling Unit 0.23 [0.16-0.35] 0.10[0.03-0.32] Daily Occupied Dwelling Unit 2.65 [1.84-4.07] 2.51 AM Peak Hour of Generator Occupied Dwelling Unit 0.28 [0.18-0.43] Saturday
PM Peak Hour of Generator Occupied Dwelling Unit 0.29 [0.23-0.39] 0.30 Daily Occupied Dwelling Unit 2.90 [2.20-4.25] 2.70 AM Peak Hour of Generator Occupied Dwelling Unit 0.30 [0.25-0.46] Sunday PM Peak Hour of Generator Occupied Dwelling Unit 0.36 [0.27-0.47] 0.55

17
CHAPTER 5 DAY CARE CENTER (565)
A day care center is a facility where care for pre-school age children is provided, normally during the daytime hours. Day care facilities generally include classrooms, offices, eating areas and playgrounds. Some centers also provide after-school care for school-age children.
5.1 Data Collection Sites selected were shown in table 5.1 and data were collected at the sites.
Table 5.1 Selected Survey Site Land Use Site Address
VNA Child Care Center 435 South Main St, Manchester, NH 03104
Day Care Center Derry Day Care and Learning Center
55 Bypass-28, Derry, NH 03038
5.1 Data Analysis Trip summary at the sites is shown in Table 5.2.
Table 5.2 Trip Summary at the sites Site 1 VNA Child Care Center 435 South Main St., Manchester, NH 03104
Daily Trip Ends (In + Out) 655 AM Peak Trip Ends (In + Out) 110 at 8:00 AM PM Peak Trip Ends (In + Out) 119 at 6:00 PM 7-9 AM Peak Hour Trip Ends (In + Out) 110
Weekday
4-6 PM Peak Hour Trip Ends (In + Out) 95 Daily Trip Ends (In + Out) AM Peak Trip Ends (In + Out) Saturday
PM Peak Trip Ends (In + Out)
Daily Trip Ends (In + Out) AM Peak Trip Ends (In + Out) Sunday
PM Peak Trip Ends (In + Out)
Site 2 Derry Day Care and Learning Center Address: 55 Bypass-28, Derry, NH 03038
Daily Trip Ends (In + Out) 133 AM Peak Trip Ends (In + Out) 22 at 8:00 AM PM Peak Trip Ends (In + Out) 15 at 3:00 PM 7-9 AM Peak Hour Trip Ends (In + Out) 22
Weekday
4-6 PM Peak Hour Trip Ends (In + Out) 13 Daily Trip Ends (In + Out) AM Peak Trip Ends (In + Out) Saturday
PM Peak Trip Ends (In + Out)

18
Daily Trip Ends (In + Out) AM Peak Trip Ends (In + Out) Sunday
PM Peak Trip Ends (In + Out)

19
5.3 Results Trip summary at the sites is shown in Table 5.2.
Table 5.2 Trip Summary Site 1 VNA Child Care Center, 435 South Main St., Manchester, NH 03104Center Number of Employees: 40 Number of Students: 210 Building Area: 27,128 sq. ft
Trip Basis Unit Average Vehicle Trip Ends per Unit Directional Distribution
Daily Employee/Student/1000 sq. ft. 16.37/3.12/24.14 50% entering, 50% exiting AM Peak Hour of Generator Employee/Student/1000 sq .ft. 2.75/0.52/4.05 52% entering, 48% exiting PM Peak Hour of Generator Employee/Student/1000 sq .ft. 2.97/0.56/4.38 40% entering, 60% exiting One Hour Between 7 am - 9 am Employee/Student/1000 sq .ft. 2.75/0.52/4.05 52% entering, 48% exiting
Weekday
One Hour Between 4 pm – 6 pm Employee/Student/1000 sq .ft. 2.37/0.45/3.50 50% entering, 50% exiting Daily AM Peak Hour of Generator
Saturday
PM Peak Hour of Generator
Daily AM Peak Hour of Generator Sunday PM Peak Hour of Generator
Site 2 Derry Day Care and Learning Center, 55 Bypass-28, Derry, NH 03038Care and Learning Center Number of Employees: 12 Number of Students: 52 Building Area: 3800 sq .ft.
Daily Employee/Student/1000 sq. ft. 11.08/2.56/35 50% entering, 50% exiting AM Peak Hour of Generator Employee/Student/1000 sq. ft. 1.83/0.42/5.79 55% entering, 45% exiting PM Peak Hour of Generator Employee/Student/1000 sq .ft. 1.25/0.29/3.95 53% entering, 47% exiting One Hour Between 7 am - 9 am Employee/Student/1000 sq. ft. 1.83/0.42/5.79 55% entering, 45% exiting
Weekday
One Hour Between 4 pm – 6 pm Employee/Student/1000 sq .ft. 1.08/0.25/3.42 46% entering, 54% exiting Daily AM Peak Hour of Generator
Saturday
PM Peak Hour of Generator

20
Daily AM Peak Hour of Generator Sunday
PM Peak Hour of Generator
5.4 Comparison of Trip Rates i. Trips based on employees
The weekday average trip rates for daily, morning and evening peak hours of the generator , morning and evening peak hours of the adjacent street traffic were about 50% lower than the ITE rates. All of these trip rates were also towards the lower limit of the ITE trip ranges.
ii. Trips based on students
The weekday average trip rates for daily, morning and evening peak hours of the generator , morning and evening peak hours of the adjacent street traffic were about 40% lower than the ITE rates. All of these trip rates were also towards the lower limit of the ITE trip ranges.
iii Trips based on floor area
The weekday average trip rates for daily, morning and evening peak hours of the generator , morning and evening peak hours of the adjacent street traffic were about 67% lower than the ITE rates. All of these trip rates were also out of range of the ITE trip rates.
Table 5.4 Comparison of Trip Rates for Day Care Center
ITE LAND USE CODE 565 DAY CARE CENTER
Trip Basis Unit SNHPC Trip Rates Average [Range]
ITE Trip Rates Average [Range]
Daily Employee Student
1000 sq .ft
15.15 [11.08-16.37] 3.01 [2.56-3.12] 25.47 [24.14-35]
31.19 [12.50 – 50.43] 4.52 [2.50-7.06] 79.26 [57.17-126.07]
Weekday
AM Peak Hour of Generator Employee Student
1000 sq .ft
2.54 [1.83-2.75] 0.50 [0.42-0.52] 4.26 [4.05-5.79]
5.22 [2.06 – 16.33] 0.82 [0.39-1.78] 13.50 [4.43-41.57]

21
PM Peak Hour of Generator Employee Student
1000 sq .ft
2.57 [1.25-2.97] 0.51 [0.29-0.56] 4.33 [3.95-4.38]
5.39 [1.13 – 14.00] 0.86 [0.39-1.72] 13.94 [6.15-39.17]
One Hour Between 7 am - 9 am Employee Student
1000 sq .ft
2.54 [1.83-2.75] 0.50 [0.42-0.52] 4.26 [4.05-5.79]
5.02 [1.88 – 16.33] 0.81 [0.39-1.78] 12.71 [4.43-34.92]
One Hour Between 4 pm – 6 pm Employee Student
1000 sq .ft
2.07 [1.08-2.37] 0.41 [0.25-0.45] 3.49 [3.42-3.50]
5.19 [0.69 – 14.00] 0.86 [0.24-1.72] 13.20 [6.15-33.66]
Daily AM Peak Hour of Generator
Saturday
PM Peak Hour of Generator
Daily AM Peak Hour of Generator Sunday PM Peak Hour of Generator

22
CHAPTER 6 DRIVE-THROUGH ONLY COFFEE RESTAURANT
Drive-through only coffee restaurants have very small building areas and may provide a limited amount of outside seating. These limited-service eating establishments usually do not provide table service. This land use isn’t included in the ITE Trip Generation Manual.
6.1 Data collection Sites selected were shown in Table 6.1 and data were collected at the sites.
Table 6.1 Selected Survey Site
Land Use Site Address Drive-Through Only Coffee Restaurant Quikava 2301 Brown Ave, Manchester, NH 03103
6.2 Data Analysis Trip summary at the sites is shown in table 6.2.
Table 6.2 Trip Summary at the Sites Land Use: Drive-Through Only Coffee Restaurant Site: Quikava Address: 2301 Brown Ave, Manchester, NH 03103
Daily Trip Ends (In + Out) 1206 AM Peak Trip Ends (In + Out) 163 at 8:00 AM PM Peak Trip Ends (In + Out) 68 at 12:00 PM 7-9 AM Peak Hour Trip Ends (In + Out) 163
Weekday
4-6 PM Peak Hour Trip Ends (In + Out) 45 Daily Trip Ends (In + Out) 1116 Saturday
AM Peak Trip Ends (In + Out) 112 at 9:00 AM

23
PM Peak Trip Ends (In + Out) 98 at 12:00 PM Daily Trip Ends (In + Out) 980 AM Peak Trip Ends (In + Out) 112 at 9:00 AM Sunday
PM Peak Trip Ends (In + Out) 94 at 12:00 PM
6.3 Results Average vehicle trip ends per unit and directional distribution for each site are shown in Table 6.3.
Table 6.3 Trip Rates for Drive-Through Only Coffee Restaurant Site: Quikava Number of Employees: Approximately 3 per Shift Building Area: 555 sq .ft
Trip Basis Unit Average Vehicle Trip Ends per Unit Directional Distribution
Daily Employee/1000 sq .ft. 402 / 2,173 50% entering, 50% exiting AM Peak Hour of Generator Employee/1000 sq. ft. 54.33 / 293.70 50% entering, 50% exiting PM Peak Hour of Generator Employee/1000 sq .ft. 22.67 / 122.50 50% entering, 50% exiting One Hour Between 7 am - 9 am Employee/1000 sq .ft. 54.33 / 293.70 50% entering, 50% exiting
Weekday
One Hour Between 4 pm – 6 pm Employee/1000 sq .ft. 15 / 81.08 50% entering, 50% exiting Daily Employee/1000 sq .ft. 372 / 2010.8 50% entering, 50% exiting AM Peak Hour of Generator Employee/1000 sq .ft. 37.33 / 201.8 50% entering, 50% exiting Saturday PM Peak Hour of Generator Employee/1000 sq. ft. 32.67 / 176.57 50% entering, 50% exiting Daily Employee/1000 sq .ft. 326.67 / 1,765.76 50% entering, 50% exiting AM Peak Hour of Generator Employee/1000 sq .ft. 37.33 / 201.80 50% entering, 50% exiting Sunday PM Peak Hour of Generator Employee/1000 sq. ft. 31.33 / 169.37 50% entering, 50% exiting
24
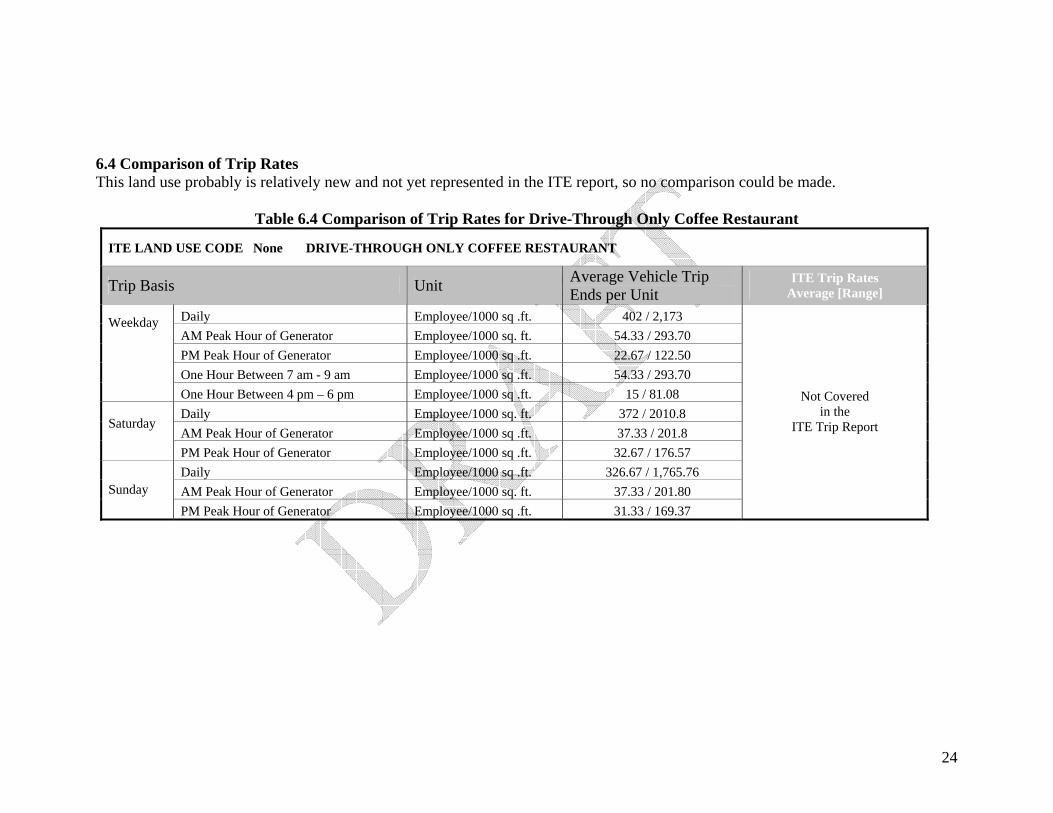
6.4 Comparison of Trip Rates This land use probably is relatively new and not yet represented in the ITE report, so no comparison could be made.
Table 6.4 Comparison of Trip Rates for Drive-Through Only Coffee Restaurant
ITE LAND USE CODE None DRIVE-THROUGH ONLY COFFEE RESTAURANT
Trip Basis Unit Average Vehicle Trip Ends per Unit
ITE Trip Rates Average [Range]
Daily Employee/1000 sq .ft. 402 / 2,173 AM Peak Hour of Generator Employee/1000 sq. ft. 54.33 / 293.70 PM Peak Hour of Generator Employee/1000 sq .ft. 22.67 / 122.50 One Hour Between 7 am - 9 am Employee/1000 sq .ft. 54.33 / 293.70
Weekday
One Hour Between 4 pm – 6 pm Employee/1000 sq .ft. 15 / 81.08 Daily Employee/1000 sq. ft. 372 / 2010.8 AM Peak Hour of Generator Employee/1000 sq .ft. 37.33 / 201.8
Saturday
PM Peak Hour of Generator Employee/1000 sq .ft. 32.67 / 176.57 Daily Employee/1000 sq .ft. 326.67 / 1,765.76 AM Peak Hour of Generator Employee/1000 sq. ft. 37.33 / 201.80 Sunday PM Peak Hour of Generator Employee/1000 sq .ft. 31.33 / 169.37
Not Covered in the
ITE Trip Report

25
CHAPTER 7 UNITED STATES POST OFFICE (732)
A U.S. post office is a federal building that contains service windows for mailing packages and letters; post office boxes; offices; sorting and distributing facilities for mail; and vehicle storage areas.
7.1 Data Collection Sites were selected to collect data shown in Table 7.1. After being evaluated, the data collected at Auburn Post Office and Candia Post Office was not eligible to be added to the database.
Table 7.1 Selected Survey Site Land Use Site Address
Manchester Post Office 955 Goffs Falls Road, Manchester, NH 03103
Auburn Post Office 30 Raymond RD, Auburn, NH 03032 United States Post
Office Candia Post Office 115 Raymond Road, Candia, NH 03034
7.2 Data Analysis Trip Summary at the site is shown in Table 7.2.
Table 7.2 Trip Summary at the Site Site 1 Manchester Post Office Address: 955 Goffs Falls Rd, Manchester, NH 03103
Daily Trip Ends (In + Out) 3793 AM Peak Trip Ends (In + Out) 262 at 10:00 AM PM Peak Trip Ends (In + Out) 307 at 2:00 PM 7-9 AM Peak Hour Trip Ends (In + Out) 238
Weekday
4-6 PM Peak Hour Trip Ends (In + Out) 307 Daily Trip Ends (In + Out) 3003 AM Peak Trip Ends (In + Out) 415 at 11:00 AM Saturday
PM Peak Trip Ends (In + Out) 304 at 3:00 PM Daily Trip Ends (In + Out) 1841 AM Peak Trip Ends (In + Out) 138 at 11:00 AM Sunday
PM Peak Trip Ends (In + Out) 172 at 3:00 PM Site 2 Auburn Post Office Address: 30 Raymond Rd, Auburn, NH 03032
Daily Trip Ends (In + Out) 550 AM Peak Trip Ends (In + Out) 55 at 10:00 AM PM Peak Trip Ends (In + Out) 70 at 2:00 PM 7-9 AM Peak Hour Trip Ends (In + Out) 43
Weekday
4-6 PM Peak Hour Trip Ends (In + Out) 55 Saturday Daily Trip Ends (In + Out) 370

26
AM Peak Trip Ends (In + Out) 87 at 11:00 AM
PM Peak Trip Ends (In + Out) 11 at 12:00 PM Daily Trip Ends (In + Out) AM Peak Trip Ends (In + Out) Sunday
PM Peak Trip Ends (In + Out) Site 3 Candia Post Office Address: 30 Raymond Rd, Auburn, NH 03032
Daily Trip Ends (In + Out) 706 AM Peak Trip Ends (In + Out) 80 at 9:00 AM PM Peak Trip Ends (In + Out) 71 at 3:00 PM 7-9 AM Peak Hour Trip Ends (In + Out) 80
Weekday
4-6 PM Peak Hour Trip Ends (In + Out) 71 Daily Trip Ends (In + Out) 477 AM Peak Trip Ends (In + Out) 100 at 11:00 AM Saturday
PM Peak Trip Ends (In + Out) 16 at 12:00 PM Daily Trip Ends (In + Out) 1841 AM Peak Trip Ends (In + Out) 138 at 11:00 AM Sunday
PM Peak Trip Ends (In + Out) 172 at 3:00 PM

27
7.3 Results Average vehicle trip ends per unit and directional distribution for each site are shown in Table 7.3.
Table 7.3 Trip Rates for United States Post Office Site: Manchester Main United States Post Office Number of Employees: Approximately 280 per Shift
Trip Basis Unit Average Vehicle Trip Ends per Unit Directional Distribution
Daily Employee 13.54 50% entering, 50% exiting AM Peak Hour of Generator Employee 0.94 50% entering, 50% exiting PM Peak Hour of Generator Employee 1.10 50% entering, 50% exiting One Hour Between 7 am - 9 am Employee 0.85 50% entering, 50% exiting
Weekday
One Hour Between 4 pm – 6 pm Employee 1.10 50% entering, 50% exiting Daily Employee 10.73 50% entering, 50% exiting AM Peak Hour of Generator Employee 1.48 50% entering, 50% exiting Saturday
PM Peak Hour of Generator Employee 1.09 50% entering, 50% exiting Daily Employee 6.58 50% entering, 50% exiting AM Peak Hour of Generator Employee 0.49 50% entering, 50% exiting Sunday PM Peak Hour of Generator Employee 0.61 50% entering, 50% exiting
Site: Auburn United States Post Office Number of Employees: Approximately 10 Gross Floor Area: 4,000 sq. ft.
Trip Basis Unit Average Vehicle Trip Ends per Unit Directional Distribution
Daily Employee/1000 sq. ft 55/137.5 50% entering, 50% exiting AM Peak Hour of Generator Employee/1000 sq .ft 5.5/13.75 49% entering, 51% exiting PM Peak Hour of Generator Employee/1000 sq. ft 7/17.5 48% entering, 52% exiting One Hour Between 7 am - 9 am Employee/1000 sq. ft 4.3/10.75 49% entering, 51% exiting
Weekday
One Hour Between 4 pm – 6 pm Employee/1000 sq. ft 5.5/13.75 48% entering, 52% exiting Saturday Daily Employee/1000 sq. ft 37/92.5 50% entering, 50% exiting

28
AM Peak Hour of Generator Employee/1000 sq. ft 8.7/21.75 46% entering, 54% exiting
PM Peak Hour of Generator Employee/1000 sq. ft 1.1/2.75 45% entering, 55% exiting Daily AM Peak Hour of Generator Sunday PM Peak Hour of Generator
Site: Candia United States Post Office Number of Employees: 10 Gross Floor Area:3,146 sq. ft.
Trip Basis Unit Average Vehicle Trip Ends per Unit Directional Distribution
Daily Employee/1000 sq. ft 70.6/224.4 50% entering, 50% exiting AM Peak Hour of Generator Employee/1000 sq. ft 8/25.43 51% entering, 49% exiting PM Peak Hour of Generator Employee/1000 sq. ft 7.1/22.57 49% entering, 51% exiting One Hour Between 7 am - 9 am Employee/1000 sq. ft 8/25.43 51% entering, 49% exiting
Weekday
One Hour Between 4 pm – 6 pm Employee/1000 sq. ft 7.1/22.57 49% entering, 51% exiting Daily Employee/1000 sq. ft 47.7/151.62 52% entering, 48% exiting AM Peak Hour of Generator Employee/1000 sq. ft 10/31.78 51% entering, 49% exiting Saturday
PM Peak Hour of Generator Employee/1000 sq. ft 1.6/5.08 44% entering, 56% exiting Daily AM Peak Hour of Generator Sunday PM Peak Hour of Generator

29
7.4 Comparison of Trip Rates Comparison of trip rates is shown in Table 7.4. On an average, the average trip rates per employee on a weekday daily, morning and evening peaks of the generator, and morning and evening peaks of the adjacent street traffic are about 60% lower than the average rate provided in the ITE report. The weekend trips closely match the average ITE rates. In most cases, the SNHPC trip rates are within the range of rates in the ITE report, but almost always towards the lower limit.
Table 7.4 Comparison of Trip Rates for United States Post Office
ITE LAND USE CODE 732 UNITED STATES POST OFFICE
Trip Basis Unit Average Vehicle Trip Ends per Unit
ITE Trip Rates Average [Range]
Daily Employee/1000 sq. ft 16.82/61.87 28.32 [13.33 – 92.79] /108.19[35.57-352.42]
AM Peak Hour of Generator Employee/1000 sq. ft 1.33/6.60 3.15 [1.02 – 27.80] /12.19[2.99-51.20]
PM Peak Hour of Generator Employee/1000 sq. ft 1.50/7.04 3.62 [0.97 – 40.40] /14.67[3.46-82.89]
One Hour Between 7 am - 9 am Employee/1000 sq. ft 1.20/5.93 1.94 [0.90 – 22.90] /8.02[2.21-38.17]
Weekday
One Hour Between 4 pm – 6 pm Employee/1000 sq. ft 1.45/6.20 2.74 [0.90 – 40.40] /10.79[3.24-80]
Daily Employee/1000 sq. ft 12.84/41.71 13.69 [7.46 – 46.09] /48.69[18.35-185.89]
AM Peak Hour of Generator Employee/1000 sq. ft 2.00/9.27 1.65 [0.97 – 6.00] /5.88[2.40-22.53]
Saturday
PM Peak Hour of Generator Employee/1000 sq. ft 1.11/1.32 Daily Employee/1000 sq. ft AM Peak Hour of Generator Employee/1000 sq. ft Sunday PM Peak Hour of Generator Employee/1000 sq. ft

30
CHAPTER 8 PHARMACY/DRUGSTORE WITH DRIVE-THROUGH WINDOW
(881)
Pharmacies/drugstores are retail facilities that primarily sell prescription and non-prescription drugs. These facilities may also sell cosmetics, toiletries, medications, stationary, personal care products, limited food products and general merchandise. The drug stores in this category contain drive-through window.
8.1 Data Collection Sites were selected to collect data shown in Table 8.1.
Table 8.1 Selected Survey Site Land Use Site Address
Walgreens 227 South Main St, Manchester, NH 03102 Pharmacy/Drugstore with Drive Through Window Osco Drug 20 Crystal Ave, Derry, NH 03038
8.2 Data Analysis Trip summary at the sites is shown in Table 8.2.
Table 8.2 Trip Summary at the sites Site 1 Walgreens 227 South Main St, Manchester, NH 03102
Daily Trip Ends (In + Out) 1855 AM Peak Trip Ends (In + Out) 126 at 11:00 AM PM Peak Trip Ends (In + Out) 176 at 7:00 PM 7-9 AM Peak Hour Trip Ends (In + Out) 71
Weekday
4-6 PM Peak Hour Trip Ends (In + Out) 166 Daily Trip Ends (In + Out) AM Peak Trip Ends (In + Out) Saturday
PM Peak Trip Ends (In + Out)
NOT AVAILABLE
Daily Trip Ends (In + Out) AM Peak Trip Ends (In + Out) Sunday
PM Peak Trip Ends (In + Out) NOT AVAILABLE
Site 2 Osco Drug: 20 Crystal Ave, Derry, NH 03038
Daily Trip Ends (In + Out) 1454 AM Peak Trip Ends ( In + Out) 113 at 11:00 AM PM Peak Trip Ends (In + Out) 138 at 5:00 PM 7-9 AM Peak Hour Trip Ends (In + Out) 47
Weekday
4-6 PM Peak Hour Trip Ends (In + Out) 138 Daily Trip Ends (In + Out) 1416 Saturday
AM Peak Trip Ends (In + Out) 139 at 11:00 AM

31
PM Peak Trip Ends (In + Out) 144 at 1:00 PM Daily Trip Ends (In + Out) 1179 AM Peak Trip Ends (In + Out) 110 at 11:00 AM Sunday
PM Peak Trip Ends (In + Out) 115 at 1:00 PM

32
8.3 Results Average vehicle trip ends per unit and directional distribution for each site are shown in Table 8.3.
Table 8.3 Trip Rates Table for pharmacy/drug store Site: Walgreens Building Area: 13,900 sq. ft
Trip Basis Unit Average Vehicle Trip Ends per Unit Directional Distribution
Daily 1000 sq. ft. 133.45 50% entering, 50% exiting AM Peak Hour of Generator 1000 sq. ft. 9.06 50% entering, 50% exiting PM Peak Hour of Generator 1000 sq. ft. 12.66 47% entering, 53% exiting One Hour Between 7 am - 9 am 1000 sq. ft. 5.1 42% entering, 58% exiting
Weekday
One Hour Between 4 pm – 6 pm 1000 sq. ft. 11.94 50% entering, 50% exiting Daily AM Peak Hour of Generator
Saturday
PM Peak Hour of Generator Daily AM Peak Hour of Generator Sunday PM Peak Hour of Generator
NOT AVAILABLE
Site: Osco Drug Building Area: 13,671 sq. ft Employees = 15 per shift
Daily 1000 sq .ft./employee 106.35/96.93 50% entering, 50% exiting AM Peak Hour of Generator 1000 sq .ft./employee 8.26/7.53 50% entering, 50% exiting PM Peak Hour of Generator 1000 sq. ft./employee 10.09/9.2 47% entering, 53% exiting One Hour Between 7 am - 9 am 1000 sq. ft./employee 3.44/3.13 42% entering, 58% exiting
Weekday
One Hour Between 4 pm – 6 pm 1000 sq. ft./employee 10.09/9.2 50% entering, 50% exiting Daily 1000 sq. ft./employee 103.57/94.4 50% entering, 50% exiting Saturday
AM Peak Hour of Generator 1000 sq .ft./employee 10.17/9.26 50% entering, 50% exiting
33
PM Peak Hour of Generator 1000 sq .ft./employee 10.53/9.6 50% entering, 50% exiting Daily 1000 sq .ft./employee 86.24/78.6 50% entering, 50% exiting AM Peak Hour of Generator 1000 sq .ft./employee 8.04/7.33 50% entering, 50% exiting Sunday PM Peak Hour of Generator 1000 sq.ft./employee 8.41/7.66 50% entering, 50% exiting
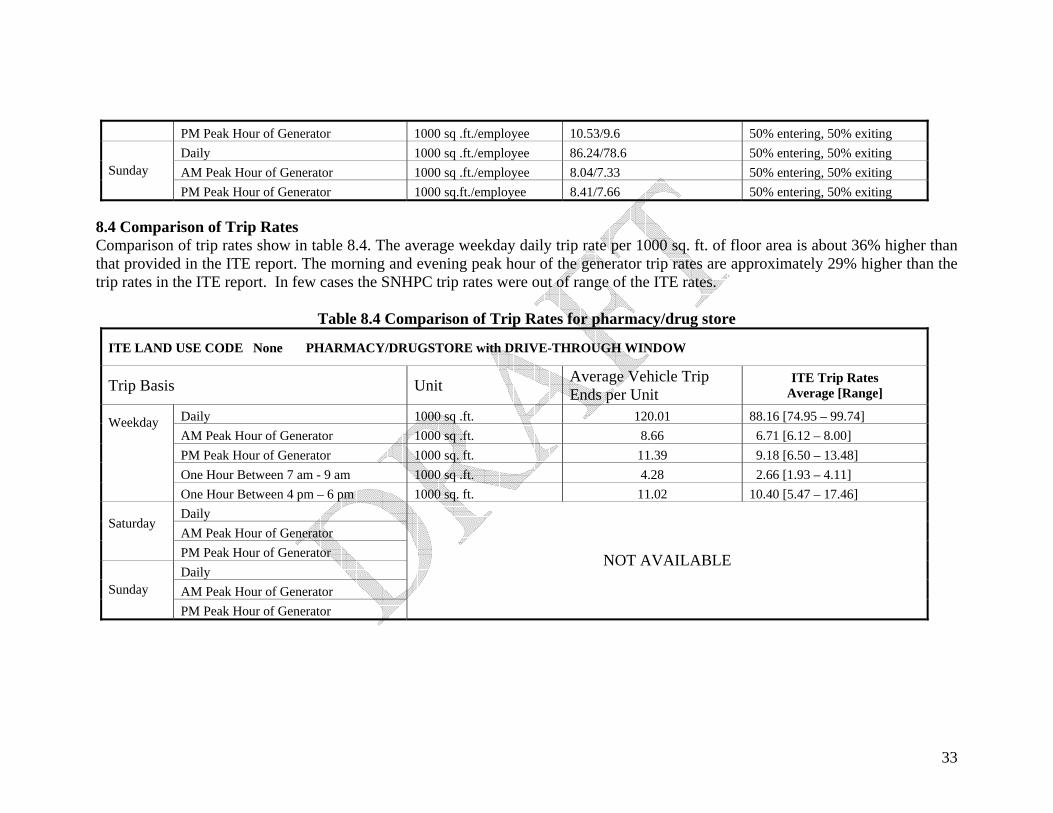
8.4 Comparison of Trip Rates Comparison of trip rates show in table 8.4. The average weekday daily trip rate per 1000 sq. ft. of floor area is about 36% higher than that provided in the ITE report. The morning and evening peak hour of the generator trip rates are approximately 29% higher than the trip rates in the ITE report. In few cases the SNHPC trip rates were out of range of the ITE rates.
Table 8.4 Comparison of Trip Rates for pharmacy/drug store
ITE LAND USE CODE None PHARMACY/DRUGSTORE with DRIVE-THROUGH WINDOW
Trip Basis Unit Average Vehicle Trip Ends per Unit
ITE Trip Rates Average [Range]
Daily 1000 sq .ft. 120.01 88.16 [74.95 – 99.74] AM Peak Hour of Generator 1000 sq .ft. 8.66 6.71 [6.12 – 8.00] PM Peak Hour of Generator 1000 sq. ft. 11.39 9.18 [6.50 – 13.48] One Hour Between 7 am - 9 am 1000 sq .ft. 4.28 2.66 [1.93 – 4.11]
Weekday
One Hour Between 4 pm – 6 pm 1000 sq. ft. 11.02 10.40 [5.47 – 17.46] Daily AM Peak Hour of Generator
Saturday
PM Peak Hour of Generator Daily AM Peak Hour of Generator Sunday PM Peak Hour of Generator
NOT AVAILABLE

34
CHAPTER 9 LARGE BOOK STORE
Large book stores are brick-and-mortar retail facilities that primarily sell books. Large sizes for the large bookstores exceed half a million titles. This land use isn’t included in the ITE Trip Generation Manual.
9.1 Data Collection Sites selected were shown in Table 9.1 and data were collected at the sites.
Table 9.1 Selected Survey Site Land Use Site Address Large Bookstore Barnes & Noble 1609 South Willow St, Manchester, NH 03103
9.2 Data Analysis Trip summary at the sites is shown in Table 9.2.
Table 9.2 Trip Summary at the Sites
Large Book Store Barnes & Noble 1609 South Willow St, Manchester, NH 03103
Daily Trip Ends (In + Out) 1805 AM Peak Trip Ends (In + Out) 134 at 11:00 AM PM Peak Trip Ends (In + Out) 176 at 7:00 PM 7-9 AM Peak Hour Trip Ends (In + Out) 16
Weekday
4-6 PM Peak Hour Trip Ends (In + Out) 162 Daily Trip Ends (In + Out) AM Peak Trip Ends (In + Out) Saturday
PM Peak Trip Ends (In + Out) NOT AVAILABLE
Daily Trip Ends (In + Out) AM Peak Trip Ends (In + Out) Sunday
PM Peak Trip Ends (In + Out) NOT AVAILABLE

35
9.3 Results Average vehicle trip ends per unit and directional distribution for each site are shown in Table 9.3.
Table 9.3 Trip Rates for Large Book Store Site: Barnes & Noble Building Area: 12,576 sq .ft
Trip Basis Unit Average Vehicle Trip Ends per Unit Directional Distribution
Daily 1000 sq. ft. 143.52 50% entering, 50% exiting AM Peak Hour of Generator 1000 sq .ft. 10.65 48% entering, 52% exiting PM Peak Hour of Generator 1000 sq. ft. 13.99 46% entering, 54% exiting One Hour Between 7 am - 9 am 1000 sq .ft. 1.27 69% entering, 31% exiting
Weekday
One Hour Between 4 pm – 6 pm 1000 sq .ft. 12.88 48% entering, 52% exiting Daily AM Peak Hour of Generator
Saturday
PM Peak Hour of Generator Daily AM Peak Hour of Generator Sunday
PM Peak Hour of Generator
NOT AVAILABLE
9.4 Comparison of Trip Rates This land use probably is relatively new and not yet represented in the ITE report, so no comparison could be made.

36
Table 9.4 Comparison of Trip Rates for Large Book Store
ITE LAND USE CODE None LARGE BOOK STORE
Trip Basis Unit Average Vehicle Trip Ends per Unit
ITE Trip Rates Average [Range]
Daily 1000 sq .ft. 143.52 AM Peak Hour of Generator 1000 sq .ft. 10.65 PM Peak Hour of Generator 1000 sq .ft. 13.99 One Hour Between 7 am - 9 am 1000 sq .ft. 1.27
Weekday
One Hour Between 4 pm – 6 pm 1000 sq. ft. 12.88
Not Covered in the
ITE Report
Daily AM Peak Hour of Generator Saturday
PM Peak Hour of Generator Daily AM Peak Hour of Generator Sunday PM Peak Hour of Generator
NOT AVAILABLE

37
CHAPTER 10 CLINIC (630)
A clinic is any facility that provides limited diagnostic and outpatient care but is unable to provide prolong in-house medical and surgical care. Clinics commonly have lab facilities, supporting pharmacies and a wide range of services 9compared to the medical office, which may only have specialized or individual physicians).
10.1 Data Collection Sites selected were shown in table 10.1 and data were collected at the sites.
Table 10.1 Selected Survey Site Land Use Site Address
Clinic Lahey Hitchcock Clinic 100 Hitchcock Way, Manchester, NH 03104
10.2 Data Analysis
Trip summary at the sites is shown in Table 10.2.
Table 10.2 Trip Summary at the Sites
Land Use: Clinic Site: Lahey Hitchcock Clinic Address: 100 Hitchcock Way, Manchester, NH
Daily Trip Ends (In + Out) 3846 AM Peak Trip Ends (In + Out) 362 at 8:00 AM PM Peak Trip Ends (In + Out) 353 at 3:00 PM 7-9 AM Peak Hour Trip Ends (In + Out) 362
Weekday
4-6 PM Peak Hour Trip Ends (In + Out) 341 Daily Trip Ends (In + Out) 599 AM Peak Trip Ends (In + Out) 69 at 9:00 AM Saturday
PM Peak Trip Ends (In + Out) 47 at 12:00 PM Daily Trip Ends (In + Out) 402 AM Peak Trip Ends (In + Out) 35 at 9:00 AM Sunday
PM Peak Trip Ends (In + Out) 37 at 2:00 PM

38
10.3 Results Average vehicle trip ends per unit and distribution for each site are shown in Table 10.3
Table 10.3 Trip Rates for Clinic Site: Lahey Hitchcock Clinic Number of Employees: 450
Trip Basis Unit Average Vehicle Trip Ends per Unit Directional Distribution
Daily Employee 8.54 50% in, 50% out AM Peak Hour of Generator Employee 0.80 65% in, 35% out PM Peak Hour of Generator Employee 0.78 45% in, 55% out One Hour Between 7 am - 9 am Employee 0.80 65% in, 35% out
Weekday
One Hour Between 4 pm – 6 pm Employee 0.76 27% in, 73% out Daily Employee 1.33 50% in, 50% out AM Peak Hour of Generator Employee 0.15 55% in, 45% out Saturday
PM Peak Hour of Generator Employee 0.10 38% in, 62% out Daily Employee 0.89 50% in, 50% out AM Peak Hour of Generator Employee 0.08 50% in, 50% out Sunday PM Peak Hour of Generator Employee 0.08 50% in, 50% out
10.4 Comparison Of Trip Rates The ITE report contains results from a very limited number of studies in this category. The weekday daily trip rates and AM peak trip rates per employee are comparable between the SNHPC and ITE reports. The PM peak trips are about 40% lower in the SNHPC studies.

39
Table 10.4 Comparison of Trip Rates for Clinic
ITE LAND USE CODE 630 CLINIC
Trip Basis Unit Average Vehicle Trip Ends per Unit
ITE Trip Rates Average [Range]Distribution
Daily Employee 8.54 7.75[5.89-12.33 AM Peak Hour of Generator Employee 0.80 0.90 PM Peak Hour of Generator Employee 0.78 1.31 [1.10-1.38] One Hour Between 7 am - 9 am Employee 0.80
Weekday
One Hour Between 4 pm – 6 pm Employee 0.76 1.23[1.10-1.26] Daily Employee 1.33 3.35 AM Peak Hour of Generator Employee 0.15
Saturday
PM Peak Hour of Generator Employee 0.10 Daily Employee 0.89 5.97 AM Peak Hour of Generator Employee 0.08 Sunday PM Peak Hour of Generator Employee 0.08

40
CHAPTER 11 NURSING HOME (620)
A nursing home is any facility whose primary function is to provide care for persons who are unable to care for themselves. Examples of such facilities include rest homes and chronic care and convalescent homes. Skilled nurse and nursing aides are present 24 hours a day at these sites. Nursing homes are occupied by residents who do little or no driving; traffic is primarily generated by employees, visitors and deliveries
11.1 Data Collection Sites selected were shown in Table 11.1 and data were collected at the sites.
Table 11.1 Selected Survey Site
Land Use Site Address
Nursing Home Hillsboro County Nursing Home 400 Mast Road Goffstown, NH 03045
11.2 Data Analysis Trip summary at the sites is shown in Table 11.2.
Table 11.2 Trip Summary at the Sites
Land Use: Nursing Home Site: Hillsboro County Nursing Home Address: 400 Mast Road Goffstown, NH 03045
Daily Trip Ends (In + Out) 974
AM Peak Trip Ends (In + Out) 91 at 7:00 AM Weekday
PM Peak Trip Ends (In + Out) 153 at 3:00 PM Daily Trip Ends (In + Out) 696 AM Peak Trip Ends (In + Out) 61 at 7:00 AM
Saturday
PM Peak Trip Ends (In + Out) 107 at 3:00 PM Daily Trip Ends (In + Out) 724 AM Peak Trip Ends (In + Out) 63 at 7:00 AM Sunday PM Peak Trip Ends (In + Out) 121 at 3:00 PM

41
11.3 Results Average vehicle trip ends per unit and directional distribution for each site are shown in Table 10.3.
Table 11.3 Trip rates for Nursing Home
11.4 Comparison of Trip Rates i. Trips based on beds
The daily and peak hour trip rates were generally higher than the ITE rates. An exception was the trip rate for the Saturday peak hour of the generator, which was slightly lower than the comparable ITE data.
ii. Trips based on employees
Land Use: Nursing Home Site: Hillsboro County Nursing Home No. of Beds: 300 No. of Employees: 375 Gross Floor Area: 128,000Sq. ft.
Trip Basis Unit
Average Vehicle Trip Ends per
Unit Directional Distribution Daily Beds/No. of Employees/ 1000Sq. ft. 3.25/4.45/7.61 46% in, 54% out
AM Peak Hour of Generator Beds/No. of Employees/ 1000Sq. ft. 0.30/0.42/0.71 63% in, 37% out PM Peak Hour of Generator Beds/No. of Employees/ 1000Sq. ft. 0.51/0.70/1.20 35 % in, 65% out One Hour Between 7 am - 9 am Beds/No. of Employees/ 1000Sq. ft. 0.30/0.42/0.71 63% in, 37% out
Weekday
One Hour Between 4 pm – 6 pm Beds/No. of Employees/ 1000Sq. ft. 0.24/0.33/0.56 30 % in, 70 % out Daily Beds/No. of Employees/ 1000Sq. ft. 2.32/3.18/5.44 49 % in, 51% out
AM Peak Hour of Generator Beds/No. of Employees/ 1000Sq. ft. 0.20/0.28/0.48 60% in, 40% out Saturday
PM Peak Hour of Generator Beds/No. of Employees/ 1000Sq. ft. 0.36/0.64/0.84 36 % in, 64% out Daily Beds/No. of Employees/ 1000Sq. ft. 2.41/4.36/5.66 46% in, 54% out AM Peak Hour of Generator Beds/No. of Employees/ 1000Sq. ft. 0.21/0.38/0.49 49% in, 51% out Sunday PM Peak Hour of Generator Beds/No. of Employees/ 1000Sq. ft. 0.40/0.73/0.95 38 % in, 62 % out

42
Based on this independent variable, the daily rates for the weekday, Saturday and Sunday periods were all significantly lower than the ITE data. The comparable peak hour trip rate data was also often significantly different that the ITE data.
iii Trips based on floor area
The daily and peak hour trips rates were consistently higher than the comparable ITE rates.
Table 11.4 Comparison of Trip Rates for Nursing
ITE LANDUSE CODE 620 NURSING HOME
Trip Basis Unit Average Vehicle Trip Ends per
Unit ITE Trip Rates
Average [Range] Daily Beds/No. of Employees/ 1000Sq. ft. 3.25/4.45/7.61 2.37/6.55/6.10 AM Peak Hour of Generator Beds/No. of Employees/ 1000Sq. ft. 0.30/0.42/0.71 0.12/-/0.42 PM Peak Hour of Generator Beds/No. of Employees/ 1000Sq. ft. 0.51/0.70/1.20 0.30/0.80/0.72 One Hour Between 7 am - 9 am Beds/No. of Employees/ 1000Sq. ft. 0.30/0.42/0.71 -
Weekday
One Hour Between 4 pm – 6 pm Beds/No. of Employees/ 1000Sq. ft. 0.24/0.33/0.56 - Daily Beds/No. of Employees/ 1000Sq. ft. 2.32/3.18/5.44 2.11/6.63/- AM Peak Hour of Generator Beds/No. of Employees/ 1000Sq. ft. 0.20/0.28/0.48 Saturday
PM Peak Hour of Generator Beds/No. of Employees/ 1000Sq. ft. 0.36/0.64/0.84 0.40/1.25/- Daily Beds/No. of Employees/ 1000Sq. ft. 2.41/4.36/5.66 2.10/6.57/- AM Peak Hour of Generator Beds/No. of Employees/ 1000Sq. ft. 0.21/0.38/0.49 Sunday PM Peak Hour of Generator Beds/No. of Employees/ 1000Sq. ft. 0.40/0.73/0.95 0.36/1.08/-

43
CHAPTER 12 GENERAL OFFICE BUILDING <50.000 SQ. FT (710)
12.1 Data Collection Sites selected were shown in Table 12.1 and data were collected at the sites.
Table 12.1 Selected Survey Sites Land Use Site Address
General Office Building<50,000 sq. ft. Verani Realty Auburn Road, Londonderry, NH
12.2 Data Analysis Trip summary at the sites is shown in Table 12.2.
Table 12.2 Trip Summary at the sites
Land Use: General Office Building <50,000 Site: Verani Realty (17550 Sq. ft.) Address: One Verani way, Londonderry, NH 03053
Daily Trip Ends (In + Out) 462 AM Peak Trip Ends (In + Out) 61 at 8:00 AM PM Peak Trip Ends (In + Out) 48 at 12:00 PM 7-9 AM Peak Hour Trip Ends (In + Out) 61
Weekday
4-6 PM Peak Hour Trip Ends (In + Out) 41 Daily Trip Ends (In + Out) 154 AM Peak Trip Ends (In + Out) 19 at 10:00 AM Saturday
PM Peak Trip Ends (In + Out) 31 at 12:00 PM Daily Trip Ends (In + Out) 107 AM Peak Trip Ends (In + Out) 24 at 10:00 AM Sunday
PM Peak Trip Ends (In + Out) 14 at 4:00 PM
44
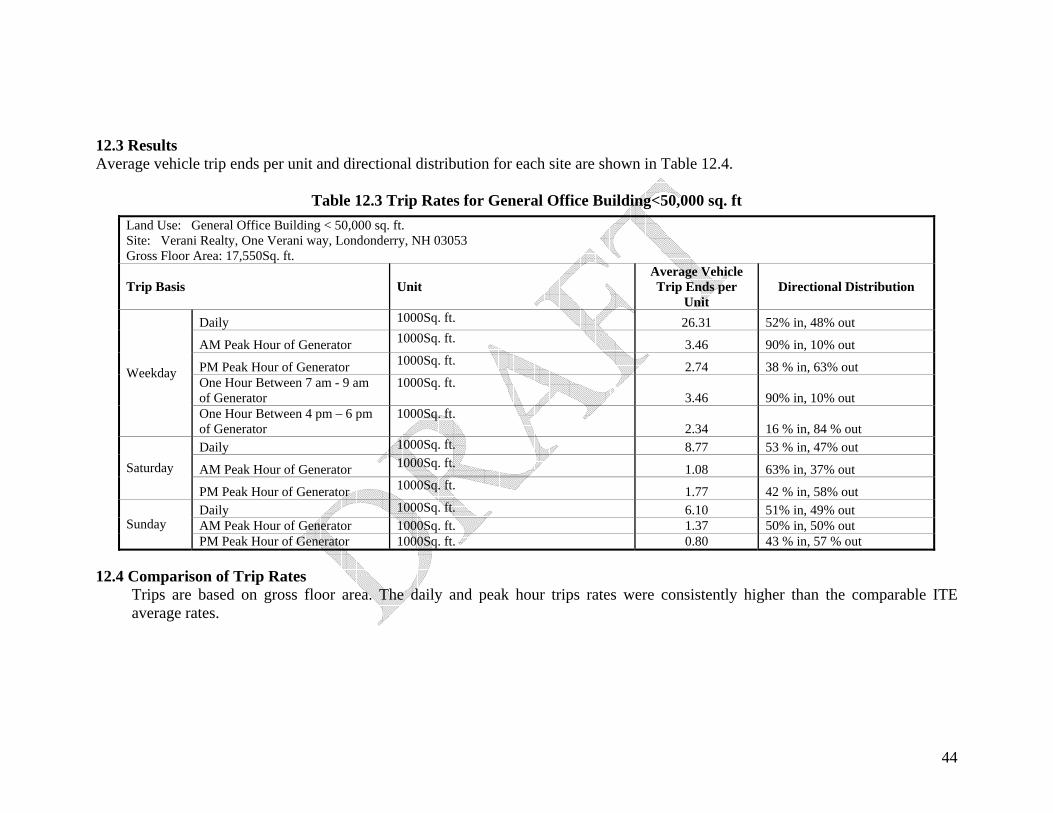
12.3 Results Average vehicle trip ends per unit and directional distribution for each site are shown in Table 12.4.
Table 12.3 Trip Rates for General Office Building<50,000 sq. ft
12.4 Comparison of Trip Rates Trips are based on gross floor area. The daily and peak hour trips rates were consistently higher than the comparable ITE average rates.
Land Use: General Office Building < 50,000 sq. ft. Site: Verani Realty, One Verani way, Londonderry, NH 03053 Gross Floor Area: 17,550Sq. ft.
Trip Basis Unit Average Vehicle Trip Ends per
Unit Directional Distribution
Daily 1000Sq. ft. 26.31 52% in, 48% out
AM Peak Hour of Generator 1000Sq. ft. 3.46 90% in, 10% out PM Peak Hour of Generator 1000Sq. ft. 2.74 38 % in, 63% out One Hour Between 7 am - 9 am of Generator
1000Sq. ft. 3.46 90% in, 10% out
Weekday
One Hour Between 4 pm – 6 pm of Generator
1000Sq. ft. 2.34 16 % in, 84 % out
Daily 1000Sq. ft. 8.77 53 % in, 47% out
AM Peak Hour of Generator 1000Sq. ft. 1.08 63% in, 37% out Saturday
PM Peak Hour of Generator 1000Sq. ft. 1.77 42 % in, 58% out Daily 1000Sq. ft. 6.10 51% in, 49% out AM Peak Hour of Generator 1000Sq. ft. 1.37 50% in, 50% out Sunday PM Peak Hour of Generator 1000Sq. ft. 0.80 43 % in, 57 % out

45
Table 12.4 Comparison of Trip Rates for General Office Building<50,000 sq.ft
ITE LANDUSE CODE 710 General Office Building
Trip Basis Unit Average Vehicle Trip Ends per
Unit ITE Trip Rates
Average [Range] Daily 1000Sq. ft. 26.31 11.01 [3.58 – 28.80]
AM Peak Hour of Generator 1000Sq. ft. 3.46 1.55 [0.60-5.98]
PM Peak Hour of Generator 1000Sq. ft. 2.74 1.49 [0.49-6.39] One Hour Between 7 am - 9 am 1000Sq. ft. 3.46 -
Weekday
One Hour Between 4 pm – 6 pm 1000Sq. ft. 2.32 - Daily 1000Sq. ft. 8.77 2.37 [0.59 – 14.67]
AM Peak Hour of Generator 1000Sq. ft. 1.08 Saturday
PM Peak Hour of Generator 1000Sq. ft. 1.77 0.41 [0.16 -1.57] Daily 1000Sq. ft. 6.10 0.98 [0.19 – 7.33] AM Peak Hour of Generator 1000Sq. ft. 1.37 Sunday PM Peak Hour of Generator 1000Sq. ft. 0.8 0.14 [0.06-0.37]
46
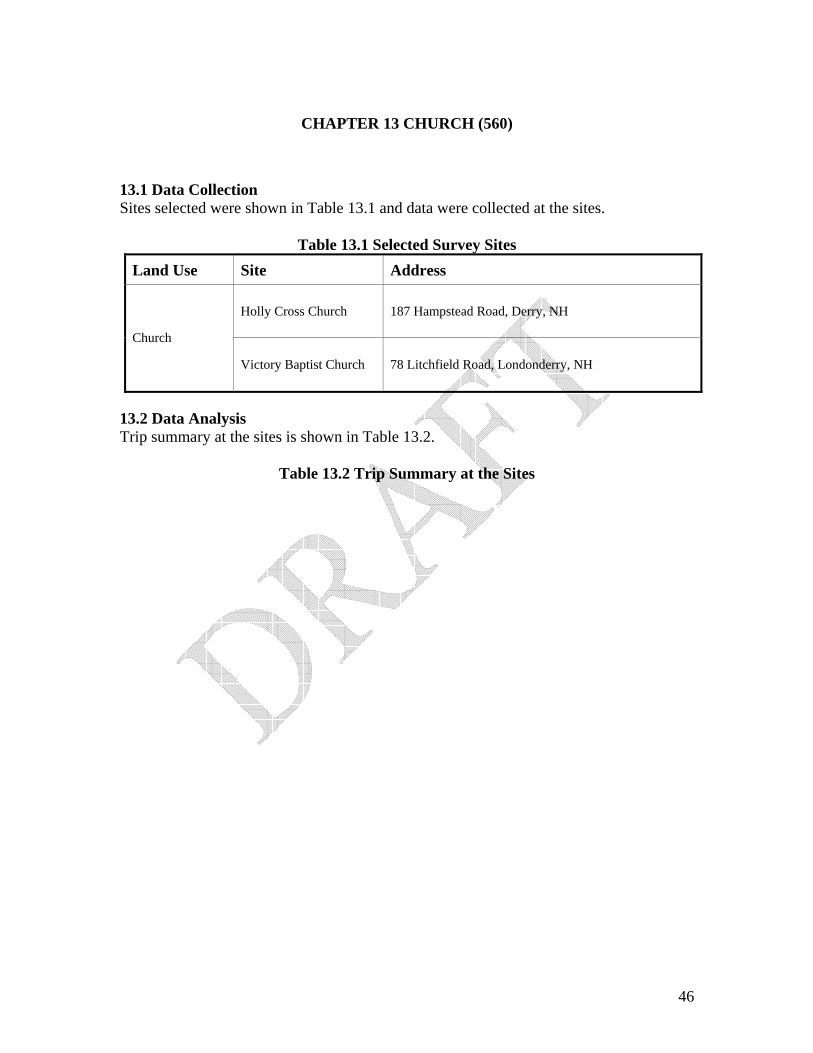
CHAPTER 13 CHURCH (560)
13.1 Data Collection Sites selected were shown in Table 13.1 and data were collected at the sites.
Table 13.1 Selected Survey Sites Land Use Site Address
Holly Cross Church 187 Hampstead Road, Derry, NH
Church
Victory Baptist Church 78 Litchfield Road, Londonderry, NH
13.2 Data Analysis Trip summary at the sites is shown in Table 13.2.
Table 13.2 Trip Summary at the Sites

47
Land Use: Church Site: Holly Cross Church (14268 Sq. ft.) Address: 187 Hampstead Road, Derry, NH 03038
Daily Trip Ends (In + Out) 43 AM Peak Trip Ends (In + Out) 10 at 7:00 AM PM Peak Trip Ends (In + Out) 4 at 7:00 PM 7-9 AM Peak Hour Trip Ends (In + Out) 10
Weekday
4-6 PM Peak Hour Trip Ends (In + Out) 2 Daily Trip Ends (In + Out) 162 AM Peak Trip Ends (In + Out) 3 at 10:00 AM Saturday
PM Peak Trip Ends (In + Out) 73 at 3:00 PM Daily Trip Ends (In + Out) 273 AM Peak Trip Ends (In + Out) 69 at 9:00 AM Sunday
PM Peak Trip Ends (In + Out) 5 at 7:00 PM Land Use: Church Site: Victory Baptist Church (18,063) Address: 78 Litchfield Road, Londonderry, NH
Daily Trip Ends (In + Out) 107 AM Peak Trip Ends (In + Out) 4 at 8 AM PM Peak Trip Ends (In + Out) 23 at 6PM 7-9 AM Peak Hour Trip Ends (In + Out) 4 at 8AM
Weekday
4-6 PM Peak Hour Trip Ends (In + Out) 12 at 5PM Daily Trip Ends (In + Out) 143 AM Peak Trip Ends (In + Out) 27 at 10AM
Saturday
PM Peak Trip Ends (In + Out) 15 at 12PM Daily Trip Ends (In + Out) 226 AM Peak Trip Ends (In + Out) 32 at 9AM Sunday
PM Peak Trip Ends (In + Out) 37 at 5PM

48
13.3 Results Average vehicle trip ends per unit and directional distribution for each site are shown in Table 13.3.
Table 13.3 Trip Rates per 1000 Sq. ft for Church

49
Land Use: Church Site: Holly Cross Church , 187 Hampstead Road, Derry, NH 03038 Gross Floor Area: 14,268Sq. ft.
Trip Basis Unit Average Vehicle Trip Ends per
Unit Directional Distribution
Daily 1000Sq. ft. 3.04 48% in, 52% out
AM Peak Hour of Generator 1000Sq. ft. 0.72 59% in, 41% out PM Peak Hour of Generator 1000Sq. ft. 0.28 68 % in, 32% out One Hour Between 7 am - 9 am of Generator
1000Sq. ft. 0.72 59 % in, 41% out
Weekday
One Hour Between 4 pm – 6 pm of Generator
1000Sq. ft. 0.16 55 % in, 45% out
Daily 1000Sq. ft. 11.35 60 % in, 40% out
AM Peak Hour of Generator 1000Sq. ft. 0.21 67% in, 33% out Saturday
PM Peak Hour of Generator 1000Sq. ft. 5.12 67 % in, 33% out Daily 1000Sq. ft. 19.13 56% in, 44% out AM Peak Hour of Generator 1000Sq. ft. 4.84 48% in, 52% out Sunday PM Peak Hour of Generator 1000Sq. ft. 0.35 40 % in, 60 % out
Land Use: Church Site: Victory Baptist Church, 78 Litchfield Road, Londonderry, NH Ross Flow Area: 18,063
Daily 1000Sq. ft. 5.91 51% in, 49% out AM Peak Hour of Generator 1000Sq. ft. 0.20 55% in, 45% out PM Peak Hour of Generator 1000Sq. ft. 1.25 88% in, 12% out One Hour Between 7 am - 9 am of Generator
1000Sq. ft. 0.2 55% in,45% out
Weekday
One Hour Between 4 pm – 6 pm of Generator
1000Sq. ft. 0.68 78% in, 22% out
Daily 1000Sq. ft. 7.92 45% in, 55% out AM Peak Hour of Generator 1000Sq. ft. 1.49 52% in, 48% out Saturday PM Peak Hour of Generator 1000Sq. ft. 0.83 19% in, 81% out Daily 1000Sq. ft. 12.51 49% in, 55% out AM Peak Hour of Generator 1000Sq. ft. 1.77 89% in, 11% out Sunday PM Peak Hour of Generator 1000Sq. ft. 2.05 51% in, 49% out

50
Table 13.4 Trip Rates per Seat for Church

51
Land Use: Church Site: Victory Baptist Church, 78 Litchfield Road, Londonderry, NH Ross Flow Area: 18,063.
Trip Basis Unit Average Vehicle Trip Ends per
Unit Directional Distribution
Daily Seat 0.09 48% in, 52% out
AM Peak Hour of Generator Seat 0.02 59% in, 41% out PM Peak Hour of Generator Seat 0.01 68 % in, 32% out One Hour Between 7 am - 9 am of Generator
Seat 0.02 59 % in, 41% out
Weekday
One Hour Between 4 pm – 6 pm of Generator
Seat 0.00 55 % in, 45% out
Daily Seat 0.32 60 % in, 40% out
AM Peak Hour of Generator Seat 0.01 67% in, 33% out Saturday
PM Peak Hour of Generator Seat 0.15 67 % in, 33% out Daily Seat 0.55 56% in, 44% out AM Peak Hour of Generator Seat 0.14 48% in, 52% out Sunday PM Peak Hour of Generator Seat 0.01 40 % in, 60 % out
Land Use: Church Site: Victory Baptist Church,
Daily Seat 0.14 51% in, 49% out AM Peak Hour of Generator Seat 0.00 55% in, 45% out PM Peak Hour of Generator Seat 0.03 88% in, 12% out One Hour Between 7 am - 9 am of Generator
Seat 0.00 55% in,45% out
Weekday
One Hour Between 4 pm – 6 pm of Generator
Seat 0.02 78% in, 22% out
Daily Seat 0.19 45% in, 55% out AM Peak Hour of Generator Seat 0.04 52% in, 48% out Saturday PM Peak Hour of Generator Seat 0.02 19% in, 81% out Daily Seat 0.30 49% in, 55% out AM Peak Hour of Generator Seat 0.04 89% in, 11% out Sunday PM Peak Hour of Generator Seat 0.05 51% in, 49% out

52
13.4 Comparison of Trip Rates Comparisons of trip rate are shown in the table 13.5 and 13.6. All trip rates were consistently lower than the comparable ITE average rates.
Table 13.5 Comparison of Trip Rates per 1000 sq. ft for Church
ITE LANDUSE CODE 560 Church
Trip Basis Unit Average Vehicle Trip Ends per
Unit ITE Trip Rates
Average [Range] Daily 1000Sq. ft. 4.63 9.11[4.35 – 30.20]
AM Peak Hour of Generator 1000Sq. ft. 0.43 0.87[0.30-6.61]
PM Peak Hour of Generator 1000Sq. ft. 0.82 0.94[0.38-4.04] One Hour Between 7 am - 9 am 1000Sq. ft. 0.43 0.56[0.08-6.61]
Weekday
One Hour Between 4 pm – 6 pm 1000Sq. ft. 0.45 0.55[0.21-2.10] Daily 1000Sq. ft. 9.43 10.37[2.35 – 56.83]
AM Peak Hour of Generator 1000Sq. ft. 0.93 Saturday
PM Peak Hour of Generator 1000Sq. ft. 2.72 3.54[0.40 -23.32] Daily 1000Sq. ft. 15.43 36.63[19.15 – 113.88] AM Peak Hour of Generator 1000Sq. ft. 3.12 Sunday PM Peak Hour of Generator 1000Sq. ft. 1.30 11.76[5.17-51.27]

53
Table 13.6 Comparison of Trip Rates per Seat for Church
ITE LANDUSE CODE 560 Church
Trip Basis Unit Average Vehicle Trip Ends per
Unit ITE Trip Rates
Average [Range] Daily Seat 0.12 0.61[0.21 – 0.84]
AM Peak Hour of Generator Seat 0.01 -
PM Peak Hour of Generator Seat 0.02 - One Hour Between 7 am - 9 am Seat 0.01 -
Weekday
One Hour Between 4 pm – 6 pm Seat 0.01 - Daily Seat 0.24 0.90[0.45 – 1.03]
AM Peak Hour of Generator Seat 0.02 Saturday
PM Peak Hour of Generator Seat 0.07 0.60[0.13 -0.72] Daily Seat 0.40 1.85[0.69 – 2.21] AM Peak Hour of Generator Seat 0.08 Sunday PM Peak Hour of Generator Seat 0.03 0.61[0.21-1.14]

54
CHAPTER 14 PARK-AND-RIDE LOT WITH BUS SERVICE (090)
14.1 Data Collection Sites selected were shown in Table 14.1 and data were collected at the sites.
Table 14.1 Selected Survey Sites Land Use Site Address
I-93 Exit 4 Park-and-Ride Lot Bus Service
I-93 Exit 5
14.2 Data Analysis Trip summary at the sites is shown in Table 13.2.
Table 14.2 Trip Summary at the Sites

55
Land Use: Park-and-Ride Lot with Bus Service Site: I-93 Exit 4 Address: I-93 Exit 4
Daily Trip Ends (In + Out) 775 AM Peak Trip Ends (In + Out) 146 at 6:00 AM PM Peak Trip Ends (In + Out) 104 at 6:00 PM 7-9 AM Peak Hour Trip Ends (In + Out) 65
Weekday
4-6 PM Peak Hour Trip Ends (In + Out) 86 Daily Trip Ends (In + Out) 100 AM Peak Trip Ends (In + Out) 8 at 8:00 AM Saturday
PM Peak Trip Ends (In + Out) 14 at 12:00 PM Daily Trip Ends (In + Out) 127 AM Peak Trip Ends (In + Out) 15 at 11:00 AM Sunday
PM Peak Trip Ends (In + Out) 17 at 2:00 PM Land Use: Park-and-Ride Lot with Bus Service Site: I-93 Exit 5 Address: I-93 Exit 5
Daily Trip Ends (In + Out) AM Peak Trip Ends (In + Out) at 8 AM PM Peak Trip Ends (In + Out) at 6PM 7-9 AM Peak Hour Trip Ends (In + Out) at 8AM
Weekday
4-6 PM Peak Hour Trip Ends (In + Out) at 5PM Daily Trip Ends (In + Out) AM Peak Trip Ends (In + Out) at 10AM
Saturday
PM Peak Trip Ends (In + Out) at 12PM Daily Trip Ends (In + Out) AM Peak Trip Ends (In + Out) at 9AM Sunday
PM Peak Trip Ends (In + Out) at 5PM

56
14.3 Results Average vehicle trip ends per unit and directional distribution for each site are shown in Table 14.3.
Table 14.3 Trip Rates per Parking Space in Lot

57
Land Use: Park-and-Ride Lot with Bus Service Site: I-93 Exit 4 Address: I-93 Exit 4
Trip Basis Unit Average Vehicle Trip Ends per
Unit Directional Distribution
Daily Spaces 1.65 50% in, 50% out
AM Peak Hour of Generator Spaces 0.31 86% in, 14% out PM Peak Hour of Generator Spaces 0.22 16 % in, 84% out One Hour Between 7 am - 9 am of Generator
Spaces 0.14 75 % in, 25% out
Weekday
One Hour Between 4 pm – 6 pm of Generator
Spaces 0.18 17 % in, 83% out
Daily Spaces 0.21 49 % in, 51% out
AM Peak Hour of Generator Spaces 0.02 50% in, 50% out Saturday
PM Peak Hour of Generator Spaces 0.03 47 % in, 53% out Daily Spaces 0.27 50% in, 50% out AM Peak Hour of Generator Spaces 0.03 60% in, 40% out Sunday PM Peak Hour of Generator Spaces 0.04 53 % in, 47 % out
Land Use: Park-and-Ride Lot with Bus Service Site: I-93 Exit 5 Address: I-93 Exit 5
Daily Spaces % in, % out AM Peak Hour of Generator Spaces % in, % out PM Peak Hour of Generator Spaces % in, % out One Hour Between 7 am - 9 am of Generator
Spaces % in,% out
Weekday
One Hour Between 4 pm – 6 pm of Generator
Spaces % in, % out
Daily Spaces % in, % out AM Peak Hour of Generator Spaces % in, % out Saturday PM Peak Hour of Generator Spaces % in, % out Daily Spaces % in, % out AM Peak Hour of Generator Spaces % in, % out Sunday PM Peak Hour of Generator Spaces % in, % out

58
14.4 Comparison of Trip Rates Comparisons of trip rate are shown in the table 14.5. All trip rates were consistently lower than the comparable ITE average rates by a whole order of magnitude.
Table 14.5 Comparison of Trip Rates per Parking Space in Lot
ITE LANDUSE CODE 090 Park-and-Ride With Bus Service
Trip Basis Unit Average Vehicle Trip Ends per Unit
ITE Trip Rates Average [Range]
Daily Spaces 4.50[03.90 – 7.06]
AM Peak Hour of Generator Spaces -
PM Peak Hour of Generator Spaces - One Hour Between 7 am - 9 am Spaces 0.72[0.29 – 0.87]
Weekday
One Hour Between 4 pm – 6 pm Spaces 0.62[0.23 – 0.93] Daily Spaces -
AM Peak Hour of Generator Spaces Saturday
PM Peak Hour of Generator Spaces - Daily Spaces - AM Peak Hour of Generator Spaces Sunday PM Peak Hour of Generator Spaces -

59
APPENDIX I ITE TRIP REPORT LAND USE Code Land Use
Port and Terminal 010 Winterport/Marine Terminal 021 Commercial Airport 022 General Aviation Airport 030 Truck Terminal 090 Park-and-Ride Lot w/ Bus Service 093 Light Rail Transit Station with Parking
Industrial/Agricultural 110 General Light Industrial 120 General Heavy Industrial 130 Industrial Park 140 Manufacturing 150 Warehousing 151 Mini-Warehouse 152 High-Cube Warehouse 170 Utilities
Residential 210 Single-Family Detached Housing 220 Apartment 221 Low-Rise Apartment 222 High-Rise Apartment 223 Midrise Apartments 224 Rental Townhouse 230 Residential Condominium/Townhouse 231 Low-Rise Residential Condominium Townhouse 232 High-Rise Residential Condominium Townhouse 233 Luxury Condominium/Townhouses 240 Mobile Home Park 251 Senior Adult Housing Detached 252 Senior Adult Housing Attached 253 Congregate Care Facility 254 Assisted Living 255 Continuing Care Retirement Community 260 Recreational Homes 265 Timeshare 270 Residential Planned Unit Development
Lodging 310 Hotel 311 All Suites Hotel 312 Business Hotel 320 Motel 330 Resort Hotel
Recreational 411 City Park 412 County Park 413 State Park

60
Code Land Use 414 Water Slide Park 415 Beach Park 416 Campground/Recreational Vehicle Park 417 Regional Park 418 National Monument 420 Marina 430 Golf Course 431 Miniature Golf Course 432 Golf Driving Range 433 Batting Cages 435 Multipurpose Recreational Facility 437 Bowling Alley 440 Adult Cabaret 441 Live Theater 443 Movie Theater without Matinee 444 Movie Theater with Matinee 445 Multiplex Movie Theater 452 Horse Racetrack 453 Automobile Racetrack 454 Dog Racetrack 460 Arena 465 Ice Skating Rink 473 Casino/Video Lottery Establishment 480 Amusement Park 481 Zoo 488 Soccer Complex 490 Tennis Court 491 Racquet Club 492 Health Club/Fitness Club 493 Athletic Club 495 Recreational Community Center
Institutional 501 Military Base 520 Elementary School 522 Middle School/Junior High School 530 High School 534 Private School (K-8) 536 Private School (K-12) 540 Junior /Community College 550 University/College 560 Church 561 Synagogue 565 Day Care Center 566 Cemetery 571 Prison 590 Library 591 Lodge/Fraternal Organization
Medical

61
Code Land Use 610 Hospital 620 Nursing Home 630 Clinic 640 Animal Hospital/Veterinary Clinic
Office 710 General Office Building 714 Corporate Headquarters Building 715 Single Tenant Office Building 720 Medical Dental Office Building 730 Government Office Building 731 State Motor Vehicles Department 732 United States Post Office 733 Government Office Complex 750 Office Park 760 Research and Development Center 770 Business Park
Retail 812 Building Materials and Lumber Store 813 Free-Standing Discount Superstore 814 Specialty Retail Center 815 Free-Standing Discount Store 816 Hardware/Paint Store 817 Nursery (Garden Center) 818 Nursery (Wholesale) 820 Shopping Center 823 Factory Outlet Center 841 New Car Sales 843 Automobile Parts Sales 848 Tire Store 849 Tire Superstore 850 Supermarket 851 Convenience Market (Open 24 Hours) 852 Convenience Market (Open 15-16 Hours) 853 Convenience Market with Gasoline Pumps 854 Discount Supermarket 857 Discount Club 860 Wholesale Market 861 Sporting Goods Superstore 862 Home Improvement Superstore 863 Electronics Superstore 864 Toy/Children Superstore 865 Baby Superstore 866 Pet Supply Superstore 867 Office Supply Superstore 868 Book Superstore 869 Discount Home Furnishing Superstore 872 Bed and Linen Superstore 875 Department Superstore

62
Code Land Use 876 Apparel Store 879 Arts and Crafts Store 880 Pharmacy/Drugstore w/o Drive-Through Window 881 Pharmacy/Drugstore with Drive-Through Window 890 Furniture Store 896 Video Rental Store
Services 911 Walk-in Bank 912 Drive-in Bank 918 Hair Salon 920 Copy, Print and Express Ship Store 925 Drinking Place 931 Quality Restaurant 932 High-Turnover (Sit-Down) Restaurant 933 Fast-Food Restaurant w/o Drive-Through 934 Fast-Food Restaurant with Drive-Through 935 Fast-Food w/ Drive- Through and no Indoor Seating 936 Coffee/Donut Shop w/o Drive Through Window 937 Coffee/Donut Shop w/ Drive Through Window 938 Coffee/Donut w/ Drive Through and no Indoor Seating 939 Bread/Donut/Bagel w/o Drive-Through Window 940 Bread/Donut/Bagel w/ Drive-Through Window 941 Quick Lubrication Vehicle Shop 942 Automobile Care Center 943 Automobile Parts and Service Center 944 Gasoline/Service Station 945 Gasoline/Service Station w/ Convenience Market 946 Gasoline/Service Station w/ Convenience Market and Car Wash 947 Self-Service Car Wash 948 Automated Car Wash

63
APPENDIX II SAMPLE COUNT REPORT

64
APPENDIX III HOURLY VARIATION OF TRAFFIC

65
ELDERLY HOUSING - EDWARD J ROY APARTMENTSHourly Variation in Average Weekday Site Traffic
0
5
10
15
20
25
12:0
0 A
M
2:00
AM
4:00
AM
6:00
AM
8:00
AM
10:0
0 A
M
1:00
PM
3:00
PM
5:00
PM
7:00
PM
9:00
PM
11:0
0 P
M
TIME
TOTA
L SI
TE T
RAFF
IC
ELDERLY HOUSING - EDWARD J ROY APARTMENTSHourly Variation in Average Saturday Site Traffic
0
5
10
15
20
25
12:0
0 A
M
2:00
AM
4:00
AM
6:00
AM
8:00
AM
10:0
0 A
M
1:00
PM
3:00
PM
5:00
PM
7:00
PM
9:00
PM
11:0
0 P
M
TIME
TOTA
L SI
TE T
RAF
FIC
ELDERLY HOUSING - EDWARD J ROY APARTMENTSHourly Variation in Average Sunday Site Traffic
0
5
10
15
20
25
12:0
0 A
M
2:00
AM
4:00
AM
6:00
AM
8:00
AM
10:0
0 A
M
1:00
PM
3:00
PM
5:00
PM
7:00
PM
9:00
PM
11:0
0 P
M
TIME
TOTA
L SI
TE T
RAFF
IC

66
ELDERLY HOUSING - CARLTON CROSSINGHourly Variation in Average Weekday Site Traffic
02468
101214161820
12:0
0 A
M
2:00
AM
4:00
AM
6:00
AM
8:00
AM
10:0
0 A
M
1:00
PM
3:00
PM
5:00
PM
7:00
PM
9:00
PM
11:0
0 P
M
TIME
TOTA
L SI
TE T
RAFF
IC
ELDERLY HOUSING - CARLTON CROSSINGHourly Variation in Average Saturday Site Traffic
02468
101214161820
12:0
0 A
M
2:00
AM
4:00
AM
6:00
AM
8:00
AM
10:0
0 A
M
1:00
PM
3:00
PM
5:00
PM
7:00
PM
9:00
PM
11:0
0 P
M
TIME
TOTA
L SI
TE T
RAF
FIC
ELDERLY HOUSING - CARLTON CROSSINGHourly Variation in Average Sunday Site Traffic
02468
101214161820
12:0
0 A
M
2:00
AM
4:00
AM
6:00
AM
8:00
AM
10:0
0 A
M
1:00
PM
3:00
PM
5:00
PM
7:00
PM
9:00
PM
11:0
0 P
M
TIME
TOTA
L SI
TE T
RAFF
IC

67
ELDERLY HOUSING - HOLLYBERRY HILLHourly Variation in Average Weekday Site Traffic
0
2
4
6
8
10
12
14
12:0
0 A
M
2:00
AM
4:00
AM
6:00
AM
8:00
AM
10:0
0 A
M
1:00
PM
3:00
PM
5:00
PM
7:00
PM
9:00
PM
11:0
0 P
M
TIME
TOTA
L SI
TE T
RAFF
IC
ELDERLY HOUSING - HOLLYBERRY HILLHourly Variation in Average Saturday Site Traffic
0
2
4
6
8
10
12
14
12:0
0 A
M
2:00
AM
4:00
AM
6:00
AM
8:00
AM
10:0
0 A
M
1:00
PM
3:00
PM
5:00
PM
7:00
PM
9:00
PM
11:0
0 P
M
TIME
TOTA
L SI
TE T
RAF
FIC
ELDERLY HOUSING - HOLLYBERRY HILLHourly Variation in Average Sunday Site Traffic
0
2
4
6
8
10
12
14
12:0
0 A
M
2:00
AM
4:00
AM
6:00
AM
8:00
AM
10:0
0 A
M
1:00
PM
3:00
PM
5:00
PM
7:00
PM
9:00
PM
11:0
0 P
M
TIME
TOTA
L SI
TE T
RAFF
IC

68
ELDERLY HOUSING - WEST VIEW TERRACEHourly Variation in Average Weekday Site Traffic
0
2
4
6
8
10
12
12:0
0 A
M
2:00
AM
4:00
AM
6:00
AM
8:00
AM
10:0
0 A
M
1:00
PM
3:00
PM
5:00
PM
7:00
PM
9:00
PM
11:0
0 P
M
TIME
TOTA
L SI
TE T
RAFF
IC
ELDERLY HOUSING - WEST VIEW TERRACEHourly Variation in Average Saturday Site Traffic
0
2
4
6
8
10
12
14
12:0
0 AM
2:00
AM
4:00
AM
6:00
AM
8:00
AM
10:0
0 AM
1:00
PM
3:00
PM
5:00
PM
7:00
PM
9:00
PM
11:0
0 PM
TIME
TOTA
L SI
TE T
RA
FFI
ELDERLY HOUSING - WEST VIEW TERRACEHourly Variation in Average Sunday Site Traffic
0
2
4
6
8
10
12
14
12:0
0 A
M
2:00
AM
4:00
AM
6:00
AM
8:00
AM
10:0
0 A
M
1:00
PM
3:00
PM
5:00
PM
7:00
PM
9:00
PM
11:0
0 P
M
TIME
TOTA
L SI
TE T
RAFF
IC

69
US POST OFFICE - DERRY POST OFFICEHourly Variation in Average Weekday Site Traffic
050
100150200250300350400450
12:0
0 AM
1:00
AM
2:00
AM
3:00
AM
4:00
AM
5:00
AM
6:00
AM
7:00
AM
8:00
AM
9:00
AM
10:0
0 AM
11:0
0 AM
12:0
0 PM
1:00
PM
2:00
PM
3:00
PM
4:00
PM
5:00
PM
6:00
PM
7:00
PM
8:00
PM
9:00
PM
10:0
0 PM
11:0
0 PM
TIME
TOTA
L SI
TE T
RA
FFI
US POST OFFICE - DERRY POST OFFICEHourly Variation in Average Saturday Site Traffic
050
100150200250300350400450
12:0
0 A
M
1:00
AM
2:00
AM
3:00
AM
4:00
AM
5:00
AM
6:00
AM
7:00
AM
8:00
AM
9:00
AM
10:0
0 A
M
11:0
0 A
M
12:0
0 P
M
1:00
PM
2:00
PM
3:00
PM
4:00
PM
5:00
PM
6:00
PM
7:00
PM
8:00
PM
9:00
PM
10:0
0 P
M
11:0
0 P
M
TIME
TOTA
L SI
TE T
RAFF
IC
US POST OFFICE - DERRY POST OFFICEHourly Variation in Average Sunday Site Traffic
050
100150200250300350400450
12:0
0 A
M
1:00
AM
2:00
AM
3:00
AM
4:00
AM
5:00
AM
6:00
AM
7:00
AM
8:00
AM
9:00
AM
10:0
0 A
M
11:0
0 A
M
12:0
0 P
M
1:00
PM
2:00
PM
3:00
PM
4:00
PM
5:00
PM
6:00
PM
7:00
PM
8:00
PM
9:00
PM
10:0
0 P
M
11:0
0 P
M
TIME
TOTA
L S
ITE
TRAF
FIC

70
DRIVE-THROUGH ONLY COFFEE RESTAURANT - QUIKAVA
Hourly Variation in Average Weekday Site Traffic
020406080
100120140160180
12:0
0 A
M
1:00
AM
2:00
AM
3:00
AM
4:00
AM
5:00
AM
6:00
AM
7:00
AM
8:00
AM
9:00
AM
10:0
0 A
M
11:0
0 A
M
12:0
0 P
M
1:00
PM
2:00
PM
3:00
PM
4:00
PM
5:00
PM
6:00
PM
7:00
PM
8:00
PM
9:00
PM
10:0
0 P
M
11:0
0 P
M
TIME
TOTA
L SI
TE T
RAF
FIC
DRIVE-THROUGH ONLY COFFEE RESTAURANT - QUIKAVA
Hourly Variation in Average Saturday Site Traffic
020406080
100120140160180
12:0
0 A
M
1:00
AM
2:00
AM
3:00
AM
4:00
AM
5:00
AM
6:00
AM
7:00
AM
8:00
AM
9:00
AM
10:0
0 A
M
11:0
0 A
M
12:0
0 P
M
1:00
PM
2:00
PM
3:00
PM
4:00
PM
5:00
PM
6:00
PM
7:00
PM
8:00
PM
9:00
PM
10:0
0 P
M
11:0
0 P
M
TIME
TOTA
L SI
TE T
RAFF
IC
DRIVE-THROUGH ONLY COFFEE RESTAURANT - QUIKAVA
Hourly Variation in Average Sunday Site Traffic
020406080
100120140160180
12:0
0 A
M
1:00
AM
2:00
AM
3:00
AM
4:00
AM
5:00
AM
6:00
AM
7:00
AM
8:00
AM
9:00
AM
10:0
0 A
M
11:0
0 A
M
12:0
0 P
M
1:00
PM
2:00
PM
3:00
PM
4:00
PM
5:00
PM
6:00
PM
7:00
PM
8:00
PM
9:00
PM
10:0
0 P
M
11:0
0 P
M
TIME
TOTA
L SI
TE T
RAFF
IC

71
PHARMACY/DRUGSTORE w/DRIVE THROUGH WINDOW - WALGREENS
Hourly Variation in Average Weekday Site Traffic
020406080
100120140160180200
12:0
0 A
M
1:00
AM
2:00
AM
3:00
AM
4:00
AM
5:00
AM
6:00
AM
7:00
AM
8:00
AM
9:00
AM
10:0
0 A
M
11:0
0 A
M
12:0
0 P
M
1:00
PM
2:00
PM
3:00
PM
4:00
PM
5:00
PM
6:00
PM
7:00
PM
8:00
PM
9:00
PM
10:0
0 P
M
11:0
0 P
M
TIME
TOTA
L SI
TE T
RAFF
IC

72
PHARMACY/DRUGSTORE w/DRIVE THROUGH WINDOW - OSCO DRUG
Hourly Variation in Average Weekday Site Traffic
020406080
100120140160
12:0
0 AM
1:00
AM
2:00
AM
3:00
AM
4:00
AM
5:00
AM
6:00
AM
7:00
AM
8:00
AM
9:00
AM
10:0
0 AM
11:0
0 AM
12:0
0 PM
1:00
PM
2:00
PM
3:00
PM
4:00
PM
5:00
PM
6:00
PM
7:00
PM
8:00
PM
9:00
PM
10:0
0 PM
11:0
0 PM
TIME
TOTA
L SI
TE T
RA
FFIC
PHARMACY/DRUGSTORE w/DRIVE THROUGH WINDOW - OSCO DRUG
Hourly Variation in Average Saturday Site Traffic
020406080
100120140160
12:0
0 A
M
1:00
AM
2:00
AM
3:00
AM
4:00
AM
5:00
AM
6:00
AM
7:00
AM
8:00
AM
9:00
AM
10:0
0 A
M
11:0
0 A
M
12:0
0 P
M
1:00
PM
2:00
PM
3:00
PM
4:00
PM
5:00
PM
6:00
PM
7:00
PM
8:00
PM
9:00
PM
10:0
0 P
M
11:0
0 P
M
TIME
TOTA
L SI
TE T
RAFF
IC
PHARMACY/DRUGSTORE w/DRIVE THROUGH WINDOW - OSCO DRUG
Hourly Variation in Average Sunday Site Traffic
0
20
40
60
80
100
120
140
12:0
0 A
M
1:00
AM
2:00
AM
3:00
AM
4:00
AM
5:00
AM
6:00
AM
7:00
AM
8:00
AM
9:00
AM
10:0
0 A
M
11:0
0 A
M
12:0
0 P
M
1:00
PM
2:00
PM
3:00
PM
4:00
PM
5:00
PM
6:00
PM
7:00
PM
8:00
PM
9:00
PM
10:0
0 P
M
11:0
0 P
M
TIME
TOTA
L SI
TE T
RAFF
IC

73
LARGE BOOK STORE - BARNES & NOBLE
Hourly Variation in Average Weekday Site Traffic
020406080
100120140160180200
12:0
0 A
M
2:00
AM
4:00
AM
6:00
AM
8:00
AM
10:0
0 A
M
1:00
PM
3:00
PM
5:00
PM
7:00
PM
9:00
PM
11:0
0 P
M
TIME
TOTA
L SI
TE T
RAFF
IC

74
DAY CARE CENTER - VNA CHILD CARE CENTERHourly Variation in Average Weekday Site Traffic
0
20
40
60
80
100
120
140
12:0
0 A
M
1:00
AM
2:00
AM
3:00
AM
4:00
AM
5:00
AM
6:00
AM
7:00
AM
8:00
AM
9:00
AM
10:0
0 A
M
11:0
0 A
M
12:0
0 P
M
1:00
PM
2:00
PM
3:00
PM
4:00
PM
5:00
PM
6:00
PM
7:00
PM
8:00
PM
9:00
PM
10:0
0 P
M
11:0
0 P
M
TIME
TOTA
L S
ITE
TRA
FFIC

75
DAY CARE CENTER - DERRY DAY CARE AND LEARNING CENTER
Hourly Variation in Average Weekday Site Traffic
0
5
10
15
20
25
30
35
40
12:0
0 A
M
1:00
AM
2:00
AM
3:00
AM
4:00
AM
5:00
AM
6:00
AM
7:00
AM
8:00
AM
9:00
AM
10:0
0 A
M
11:0
0 A
M
12:0
0 P
M
1:00
PM
2:00
PM
3:00
PM
4:00
PM
5:00
PM
6:00
PM
7:00
PM
8:00
PM
9:00
PM
10:0
0 P
M
11:0
0 P
M
TIME
TOTA
L S
ITE
TRA
FFIC

76
CLINIC - HITCHCOCK CLINICHourly Variation in Average Weekday Site Traffic
0
50100
150200
250
300350
400
12:0
0 A
M
2:00
AM
4:00
AM
6:00
AM
8:00
AM
10:0
0 A
M
1:00
PM
3:00
PM
5:00
PM
7:00
PM
9:00
PM
11:0
0 P
M
TIME
TOTA
L S
ITE
TRA
FFIC
CLINIC - HITCHCOCK CLINICHourly Variation in Average Saturday Site Traffic
0
50100
150
200
250300
350
400
12:0
0 A
M
2:00
AM
4:00
AM
6:00
AM
8:00
AM
10:0
0 A
M
1:00
PM
3:00
PM
5:00
PM
7:00
PM
9:00
PM
11:0
0 P
MTIME
TOTA
L S
ITE
TR
AFFI
C
CLINIC - HITCHCOCK CLINICHourly Variation in Average Sunday Site Traffic
0
50
100
150200
250
300
350
400
12:0
0 A
M
2:00
AM
4:00
AM
6:00
AM
8:00
AM
10:0
0 A
M
1:00
PM
3:00
PM
5:00
PM
7:00
PM
9:00
PM
11:0
0 P
M
TIME
TOTA
L S
ITE
TRA
FFIC

77
HILLCREST TERRACE ADULT HOUSINGHourly Variation in Average Weekday Site Traffic
0
10
20
30
40
50
60
70
80
12:0
0 PM
2:00
AM
4:00
AM
6:00
AM
8:00
AM
10:0
0 AM
12:0
0 PM
2:00
PM
4:00
PM
6:00
PM
8:00
PM
10:0
0 PM
TIME
TOTA
L SI
TE T
RAFF
IC
HILLCREST TERRACE ADULT HOUSINGHourly Variation in Average Saturday Site Traffic
01020304050607080
12:0
0 PM
2:00
AM
4:00
AM
6:00
AM
8:00
AM
10:0
0 AM
12:0
0 PM
2:00
PM
4:00
PM
6:00
PM
8:00
PM
10:0
0 PM
TIME
TOTA
L SI
TE T
RA
FFIC
HILLCREST TERRACE ADULT HOUSINGHourly Variation in Average Sunday Site Traffic
01020304050607080
12:0
0 PM
2:00
AM
4:00
AM
6:00
AM
8:00
AM
10:0
0 AM
12:0
0 PM
2:00
PM
4:00
PM
6:00
PM
8:00
PM
10:0
0 PM
TIME
TOTA
L SI
TE T
RA
FFIC

78
HILLSBORO COUNTY NURSING HOMEHourly Variation in Average Weekday Site Traffic
020406080
100120140160
12:0
0 PM
2:00
AM
4:00
AM
6:00
AM
8:00
AM
10:0
0 AM
12:0
0 PM
2:00
PM
4:00
PM
6:00
PM
8:00
PM
10:0
0 PM
TIME
TOTA
L SI
TE T
RA
FFIC
HILLSBORO COUNTY NURSING HOMEHourly Variation in Average Saturday Site Traffic
020406080
100120140160
12:0
0 PM
2:00
AM
4:00
AM
6:00
AM
8:00
AM
10:0
0 AM
12:0
0 PM
2:00
PM
4:00
PM
6:00
PM
8:00
PM
10:0
0 PM
TIME
TOTA
L SI
TE T
RA
FFIC
HILLSBORO COUNTY NURSING HOMEHourly Variation in Average Sunday Site Traffic
020406080
100120140160
12:0
0 PM
2:00
AM
4:00
AM
6:00
AM
8:00
AM
10:0
0 AM
12:0
0 PM
2:00
PM
4:00
PM
6:00
PM
8:00
PM
10:0
0 PM
TIME
TOTA
L SI
TE T
RA
FFI

79
Verani RealtyHourly Variation in Average Weekday Site Traffic
0
10
20
30
40
50
60
70
80
12:00 PM
2:00
AM
4:00
AM
6:00
AM
8:00
AM
10:0
0 AM
12:00 PM
2:00
PM
4:00
PM
6:00
PM
8:00
PM
10:00 PM
TIME
TOTA
L SI
TE T
RAFF
I
Verani Realty
Hourly Variation in Average Saturday Site Traffic
01020304050607080
12:0
0 PM
2:00
AM
4:00
AM
6:00
AM
8:00
AM
10:0
0 AM
12:0
0 PM
2:00
PM
4:00
PM
6:00
PM
8:00
PM
10:0
0 PM
TIME
TOTA
L SI
TE T
RA
FFI
Verani RealtyHourly Variation in Average Sunday Site Traffic
01020304050607080
12:0
0 PM
2:00
AM
4:00
AM
6:00
AM
8:00
AM
10:0
0 AM
12:0
0 PM
2:00
PM
4:00
PM
6:00
PM
8:00
PM
10:0
0 PM
TIME
TOTA
L SI
TE T
RA
FFI

80
Holly Cross ChurchHourly Variation in Average Weekday Site Traffic
0
10
20
30
40
50
60
70
80
12:00 PM
2:00
AM
4:00
AM
6:00
AM
8:00
AM
10:00 AM
12:00 PM
2:00
PM
4:00
PM
6:00
PM
8:00
PM
10:00 PM
TIME
TOTA
L SITE
TRAFF
IC
Holly Cross ChurchHourly Variation in Average Saturday Site Traffic
01020304050607080
12:0
0 PM
2:00
AM
4:00
AM
6:00
AM
8:00
AM
10:0
0 AM
12:0
0 PM
2:00
PM
4:00
PM
6:00
PM
8:00
PM
10:0
0 PM
TIME
TOTA
L SI
TE T
RA
FFIC
Holly Cross ChurchHourly Variation in Average Sunday Site Traffic
01020304050607080
12:0
0 PM
2:00
AM
4:00
AM
6:00
AM
8:00
AM
10:0
0 AM
12:0
0 PM
2:00
PM
4:00
PM
6:00
PM
8:00
PM
10:0
0 PM
TIME
TOTA
L SI
TE T
RA
FFIC

81
Park-and-Ride Lot with Bus ServiceHourly Variation in Average Weekday Site Traffic
0
10
20
30
40
50
60
70
80
12:00 PM
2:00
AM
4:00
AM
6:00
AM
8:00
AM
10:00 AM
12:00 PM
2:00
PM
4:00
PM
6:00
PM
8:00
PM
10:00 PM
TIME
TOTA
L SI
TE T
RAFF
IC
Park-and-Ride Lot with Bus ServiceHourly Variation in Average Saturday Site Traffic
01020304050607080
12:0
0 PM
2:00
AM
4:00
AM
6:00
AM
8:00
AM
10:0
0 AM
12:0
0 PM
2:00
PM
4:00
PM
6:00
PM
8:00
PM
10:0
0 PM
TIME
TOTA
L SI
TE T
RA
FFIC
Park-and-Ride Lot with Bus ServiceHourly Variation in Average Sunday Site Traffic
01020304050607080
12:0
0 PM
2:00
AM
4:00
AM
6:00
AM
8:00
AM
10:0
0 AM
12:0
0 PM
2:00
PM
4:00
PM
6:00
PM
8:00
PM
10:0
0 PM
TIME
TOTA
L SI
TE T
RA
FFIC


