
CHAPTER IV
TRENDS IN EDUCATIONAL FINANCES IN KERALA
The preceding chapter presented an analysis of the trends in
the pattern of funding higher education in both global and Indian
contexts In this chapter, we propose to trace the changes in
funding pattern of higher education in Kerala, the reasons for these
changes and their implications. The purpose of this discussion is to
place in context the newly introduced 'self financing' mode of
financing professional education on a large scale. As in the
previous chapter, we are relying largely on secondary data and
studies made by earlier researchers.
4.1 Kerala's Unique Position
The uniqueness of Kerala's development experience lies in
the exceptional social development and quality of life in spite of
low economic development. This is often referred to as the Kerala
Model of the development which has become the topic of global
discussion about development.

Kerala 's achievements in education include near total
li teracy, free and universal primary education, low dropout rates at
the school level, easy accesses and gender equality. In these
respects Kerala is compared with some of the developed countries.
It is often acclaimed a s the 'Kerala Model' and some recommend
Keralization o f the whole education system i n India (Lewis, 1997) ' .
The nineteenth century initiatives by missionaries and
princely regimes o f Travancore and Cochin laid the foundation for
education in Kerala. The social reform movements that took place
accelerated the spread o f education. Large scale state funding of
education was an important factor behind state 's educational
development
But the state government today finds it very difficult t o
maintain the gains it has already made. The very success o f Kkrala
Model o f development in education has generated second generation
problems, the depth of which have not been fully studied. While the
demand for funds has been increasing, corresponding government 's
investment in social sectors like education and health has not been
increasing, partly because of fiscal cr is is .
Kera la ' s achievements in the field of education are well
known and very often a bright picture is drawn. The achievements

are definitely laudable. But at the same time, these achievements
should not allowed t o conceal some of the more serious deficiencies
and inefficiencies, The state lags behind in technical education and
research, It may be noted that Kerala's achievements in the
educational sector had been mostly in the less capital intensive
areas like school education and general higher education.
The educational system in Kerala developed in response t o
the demand created by social, political and religious groups.
General education dominated over technical education and therefore
the system got delinked with the production base of the state. The
higher education is not adapted to the needs o f Kerala's economy.
Restructuring, diversification and modernisation did not take place
due t o many reasons including f inancial . In the absence o f fresh
inputs, the academic programmes are getting obsolete and are
becoming incapable o f catering t o the requirements of the economy
in the modern context of knowledge intensive production and
services
Large quantum o f funds are required in Kerala for
diversification o f courses, improvement o f quality and enhancement
in the intake capacity o f technical education. While the demand for
more investment is on the increase, the allocation o f funds is on

the decrease partly due t o the fiscal cr is is o f the state government.
The government had been reducing the share o f social sectors in its
budgets Funds from central government and other funding agencies
including external agencies t o this sector are o n the decline. Cost
recovery performance is very poor. All these call for finding
alternative sources of f inance and implementation o f strict financial
discipline
Kerala lags behind in the field o f higher education not only in
qualitative terms but also in quantitative terms. The demand for
enrolment i n higher education is higher in Kerala due t o high
unemployment and the resultant low opportunity cost of higher
education it may be noted that the successive rounds o f National
Sample Survey have confirmed the highest incidence of
unemployment in Kerala among states. But there exists a wrong
impression that higher education in Kerala has expanded well .
Even the Ashok Mitra Commission (1999)' has observed "The
higher education system in Kerala has extensive reach". The
Commission has observed that 10 per cent o f those who enter school
enrol1 for University education and the total percentage students
entering higher education accounts for 1 5 per cent of the relevant
age group But the Commission's impression is not based o n facts.

The gross enrolment ratio in higher education in Kerala is
only 3 7 per cent of the relevant age group (18-24) population It t s
to be noted that the all India gross enrolment rat io in higher
educatton ts around 6 per cent In other words, the enrolment rattc
in Kerala is lower than the national average. It is important to note
that this ratio has come down in Kerala from 1972-73 when it was
5 . 9 percent (Tilak 2 0 0 0 ) ~ . Several other indicators also point t o the
fact that Kerala lags behind in higher education. The percentage o f
population with higher education was 3.9 percent in the state during
1995-1996 The national average for the same was 4 .2 percent. At
least, 15 states are ahead o f Kerala. O n this count Kerala is no
better than Uttar Pradesh ( Tilak 2 0 0 0 ) ~ .
Enrollment in Arts, Science and Commerce colleges in Kerala
is given in 'Table 4 1
Table 4.1 : ENROLMENT IN ARTS & SCIENCE COURSES IN
UNIVERSITIES OF KERALA University
Kerala M. G. Universi ty Calicut Kannur ~
Total Source Based on Economic Review 2000
Enrolment Degree . Post graduate
----l Total
49145 39194 43658 12888
144885
5271 4577 3663 1074
14585
54416 43771 47321 -
13962 159470

The total number o f degree and post graduate students in the
affiliating Universities comes t o 159470. Of the total under
graduate students number 1.45 lakhs and post graduates number
only 0 .15 lakhs.
The technical educational institutions especially engineering
institutions were few till recently. Their number remained almost
stagnant during the period 1970-71 to 1995-96. It was after 1993
that the number of engineering colleges started moving up and it
was due to the introduction of self financing institutions by
Universities, IHRDE, LBSCST, KSRTC etc. Given below is a table
showing enrollment in engineering colleges in Kerala
Table 4 .2 :
. 5798 8543
Source Based on Economic Review, 2000
ENROLMENT IN ENGINEERING COLLEGES IN KERALA
4.2 Fiscal crisis of Kerala and the declining public expenditure on education
Year
1997 1998
The fiscal crisis of Kerala is setting a limit to the States's
ability to finance public expenditure as in the past. This is evident
No, of Engineering Colleges
15 1 5
Annual Intake
4844 4844

from Table 4 3 The table shows the gravity of the fiscal crisis in
the state compared to all states
Table 4 . 3 MAJOR FISCAL INDICATORS FOR KERALA
Table 4 4 gives the share of education in the budgetary
Figures in percentage
expenditure of Kerala and All States,
Year 1990-95 1996-97 1997-98 1998-99RE 1999-2000BE
Table 4 . 4 SHARE OF EDUCATION, ART, CULTURE & SCIENTIFIC
3 . T o t a l Expenditure 1 2 7 . 4 1 2 4 . 1 1 2 2 . 2 1 22 .3 1 2 1 . 9 1 1 5 . 5 1 15 .0 1 5 16 .6 1 16 .3 a. Plan -. 1 10.6 1 8 2 d 6 . 9 1 5 . 4 1 6 . 2 1 5 .4 1 4 . 5 1 5 . 8 1 5 . 7 1 8 . 4 b. Non P l a n 1 3 2 . 5 1 3 0 . 7 1 2 7 . 0 ( 2 6 . 9 1 2 7 . 0 1 2 0 . 2 / 2 0 . 2 1 2 0 . 9 1 2 1 . 2 1 1 9 . 7
Source: Limits to Kerala Model of Developments, K.K.George,
Source: Finances of State Government 1998-99, R .B . I . Bulletin Feb. 1999
State Finances, a study of budgets of 1999-2000, R .B . I . Bulletin Jan
2000 Notes: 1. GFD Gross Fiscal Deficit. 2 GFD Exp. Gross Fiscal Deficit expenditure 3 RE-Revised Estimates 4. B E - Budget Estimates
.
CDS, Trivandrum 1999, p.82.
GFDJGFD EXPENDITURE KERALA
20.7 20.1 2 5 . 3 2 5 . 4 21 .6
REVENUE DEFICITIGFD ALL STATES
19.0 19.6 26 .3 28.5 26 .1
KERALA 44.0 41 .7 4 6 . 5 57 .6 67 .5
ALL STATES 24.6 43 .3 37 .0 5 3 . 8 27 .7

The table shows that a large share of the revenue expenditure
is on non plan account and is of a recurring nature. Most of the
allocation for education is spent on salaries, with the result that
little is left for current inputs, modernisation and restructuring.
Besides the share of capital expenditure is relatively low,
The table also shows that in recent years, the state
government has been reducing the relative share expenditure on
education The share of education in total expenditure has been
brought down from 27.4 per cent during the Fifth Five Year Plan t o
21.9 per cent during the Eighth Five Year Plan. The share of
education in plan expenditure has come down still more drastically
from an already low 10.6 per cent t o 6 .2 per cent. This leaves very
little funds for taking new initiatives and for spending on new
projects and schemes. During the nineties, the share of education in
Kerala's total plan expenditure has been lower than that of all
states The expenditure on education has shown one of the lowest
growth rates among states from 5'h plan onwards. The low growth
rate of 3 . 2 percent recorded during period 1974-1975 to 1984-1985
dipped to 1 1 percent during the subsequent period of 1985-1986 to
199 1 - 1992 (Prabhu, Seetha and ~ h a t e r j e e ) ~ .
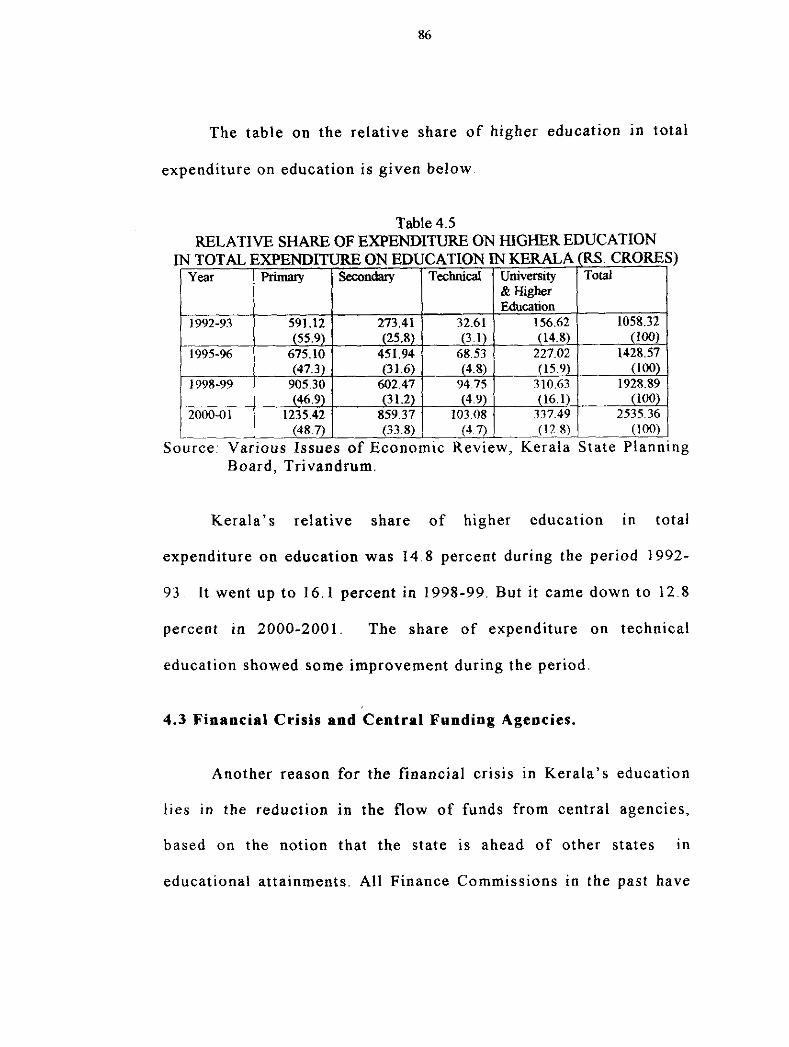
The table on the relative share of higher education in total
expenditure on education is given below
Table 4.5 RELATIVE SHARE OF EXPENDITURE ON HIGHER EDUCATION
~ o u r c z a r i o u s Issues of Economic Review, z e r a l a State Planning Board, Trivandrum.
Kerala's relative share of higher education in total
expenditure on education was 14.8 percent during the period 1992-
93 It went up t o 16.1 percent in 1998-99. But it came down to 12 8
percent in 2000-2001. The share of expenditure on technical
education showed some improvement during the period.
4.3 Financial Crisis and centra l Funding Agencies.
Another reason for the financial crisis in Kerala's education
lies in the reduction in the flow of funds from central agencies,
based on the notion that the state is ahead of other states in
educational attainments. All Finance Commissions in the past have

failed t o provide adequately for the educational sector in Kerala.
As a result, Kerala had been receiving only negligible sums as
upgradation grants provided to this sector. The Planning
Commission, the central ministry for HRD and the external agencies
are also reducing their commitments to the state's educational
sector because of the state's better image (George 1 9 9 9 ) ~ .
4.4 Delinking Pre-Degree Course and its Financial Implications.
A special financial problem faced by Kerala in recent years
arises from its belated decision to delink pre-degree classes from
colleges and to shift them to schools. The task seems t o be quite
daunting New infrastructure has to be built in the schools to
accommodate nearly two lakh students. While vast infrastructural
facilities like buildings, laboratories, etc, are rendered surplus in
colleges New teachers are to be appointed in schools while there
will be surplus teachers in the colleges to be protected by the
government The immensity of the task faced by Kerala now can be
gauged from the fact that nearly Rs. 70 crores were required in the
first year itself to shift the pre-degree from college to school (State
Planning Board 1 9 9 7 ) ~
The de-linking of pre-degree courses from the colleges
provides a unique opportunity for expansion, modernisation1

diversification and vocationalisation of higher education. As a
result of de-linking, vast physical infrastructure facilities in the
form of buildings, libraries, laboratories e tc will be rendered
surplus in the colleges. Core faculty is also available. These
resources could be utilised for starting non-conventional courses, if
adequate funds are available. Additional inputs are required only
to supplement and complement the already existing facilities. But
the state government which is already facing resource constraints
finds it difficult to invest funds t o fully utilize these facilities. But
it is highly necessary to make this crucial investment in the long
term interest of the state. If further investment is not made, the
vast infrastructural facilities built at enormous cost and sacrifice
will be enfeebled and will go out of use.
The expenditure called for is estimated t o be around Rs. 241
crores (AKPCTA 1 9 9 1 ) ~ The l l t h Finance Commission was
requested by the AKPCTA to appreciate the potential links between
Kerala's educational development and i ts future economic
development and to give financial assitance t o Kerala t o meet this
special problem But the Finance Commission did not award any
assistance to Kerala t o meet this special problem of the state.

4.5 F inanc ia l C r i s i s of t h e Univers i t ies
The financial problems of Universities in Kerala and
elsewhere are similar to a large extent . There are many reasons for
crisis The changes in the rapidly globalising job markets and leap
in science and technology demand a through restructuring o f
academic programmes o f the Universities. Unless the reforms are
introduced, the Universi t ies may become obsolete and irrelevant.
So new generation courses and programmes in the frontier areas o f
science and technology have t o be organised All these call for
heavy capital investment. While the demand for funds is increasing
rapidly, there has been a squeeze on the resources available t o
Universities.
The expenditure side o f the University consists of staff
salaries, cost of equipments, laboratory, books, periodicals,
construction, maintenance etc. The source o f income o f Universities
can be divided into government sources and internal sources. The
development o f Universities in India i s a joint responsibility o f
s tate and federal governments. The government 's share, whether
state or federal, shows upward trend and the law o f increasing s ta te
act ivi t ies applies to University education a s well . The government 's

share in University f inances increased from one-third at the t ime o f
independence to nearly three-fourth within the next three decades.
The federal grants to the state Universities f low largely
through the University Grants Commission (UGC) Therefore state
governments and UGC can be treated as the most important sources
of revenue for the Sta te Universities The grants are of different
categories - maintenance grants and development grants The UGC
grants are made available to the Universities mainly for
development purposes The grants from the state government are
both for development and maintenance
There are other external sources of income for Universities.
They include Centeral Government agencies like All India Council
for Technical Education (AICTE), Council fo r Scientif ic and
Industrial Research (CSIR), Indian Council for Social Science
Research (ICSSR), Indian Council for Agricultural Research and
other research organisations.
Studies elsewhere show that the state government grants have
been inadequate (Nanjudappa 1976 and Pancahankhi 1977)'.
Generally, the grant-in-aid policies of the state government exhibit
lack of concern for balanced expansion o f University education in
the state As a result, there exist inter University inequalities in

financial provisioning by s ta te government Absence o f clear time
schedule for the state grants is another draw back. The
' insufficiency o f grants ' and their declining trends have been
revealed by Mathew (1980)1° who studied the f inances o f Kerala
University
We have noted in chapter I1 that the grant in aid policies o f
UGC are not designed t o work in a fair manner and there is a n
element o f uncertainty and ad-hocism' (Panchamukhi 1997)" There
is the lack of co-ordination between the state government, the UGC
and the Universities (Parekh 1970)''
The grant in-aid policies should have three object ives viz.,
supplementation, stimulation and equalisation (Panchamukhi
1977)" Grants should supplement the resources o f the University.
They should stimulate internal efficiency and should reduce inter-
university inequalities. None of these object ives are being met by
the present grants-in-aid system.
The expenditure of a University can be classified into
expenditure o n academic act ivi t ies and other act ivi t ies . T h e
proportion of academic and non academic expenditure shows
variat ions in many Universities and the general tendency is for the

non academic expenditure t o exceed o r equal the academic
expenditure
4.6 Cochin University of Science and Technology - A Case Study
For a detailed analaysis o f the f inances o f the University
system in Kerala, we have taken up a case study of Cochin
University of Science and Technology (CUSAT). The growth trend
in expenditure and receipts of the Cochin University o f Science and
Technology (CUSAT) are given below in Table 4 . 6
Table 4 . 6 ANNUAL GROWTH TRENDS IN EXPENDITURE AND
RECEIPTS OF CUSAT F~gures in Rs. Lakhs and indicate increase over previous year
Source: Based on High Power Expert Committee Report 1999 (CUSAT).
The table shows wide year t o year f luctuations in both
receipts and expenditure. For instance, the annual increase in
receipts was 1 3 per cent in 1995-96 whereas it was 25.6 per cent in
the subsequent year Fluctuations in both plan and non-plan
receipts have been noted. The growth in plan receipts during the
period 1992-1993 and 1995-96 was negative. As for the non-plan
receipts, they fluctuated from 3 . 5 per cent in 1993-94 t o 24 2 per

cent in 1996-97. The fluctuations are caused by the fluctuations in
grants from the UGC and the state government which do not follow
any formula. The uncertainities in the quantum and timing of funds
from the funding agencies make budget exercise in the University
rather difficult. The University's expenditure pattern also shows
erratic movements.
The long term trends in University revenue for the period
from 1971 to 1997 are shown in the Table 4 .7 below
Table 4.7 LONG TERM TREWS IN UNIVERSITY REVENUE 197 1- 1997
Source: Based on High Power Expert Committee Report 1999 (CUSAT).
(Percentage)
The long term trends in University Revenue show that there
is a steep decline in the share of UGC. But funding by other
Government of India agencies is increasing. But this increase is not
adequate to offset the decline in the share of UGC grants. Another
trend is the steep increase in the share of state government funding.
~ h e r k has been some increase in internal sources. Yet another trend
Year lnter nal Rev
GmUsFmmSt.te Ciovenmrnt
Orsnts from UGC Tdal Plan
Tdaf Otha Agen" CS
Tdal Nm- plan

is the decreasing share of plan receipts in the total receipts as also
in the state government grants.
The table 4 8 shows that the expenditure under the heads
salaries and allowances account for nearly half of the total
expenditure. The share of scholarships, fellowships and schemes
which a re directly benefiting the students is coming down
TABLE 4 8 SHARE OF MAJOR HEADS OF EXPENDITURE IN AGGREGATE
EXPENDITURE OF COCHIN UNIVERSITY (Exclud~ng Debt Heads)
Source Based on H~gh Power Expm Corntree Report 1999 (CUSAT)
4.7 Finance Management
Budget is by far the most important document of planning and
control. It is the document that spells out the plans, aspirations and
perspectives of a University. But of late, the importance of the
document has been diluted because the projections in the budget on
receipts and expenditure are not realistic. It often presents a rosy
picture and mislead the academic community and the general public.
Budgetary control has also become ineffective.

E T Mathew after studying the finances of Kerala University
came to the conclusion that the basic problem of that University
was that it d ~ d not have a proper planning machinery (Mathew,
1980) '~ He noted that the development plan o f the University is
mostly characterized by adhocism They are not based on any clear
perspectives of the development needs of the University education
The state also does not have a plan for University sector
In the context of severe budgetary squeeze faced by the
Univers i t~es , i t is necessary that strict management control is
enforced in the Universities. This is all the more important in the
context of the rising demand for higher cost recovery from students.
The cost has to be managed effectively before higher cost recovery
from students is initiated. "The society and the people will be all
the more happy to contribute and nourish the University, provided
the tax payer is offered a better explanation than currently offered
of what Universities accomplish with the resources made available"
(Public purse, Public Purpose (1992)) '~.
For bringing about strict expenditure control, it i s necessary
to have a close watch on each and every head and sub-head o f
expenditure This calls for a detailed work study a s well as an
organisational study Work studies had been conducted in CUSAT

in 1992 and 1998. But the suggestions made in the report have
neither been discussed nor implemented in the University. The
management techniques have to be employed to share the
equipments and libraries and to avoid duplication in purchases.
Efficient utilization of the scarce resources is as important as
generating additional resources. But this does not, at the moment
take place in the Universities in Kerala.
4.8 The College Finances
In the evolution of the college finances, four important
phases can be identified. They include (1) period prior to 1962 (2)
period from 1962 to 1972. (3) Period from 1972-1990 (4) the
period since 1991. During the period prior to 1962, the colleges
were largely self sustaining. The private colleges were run
privately in the strict sense. The fees collected were used for
payment of salaries and other expenses. The students had to bear a
good portion of the recurring cost of education. Staff salaries were
very low The salary range was between Rs 3 to Rs. 200, from the
sweeper to the Principal, during 1922-1923 in the Union Christian
College, Aluva (Mathew 1990) '~ . The tuition fee was Rs 112 for
Pre-University class and Rs. 200 for P.G. class during 1961-62.
The range of operations of the college was very small. The annual

budget outlay and financial operations of a college during 1958-59
was to the tune o f Rs. 2 lakhs. The period was characterized by low
enrolment, low receipt from tui t ion fee, low and errat ic payment of
salaries e tc
Another very important feature of the period is the surplus o f
fees collected over expenditure on salary o f staff. But this trend did
not last long and towards the 1960's, the management could not
meet even the expenditure o f salaries out of tuition fees . Part o f
the reason lies in the introduction of new UGC scales for teachers
in 1958 which increased the financial burden. The Central
government assistance was offered only up to 1961 The teachers
movement, lead by the All Kerala Private College Teachers
Association (AKPCTA) launched an agitation to ensure the
continuance o f the U.G.C. scale. The Grand-in-aid code o f 1962
was a direct result of the agitat ion. The managements were required
to execute an agreement and abide by the code. According t o the
agreement between the government and the private managements, a
sum of money was set apart by the state "with the object ive o f
maintaining, improving and extending higher secular education".
All major expenditure heads o f colleges were covered by teaching
grants, building grants, equipment grants e tc . A uniform pattern of
funding, based on norms, came into existence for the first time in

Kerala, with the introduction o f grant-in-aid code With this the
financial dependence of private colleges on government increased
several t lmes It was the beginning of public funding o f private
colleges
But the grant-in-aid code introduced in 1962 did not solve the
problems o f the management as well as the teachers. The teachers
felt that unless the government assumed responsibility o f payment
of salary directly, their r ights would not be protected in the hands
of the managements Consequently, Direct Payment Agreement
(DPA 1972)17 was signed between the government, the
managements and teachers ' organisations (AKPCTA). According t o
DPA, the educational agency should collect fees as per the rate
fixed by University which should be remitted in the s ta te t reasury.
Norms for admission o f students and statutory provisions for
appointment o f teachers were established. As per the agreement,
government agreed to disburse the salaries, pay contingency and
maintenance grants The direct payment imposed a heavy f inancial
burden o n the government. The introduction o f DPA has led t o an
increase in the number of colleges, as the expenditure was met
largely by the government . But there was no matching improvement
in the quality of higher education. With increased spending by

government there was gradual withdrawal o f private managements
from investment in their colleges.
The period between 1972 and 1990 is eventful, particularly
because the highest ever budget allocation of 3 8 . 7 per cent for
education was recorded during this period (1978-79). The highest
ever percentage of educational expenditure t o SDP was a lso
recorded during the same phase. During 1985-1986, the share o f
education in SDP reached 7.1 per cent . But from 1980s, it came
down, but almost maintained the 6 per cent mark. The period since
mid 1980's saw declining share o f education in both SDP and total
government expenditure. Consequently, financial crisis became
endemic The crisis has come at t ime when more inputs are
required t o modernise the infrastructure and t o restructure the
obsolete courses and curriculum. However, the government is not
able or is willing to invest further in higher education.
4.9 Cost recovery
Yet another reason for the financial crisis i n higher education
is the fee structure in the s ta te ' s Universities and colleges. The
fees have not undergone major revisions based either o n increase in
input costs, or students' capacity to pay. Successive governments
in Kerala over the last five decades have been competing with each

other to abolish fees or exempt more students from paying fees. The
latest example in Kerala is the abolition of fees for pre degree
courses in early 1990s.
The periodical non-revision of fees has enhanced the
government burden in the context of escalating cost of higher
education The tuition fee collected from arts and science colleges
was to the tune of Rs. 4 .75 crores during 1994 -1995 (Rs .1 .36
crores from government colleges and Rs.3 .38 from private
colleges) Fees which represented 17.8 percent of the total grants to
private colleges from the government in 1976-1977. represented
only 13 2 percent in 1984-86 (Mathew E T . 1 9 9 1 ) ' ~ . The tuition
fees cover only about 4.11 percent of the expenditure on
government colleges. I t is now only 2 . 5 percent of government
grants to private colleges. The fees collected by the three
Universities- Kerala, Calicut and M.G in 1993-1994 form only 6 .44
percent of the total income of the Universities. The fees covered
only 5 .9 percent of the state expenditure in professional colleges in
1994- 1995
Given below is a table showing comparative fee structure of
an unaided school in Ernakulam and regular engineering colleges.

\ \ - \
Table 4 9 COMPARISON OF SCHOOL FEES AND REGULAR'EWGINEERING - . -
COLLEGE FEES 1999-2000
Source Toc H School Ernakulam for School fee and MACE Kothamangalam for engineering fee.
From table 4 . 9 it is clear that even in the LKG the fees
collected from the students is more than that of a regular
engineering student. The plus two student pay nearly three times the
fees paid by a regular engineering student.
The financial crisis in higher education can be remedied
partly by better cost recovery methods. The question of cost
recovery in higher education has gained attention recently and
attempts are being made by Universities in Kerala in this direction.
The long term trends in University revenue between 1971 and 1997
in CUSAT show (Table 4.8) that the share of internal revenue which
was 8 . 1 percent in 1971-1980 period increased to 12.3 percent in
1996-1997 The trends in 1990s in CUSAT show that the internal
sources which contributed only 3 .3 percent of the total receipts in

1991 contributed to 12.3 percent towards the latter half o f the 1990s
(CUSAT High Power Committee 1999)19
The model o f subsidisation followed in the state relies mostly
on providing hidden subsidies t o students by charging low fees,
which cover only a very small share of the cost . By charging
uniformly low fees, unequals are treated equally. It subsidises the
poor and the rich al ike. Low level o f fees, ultimately lower the
quality of h ~ g h e r education.
4.10 Role o f Private Sector
Our earlier discussion showed that private colleges today are
largely funded by government but managed by the private agencies.
In the past, funds were raised from the public, mostly f rom the
members o f the community which sponsored the college and t o
some extent, from members o f other communities. In many
instances, the state government and the local authorities gave land
to the colleges as g i f t . Even individuals gave land for colleges as
gifts The fund raising practices adopted by the managements were
innovative (Ulpanna Pir ivu, offertory etc12' The communities and
their leaders considered this a s an investment for future generat ion
and they did s o wi th great sacrif ice and abnegation. The large
educational infrastructure which the state has today is the result o f

their investment But now, after a few decades, all these
infrastructural facilities have become obsolete and it is necessary
to modernize them for which a lot of resources are required. But
the investment required for updating and upgrading is negligible
when compared to the original investment. But the educational
agencies do not show as much interest and enthusiasm, as they used
to show in the past. But in the absence of fresh inputs either from
the government or private managements the system would get
enfeebled and become irrelevant.
As seen earlier the educational scene underwent a
transformation from the late 1960s. It was during this period that
the government control of education was implemented. In some
instances, this control might have led t o certain extreme positions.
This in turn might have led to the gradual withdrawal of many
educational agencies from the active investment in education. The
consequences of withdrawal are tragic both to the community and
society at large
E T Mathew has found that in certain years the share of
private managements in financing was as low as 0 .66% (1978-
79)and 0 .68% (1982-83) Mathew E.T ( 1 9 9 1 ) ~ ' . This mode of
privatisation of higher education in Kerala is only "Pseudo

privatisation" which is unlikely t o relieve the government from the
financial burden (Tilak 1 9 9 5 ) ~ ~ . The private colleges in Kerala a re
nothing but publicly funded but privately managed inst i tut ions.
This mode of f inancing has been described as public financing and
private production. (Mathew E T. 1996)"
4.11 Four Models of Financing
On the basis o f f inancing and production, Mathew has
conceived four different options. (1) Public financing and public
production (2) Public f inancing and private production ( 3 ) Private
financing and public production (4) Private financing and private
production (Mathew E . T 1996)14. The government colleges belong
to the first category and private colleges t o the second. The
financial implicat ions o f both categories are almost the same t o the
state exchequer. Government meet almost all expenses o f both
categories o f col leges . The terms and conditions of service of
teaching and non teaching staff in both private and government
colleges are substantially the same.
The third category i s public production and private f inancing.
The government agencies and Universities in Kerala have started
self financing o r cost sharing professional institutions. The
engineering colleges of CUSAT, M G University and IHRDE,

LBSCST are examples of public production totally financed by
private individuals i . e . the students and their parents. The fourth
category is private financing and private production. The entire
resources are raised by the agency concerned from the students,
public and other sources. These institutions are owned, managed,
and financed privately. There is growing importance t o the third
and fourth category of institutions in Kerala. The new method of
financing goes for 100 per cent private financing but only through
cost recovery. In this study, we propose to analyse whether the
new method is i n conformity with the well established academic
norms as also norms of social justice like accessibility and equity.
4.12 Self Financing Higher Education
The system of charging higher fees for a professional course
was started by Universities in Kerala in late 1980's. In 1989 it was
introduced by the IHRDE in its Model engineering college. But the
Model Engineering College received aid from the exchequer during
its formative stages The tuition fee charged was initially Rs.
30001- per semester but went up to Rs. 10000/- per year. This
college though charging much higher fees than the other
government owned and aided colleges was not recovering the entire
cost from students Mahatma Gandhi University started self

financing courses in pedagogical sciences, nursing, laboratory
technology, pharmacy, physiotherapy etc. In 1993 government of
Kerala sanctioned three self financing engineering colleges each
under the IHRDE, LBSCST and MES. This was followed by Kerala
State Road Transport Corporation (KSRTC), Cochin University of
Science and Technology (CUSAT) and Mahatma Gandhi
Un~versity Several arts and science colleges affiliated to Kerala,
MG and Calicut Universities started self financing courses in
computer and Electronics. Diploma courses are also run by private
institutions, lHRDE and LBSCST on self financing basis. The Co-
operative Academy has started recently a number of engineering
colleges in the self-financing sector. The school of pedagogical
sciences of Kerala, Calicut and MG Universities conduct B.Ed, and
M E d courses for thousands of students in the self financing
stream
A number of arguments have been put forward for and against
the 'self financing' system. It is argued that self financing is the
only practical solution to get out of the present financial crisis in
higher education. These institutions depend totally on resources
mobilised from students. The institution's or government's share in
the cost of such institutions is nil. They are not really 'self
financed' but 'students financed'. These institutions are run by

private educational agencies in neighboring states. But in Kerala
~t is mostly the government agencies and the Universities that have
taken the lead in start ing self financing engineering and other
colleges According t o one view, self financing institutions started
by government and Universities may lead to conflicts between their
regulatory and ownership roles. In the event of any such conflict, it
the regulatory role that is most likely t o suffer (George 1 9 9 5 ) ' ~
Another l ine of argument is that large number of s tudents and
parents have the capacity and willingness to pay high fees The
outflow of funds t o the self financing institutions in the
neighbouring states is of ten cited as another reason for starting self
financing colleges in Kerala.
Our review in th is chapter has shown that Kerala had made
astounding progress in education in the past. Both the government
and the private agencies had contributed to this development. But
both agencies are now slowly reducing their contr ibutions t o this
sector, leading to the spread o f 100 percent student financed
institutions According to Coombs "The priority a particular
society at taches t o education in comparison to other public goods
and services is most strongly influenced by that societies cultural
background and traditions, its present goals and aspirations, not

least of all the nature o f i t s political system and cl imate. With
other things being equal, some societ ies including some o f the
poorest will undoubtedly invest considerably more of their scares
resources in educat ion than other societies (Coombs, 1981) '~ .
Kerala was one such society in the past . It appears that Kerala
society is changing i t s t rack, may be due to the changes in factors
cited by Coombs
END NOTE
1 I.,ewis, John P , India 's Political E c o n ~ m y : ~ . G o v e r n a n c e and Reforms, Delhi: Oxford University Press, 1997.
2 Mitra, Asok Repor t of the Kerala Education Commission, Kerala Sastra Sahitya Parishad Kochi 24 January 1999
3 Tilak, J B .G . , "Higher Education and Development in Kerala" Working Paper N o . 5 . Center for Socio - Economic and Governmental Studies (CSES) Kochi (2000).
4 Tilak, J . B G . (20001, ibid
5 . Prabhu, Seetha and Chaterjee. , "Social Sector expenditure and Human Development A Study o f Indian State" Quoted in Economic and Political Weeklv, May 1994.
6 . George, K . K . , What is wrong with Kerala's Education System? CSES Working Paper No.3 Kochi: Centre for Socio Economic and Environmental Statistics, 1999.
7 State Planing Board. Report of the Task Force on Higher Education, T N J a y a c h a n d r a n [Chairman], Government Press Trivandrum, 1997.
8 All Kerala Private college Teachers Association (AKPCTA), "Facts of Kerala 's Education Backwardness" Paper presented to I llh Finance Commission on Special Central Assistance for the

Development of Education in Kerala. AKPCTA Office, Trivandrum 1999
9 . Nanjundappa, D.M. and Panchamukhi P.R., The Working o f University Finances. Sterling, New Delhi 1976.
lOMathew, E T . , University Finances in India. A case study of he Kerala University, Sterling, New Delhi. 1980.
11 Panchamukhi P R., Economics of University Finances. Basic Principles and Practices. Centre for Multidisaplinary Research, Dharwar, Karnataka, 1977.
12,Parekh, G . D . , (1970) "University Finances Problems and Procedures", Quest No. 64, pp 33-40,
13 Panchamukhi, P R , (1977) 0 p Cit
14 Mathew, E T , (1980) 0 p . Cit
15. Public Purse, Public Purpose, "Accountability and Autonomy in Canadas University sector" (Ed.) James. Cutt and Rodney Dobell. Institute for Reseachs on Public Policy IRPP, Canada 1992.
16Mathew E T . (1990) "Financing college education in the Private sector in Kerala", Economic and Political Weekly, April 1990.
17.Direct Payment Agreement, (DPA) 1972; Agreement signed in 1972 after a long struggle -The government and the private educational agencies signed a memorandum of understanding. Salaries of teaching and non teaching staff and other recurring expenditure would be met by the government. In return the colleges are bound to remit the tuition fee in the treasury. Admission of students regulated, 50 percent on merit, 20 percent SCIST followed by management quota and community quota etc. Appointment of teachers and non teaching staff based on statutory provisions. Also see Mathew E.T. (1990) "Financing college education in the Private sector in Kerala", Economic and Political W e e k l s April 1990.
lg.Mathew, E T . , "Financing Higher Education" Concept Publishing Company New Delhi 1991.

19 Cochin University of Science and Technology, Revort of the High Power Committee, A. Mohandas [chairman] Cochin: CUSAT, 1998.
20 Ulpanna Pirivu and Offertory, Nair Service Society (NSS) under the leadership of Mannathu Padmanabhan resorted to diffkrent techniques of fUnd raising One such method is known as ulpanna Pirivu- by which each household to donate the agricultural produce. These produce will be auctioned and the fund raised may be utilised for the building up of colleges. Christian management who utilised ulpanna Piriw and offeratory received during weekend prayer and perunnal (Festival) E.T. Mathew, Economic and Political W&, 1990
21 Mathew, E . T . , (1991) 0 p . Cit
22 Tilak, J B G , Cost and Financing of Education in India Discussion Paper Service UNDP Project, Centre for Development Studies, Trivandrum 1995
23 Mathew, E T , "Financial Aspects of Privatisation of higher Education" issues and options, Economic and Political Weekly, April 1996
24 Mathew, E T , (1996) 0 p Cit
2SGeorge, K .K . , Higher Education in Kerala-Financial Crisis, Causes and Options, Mavilikara, Kerala: Vichara, 1995.
26.Coombs, P H . , The World Crisis in Education The View From t k E i a h t i e s , Oxford University Press, New York, 1985.


