
Treasury Presentation to TBAC
Office of Debt Management
Fiscal Year 2015 Q1 Report
Table of Contents
3
I. Fiscal A. Quarterly Tax Receipts p. 4 B. Monthly Receipt Levels p. 5 C. Eleven Largest Outlays p. 6 D. Treasury Net Nonmarketable Borrowing p. 7 E. Cumulative Budget Deficits p. 8 F. Deficit and Borrowing Estimates p. 9 G. Budget Surplus/Deficit p. 10
II. Financing A. Sources of Financing p. 13 B. OMB’s Projections of Net Borrowing from the Public p. 15 C. Interest Rate Assumptions p. 16 D. Net Marketable Borrowing on “Auto Pilot” Versus Deficit Forecasts p. 17
III. Portfolio Metrics A. Weighted Average Maturity of Marketable Debt Outstanding with Projections p. 22 B. Projected Gross Borrowing p. 23 C. Recent and Projected Maturity Profile p. 24
IV. Demand A. Summary Statistics p. 29 B. Bid-to-Cover Ratios p. 30 C. Investor Class Awards at Auction p. 35 D. Primary Dealer Awards at Auction p. 39 E. Direct Bidder Awards at Auction p. 40 F. Foreign Awards at Auction p. 41

Section I: Fiscal
4
5 Source: United States Department of the Treasury
(50%)
(25%)
0%
25%
50%
75%
Jun-
04Se
p-04
Dec
-04
Mar
-05
Jun-
05Se
p-05
Dec
-05
Mar
-06
Jun-
06Se
p-06
Dec
-06
Mar
-07
Jun-
07Se
p-07
Dec
-07
Mar
-08
Jun-
08Se
p-08
Dec
-08
Mar
-09
Jun-
09Se
p-09
Dec
-09
Mar
-10
Jun-
10Se
p-10
Dec
-10
Mar
-11
Jun-
11Se
p-11
Dec
-11
Mar
-12
Jun-
12Se
p-12
Dec
-12
Mar
-13
Jun-
13Se
p-13
Dec
-13
Mar
-14
Jun-
14Se
p-14
Dec
-14
Year
ove
r Yea
r % C
hang
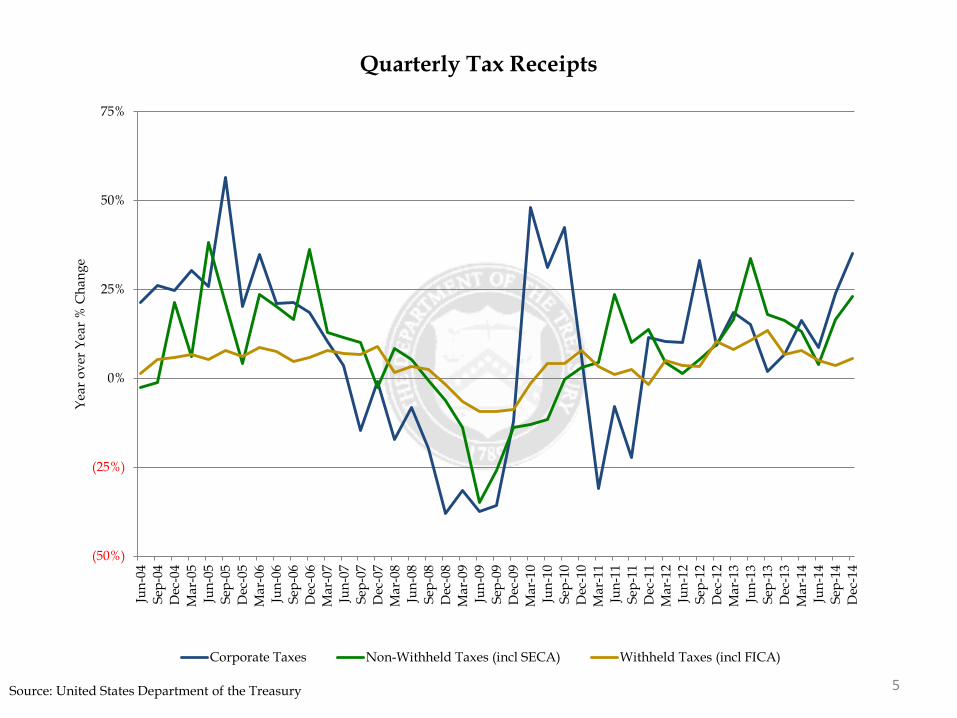
e Quarterly Tax Receipts
Corporate Taxes Non-Withheld Taxes (incl SECA) Withheld Taxes (incl FICA)

6 Individual Income Taxes include withheld and non-withheld. Social Insurance Taxes include FICA, SECA, RRTA, UTF deposits, FUTA and RUIA. Other includes excise taxes, estate and gift taxes, customs duties and miscellaneous receipts. Source: United States Department of the Treasury
0
20
40
60
80
100
120
140Ju
n-04
Sep-
04D
ec-0
4M
ar-0
5Ju
n-05
Sep-
05D
ec-0
5M
ar-0
6Ju
n-06
Sep-
06D
ec-0
6M
ar-0
7Ju
n-07
Sep-
07D
ec-0
7M
ar-0
8Ju
n-08
Sep-
08D
ec-0
8M
ar-0
9Ju
n-09
Sep-
09D
ec-0
9M
ar-1
0Ju
n-10
Sep-
10D
ec-1
0M
ar-1
1Ju
n-11
Sep-
11D
ec-1
1M
ar-1
2Ju
n-12
Sep-
12D
ec-1
2M
ar-1
3Ju
n-13
Sep-
13D
ec-1
3M
ar-1
4Ju
n-14
Sep-
14D
ec-1
4
$ bn
Monthly Receipt Levels
(12-Month Moving Average)
Individual Income Taxes Corporation Income Taxes Social Insurance Taxes Other
7 Source: United States Department of the Treasury
0
50
100
150
200
250
300
HH
S
SSA
Def
ense
Trea
sury
Agr
icul
ture
Labo
r
VA
Tran
spor
tatio
n
OPM
Educ
atio
n
Oth
er D
efen
se C
ivil
$ bn
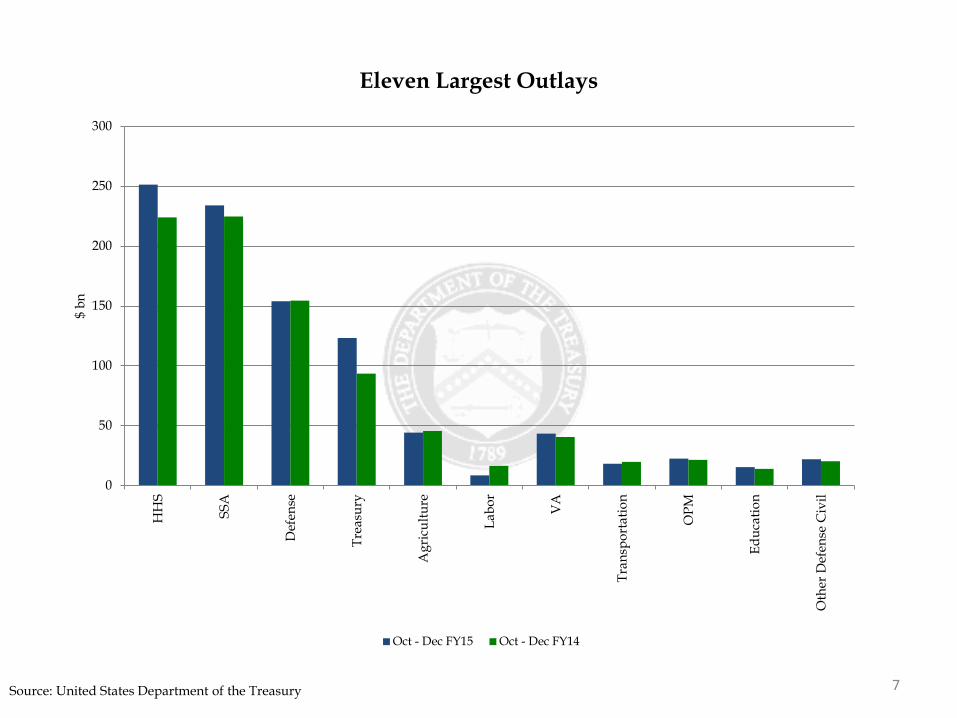
Eleven Largest Outlays
Oct - Dec FY15 Oct - Dec FY14

8 Source: United States Department of the Treasury
(35)
(30)
(25)
(20)
(15)
(10)
(5)
0
5
10
15
20
25
30
Q1-
05Q
2-05
Q3-
05Q
4-05
Q1-
06Q
2-06
Q3-
06Q
4-06
Q1-
07Q
2-07
Q3-
07Q
4-07
Q1-
08Q
2-08
Q3-
08Q
4-08
Q1-
09Q
2-09
Q3-
09Q
4-09
Q1-
10Q
2-10
Q3-
10Q
4-10
Q1-
11Q
2-11
Q3-
11Q
4-11
Q1-
12Q
2-12
Q3-
12Q
4-12
Q1-
13Q
2-13
Q3-
13Q
4-13
Q1-
14Q
2-14
Q3-
14Q
4-14
Q1-
15
$ bn
Fiscal Quarter
Treasury Net Nonmarketable Borrowing
Foreign Series State and Local Govt. Series (SLGS) Savings Bonds

9 Source: United States Department of the Treasury
0
100
200
300
400
500
600
700
800
Oct
ober
Nov
embe
r
Dec
embe
r
Janu
ary
Febr
uary
Mar
ch
Apr
il
May
June
July
Aug
ust
Sept
embe
r
$bn
Cumulative Budget Deficits by Fiscal Year
FY 2013 FY 2014 FY 2015

Primary Dealers1 OMB2 CBO3 OMB MSR4
FY 2015 Deficit Estimate 475 583 468 525FY 2016 Deficit Estimate 528 474 467 525FY 2017 Deficit Estimate 552 463 489 468
FY 2015 Deficit Range 400-550FY 2016 Deficit Range 375-600FY 2017 Deficit Range 325-700
FY 2015 Net Marketable Borrowing Estimate 580 726 580 655FY 2016 Net Marketable Borrowing Estimate 627 602 546 658FY 2017 Net Marketable Borrowing Estimate 628 596 561 596
FY 2015 Net Marketable Borrowing Range 490-719FY 2016 Net Marketable Borrowing Range 470-915FY 2017 Net Marketable Borrowing Range 450-800Estimates as of: Jan-15 Feb-15 Jan-15 Jul-14
1Based on primary dealer feedback on Jan 26, 2015. Estimates above are averages. 2Table 1 of OMB's "Fiscal Year 2016 Budget of the US Government"3Table 1 of CBO's "The Budget and Economic Outlook: 2015 to 2025"4Table S-11 of OMB's "Fiscal Year 2015 MSR"
10
FY 2015-2017 Deficits and Net Marketable Borrowing Estimates In $ billions
(12%)
(10%)
(8%)
(6%)
(4%)
(2%)
0%
2%
(2,500)
(2,000)
(1,500)
(1,000)
(500)
0
500
2001
2002
2003
2004
2005
2006
2007
2008
2009
2010
2011
2012
2013
2014
2015
2016
2017
2018
2019
2020
2021
2022
2023
2024
2025
$ bn
Fiscal Year
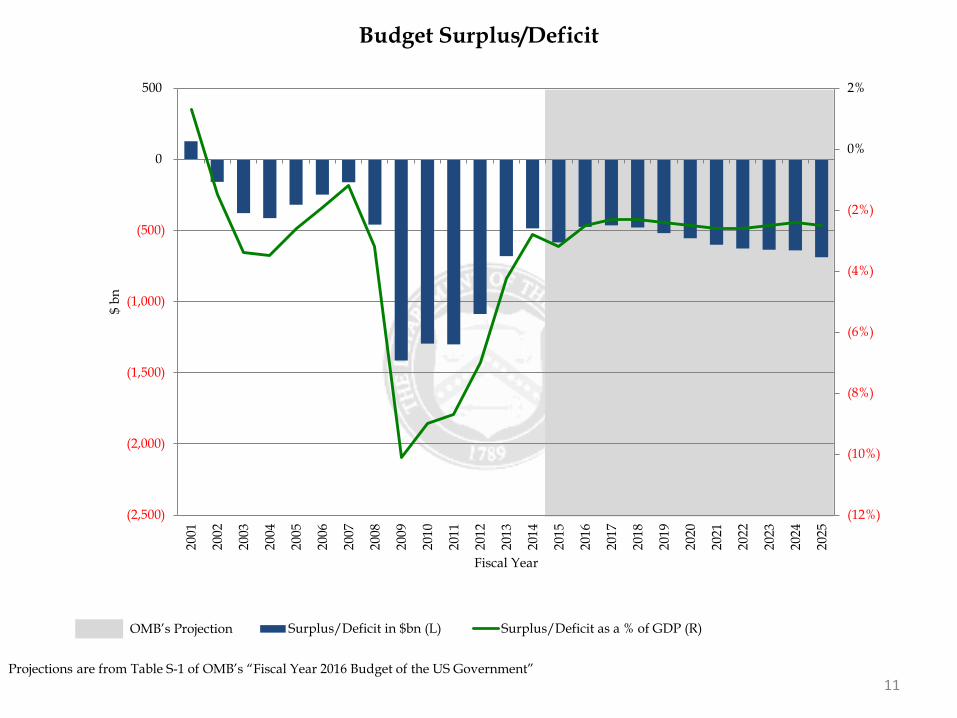
Budget Surplus/Deficit
Surplus/Deficit in $bn (L) Surplus/Deficit as a % of GDP (R)
Projections are from Table S-1 of OMB’s “Fiscal Year 2016 Budget of the US Government” 11
OMB’s Projection

Section II: Financing
12
13
Assumptions for Financing Section (pages 13 to 19)
• Portfolio and SOMA holdings as of 12/31/2014. • SOMA redemptions until and including June 2021. These assumptions are based on Chairman
Bernanke’s June 2013 press conference. • Assumes announced issuance sizes and patterns constant for Nominal Coupons, TIPS, and FRNs as of
02/04/2015, while using an average of ~1.45 trillion of Bills outstanding consistent with Treasury’s guidance of the FRN program replacing some Bills issuance.
• The principal on the TIPS securities was accreted to each projection date based on market ZCIS levels as of 12/31/2014.
• No attempt was made to match future financing needs.

14
Sources of Financing in Fiscal Year 2015 Q1
*Assumes an end-of-December 2014 cash balance of $224 billion versus a beginning-of-October 2014 cash balance of $158 billion. By keeping the cash balance constant, Treasury arrives at the net implied funding number.
Net Bill Issuance 47 Issuance Gross Maturing Net Gross Maturing Net
Net Coupon Issuance 180 Bills 4-Week 489 464 25 489 464 25
Subtotal: Net Marketable Borrowing 227 Bills 13-Week 312 345 (33) 312 345 (33)
Bills 26-Week 351 299 52 351 299 52
Ending Cash Balance 224 Bills 52-Week 75 72 3 75 72 3
Beginning Cash Balance 158 Bills CMBs 0 0 0 0 0 0
Subtotal: Change in Cash Balance 66 Bill Subtotal 1,227 1,180 47 1,227 1,180 47
Net Implied Funding for FY 2015 Q1* 161
Issue Gross Maturing Net Gross Maturing Net
2-Year 84 105 (21) 84 105 (21)
2-Year FRN 41 0 41 41 0 41
3-Year 78 100 (22) 78 100 (22)
5-Year 105 129 (24) 105 129 (24)
7-Year 87 0 87 87 0 87
10-Year 66 25 41 66 25 41
30-Year 42 0 42 42 0 42
5-Year TIPS 16 0 16 16 0 16
10-Year TIPS 13 0 13 13 0 13
30-Year TIPS 7 0 7 7 0 7
Coupon Subtotal 539 359 180 539 359 180
Total 1,766 1,539 227 1,766 1,539 227
October - December 2014 October - December 2014 Fiscal Year to DateBill Issuance
October - December 2014 Fiscal Year to Date
Coupon Issuance

15
Sources of Financing in Fiscal Year 2015 Q2
*Keeping announced issuance sizes and patterns constant for Nominal Coupons, TIPS, and FRNs as of 02/04/2015, while using an average of ~1.45 trillion of Bills Outstanding consistent with Treasury’s guidance of the FRN program replacing some Bills issuance. **Assumes an end-of-March 2015 cash balance of $100 billion versus a beginning-of-January 2015 cash balance of $224 billion. Financing Estimates released by the Treasury can be found here: http://www.treasury.gov/resource-center/data-chart-center/quarterly-refunding/Pages/Latest.aspx
Assuming Constant Coupon and Average Bill Issuance Sizes as of 2/4/2015* Issuance Gross Maturing Net Gross Maturing Net
Net Bill Issuance 32 Bills 4-Week 416 458 (42) 905 922 (17)
Net Coupon Issuance 121 Bills 13-Week 364 312 52 676 657 19
Subtotal: Net Marketable Borrowing 153 Bills 26-Week 325 309 16 676 608 68
Bills 52-Week 72 66 6 147 138 9
Treasury Announced Estimate: Net Marketable Borrowing** 155 Bills CMBs 0 0 0 0 0 0
Implied: Increase in FY 2015 Q2 Net Issuances 2 Bill Subtotal 1,177 1,145 32 2,404 2,325 79
Issue Gross Maturing Net Gross Maturing Net
2-Year 78 105 (27) 162 210 (48)
2-Year FRN 41 0 41 82 0 82
3-Year 72 104 (32) 150 204 (54)
5-Year 105 129 (24) 210 258 (48)
7-Year 87 0 87 174 0 174
10-Year 66 34 32 132 60 72
30-Year 42 11 31 84 11 74
5-Year TIPS 0 0 0 16 0 16
10-Year TIPS 28 24 4 41 24 17
30-Year TIPS 9 0 9 16 0 16
Coupon Subtotal 528 407 121 1,067 765 302
Total 1,705 1,552 153 3,471 3,090 381
January - March 2015 January - March 2015 Fiscal Year to DateBill Issuance
January - March 2015 Fiscal Year to DateCoupon Issuance
726 602 596 610 644 676 714 736 746 747 794
55%
60%
65%
70%
75%
80%
(400)
(200)
0
200
400
600
800
1,000
2015
2016
2017
2018
2019
2020
2021
2022
2023
2024
2025
$bn
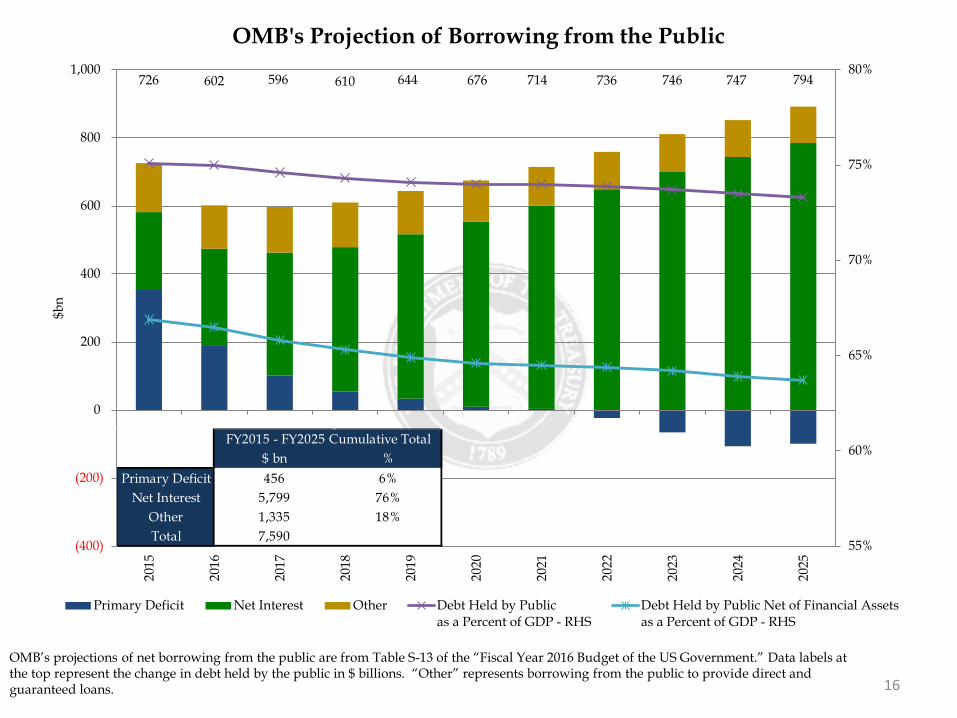
OMB's Projection of Borrowing from the Public
Primary Deficit Net Interest Other Debt Held by Publicas a Percent of GDP - RHS
Debt Held by Public Net of Financial Assetsas a Percent of GDP - RHS
16
OMB’s projections of net borrowing from the public are from Table S-13 of the “Fiscal Year 2016 Budget of the US Government.” Data labels at the top represent the change in debt held by the public in $ billions. “Other” represents borrowing from the public to provide direct and guaranteed loans.
$ bn %Primary Deficit 456 6%
Net Interest 5,799 76%Other 1,335 18%Total 7,590
FY2015 - FY2025 Cumulative Total
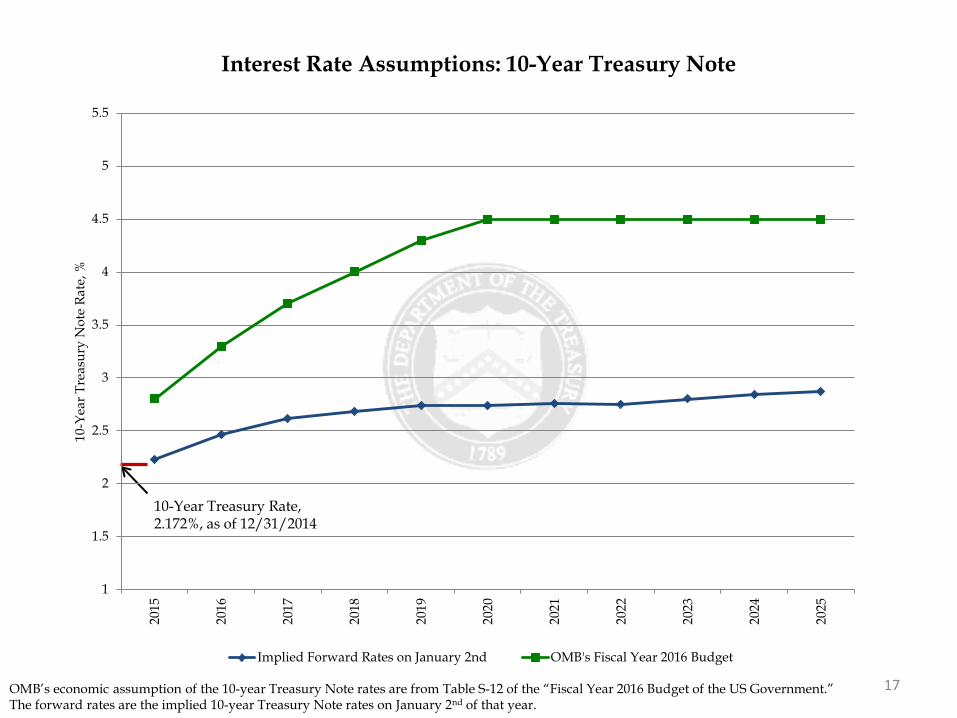
17 OMB’s economic assumption of the 10-year Treasury Note rates are from Table S-12 of the “Fiscal Year 2016 Budget of the US Government.” The forward rates are the implied 10-year Treasury Note rates on January 2nd of that year.
10-Year Treasury Rate, 2.172%, as of 12/31/2014
1
1.5
2
2.5
3
3.5
4
4.5
5
5.5
2015
2016
2017
2018
2019
2020
2021
2022
2023
2024
2025
10-Y
ear T
reas
ury
Not
e Ra
te, %
Interest Rate Assumptions: 10-Year Treasury Note
Implied Forward Rates on January 2nd OMB's Fiscal Year 2016 Budget

18 Treasury’s primary dealer survey estimates can be found on page 9. OMB’s estimates of borrowing from the public are from Table S-13 of the “Fiscal Year 2016 Budget of the US Government.” CBO’s estimates of the borrowing from the public are from Summary Table 1 of the “CBO: The Budget and Economic Outlook 2015 to 2025.” See table at the end of this section for details.
0
200
400
600
800
1,000
1,200
2015
2016
2017
2018
2019
2020
2021
2022
2023
2024
2025
$bn
Fiscal Year
Projected Net Borrowing Assuming Constant Future Issuance
Projected Net Borrowing CBO: The Budget and Economic Outlook 2015 to 2025
OMB's Fiscal Year 2016 Budget PD Survey Marketable Borrowing Estimates

19
Impact of SOMA Actions on Projected Net Borrowing Assuming Future Issuance Remains Constant
Treasury’s primary dealer survey estimates can be found on page 9. OMB’s estimates of borrowing from the public are from Table S-13 of the “Fiscal Year 2016 Budget of the US Government.” CBO’s estimates of the borrowing from the public are from Summary Table 1 of the “CBO: The Budget and Economic Outlook 2015 to 2025.” See table at the end of this section for details.
0
200
400
600
800
1,000
1,200
2015
2016
2017
2018
2019
2020
2021
2022
2023
2024
2025
Fiscal Year
With Fed Reinvestments ($bn)
Projected Net Borrowing
CBO: The Budget and Economic Outlook 2015 to 2025
0
200
400
600
800
1,000
1,200
2015
2016
2017
2018
2019
2020
2021
2022
2023
2024
2025
Fiscal Year
Without Fed Reinvestments ($bn)
OMB's Fiscal Year 2016 Budget
PD Survey Marketable Borrowing Estimates
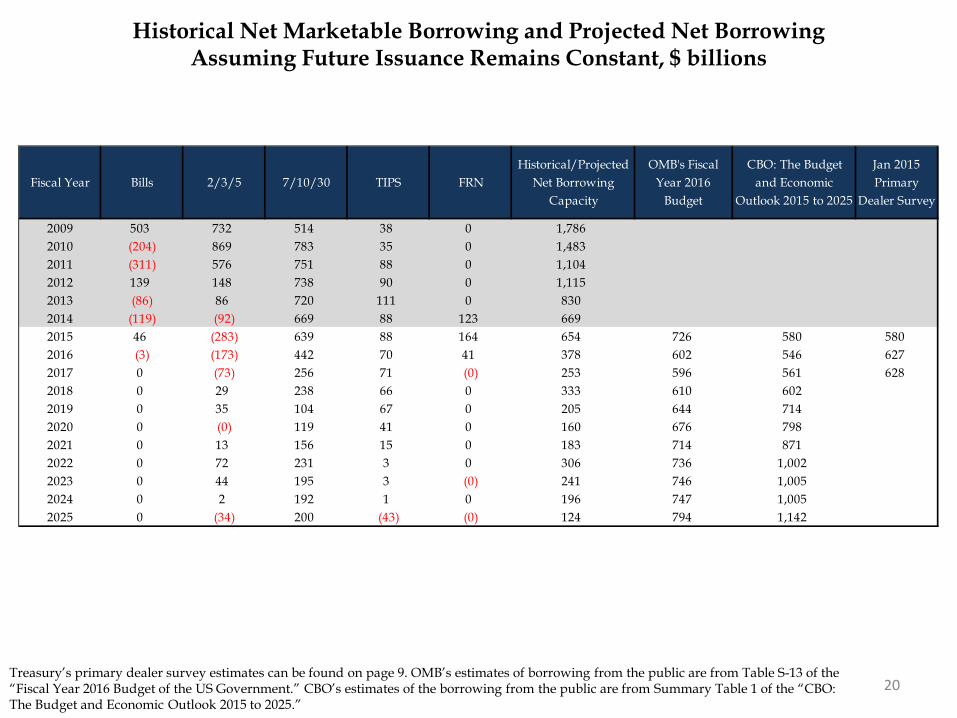
20
Historical Net Marketable Borrowing and Projected Net Borrowing Assuming Future Issuance Remains Constant, $ billions
Treasury’s primary dealer survey estimates can be found on page 9. OMB’s estimates of borrowing from the public are from Table S-13 of the “Fiscal Year 2016 Budget of the US Government.” CBO’s estimates of the borrowing from the public are from Summary Table 1 of the “CBO: The Budget and Economic Outlook 2015 to 2025.”
Fiscal Year Bills 2/3/5 7/10/30 TIPS FRNHistorical/Projected
Net Borrowing Capacity
OMB's Fiscal Year 2016
Budget
CBO: The Budget and Economic
Outlook 2015 to 2025
Jan 2015 Primary
Dealer Survey
2009 503 732 514 38 0 1,7862010 (204) 869 783 35 0 1,4832011 (311) 576 751 88 0 1,1042012 139 148 738 90 0 1,1152013 (86) 86 720 111 0 8302014 (119) (92) 669 88 123 6692015 46 (283) 639 88 164 654 726 580 5802016 (3) (173) 442 70 41 378 602 546 6272017 0 (73) 256 71 (0) 253 596 561 6282018 0 29 238 66 0 333 610 6022019 0 35 104 67 0 205 644 7142020 0 (0) 119 41 0 160 676 7982021 0 13 156 15 0 183 714 8712022 0 72 231 3 0 306 736 1,0022023 0 44 195 3 (0) 241 746 1,0052024 0 2 192 1 0 196 747 1,0052025 0 (34) 200 (43) (0) 124 794 1,142

Section III: Portfolio Metrics
21

22
Assumptions for Portfolio Metrics Section (pages 22 to 27) and Appendix
• Portfolio and SOMA holdings as of 12/31/2014. • SOMA redemptions until and including June 2021. These assumptions are based on Chairman
Bernanke’s June 2013 press conference. • To match OMB’s projected borrowing from the public for the next 10 years, Nominal Coupon securities
(2-, 3-, 5-, 7-, 10-, and 30-year) were adjusted by the same percentage. • The principal on the TIPS securities was accreted to each projection date based on market ZCIS levels
as of 12/31/2014. • OMB’s estimates of borrowing from the public are from Table S-13 of the “Fiscal Year 2016 Budget of
the US Government.”

40
45
50
55
60
65
70
75
80
85
9019
80
1982
1984
1986
1988
1990
1992
1994
1996
1998
2000
2002
2004
2006
2008
2010
2012
2014
2016
2018
2020
2022
2024
Wei
ghte
d A
vera
ge M
atur
ity (M
onth
s)
Calendar Year
Weighted Average Maturity of Marketable Debt Outstanding
Historical Adjust Nominal Coupons to Match Financing Needs
Historical Average from 1980 to end of FY 15 Q1
23 This scenario does not represent any particular course of action that Treasury is expected to follow. Instead, it is intended to demonstrate the basic trajectory of average maturity absent changes to the mix of securities issued by Treasury.
68.3 months on 12/31/2014
58.9 months (Historical Average from 1980 to Present)
24 This scenario does not represent any particular course of action that Treasury is expected to follow. Instead, it is intended to demonstrate the basic trajectory of average maturity absent changes to the mix of securities issued by Treasury.
0
500
1,000
1,500
2,000
2,500
3,000
3,500
4,000
2015
2016
2017
2018
2019
2020
2021
2022
2023
2024
2025
$bn
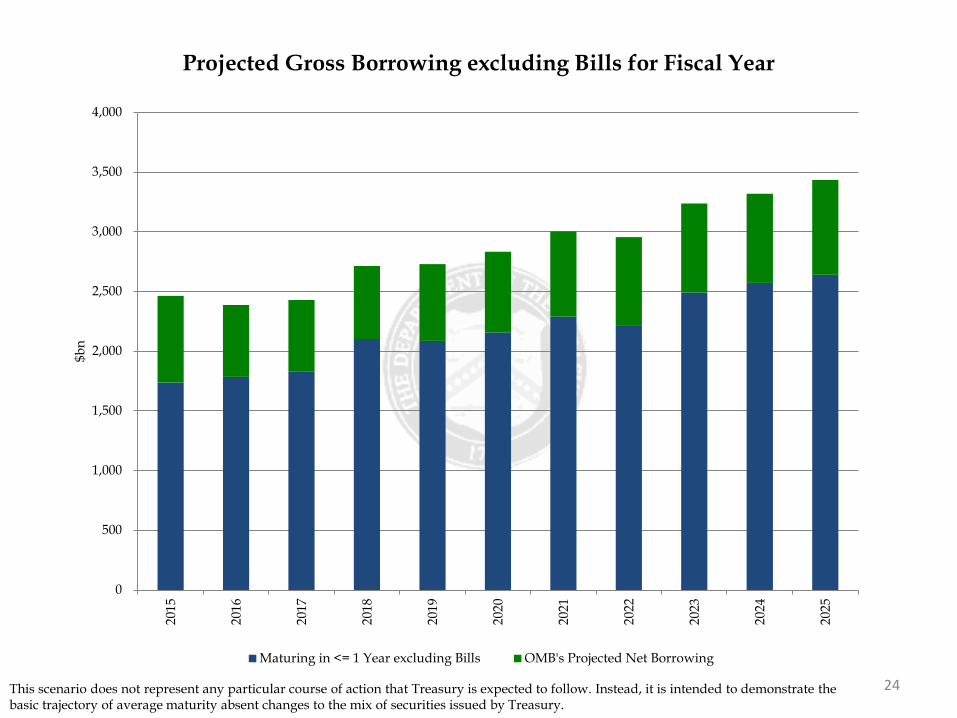
Projected Gross Borrowing excluding Bills for Fiscal Year
Maturing in <= 1 Year excluding Bills OMB's Projected Net Borrowing

25 This scenario does not represent any particular course of action that Treasury is expected to follow. Instead, it is intended to demonstrate the basic trajectory of average maturity absent changes to the mix of securities issued by Treasury. See table on following page for details.
0
5
10
15
20
25
2015
2016
2017
2018
2019
2020
2021
2022
2023
2024
2025
$ tr
Projected Maturity Profile from end of Fiscal Year
<= 1yr (1,2] (2,3] (3,5] (5,7] (7,10] > 10yr
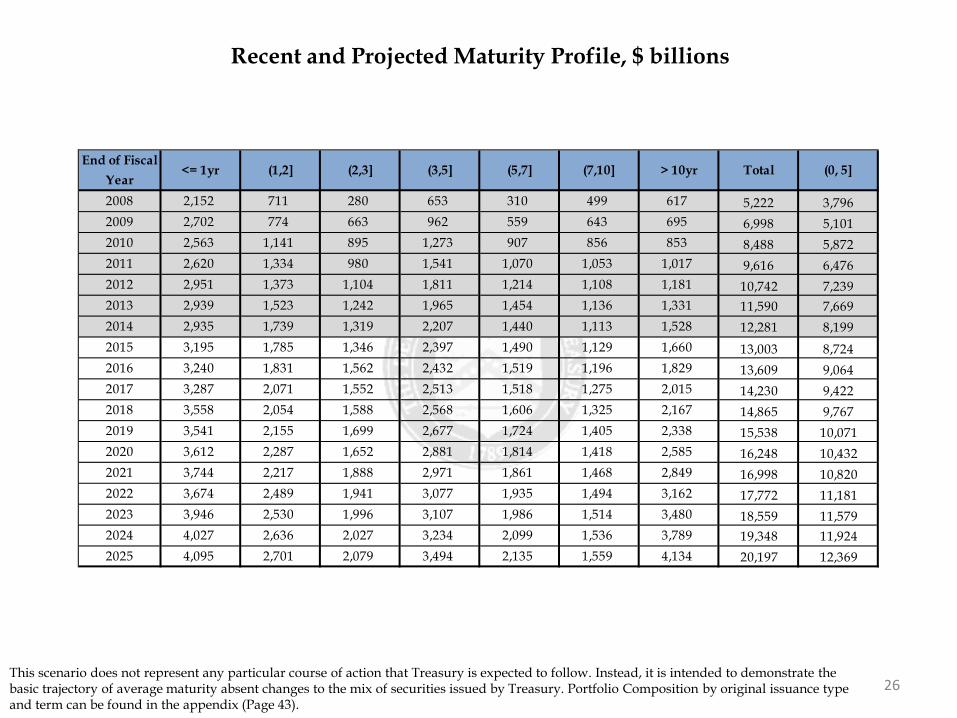
26 This scenario does not represent any particular course of action that Treasury is expected to follow. Instead, it is intended to demonstrate the basic trajectory of average maturity absent changes to the mix of securities issued by Treasury. Portfolio Composition by original issuance type and term can be found in the appendix (Page 43).
Recent and Projected Maturity Profile, $ billions
End of Fiscal Year
<= 1yr (1,2] (2,3] (3,5] (5,7] (7,10] > 10yr Total (0, 5]
2008 2,152 711 280 653 310 499 617 5,222 3,7962009 2,702 774 663 962 559 643 695 6,998 5,1012010 2,563 1,141 895 1,273 907 856 853 8,488 5,8722011 2,620 1,334 980 1,541 1,070 1,053 1,017 9,616 6,4762012 2,951 1,373 1,104 1,811 1,214 1,108 1,181 10,742 7,2392013 2,939 1,523 1,242 1,965 1,454 1,136 1,331 11,590 7,6692014 2,935 1,739 1,319 2,207 1,440 1,113 1,528 12,281 8,1992015 3,195 1,785 1,346 2,397 1,490 1,129 1,660 13,003 8,7242016 3,240 1,831 1,562 2,432 1,519 1,196 1,829 13,609 9,0642017 3,287 2,071 1,552 2,513 1,518 1,275 2,015 14,230 9,4222018 3,558 2,054 1,588 2,568 1,606 1,325 2,167 14,865 9,7672019 3,541 2,155 1,699 2,677 1,724 1,405 2,338 15,538 10,0712020 3,612 2,287 1,652 2,881 1,814 1,418 2,585 16,248 10,4322021 3,744 2,217 1,888 2,971 1,861 1,468 2,849 16,998 10,8202022 3,674 2,489 1,941 3,077 1,935 1,494 3,162 17,772 11,1812023 3,946 2,530 1,996 3,107 1,986 1,514 3,480 18,559 11,5792024 4,027 2,636 2,027 3,234 2,099 1,536 3,789 19,348 11,9242025 4,095 2,701 2,079 3,494 2,135 1,559 4,134 20,197 12,369

27 This scenario does not represent any particular course of action that Treasury is expected to follow. Instead, it is intended to demonstrate the basic trajectory of average maturity absent changes to the mix of securities issued by Treasury. See table on following page for details
0%
10%
20%
30%
40%
50%
60%
70%
80%
90%
100%
2015
2016
2017
2018
2019
2020
2021
2022
2023
2024
2025
Projected Maturity Profile from end of Fiscal Year
<= 1yr (1,2] (2,3] (3,5] (5,7] (7,10] > 10yr
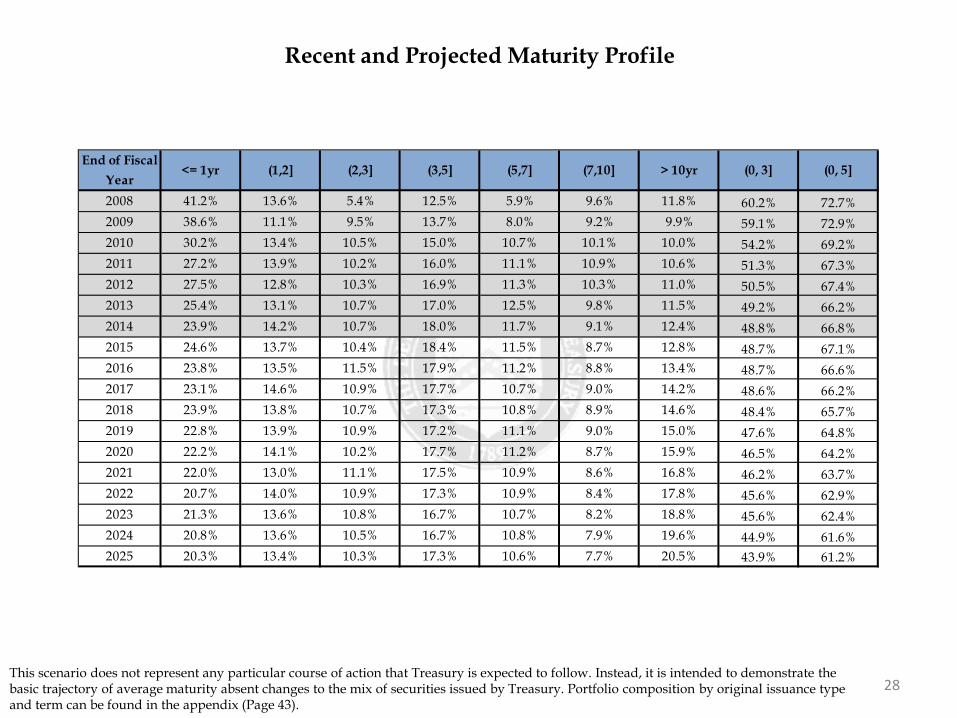
28
Recent and Projected Maturity Profile
This scenario does not represent any particular course of action that Treasury is expected to follow. Instead, it is intended to demonstrate the basic trajectory of average maturity absent changes to the mix of securities issued by Treasury. Portfolio composition by original issuance type and term can be found in the appendix (Page 43).
End of Fiscal Year
<= 1yr (1,2] (2,3] (3,5] (5,7] (7,10] > 10yr (0, 3] (0, 5]
2008 41.2% 13.6% 5.4% 12.5% 5.9% 9.6% 11.8% 60.2% 72.7%2009 38.6% 11.1% 9.5% 13.7% 8.0% 9.2% 9.9% 59.1% 72.9%2010 30.2% 13.4% 10.5% 15.0% 10.7% 10.1% 10.0% 54.2% 69.2%2011 27.2% 13.9% 10.2% 16.0% 11.1% 10.9% 10.6% 51.3% 67.3%2012 27.5% 12.8% 10.3% 16.9% 11.3% 10.3% 11.0% 50.5% 67.4%2013 25.4% 13.1% 10.7% 17.0% 12.5% 9.8% 11.5% 49.2% 66.2%2014 23.9% 14.2% 10.7% 18.0% 11.7% 9.1% 12.4% 48.8% 66.8%2015 24.6% 13.7% 10.4% 18.4% 11.5% 8.7% 12.8% 48.7% 67.1%2016 23.8% 13.5% 11.5% 17.9% 11.2% 8.8% 13.4% 48.7% 66.6%2017 23.1% 14.6% 10.9% 17.7% 10.7% 9.0% 14.2% 48.6% 66.2%2018 23.9% 13.8% 10.7% 17.3% 10.8% 8.9% 14.6% 48.4% 65.7%2019 22.8% 13.9% 10.9% 17.2% 11.1% 9.0% 15.0% 47.6% 64.8%2020 22.2% 14.1% 10.2% 17.7% 11.2% 8.7% 15.9% 46.5% 64.2%2021 22.0% 13.0% 11.1% 17.5% 10.9% 8.6% 16.8% 46.2% 63.7%2022 20.7% 14.0% 10.9% 17.3% 10.9% 8.4% 17.8% 45.6% 62.9%2023 21.3% 13.6% 10.8% 16.7% 10.7% 8.2% 18.8% 45.6% 62.4%2024 20.8% 13.6% 10.5% 16.7% 10.8% 7.9% 19.6% 44.9% 61.6%2025 20.3% 13.4% 10.3% 17.3% 10.6% 7.7% 20.5% 43.9% 61.2%

Section IV: Demand
29

30 *Weighted averages of Competitive Awards. **Approximated using prices at settlement and includes both Competitive and Non-Competitive Awards. For TIPS’ 10-year equivalent, a constant auction BEI is used as the inflation assumption.
Summary Statistics for Fiscal Year 2015 Q1 Auctions
Security Type Term Stop Out Rate
(%)*
Bid-to-Cover Ratio*
Competitive Awards ($ bn)
% Primary Dealer*
% Direct*
% Indirect*
Non-Competitive
Awards ($ bn)
SOMA Add Ons
($ bn)
10-Yr Equivalent
($ bn)**Bill 4-Week 0.029 3.8 483.3 73.0% 4.4% 22.7% 3.2 0.0 4.6Bill 13-Week 0.026 4.5 303.4 69.1% 6.1% 24.8% 5.1 0.0 9.2Bill 26-Week 0.076 4.0 339.9 58.1% 5.9% 36.0% 4.3 0.0 13.9Bill 52-Week 0.150 3.6 74.3 71.2% 4.7% 24.1% 0.4 0.0 6.8Bill CMBs 0.000 0.0 0.0 0.0% 0.0% 0.0% 0.0 0.0 0.0
Coupon 2-Year 0.553 3.3 83.2 48.3% 15.7% 36.1% 0.5 0.0 17.4Coupon 3-Year 1.018 3.3 77.5 47.3% 14.3% 38.4% 0.2 0.0 24.5Coupon 5-Year 1.634 2.6 104.9 33.6% 9.2% 57.2% 0.1 0.0 55.3Coupon 7-Year 2.034 2.5 87.0 37.6% 11.4% 51.1% 0.0 0.0 62.8Coupon 10-Year 2.322 2.7 65.9 43.3% 9.2% 47.5% 0.1 0.0 66.2Coupon 30-Year 3.011 2.5 42.0 34.2% 19.4% 46.4% 0.0 0.0 93.9
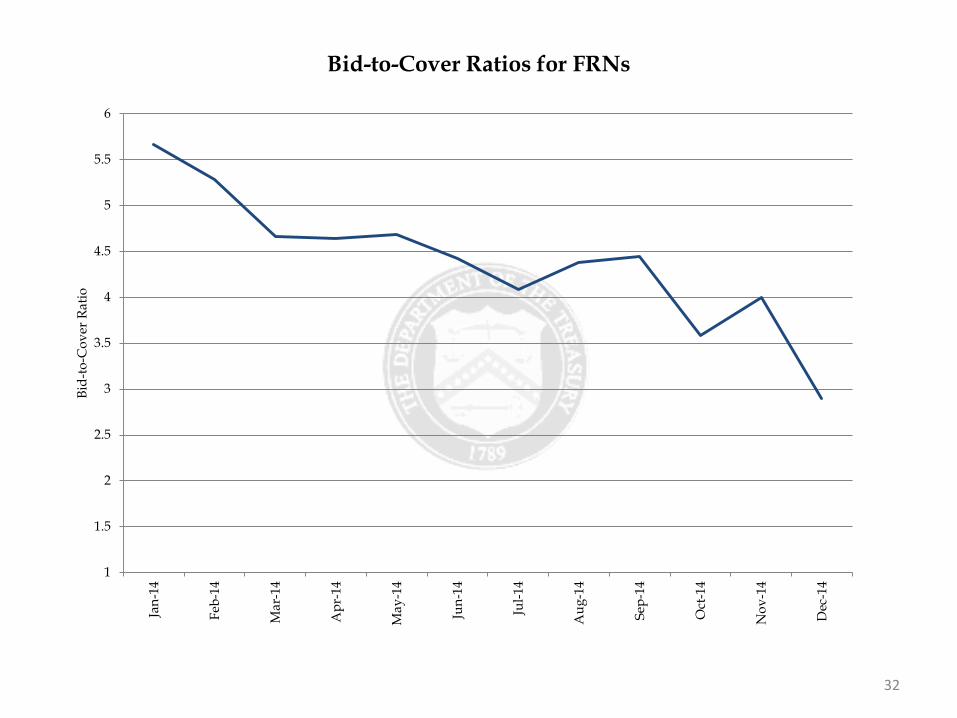
TIPS 5-Year 0.395 2.4 16.0 30.0% 5.2% 64.8% 0.0 0.0 7.8TIPS 10-Year 0.497 2.6 13.0 29.5% 8.1% 62.4% 0.0 0.0 14.0TIPS 30-Year 0.985 2.3 7.0 31.0% 4.5% 64.5% 0.0 0.0 19.7FRN 2-Year FRN 0.076 3.5 41.0 54.1% 4.6% 41.3% 0.0 0.0 0.4
Total Bills 0.049 4.0 1,201.0 67.7% 5.3% 27.1% 13.0 0.0 34.4
Total Coupons 1.634 2.8 460.4 40.7% 12.6% 46.7% 1.0 0.1 320.2
Total TIPS 0.546 2.4 35.9 30.0% 6.1% 63.9% 0.1 0.0 41.5
Total FRN 0.076 3.5 41.0 54.1% 4.6% 41.3% 0.0 0.0 0.4

31
1
1.5
2
2.5
3
3.5
4
4.5
5
5.5
6D
ec-0
4
Dec
-05
Dec
-06
Dec
-07
Dec
-08
Dec
-09
Dec
-10
Dec
-11
Dec
-12
Dec
-13
Dec
-14
Bid-
to-C
over
Rat
io
Bid-to-Cover Ratios for Treasury Bills
4-Week (13-week moving average) 13-Week (13-week moving average)
26-Week (13-week moving average) 52-Week (6-month moving average)
32
1
1.5
2
2.5
3
3.5
4
4.5
5
5.5
6
Jan-
14
Feb-
14
Mar
-14
Apr
-14
May
-14
Jun-
14
Jul-1
4
Aug
-14
Sep-
14
Oct
-14
Nov
-14
Dec
-14
Bid-
to-C
over
Rat
io
Bid-to-Cover Ratios for FRNs
33
1
1.5
2
2.5
3
3.5
4
4.5
Dec
-09
Mar
-10
Jun-
10
Sep-
10
Dec
-10
Mar
-11
Jun-
11
Sep-
11
Dec
-11
Mar
-12
Jun-
12
Sep-
12
Dec
-12
Mar
-13
Jun-
13
Sep-
13
Dec
-13
Mar
-14
Jun-
14
Sep-
14
Dec
-14
Bid-
to-C
over
Rat
io
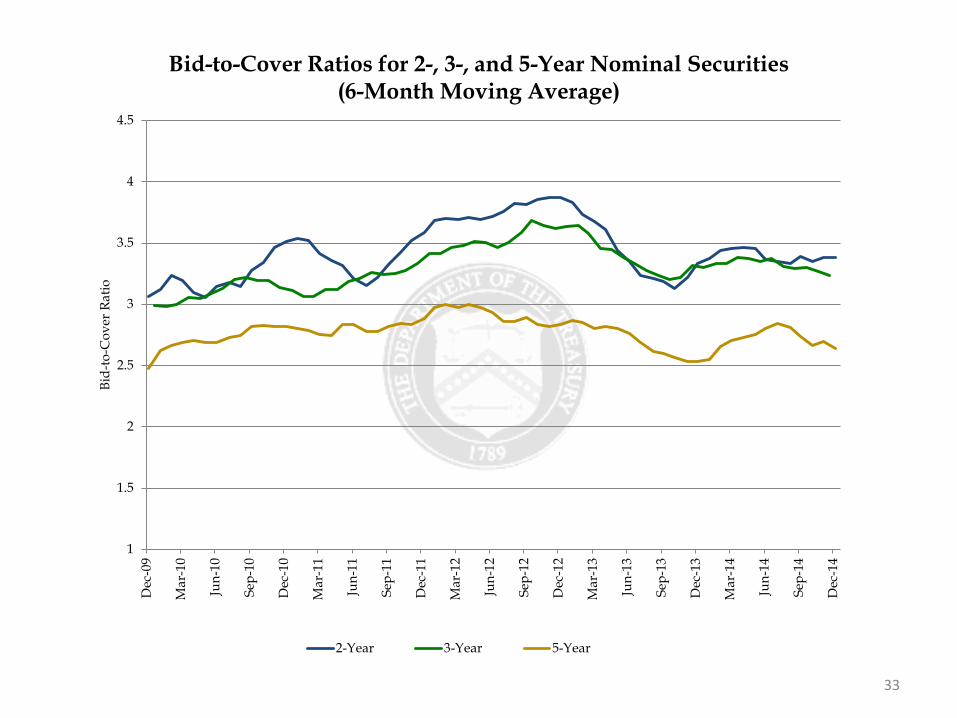
Bid-to-Cover Ratios for 2-, 3-, and 5-Year Nominal Securities (6-Month Moving Average)
2-Year 3-Year 5-Year
34
1
1.5
2
2.5
3
3.5
Dec
-09
Mar
-10
Jun-
10
Sep-
10
Dec
-10
Mar
-11
Jun-
11
Sep-
11
Dec
-11
Mar
-12
Jun-
12
Sep-
12
Dec
-12
Mar
-13
Jun-
13
Sep-
13
Dec
-13
Mar
-14
Jun-
14
Sep-
14
Dec
-14
Bid-
to-C
over
Rat
io
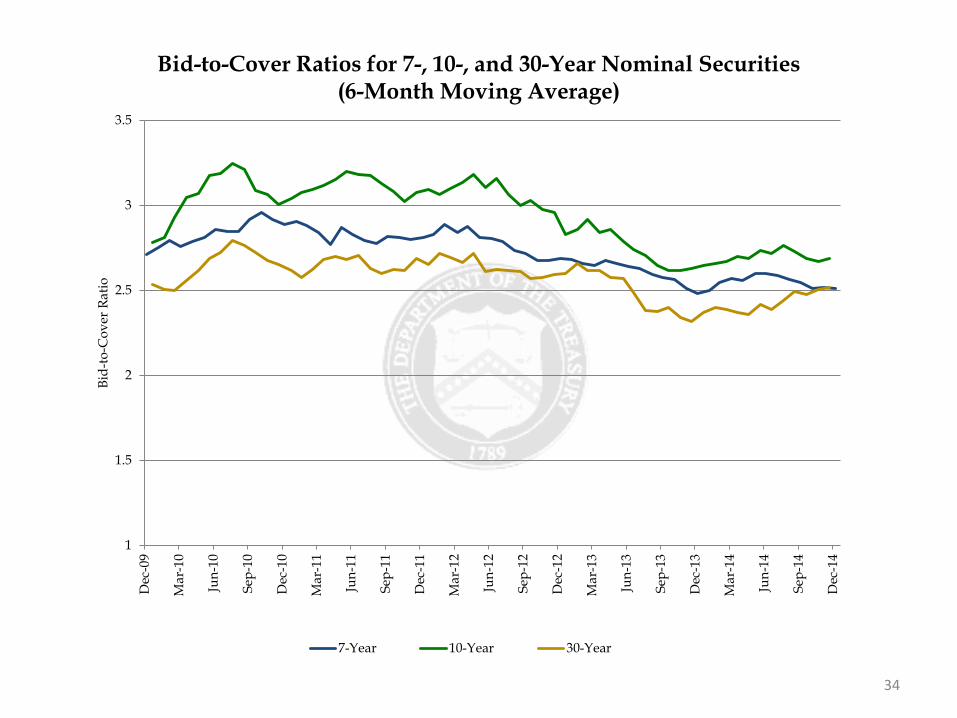
Bid-to-Cover Ratios for 7-, 10-, and 30-Year Nominal Securities (6-Month Moving Average)
7-Year 10-Year 30-Year

35
1
1.5
2
2.5
3
3.5
Sep-
00
Sep-
01
Sep-
02
Sep-
03
Sep-
04
Sep-
05
Sep-
06
Sep-
07
Sep-
08
Sep-
09
Sep-
10
Sep-
11
Sep-
12
Sep-
13
Sep-
14
Bid-
to-C
over
Rat
io
Bid-to-Cover Ratios for TIPS
5-Year 10-Year (6-month moving average) 20-Year 30-Year
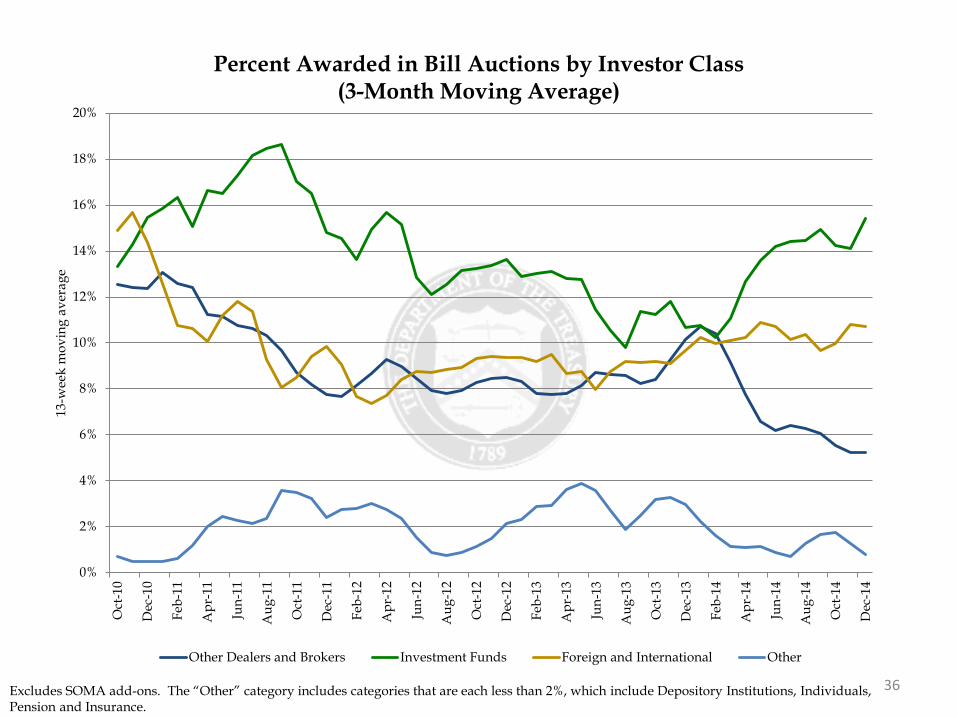
36 Excludes SOMA add-ons. The “Other” category includes categories that are each less than 2%, which include Depository Institutions, Individuals, Pension and Insurance.
0%
2%
4%
6%
8%
10%
12%
14%
16%
18%
20%O
ct-1
0
Dec
-10
Feb-
11
Apr
-11
Jun-
11
Aug
-11
Oct
-11
Dec
-11
Feb-
12
Apr
-12
Jun-
12
Aug
-12
Oct
-12
Dec
-12
Feb-
13
Apr
-13
Jun-
13
Aug
-13
Oct
-13
Dec
-13
Feb-
14
Apr
-14
Jun-
14
Aug
-14
Oct
-14
Dec
-14
13-w
eek
mov
ing
aver
age
Percent Awarded in Bill Auctions by Investor Class (3-Month Moving Average)
Other Dealers and Brokers Investment Funds Foreign and International Other

37 Excludes SOMA add-ons. The “Other” category includes categories that are each less than 2%, which include Depository Institutions, Individuals, Pension and Insurance.
0%
5%
10%
15%
20%
25%
30%
35%Ja
n-11
Mar
-11
May
-11
Jul-1
1
Sep-
11
Nov
-11
Jan-
12
Mar
-12
May
-12
Jul-1
2
Sep-
12
Nov
-12
Jan-
13
Mar
-13
May
-13
Jul-1
3
Sep-
13
Nov
-13
Jan-
14
Mar
-14
May
-14
Jul-1
4
Sep-
14
Nov
-14
6-m
onth
mov
ing
aver
age
Percent Awarded in 2-, 3-, 5-Year Nominal Security Auctions by Investor Class (6-Month Moving Average)
Other Dealers and Brokers Investment Funds Foreign and International Other

38 Excludes SOMA add-ons. The “Other” category includes categories that are each less than 2%, which include Depository Institutions, Individuals, Pension and Insurance.
0%
5%
10%
15%
20%
25%
30%
35%
40%
45%Ja
n-11
Mar
-11
May
-11
Jul-1
1
Sep-
11
Nov
-11
Jan-
12
Mar
-12
May
-12
Jul-1
2
Sep-
12
Nov
-12
Jan-
13
Mar
-13
May
-13
Jul-1
3
Sep-
13
Nov
-13
Jan-
14
Mar
-14
May
-14
Jul-1
4
Sep-
14
Nov
-14
6-m
onth
mov
ing
aver
age
Percent Awarded in 7-, 10-, 30-Year Nominal Security Auctions by Investor Class (6-Month Moving Average)
Other Dealers and Brokers Investment Funds Foreign and International Other

39 Excludes SOMA add-ons. The “Other” category includes categories that are each less than 2%, which include Depository Institutions, Individuals, Pension and Insurance.
0%
10%
20%
30%
40%
50%
60%Ja
n-11
Mar
-11
May
-11
Jul-1
1
Sep-
11
Nov
-11
Jan-
12
Mar
-12
May
-12
Jul-1
2
Sep-
12
Nov
-12
Jan-
13
Mar
-13
May
-13
Jul-1
3
Sep-
13
Nov
-13
Jan-
14
Mar
-14
May
-14
Jul-1
4
Sep-
14
Nov
-14
6-m
onth
mov
ing
aver
age
Percent Awarded in TIPS Auctions by Investor Class (6-Month Moving Average)
Other Dealers and Brokers Investment Funds Foreign and International Other

40 Excludes SOMA add-ons.
30%
35%
40%
45%
50%
55%
60%
65%
70%
75%
Jun-
09
Sep-
09
Dec
-09
Mar
-10
Jun-
10
Sep-
10
Dec
-10
Mar
-11
Jun-
11
Sep-
11
Dec
-11
Mar
-12
Jun-
12
Sep-
12
Dec
-12
Mar
-13
Jun-
13
Sep-
13
Dec
-13
Mar
-14
Jun-
14
Sep-
14
Dec
-14
% o
f Tot
al C
ompe
titiv
e A
mou
nt A
war
ded
Primary Dealer Awards at Auction
4/13/26-Week (13-week moving average) 52-Week (6-month moving average)
2/3/5 (6-month moving average) 7/10/30 (6-month moving average)
TIPS (6-month moving average)

41 Excludes SOMA add-ons.
0%
5%
10%
15%
20%
25%
Jun-
09
Sep-
09
Dec
-09
Mar
-10
Jun-
10
Sep-
10
Dec
-10
Mar
-11
Jun-
11
Sep-
11
Dec
-11
Mar
-12
Jun-
12
Sep-
12
Dec
-12
Mar
-13
Jun-
13
Sep-
13
Dec
-13
Mar
-14
Jun-
14
Sep-
14
Dec
-14
% o
f Tot
al C
ompe
titiv
e A
mou
nt A
war
ded
Direct Bidder Awards at Auction
4/13/26-Week (13-week moving average) 52-Week (6-month moving average)
2/3/5 (6-month moving average) 7/10/30 (6-month moving average)
TIPS (6-month moving average)

42 Foreign includes both private sector and official institutions.
0
20
40
60
80
100
120
140
160
180
Sep-
09
Nov
-09
Jan-
10
Mar
-10
May
-10
Jul-1
0
Sep-
10
Nov
-10
Jan-
11
Mar
-11
May
-11
Jul-1
1
Sep-
11
Nov
-11
Jan-
12
Mar
-12
May
-12
Jul-1
2
Sep-
12
Nov
-12
Jan-
13
Mar
-13
May
-13
Jul-1
3
Sep-
13
Nov
-13
Jan-
14
Mar
-14
May
-14
Jul-1
4
Sep-
14
Nov
-14
$bn
Total Foreign Awards of Treasuries at Auction, $ Billion
Bills 2/3/5 7/10/30 TIPS FRN

Appendix
43

44 This scenario does not represent any particular course of action that Treasury is expected to follow. Instead, it is intended to demonstrate the basic trajectory of average maturity absent changes to the mix of securities issued by Treasury. See table on following page for details
0%
10%
20%
30%
40%
50%
60%
70%
80%
90%
100%
2016
2017
2018
2019
2020
2021
2022
2023
2024
2025
Projected Portfolio Composition by Issuance Type, Percent
Bills 2/3/5 7/10/30 TIPS (principal accreted to projection date) FRN
45
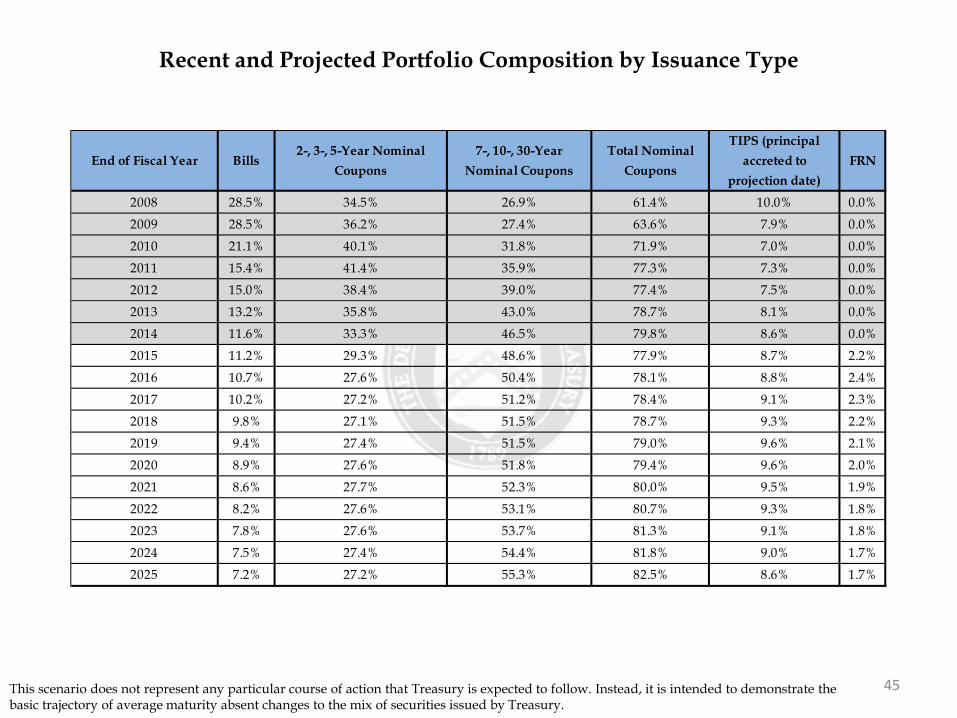
Recent and Projected Portfolio Composition by Issuance Type
This scenario does not represent any particular course of action that Treasury is expected to follow. Instead, it is intended to demonstrate the basic trajectory of average maturity absent changes to the mix of securities issued by Treasury.
End of Fiscal Year Bills2-, 3-, 5-Year Nominal
Coupons7-, 10-, 30-Year
Nominal CouponsTotal Nominal
Coupons
TIPS (principal accreted to
projection date)FRN
2008 28.5% 34.5% 26.9% 61.4% 10.0% 0.0%
2009 28.5% 36.2% 27.4% 63.6% 7.9% 0.0%
2010 21.1% 40.1% 31.8% 71.9% 7.0% 0.0%
2011 15.4% 41.4% 35.9% 77.3% 7.3% 0.0%
2012 15.0% 38.4% 39.0% 77.4% 7.5% 0.0%
2013 13.2% 35.8% 43.0% 78.7% 8.1% 0.0%
2014 11.6% 33.3% 46.5% 79.8% 8.6% 0.0%
2015 11.2% 29.3% 48.6% 77.9% 8.7% 2.2%
2016 10.7% 27.6% 50.4% 78.1% 8.8% 2.4%
2017 10.2% 27.2% 51.2% 78.4% 9.1% 2.3%
2018 9.8% 27.1% 51.5% 78.7% 9.3% 2.2%
2019 9.4% 27.4% 51.5% 79.0% 9.6% 2.1%
2020 8.9% 27.6% 51.8% 79.4% 9.6% 2.0%
2021 8.6% 27.7% 52.3% 80.0% 9.5% 1.9%
2022 8.2% 27.6% 53.1% 80.7% 9.3% 1.8%
2023 7.8% 27.6% 53.7% 81.3% 9.1% 1.8%
2024 7.5% 27.4% 54.4% 81.8% 9.0% 1.7%
2025 7.2% 27.2% 55.3% 82.5% 8.6% 1.7%
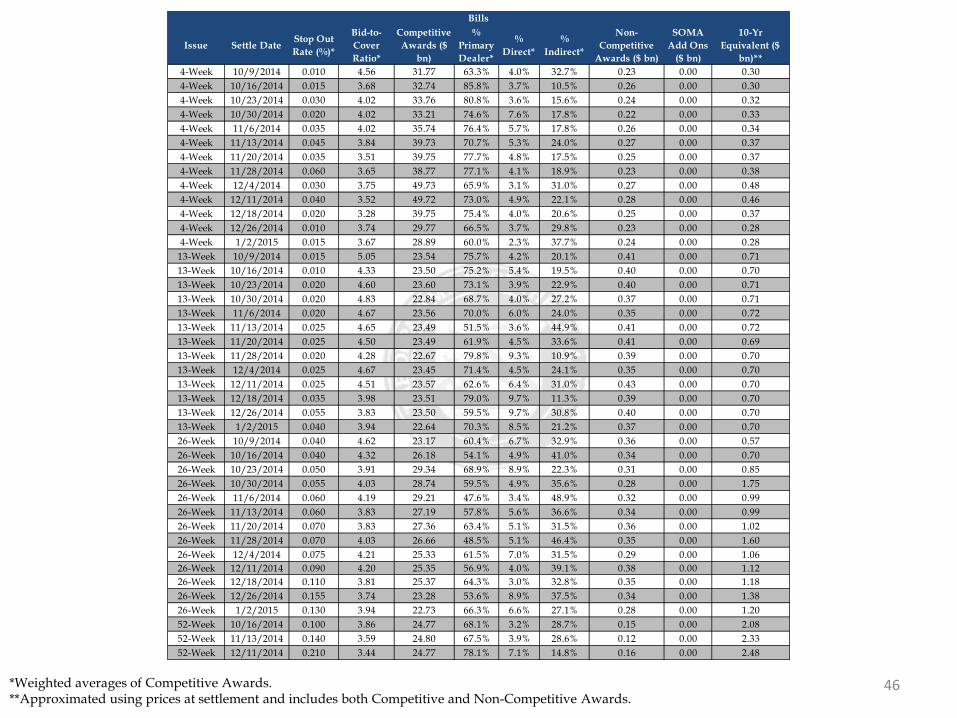
46 *Weighted averages of Competitive Awards. **Approximated using prices at settlement and includes both Competitive and Non-Competitive Awards.
Issue Settle Date Stop Out Rate (%)*
Bid-to-Cover Ratio*
Competitive Awards ($
bn)
% Primary Dealer*
% Direct*
% Indirect*
Non-Competitive
Awards ($ bn)
SOMA Add Ons
($ bn)
10-Yr Equivalent ($
bn)**4-Week 10/9/2014 0.010 4.56 31.77 63.3% 4.0% 32.7% 0.23 0.00 0.304-Week 10/16/2014 0.015 3.68 32.74 85.8% 3.7% 10.5% 0.26 0.00 0.304-Week 10/23/2014 0.030 4.02 33.76 80.8% 3.6% 15.6% 0.24 0.00 0.324-Week 10/30/2014 0.020 4.02 33.21 74.6% 7.6% 17.8% 0.22 0.00 0.334-Week 11/6/2014 0.035 4.02 35.74 76.4% 5.7% 17.8% 0.26 0.00 0.344-Week 11/13/2014 0.045 3.84 39.73 70.7% 5.3% 24.0% 0.27 0.00 0.374-Week 11/20/2014 0.035 3.51 39.75 77.7% 4.8% 17.5% 0.25 0.00 0.374-Week 11/28/2014 0.060 3.65 38.77 77.1% 4.1% 18.9% 0.23 0.00 0.384-Week 12/4/2014 0.030 3.75 49.73 65.9% 3.1% 31.0% 0.27 0.00 0.484-Week 12/11/2014 0.040 3.52 49.72 73.0% 4.9% 22.1% 0.28 0.00 0.464-Week 12/18/2014 0.020 3.28 39.75 75.4% 4.0% 20.6% 0.25 0.00 0.374-Week 12/26/2014 0.010 3.74 29.77 66.5% 3.7% 29.8% 0.23 0.00 0.284-Week 1/2/2015 0.015 3.67 28.89 60.0% 2.3% 37.7% 0.24 0.00 0.28
13-Week 10/9/2014 0.015 5.05 23.54 75.7% 4.2% 20.1% 0.41 0.00 0.7113-Week 10/16/2014 0.010 4.33 23.50 75.2% 5.4% 19.5% 0.40 0.00 0.7013-Week 10/23/2014 0.020 4.60 23.60 73.1% 3.9% 22.9% 0.40 0.00 0.7113-Week 10/30/2014 0.020 4.83 22.84 68.7% 4.0% 27.2% 0.37 0.00 0.7113-Week 11/6/2014 0.020 4.67 23.56 70.0% 6.0% 24.0% 0.35 0.00 0.7213-Week 11/13/2014 0.025 4.65 23.49 51.5% 3.6% 44.9% 0.41 0.00 0.7213-Week 11/20/2014 0.025 4.50 23.49 61.9% 4.5% 33.6% 0.41 0.00 0.6913-Week 11/28/2014 0.020 4.28 22.67 79.8% 9.3% 10.9% 0.39 0.00 0.7013-Week 12/4/2014 0.025 4.67 23.45 71.4% 4.5% 24.1% 0.35 0.00 0.7013-Week 12/11/2014 0.025 4.51 23.57 62.6% 6.4% 31.0% 0.43 0.00 0.7013-Week 12/18/2014 0.035 3.98 23.51 79.0% 9.7% 11.3% 0.39 0.00 0.7013-Week 12/26/2014 0.055 3.83 23.50 59.5% 9.7% 30.8% 0.40 0.00 0.7013-Week 1/2/2015 0.040 3.94 22.64 70.3% 8.5% 21.2% 0.37 0.00 0.7026-Week 10/9/2014 0.040 4.62 23.17 60.4% 6.7% 32.9% 0.36 0.00 0.5726-Week 10/16/2014 0.040 4.32 26.18 54.1% 4.9% 41.0% 0.34 0.00 0.7026-Week 10/23/2014 0.050 3.91 29.34 68.9% 8.9% 22.3% 0.31 0.00 0.8526-Week 10/30/2014 0.055 4.03 28.74 59.5% 4.9% 35.6% 0.28 0.00 1.7526-Week 11/6/2014 0.060 4.19 29.21 47.6% 3.4% 48.9% 0.32 0.00 0.9926-Week 11/13/2014 0.060 3.83 27.19 57.8% 5.6% 36.6% 0.34 0.00 0.9926-Week 11/20/2014 0.070 3.83 27.36 63.4% 5.1% 31.5% 0.36 0.00 1.0226-Week 11/28/2014 0.070 4.03 26.66 48.5% 5.1% 46.4% 0.35 0.00 1.6026-Week 12/4/2014 0.075 4.21 25.33 61.5% 7.0% 31.5% 0.29 0.00 1.0626-Week 12/11/2014 0.090 4.20 25.35 56.9% 4.0% 39.1% 0.38 0.00 1.1226-Week 12/18/2014 0.110 3.81 25.37 64.3% 3.0% 32.8% 0.35 0.00 1.1826-Week 12/26/2014 0.155 3.74 23.28 53.6% 8.9% 37.5% 0.34 0.00 1.3826-Week 1/2/2015 0.130 3.94 22.73 66.3% 6.6% 27.1% 0.28 0.00 1.2052-Week 10/16/2014 0.100 3.86 24.77 68.1% 3.2% 28.7% 0.15 0.00 2.0852-Week 11/13/2014 0.140 3.59 24.80 67.5% 3.9% 28.6% 0.12 0.00 2.3352-Week 12/11/2014 0.210 3.44 24.77 78.1% 7.1% 14.8% 0.16 0.00 2.48
Bills

47 *Weighted averages of Competitive Awards. **Approximated using prices at settlement and includes both Competitive and Non-Competitive Awards. For TIPS’ 10-Year Equivalent, a constant auction BEI is used as the inflation assumption.
Issue Settle Date Stop Out Rate (%)*
Bid-to-Cover Ratio*
Competitive Awards ($
bn)
% Primary Dealer*
% Direct*
% Indirect*
Non-Competitive
Awards ($ bn)
SOMA Add Ons
($ bn)
10-Yr Equivalent ($
bn)**2-Year FRN 10/31/2014 0.053 3.58 14.98 50.1% 3.3% 46.6% 0.02 0.00 0.022-Year FRN 11/28/2014 0.068 4.00 12.99 42.8% 5.4% 51.8% 0.01 0.00 0.242-Year FRN 12/26/2014 0.110 2.90 12.99 70.1% 5.2% 24.7% 0.01 0.00 0.14
2-Year 10/31/2014 0.425 3.11 28.73 47.2% 16.2% 36.7% 0.17 0.00 5.892-Year 12/1/2014 0.542 3.71 27.75 48.0% 16.2% 35.8% 0.15 0.00 5.802-Year 12/31/2014 0.703 3.21 26.76 49.8% 14.5% 35.7% 0.14 0.00 5.883-Year 10/15/2014 0.994 3.42 26.84 47.0% 17.4% 35.5% 0.06 0.00 8.303-Year 11/17/2014 0.998 3.18 25.84 47.1% 15.2% 37.7% 0.06 0.03 8.343-Year 12/15/2014 1.066 3.24 24.83 47.7% 10.1% 42.2% 0.07 0.00 8.035-Year 10/31/2014 1.567 2.36 34.94 41.7% 10.5% 47.8% 0.06 0.00 18.465-Year 12/1/2014 1.595 2.91 34.95 25.1% 9.9% 65.0% 0.05 0.00 18.325-Year 12/31/2014 1.739 2.39 34.96 33.9% 7.3% 58.7% 0.04 0.00 18.757-Year 10/31/2014 2.018 2.42 28.99 38.0% 15.4% 46.6% 0.01 0.00 21.017-Year 12/1/2014 1.960 2.63 28.98 37.1% 12.8% 50.0% 0.02 0.00 20.847-Year 12/31/2014 2.125 2.39 28.99 37.6% 5.9% 56.5% 0.01 0.00 21.12
10-Year 10/15/2014 2.381 2.52 20.98 49.0% 6.6% 44.4% 0.02 0.00 20.9910-Year 11/17/2014 2.365 2.52 23.93 42.0% 13.4% 44.7% 0.05 0.03 24.3010-Year 12/15/2014 2.214 2.97 20.96 39.3% 6.9% 53.8% 0.04 0.00 20.9930-Year 10/15/2014 3.074 2.40 12.99 32.2% 21.5% 46.2% 0.00 0.00 28.7830-Year 11/17/2014 3.092 2.29 15.98 42.5% 13.8% 43.8% 0.01 0.02 36.0630-Year 12/15/2014 2.848 2.76 12.99 25.9% 24.3% 49.8% 0.01 0.00 29.09
Issue Settle Date Stop Out Rate (%)*
Bid-to-Cover Ratio*
Competitive Awards ($
bn)
% Primary Dealer*
% Direct*
% Indirect*
Non-Competitive
Awards ($ bn)
SOMA Add Ons
($ bn)
10-Yr Equivalent ($
bn)**5-Year 12/31/2014 0.395 2.37 15.96 30.0% 5.2% 64.8% 0.04 0.00 7.83
10-Year 11/28/2014 0.497 2.57 12.99 29.5% 8.1% 62.4% 0.01 0.00 14.0030-Year 10/31/2014 0.985 2.29 6.98 31.0% 4.5% 64.5% 0.02 0.00 19.72
Nominal Coupons
TIPS
Treasury Borrowing Advisory Committee Presentation
• WAM and the Debt Portfolio
• Historically, Treasury has used the Weighted Average Maturity (WAM) of the debt portfolio as a simple proxy for the portfolio’s structure, cost and risk. Since the 2008/09 financial crisis, Treasury has extended the WAM from 49 months to 68 months and the WAM is now at levels approaching multi-decade highs.
• WAM, however, is just one metric and, as with all simple proxies, WAM does not fully capture several important characteristics of the Treasury portfolio. We would like the Committee to comment on WAM as a metric for measuring the debt portfolio. What other metrics should Treasury monitor and publish with respect to the Treasury portfolio? Please discuss.
48

WAM is approaching multi-decade highs
• The weighted average maturity (WAM) of outstanding Treasury debt has risen significantly from the lows of 49 months and is now approaching multi-decade highs
• Is WAM an accurate measure of Treasury’s costs and risks?
Weighted average maturity of the outstanding Treasury debt has risen to close to 30y highs
Source: Haver Analytics, US Treasury
Pros • A single summary indicator of Treasury’s risks
• A simple, easy to communicate, metric
Cons • May overstate /understate shifts in roll-over risk
• Does not capture the concentration of roll-over risk
• Not a sufficient statistic to capture the ex-ante cost of issuing debt
• Does not capture the “completeness” of the market
40
45
50
55
60
65
70
75
1980 1985 1990 1995 2000 2005 2010
mths
Average maturity of Total Outstanding Marketable Debt
49
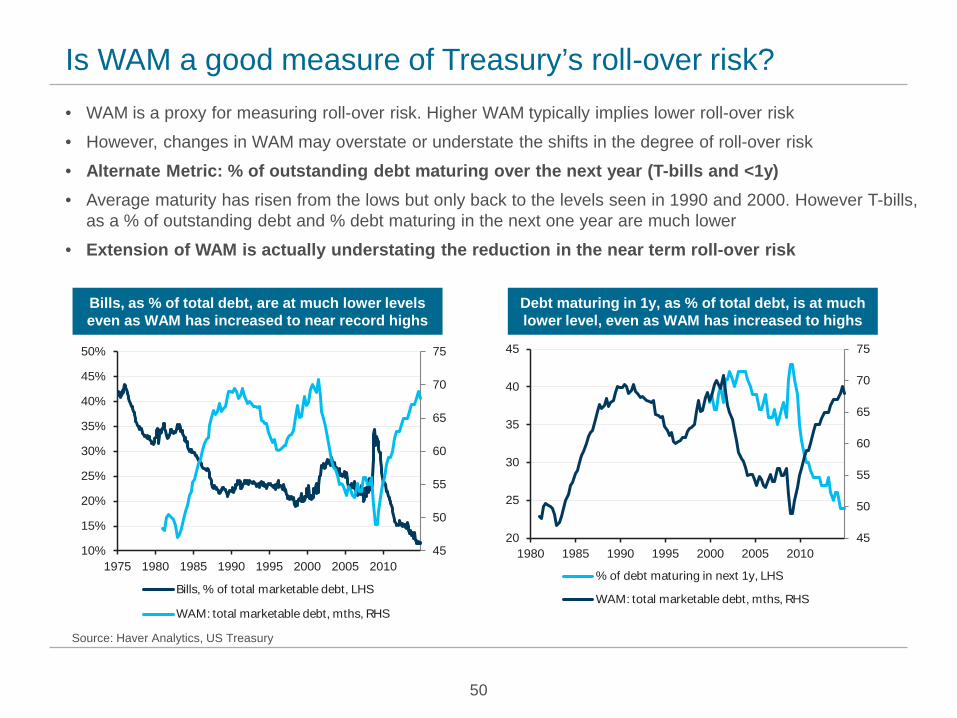
Is WAM a good measure of Treasury’s roll-over risk? • WAM is a proxy for measuring roll-over risk. Higher WAM typically implies lower roll-over risk
• However, changes in WAM may overstate or understate the shifts in the degree of roll-over risk
• Alternate Metric: % of outstanding debt maturing over the next year (T-bills and <1y) • Average maturity has risen from the lows but only back to the levels seen in 1990 and 2000. However T-bills,
as a % of outstanding debt and % debt maturing in the next one year are much lower
• Extension of WAM is actually understating the reduction in the near term roll-over risk
Bills, as % of total debt, are at much lower levels even as WAM has increased to near record highs
Debt maturing in 1y, as % of total debt, is at much lower level, even as WAM has increased to highs
Source: Haver Analytics, US Treasury
45
50
55
60
65
70
75
10%
15%
20%
25%
30%
35%
40%
45%
50%
1975 1980 1985 1990 1995 2000 2005 2010
Bills, % of total marketable debt, LHS
WAM: total marketable debt, mths, RHS
45
50
55
60
65
70
75
20
25
30
35
40
45
1980 1985 1990 1995 2000 2005 2010
% of debt maturing in next 1y, LHS
WAM: total marketable debt, mths, RHS
50
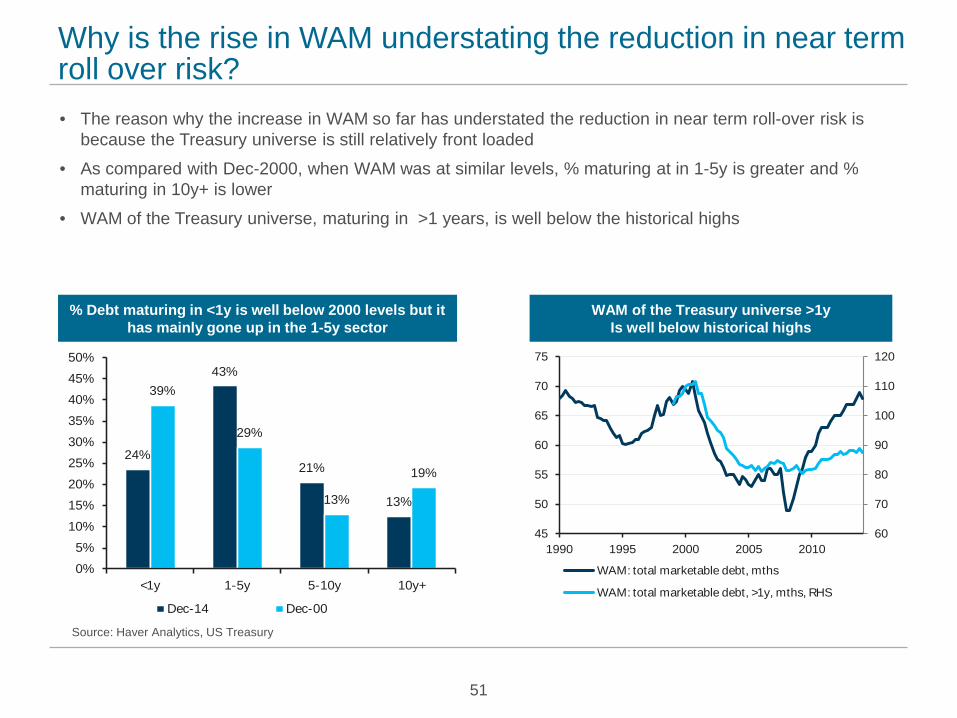
Why is the rise in WAM understating the reduction in near term roll over risk? • The reason why the increase in WAM so far has understated the reduction in near term roll-over risk is
because the Treasury universe is still relatively front loaded
• As compared with Dec-2000, when WAM was at similar levels, % maturing at in 1-5y is greater and % maturing in 10y+ is lower
• WAM of the Treasury universe, maturing in >1 years, is well below the historical highs
WAM of the Treasury universe >1y
Is well below historical highs % Debt maturing in <1y is well below 2000 levels but it
has mainly gone up in the 1-5y sector
24%
43%
21%
13%
39%
29%
13%
19%
0%
5%
10%
15%
20%
25%
30%
35%
40%
45%
50%
<1y 1-5y 5-10y 10y+
Dec-14 Dec-00
Source: Haver Analytics, US Treasury
60
70
80
90
100
110
120
45
50
55
60
65
70
75
1990 1995 2000 2005 2010
WAM: total marketable debt, mths
WAM: total marketable debt, >1y, mths, RHS
51
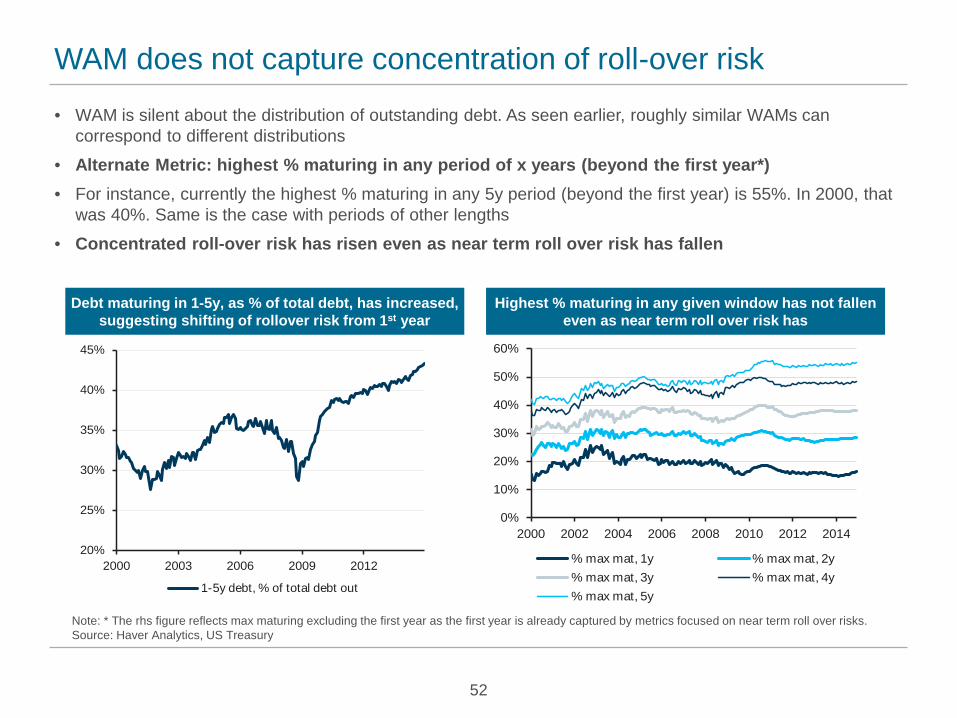
WAM does not capture concentration of roll-over risk
• WAM is silent about the distribution of outstanding debt. As seen earlier, roughly similar WAMs can correspond to different distributions
• Alternate Metric: highest % maturing in any period of x years (beyond the first year*) • For instance, currently the highest % maturing in any 5y period (beyond the first year) is 55%. In 2000, that
was 40%. Same is the case with periods of other lengths
• Concentrated roll-over risk has risen even as near term roll over risk has fallen
Debt maturing in 1-5y, as % of total debt, has increased, suggesting shifting of rollover risk from 1st year
Highest % maturing in any given window has not fallen even as near term roll over risk has
Note: * The rhs figure reflects max maturing excluding the first year as the first year is already captured by metrics focused on near term roll over risks. Source: Haver Analytics, US Treasury
20%
25%
30%
35%
40%
45%
2000 2003 2006 2009 2012
1-5y debt, % of total debt out
52
0%
10%
20%
30%
40%
50%
60%
2000 2002 2004 2006 2008 2010 2012 2014
% max mat, 1y % max mat, 2y% max mat, 3y % max mat, 4y% max mat, 5y

Distribution of Outstanding Debt: A global perspective
% of debt maturing
WAM (yrs) <1y 1-5y 5-10y 10y+
US 5.7 24% 43% 21% 13%
Germany 6.6 14% 41% 29% 16%
France 6.9 19% 34% 26% 20%
Japan 8.4 9% 40% 26% 25%
UK 15.5 10% 24% 20% 46%
Treasury’s roll-over risk is still high in a global context
Source: US Treasury, MOF Japan, Bloomberg
0
2
4
6
8
10
12
14
16
18
1997 1999 2001 2003 2005 2007 2009 2011 2013
WAM, yrs
Japan US UK Germany France
WAM of US Treasury debt is at the lower end of the range for major issuers
• WAM is high in a historical context but is low in a global context.
• Near term roll over risk is higher than other major government bond issuers.
53
Is WAM a good proxy for cost of issuing debt?
Treasury’s Primary Goal: to finance government borrowing needs at the lowest cost over time
Methodology: issue debt in a regular and predictable pattern, provide transparency in our decision-making process, and seek continuous improvements in the auction process
How to measure the cost of issuing debt?
• Treasury yields = Expectations of the path of short rates + Term premium
• Tem premium = compensation demanded by investors for taking duration risk
• Hence, term premium can be thought of as Treasury’s ex-ante cost of issuing fixed rate debt vs T-bills /FRNs
• Increasing WAM typically comes at a cost as term premium is usually significantly positive • As a result, there usually exists a trade-off between reducing roll-over risk (via issuing long term debt)
and reducing cost (via issuing short term debt).
• However, this does not always have to be the case
Source: US Treasury
54

Term premium is well below pre-crisis levels, perhaps negative • How does one measure term premia?
• Survey based measures: Difference between current 10y yields and the expected average of 3M T-bills/FF rate over the next 10y years
• Survey of professional forecasters (top right)
• NY Fed Survey of primary dealers / market participants (bottom right)
• Term structure models (bottom left)
• Kim and Wright (2005)
• Adrian, Crump and Moench (2013)
• Both methodologies suggest term premium is currently very low, perhaps negative. Hence, even though WAM is at historically high levels, ex-ante cost of issuing term debt is well below pre-crisis levels
Models based measures also show term premium is currently negative
Survey based measures show term premium is currently negative
Source: Haver Analytics, New York Fed, US Treasury
-1.2
-1.0
-0.8
-0.6
-0.4
-0.2
0.0
0.2
0.0
0.5
1.0
1.5
2.0
2.5
3.0
3.5
Sep-13 Dec-13 Mar-14 Jun-14 Sep-14 Dec-14
10y avg FF Rate, NY Fed Survey10y Tsy YieldTerm Premium, %
55
-3
-2
-1
0
1
2
3
4
0
2
4
6
8
10
1990 1995 2000 2005 201010y CMT yield, %Average 3m bill return over the next 10y, Median, %Term Premium, % RHS
-2.0
-1.0
0.0
1.0
2.0
3.0
4.0
5.0
1980 1985 1990 1995 2000 2005 201010y ZC Term Premium, %
10y Term premium ACM model, %

WAM is at the highs but ex-ante costs are quite low
WAM is at the highs, but ex-ante cost of debt issuance is well below pre-crisis lows Scope for long end universe to expand
• WAM is close to the historical highs but ex-ante cost of issuing term debt is perhaps negative (given that term premium is arguably negative)
• % maturing in the long end is low in a historical context. More room for issuing longer dated debt
Source: Haver Analytics, US Treasury
56
45
50
55
60
65
70
75
80
-2.0
-1.0
0.0
1.0
2.0
3.0
4.0
5.0
1980 1985 1990 1995 2000 2005 201010y ZC Term Premium, %10y Term premium ACM model, %Avg mat of total outstanding debt, mths, RHS
-1.0
-0.5
0.0
0.5
1.0
1.5
2.0
2.5
8%
10%
12%
14%
16%
18%
20%
2000 2002 2004 2006 2008 2010 2012 2014
10y+ maturity total debt, % of outTerm premium, RHS, %
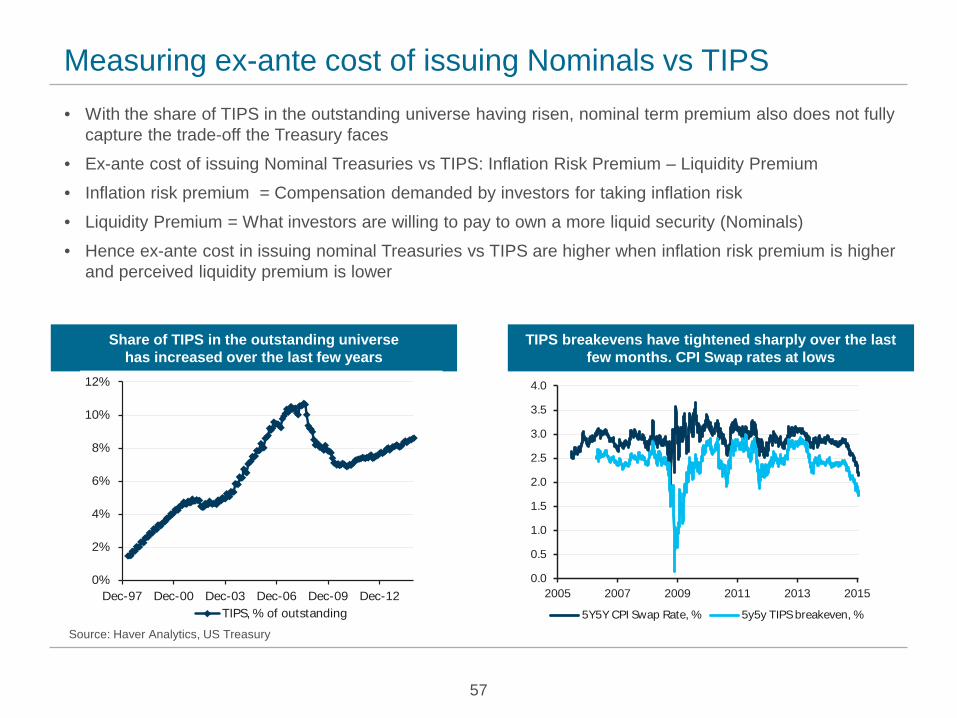
Measuring ex-ante cost of issuing Nominals vs TIPS • With the share of TIPS in the outstanding universe having risen, nominal term premium also does not fully
capture the trade-off the Treasury faces
• Ex-ante cost of issuing Nominal Treasuries vs TIPS: Inflation Risk Premium – Liquidity Premium
• Inflation risk premium = Compensation demanded by investors for taking inflation risk
• Liquidity Premium = What investors are willing to pay to own a more liquid security (Nominals)
• Hence ex-ante cost in issuing nominal Treasuries vs TIPS are higher when inflation risk premium is higher and perceived liquidity premium is lower
TIPS breakevens have tightened sharply over the last few months. CPI Swap rates at lows
Share of TIPS in the outstanding universe has increased over the last few years
0%
2%
4%
6%
8%
10%
12%
Dec-97 Dec-00 Dec-03 Dec-06 Dec-09 Dec-12TIPS, % of outstanding
Source: Haver Analytics, US Treasury
57
0.0
0.5
1.0
1.5
2.0
2.5
3.0
3.5
4.0
2005 2007 2009 2011 2013 2015
5Y5Y CPI Swap Rate, % 5y5y TIPS breakeven, %

Ex-ante cost of issuing Nominals vs TIPS has declined • Measuring Inflation risk premium using the difference between market and survey based measures
• 5y5y inflation swap rates have fallen over the last few months. However, the NY Fed survey of primary dealers show 5y5y inflation expectation have remained stable. This suggests that inflation risk premium has compressed.
• Measuring Liquidity premium: Asset swap differential between TIPS and nominal Treasuries. Excluding the 2008 crisis, the differential has remained in the 20-40bp range at the 10y tenor (TIPS being cheaper than Nominals)
• This suggests that ex-ante cost of issuing nominal Treasuries vs TIPS has fallen over the last few months as inflation risk premium has fallen and liquidity premium has remained stable
TIPS trade at a discount to nominal Treasuries on Asset Swap
Survey based measures of medium term inflation expectations have remained unchanged
0.0%0.1%0.2%0.3%0.4%0.5%0.6%0.7%0.8%0.9%
2.0%2.1%2.2%2.3%2.4%2.5%2.6%2.7%2.8%2.9%3.0%
Jul-13 Oct-13 Jan-14 Apr-14 Jul-14 Oct-14Median PD 5y5y inf exp, %5y5y BE Zero Swap, %5y5y BE Zero Swap - Median PD 5y5y inf exp, RHS
Source: Haver Analytics, New York Fed
58
0
20
40
60
80
100
120
140
160
2006 2008 2010 2012 2014
10Y TIPS Vs Comparator Z Spread ASW, bp

Measuring the “completeness” of the market • WAM does not say anything about idiosyncrasies of the distribution of the outstanding debt
• There are no nominal Treasuries maturing between Feb 2031 and Feb 2036. Further, the total amount outstanding between Feb 36 and May 38 (both included) is $112bn of which $72bn is held by the Fed. Hence, the total float available to investors in this sector is very small
• Feb 2036 are trading significantly rich on the curve as they are likely to be the CTD in the US Futures contract for many years. This richness has spilled over to nearby issues as well.
• At current auction schedule, it will be a while before new 10y securities issued by the Treasury start filling the gap. The Treasury may consider issuing securities in this sector to iron out such dislocations.
59
-30
-25
-20
-15
-10
-5
0
5
10
15
0
10
20
30
40
50
60
70
Nov-14 Nov-17 Nov-20 Nov-23 Nov-26 Nov-29 Nov-32 Nov-35 Nov-38 Nov-41 Nov-44
Float (Outstanding - SOMA holdings), $bn, lhs Asset Swap Spread, bp, rhs
As of Jan 26. Source: New York Fed, US Treasury
Outstanding debt is unevenly distributed with no bonds maturing between 2031 and 2036

Measuring the Ownership concentration risk
• WAM , obviously, does not say anything about the ownership structure of the outstanding debt
• Foreign investors hold almost 60% of privately held Treasury debt.
• In contrast depository institutions hold just 4%
• The Treasury may consider ways to diversify the investor base.
Foreign investors hold ~60% of privately held Treasury debt and Depository Institutions only 4%
Breakdown of ownership of privately held Treasury debt
As of Q3 14. Source: Haver Analytics, US Treasury
60
0%
10%
20%
30%
40%
50%
60%
70%
1990 1995 2000 2005 2010
Foreign ownership, % of private held debt
0%
2%
4%
6%
8%
10%
12%
14%
1990 1995 2000 2005 2010
Dep Inst, % of private held debt
Depository institutions
4%
U.S. savings bonds
2%Private pension
funds5%
State & local government
pension funds2%
Insurance companies
2%
Mutual funds10%
State & local governments
6%Foreign &
international58%
Other investors11%

Government ownership of financial assets has risen substantially from pre-crisis levels
• Government’s holdings of financial assets have increased substantially since the crisis. For instance, direct student loans on government balance sheet are almost $0.8trn (equivalent to roughly 50% of outstanding 10y+ debt).
• Further, funding needs related to acquiring financial assets, mainly direct student loans, are increasingly becoming a significant share of overall borrowing needs (equivalent to 25% of budget deficits in 2014)
• According to OMB, direct loan accounts are expected to increase by another $1trillion or so over the next decade.
• Other financial assets include operating cash balance (2014 average: $83bn) and GSE preferred stock ($140bn)
• Should the portfolio be considered net of financial assets?
61
0%
5%
10%
15%
20%
25%
30%
0
500
1,000
1,500
2,000
Dec-05 Dec-07 Dec-09 Dec-11 Dec-13Yearly Budget Deficits, $bnFinancing Related to Direct Student Loans, $bnRatio, rhs
Financing needs related to direct student loans have average ~25% of deficits recently
Source: OMB, Haver Analytics, Federal Reserve, US Treasury
0%
25%
50%
75%
100%
0
500
1,000
1,500
2,000
Dec-06 Dec-08 Dec-10 Dec-12 Dec-1410y+ Oustanding debt, $bnFederal Direct Student Loans, $bnRatio, rhs
Direct student loans on government balance sheet equate to roughly 50% of outstanding 10y+ debt
Should the portfolio be considered net of financial assets?
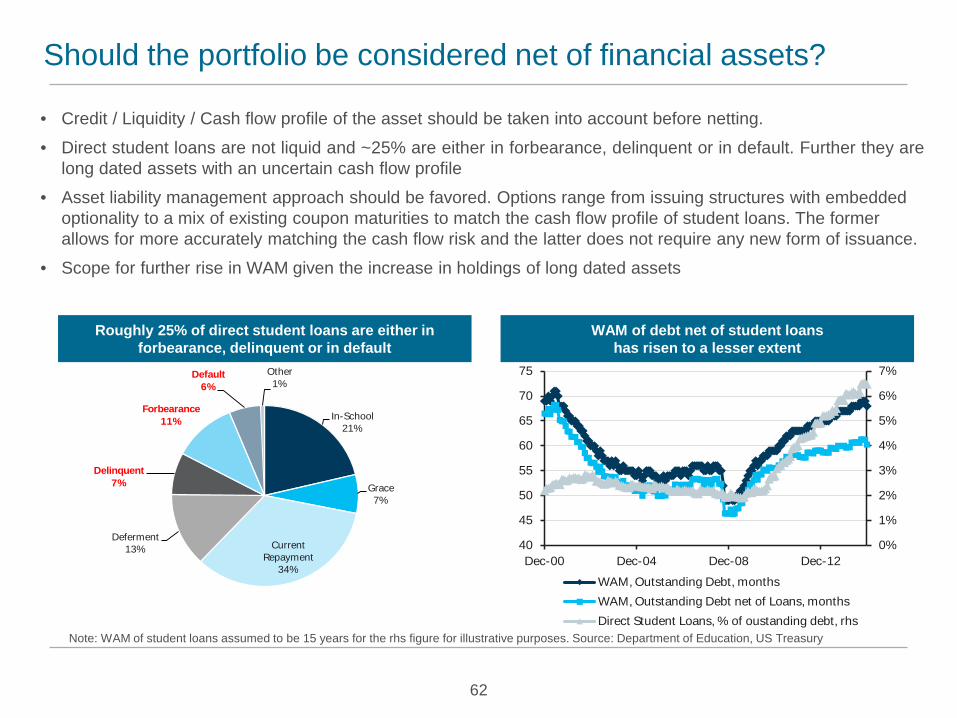
• Credit / Liquidity / Cash flow profile of the asset should be taken into account before netting.
• Direct student loans are not liquid and ~25% are either in forbearance, delinquent or in default. Further they are long dated assets with an uncertain cash flow profile
• Asset liability management approach should be favored. Options range from issuing structures with embedded optionality to a mix of existing coupon maturities to match the cash flow profile of student loans. The former allows for more accurately matching the cash flow risk and the latter does not require any new form of issuance.
• Scope for further rise in WAM given the increase in holdings of long dated assets
62
Note: WAM of student loans assumed to be 15 years for the rhs figure for illustrative purposes. Source: Department of Education, US Treasury
Roughly 25% of direct student loans are either in forbearance, delinquent or in default
In-School21%
Grace7%
Current Repayment
34%
Deferment13%
Delinquent7%
Forbearance11%
Default6%
Other1%
WAM of debt net of student loans has risen to a lesser extent
0%
1%
2%
3%
4%
5%
6%
7%
40
45
50
55
60
65
70
75
Dec-00 Dec-04 Dec-08 Dec-12
WAM, Outstanding Debt, monthsWAM, Outstanding Debt net of Loans, monthsDirect Student Loans, % of oustanding debt, rhs

Recommendations on Debt Management Communication The Treasury could publish a base case forecast of issuance trends over a certain period (say 1y) • WAM of issuance
• % to be issued in different buckets / instruments • Actual issue sizes
Each option entails a trade-off between guidance and flexibility
Measurement Metrics The Treasury could publish current and a base case forecast (x years out) (where applicable) 1. Roll-over risk:
• % of debt outstanding maturing in the near term
• % of debt outstanding maturing within a x-year window at any point in time
2. Range of ex-ante measures of cost of issuing various forms of debt • % issuance in a given sector* Term premium at that tenor
• % issuance in TIPS * (Nominal Liquidity premium – Inflation Risk Premium)
3. Completeness of Market: • Lowest float maturing in a certain window (say 5y / 10y)
• Measure of aggregate dislocations (RMSE) of securities by sector
4. Various measures of WAM • Outstanding debt / Coupon Universe
• Consolidated Debt / Debt Net of Fin. Assets (after accounting for Fair Value and Maturity)
63

References
• http://libertystreeteconomics.newyorkfed.org/2014/05/treasury-term-premia-1961-present.html
• http://www.newyorkfed.org/markets/primarydealer_survey_questions.html
• http://www.imf.org/external/pubs/ft/tnm/2012/tnm1202.pdf
• http://www.brookings.edu/~/media/research/files/papers/2014/09/30_government_debt_management_zlb/30_government_debt_management_zlb.pdf
• http://www.imf.org/external/np/mfd/pdebt/2003/eng/am/120903.pdf
• http://www.bis.org/publ/bppdf/bispap65l_rh.pdf
• http://www.nao.org.uk/wp-content/uploads/2012/11/debt_management_office.pdf
• https://www.boj.or.jp/en/announcements/release_2013/k130122c.pdf
• http://www.bankofcanada.ca/wp-content/uploads/2011/08/larson.pdf
• https://www.bancaditalia.it/compiti/operazioni-mef/index.html?com.dotmarketing.htmlpage.language=1
• http://www.bundesbank.de/Navigation/EN/Service/Federal_securities/federal_securities.html
• http://www.aft.gouv.fr/rubriques/the-french-financial-markets_111_lng3.html
64


In the early 2000s, Treasury used buybacks as a tool to enhance the liquidity of its
benchmark issuance during a time of budgetary surpluses. We would like the
Committee to comment on the use of buybacks during a time of budgetary deficits,
and whether such a tool could be used to assist Treasury in managing the maturity
structure of debt portfolios, secondary market liquidity, and cash.

Treasury bought back $67.5 billion of outstanding bonds from March 2000 to April 2002
Involved 45 reverse auction operations
Buyback program was implemented in response to shrinking financing needs
Federal budget turned to a surplus in 1998
CBO forecasted increases in surplus going forward from that point
Treasury had reduced its new debt issuance substantially
TBAC in 1999 argued that “individual issues are now near a minimum size that would allow
sufficient liquidity to maintain benchmark status”
Buyback program ended once funding needs began to increase

The budget deficit (primary deficit plus interest expenses) has to be met by changes in the
amount of outstanding Treasury debt (or changes in cash balance)
Those changes determined by:
Change in outstanding debt = Net debt issuance – Debt buybacks, or
Change in outstanding debt = Gross debt issuance – Maturing debt – Debt buybacks
With buybacks set at zero, any variation in the Treasury’s funding need (the change in
outstanding debt plus maturing debt) has to be met by changing gross debt issuance
But Treasury has emphasized the importance of regular and predictable issuance
Treasury could consider running a program of regular buybacks with the ability to adjust the
size over time (for purposes discussed in following slides)

Enhance liquidity of Treasury securities
Allow larger on-the-run issue sizes
Create liquidity for off-the-run issues
Smooth gross issuance of debt over time
Maintain sizes of coupon issues during periods of temporary overfunding
Reduce short-run variation in Treasury bill issuance or cash balance
Provide another tool for managing seasonal fluctuations in funding needs
Reduce maturity peaks in outstanding debt
Allow pre-funding of large maturity dates to lower refinancing risk
Allow more efficient changes to Treasury debt profile
Achieve faster adjustments to debt profile (e.g., WAM) over time

On-the-run Treasury securities provide liquidity that is highly valued by market participants
Buybacks allow Treasury to separate on-the-run issue sizes from its funding needs
Treasury can optimize the size of these issues, rather than having it imposed by budget needs
However, it is unclear that current sizes are not sufficiently large
The liquidity premium on on-the-run
issues has been related to their size
On-the-run debt was scarce in the early
2000s and commanded a high premium
Issue sizes have now reached levels at
which the average liquidity premium is
smaller and perhaps less sensitive to size

Regular buybacks offer liquidity events for off-the-run Treasury securities
Help guard against individual issues becoming very illiquid or idiosyncratically cheap
Could be particularly helpful during periods of market dysfunction or stress
Similar effects were observed during the Fed’s asset purchase programs
Any reduction of illiquidity discount should also benefit newly issued Treasury securities
Fed purchases led to a reduction in the
dispersion of Treasury yields
This pattern occurred because the Fed
purchased less liquid, off-the-run issues
Dispersion began to increase again as
Fed purchases diminished
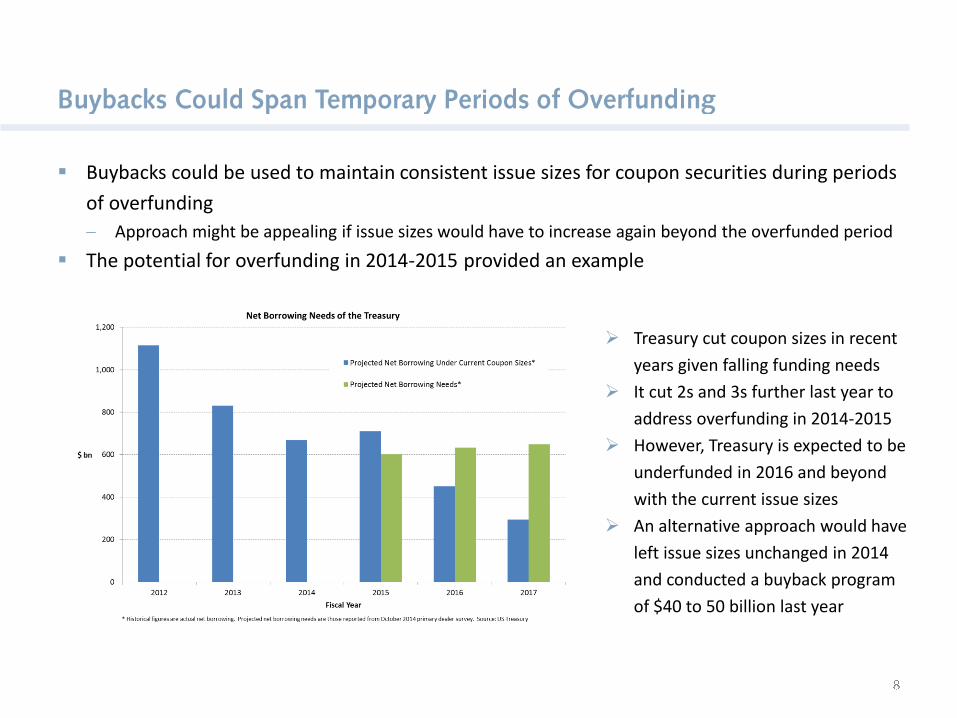
Buybacks could be used to maintain consistent issue sizes for coupon securities during periods
of overfunding
Approach might be appealing if issue sizes would have to increase again beyond the overfunded period
The potential for overfunding in 2014-2015 provided an example
Treasury cut coupon sizes in recent
years given falling funding needs
It cut 2s and 3s further last year to
address overfunding in 2014-2015
However, Treasury is expected to be
underfunded in 2016 and beyond
with the current issue sizes
An alternative approach would have
left issue sizes unchanged in 2014
and conducted a buyback program
of $40 to 50 billion last year

Treasury faces considerable variation in funding needs at a higher frequency
This variation is largely due to timing mismatch of revenues and expenditures
Historically, much of this variation has been met through large fluctuations in bill issuance
Also produces short-term swings in Treasury cash balances when bills cannot be cut sufficiently
Buybacks could be used to dampen these seasonal swings in bill issuance/cash balances
Issuance of bills varies over a wide
range over the year
Treasury could keep a steadier, larger
amount of outstanding bills on average
It would then use buybacks to reduce
the excess funding realized at times

However, there are limits on the scope of using buybacks for this purpose
Buybacks would be much smaller than the variation in bills
Operations would have to focus on issues with very short remaining maturities
To date, there has been little apparent cost due to the variation in bill issuance
Important issue is whether this will remain the case going forward
Bills have served as a very efficient
shock absorber
Treasury has been able to vary bill size
with little apparent cost (relationship
does not appear to be convex)
However, that has taken place in a high
liquidity, low rate environment

Treasury faces an uneven profile of maturing debt
Mid-quarter months are projected to have large amounts of maturing debt
This pattern owes in part to the regular re-opening of 10- and 30-year securities
There is also some unevenness of maturities across different years
This pattern creates considerable variation in gross funding needs
This variation could result in increased rollover risk
Makes it more challenging to smooth gross coupon issuance (need to use bills more extensively)
Requires larger cash balance to guard against operational disruptions

Buybacks could reduce the amount of debt maturing on peak dates
One approach would be to purchase coupon securities as they approach maturity
Allows the Treasury to essentially pre-fund the maturing debt
Treasury could also smooth maturity profile farther in advance if consistent with other objectives
Short-dated coupons might be attractive to purchase
Short-dated coupons trade cheap
relative to bills
This pattern makes them more
attractive to purchase
Many other debt managers focus
buyback programs on short-dated
coupon securities

Treasury should have the flexibility to alter broad characteristics of its debt over time
For example, implementing any decisions to change the WAM or the proportion of bills
Buybacks could make the implementation of these changes quicker and more efficient
Especially if Treasury were reluctant to change new issue sizes abruptly
As an illustrative example, consider an effort
to return WAM to its historical average
This adjustment could be achieved by
adjusting issuance without using buybacks
However, the adjustment would occur quite
slowly if Treasury were reluctant to make large
changes to issue sizes
A buyback program of $100 billion per year
would accelerate the adjustment to the WAM

Costs of operating on both sides of the market
Pay bid-offer spread, plus additional concessions at auctions and at buyback operations
Costs presumably increase with size of operations, perhaps limiting the overall program size
However, Treasury would be capturing more liquidity premium, mitigating this concern
It would be important for the Treasury to monitor such costs if it were to implement buybacks
Discomfort with Treasury interfering in market functioning
Some may worry about the market functioning consequences of additional Treasury activity
However, net supply would basically remain on same path that it would without buybacks; Treasury
would just be achieving that path in a more effective manner
Buybacks could improve market functioning by creating more liquid instruments
Accounting issue with buying premium bonds
Premiums on purchased securities count as current expenditures, so they would increase the reported
budget deficit
However, the premium is just the market price for reducing future excess interest payments
This issue could interact with the debt limit, since the limit is measured on par debt

Many countries conduct either debt buybacks or debt exchange programs
A recent OECD survey indicated that 29 of the 33 countries surveyed had used such programs
Some countries conduct buybacks on regular basis, while others conduct them on an ad-hoc basis
Source: 2012 Survey on Buyback and Switches by OECD WPDM, as reported in OECD Working Papers on Sovereign Borrowing
and Public Debt Management, No. 5.

Buyback operations are usually targeted at securities that are approaching maturity
Most respondents said that the purpose was “to smooth the redemption profile” or “to
mitigate refinancing risk”

Operational experience from Fed asset purchases
Have operational infrastructure and experienced staff for implementation
Can rely on the past experience of Treasury and Fed to guide operational details
Initial thoughts on operational procedures
Conduct buybacks as reverse auctions over defined set of securities
Accept offers based on cheapness relative to other similar Treasury securities
Place ownership limits on individual CUSIPs
Exclude particular issues as needed
Exclude STRIPS
Aim for some degree of “regular and predictable” activity for buybacks
Likely to be some benefit from regular presence in the market
But also want the flexibility to adjust sizes and composition over time, given some of the
objectives noted above
Adjustments should not be so abrupt to create meaningful uncertainty about gross issuance

Buybacks would proceed at a much slower pace than the Fed’s purchases in recent years
Fed’s programs bought at a rapid pace, reflecting their intention to influence financial conditions
Buybacks would instead be focused on the objectives described above
Purchases of up to $100 billion per year could likely be achieved with little difficulty
Fed programs bought at a pace as high
as $100 billion per month
Buyback program would be at a fraction
of the pace of Fed purchases
Nevertheless, the Fed’s programs
showed that sizable purchases can be
achieved without notable detriment to
market functioning

Some capacity for buybacks has been used up by the Fed’s purchase programs
Still considerable room for a buyback program across a wide range of maturities
Fed owns a meaningful share of
some segments of the market
(such as bonds that have aged
significantly)
Fed ownership is limited at
shorter maturities

Buyback program is operationally feasible and provides benefits discussed above
Potential structure of buyback program
Start with a program of modest size, conducted as a regular set of operations
Size of purchases would vary through the year to achieve the objectives above
Focus a considerable portion of purchases on securities with relatively short remaining maturities
But also consider some amount of purchases across the curve
If program proves useful, could move towards larger sizes and greater variation
Arguments in favor:
Build the flexibility to smooth maturity peaks and manage variation in bills/cash balances
Enhance the liquidity of off-the-run issues
Help implement any decisions on the desired structure of outstanding debt
Arguments against:
No clear need to raise on-the-run issue sizes at this time
As outlook swings towards underfunding, buybacks will exacerbate need to raise issue sizes
Bills are currently serving as an effective tool for addressing short-run variation in funding needs


