
N
g
ie
e
K
N
ThySSeNKRUpp Ag1ST qUARTeR
oCTobeR 01 – deCembeR 31, 2012
Developing the future.
stand: 07.02.2013

CoNTeNTS
ThyssenKrupp in brief
ThyssenKrupp has 150,000 employees in around 80 countries working with passion and expertise to develop solutions for
sustainable progress. Their skills and commitment are the basis of our success. In fiscal year 2011/2012 ThyssenKrupp
generated sales of €40 billion.
For us, innovations and technical progress are key factors in managing global growth and using finite resources in a
sustainable way. With our engineering expertise in the areas of “Material”, “Mechanical” and “Plant”, we enable our customers
to gain an edge in the global market and manufacture innovative products in a cost- and resource-efficient way.
STAMMDATEN DER THYSSENKRUPP AKTIE
ISIN (International Stock Identification Number) DE 000 750 0001
Börsenplätze Frankfurt (Prime Standard), Düsseldorf
Kürzel
Börsen Frankfurt, Düsseldorf TKA
Reuters (Xetra-Handel) TKAG.DE
Bloomberg (Xetra-Handel) TKA GY
THYSSENKRUPP STOCK MASTER DATA
ISIN (International Stock Identification Number) DE 000 750 0001
Stock exchange Frankfurt (Prime Standard), Düsseldorf
Symbols
Frankfurt, Düsseldorf stock exchange TKA
Reuters (Xetra trading) TKAG.DE
Bloomberg (Xetra trading) TKA

C oNTeNTS1 s T q u A r T E r
O cT O b E r 01 – D E c E m b E r 31 , 2012
46RepoRT by The SUpeRviSoRy boARd AUdiT CommiTTee 47CoNTACT ANd 2012/2013 dATeS
31CoNSolidATed STATemeNT of fiNANCiAl poSiTioN 32 CoNSolidATed STATemeNT of iNCome 33 CoNSolidATed STATemeNT of CompReheNSive iNCome 34 CoNSolidATed STATemeNT of ChANgeS iN eqUiTy 35CoNSolidATed STATemeNT of CASh flowS 36SeleCTed NoTeS To The CoNSolidATed fiNANCiAl STATemeNTS
45Review RepoRT
03 STRATegiC developmeNT of The gRoUp 05gRoUp Review 12 bUSiNeSS AReA Review 21 ThySSeNKRUpp SToCK 21 iNNovATioNS 22 employeeS 23 fiNANCiAl poSiTioN 25 SUbSeqUeNT eveNTS 26 expeCTed developmeNTS ANd ASSoCiATed oppoRTUNiTieS ANd RiSKS
02 ThySSeNKRUpp iN figUReS
C o N d e N S e d i N T e R i m f i N A N C i A l S T A T e m e N T S
f U R T h e R i N f o R m A T i o N
i N T e R i m m A N A g e m e N T R e p o R T
This interim report was published on February 12, 2013.

02 Interim Report 1st Quarter 2012/2013 ThyssenKrupp in figures
ThyssenKrupp in figures GROUP
Continuing operations Full Group
1st quarter ended
Dec. 31, 2011
1st quarter ended
Dec. 31, 2012 Change Change in %
1st quarter ended
Dec. 31, 2011
1st quarter ended
Dec. 31, 2012 Change Change in %
Order intake million € 9,677 9,642 (35) 0 11,260 11,202 (58) (1)
Sales million € 9,596 8,837 (759) (8) 11,138 10,412 (726) (7)
EBITDA million € 676 458 (218) (32) 412 445 33 8
EBIT million € 256 219 (37) (14) (357) 204 561 ++
EBIT margin % 2.7 2.5 (0.2) — (3.2) 2.0 5.2 —
Adjusted EBIT million € 372 229 (143) (38) 25 74 49 196
Adjusted EBIT margin % 3.9 2.6 (1.3) — 0.2 0.7 0.5 —
EBT million € 102 66 (36) (35) (514) 40 554 ++
Adjusted EBT million € 218 76 (142) (65) (131) (90) 41 31
Earnings net of tax or net income/(loss)
for the period* million € 41 29 (12) (29) (460) 35 495 ++
Basic earnings per share € 0.08 0.06 (0.02) (25) (0.89) 0.07 0.96 ++
Operating cash flow million € (1,327) 78 1,405 ++ (1,815) (140) 1,675 92
Free cash flow million € (1,330) 736 2,066 ++ (2,054) 361 2,415 ++
Employees (Dec. 31) 155,601 150,860 (4,741) (3) 171,312 154,850 (16,462) (10)
Net financial debt (Dec. 31) million € 5,937 5,205 (732) (12)
Total equity (Dec. 31) million € 10,000 4,235 (5,765) (58)
*attributable to ThyssenKrupp AG’s shareholders
BUSINESS AREAS
Order intake (million €)
Sales (million €)
EBIT (million €)
Adjusted EBIT (million €) Employees
1st quarter ended
Dec. 31, 2011
1st quarter ended
Dec. 31, 2012
1st quarter ended
Dec. 31, 2011
1st quarter ended
Dec. 31, 2012
1st quarter ended
Dec. 31, 2011
1st quarter ended
Dec. 31, 2012
1st quarter ended
Dec. 31, 2011
1st quarter ended
Dec. 31, 2012 31. Dez 11 31.12.2012
Components Technology 1,778 1,324 1,753 1,345 169 43 103 42 30,936 27,789
Elevator Technology 1,466 1,616 1,348 1,532 113 171 142 169 46,581 47,897
Plant Technology 871 1,825 943 1,001 125 110 125 110 13,786 14,359
Marine Systems 222 178 366 305 (116) 31 39 30 5,301 3,817
Materials Services 3,201 2,765 3,145 2,815 40 36 40 40 27,910 26,280
Steel Europe 2,705 2,403 2,530 2,253 102 29 102 30 28,273 27,629
Corporate 33 55 35 55 (99) (112) (101) (97) 2,814 3,089
Consolidation (599) (524) (524) (469) (78) (89) (78) (95) 0 0
Continuing operations 9,677 9,642 9,596 8,837 256 219 372 229 155,601 150,860
As part of its strategic development program ThyssenKrupp is divesting its steelmaking and processing plants in Brazil and the USA. At September
30, 2012 the Steel Americas business area met the requirements for classification as a discontinued operation under IFRS. This had been the case
for Stainless Global since September 30, 2012; the combination of the stainless business with the Finnish company Outokumpu was successfully
completed on December 28, 2012. Until the end of December 2012 the Group’s continuing operations comprised the remaining six business areas
and Corporate. At January 01, 2013 the Plant Technology and Marine Systems business areas were combined into the new Industrial Solutions
business area.

Interim Report 1st Quarter 2012/2013 Strategic development of the Group 03
Strategic development of the Group
ThyssenKrupp is a diversified industrial group firmly focused on the markets of the future. As a partner to its customers
the Group uses its leading engineering expertise to develop technological solutions for greater resource efficiency and
sustainable processes and products. With our strategic development program we are pursuing a holistic plan to move
the Group forward competitively and sustainably. The pillars of the program are continuous portfolio optimization,
changes to our corporate culture and our leadership and organizational structure, and a stronger performance
orientation. This will strengthen our financial base and give us freedom to strategically expand our business activities. In
the 1st quarter 2012/2013 we made further progress with our strategic development program.
Portfolio further optimized
The combination of Inoxum, the former Stainless Global business area, and the Finnish stainless steel manufacturer
Outokumpu was successfully completed on December 28, 2012. We have therefore implemented the portfolio measures
announced in May 2011 in the planned time frame. With the closing of the transaction ThyssenKrupp received €1 billion
cash and transferred external financial liabilities of Inoxum to Outokumpu. This led directly to a reduction in the Group’s
net financial debt. Outokumpu also took over pension obligations of Inoxum. ThyssenKrupp holds a 29.9% share in the
new company and has a financial receivable outstanding against Outokumpu.
The sale of Steel Americas is also proceeding to plan. Since November 2012 we have been giving a selection of
potential buyers the opportunity to analyze the plants in a due diligence process and submit binding purchase offers. We
are confident of finding a new way forward for both plants before the end of this fiscal year. The proceeds from the sale
will significantly reduce our net financial debt.
Despite the current financial restrictions we carried out targeted investment measures to stimulate growth in selective
areas in the reporting period. For example the Elevator Technology business area completed the takeover of the
business activities of AMCO Elevator Inc. based in Indianapolis/Indiana, USA on December 31, 2012.
Changes in the leadership system and leadership culture
On November 21, 2012 the Supervisory Board decided to appoint Oliver Burkhard to the Executive Board of
ThyssenKrupp AG effective February 01, 2013. From April 01, 2013 he will take on the function of labor director as
successor to Ralph Labonte, who is leaving the Company at March 31, 2013 for health reasons.
On December 10, 2012 the Supervisory Board followed the recommendation of the Personnel Committee and terminated
the appointments of the Executive Board members Dr. Olaf Berlien, Dr. Jürgen Claassen and Edwin Eichler effective
December 31, 2012. The decision was made in connection with the overall responsibility of the Executive Board for the
management of business and the leadership culture of the Group. Dr. Olaf Berlien, Dr. Jürgen Claassen and Edwin
Eichler were in agreement with the termination of their appointments and are thereby supporting the necessary changes
to the leadership system and the full-scale transformation of the leadership culture in the Group.
To strengthen our performance and enhance our leadership culture Groupwide, the Group leadership structure is
currently being modified. A matrix organizational structure is being introduced to optimize the way business units,
functions and regions work together. Roles, rules and responsibilities will be clarified, processes – where necessary –
redefined, and appropriate structural changes made. With the reorganization of the Executive Board effective January
01, 2013, structural changes have already been implemented. According to their function the business area
management board members now report directly to the Chief Executive Officer, the Chief Financial Officer, or the Chief
Human Resources Officer of ThyssenKrupp AG. This will permit more direct cooperation and more efficient
communication between the operating companies and Group management. At February 01, 2013 the corporate centers
were reduced and reorganized. In the future each corporate center will bear global responsibility for standards and
processes. The business areas will have central functions analogous with the structure at Group level to optimize
cooperation between the Group and business areas. In the coming months all further structures and processes will be
planned in detail also to include the regions. We plan to begin working in this new structure from October 2013.

04 Interim Report 1st Quarter 2012/2013 Strategic development of the Group
Efficiency advantages through combining of business units
At January 01, 2013 the business areas Plant Technology and Marine Systems were combined to form the new Industrial
Solutions business area. The business models of the two units are very similar. Both have strong capabilities in
engineering, project management, and purchasing. The combination allows each area to profit from the strengths of the
other and their management structures to be streamlined. Overall the Group’s successful project business will be further
strengthened. Also effective January 01, 2013 we combined the Group companies Fördertechnik and Polysius within the
Industrial Solutions business area. This will improve our position in the mining, minerals and cement markets served by
the two subsidiaries. It also eliminates unnecessary overlaps and creates efficiency advantages. With five business
areas in the future, the complexity of the Group will be reduced.
Corporate program impact
Since the introduction of impact in May 2011 numerous performance measures have been implemented. With “impact
300” we set ourselves the goal of achieving a positive EBIT effect of €300 million through performance measures in the
2011/2012 fiscal year. We exceeded this target and are now aiming even higher: In the three fiscal years up to and
including 2014/2015 we aim to achieve a cumulative positive EBIT effect of €2 billion through performance measures.
We want to achieve €500 million of this in the current fiscal year, and €750 million in each of the following two years.
The success of many impact measures and initiatives in the past demonstrates that the program has succeeded in
effectively mobilizing employees and managers. We are confident that we will also achieve the targets of “impact 2015”.
Optimization program at Steel Europe with a savings volume of €500 million
On the basis of a market and competition analysis, the new leadership team of the Steel Europe business area has
developed a package of measures to sustainably improve the steel unit’s profitability and competitiveness. The
optimization program plans to achieve a savings volume of €500 million by the 2014/2015 fiscal year. That means the
Steel Europe business area will make an important contribution to improving the performance of the Group as a whole.
The “BiC-reloaded” optimization program is a forceful initial step towards improving the position of the ThyssenKrupp
Group’s European steel operations in a difficult market environment and achieving the profitability and capital efficiency
required of all the Group’s business operations under the Strategic Way Forward.
Under the optimization program, the workforce of Steel Europe will be reduced in a socially responsible way by over
2,000 employees. As a result of possible disposals, the number of employees could be reduced by a further 1,800.

Interim Report 1st Quarter 2012/2013 Group review 05
Group review
Operational and strategic milestones achieved
In a difficult economic environment in the 1st quarter 2012/2013 (October 01 – December 31, 2012) ThyssenKrupp
achieved its operational and strategic goals.
At €229 million, adjusted EBIT from continuing operations was at the top end of the forecast range of around
€200 million. All business areas made a positive contribution to EBIT. With €351 million the capital goods businesses
accounted for a significantly higher share of adjusted EBIT than the materials businesses with €70 million. By contrast
adjusted EBIT from the corporate area including consolidation items came to €(192) million.
The continuing operations’ free cash flow amounted to €736 million, an improvement of around €2.1 billion on the prior-
year quarter reflecting our efforts to optimize the structure of our cash flow profile.
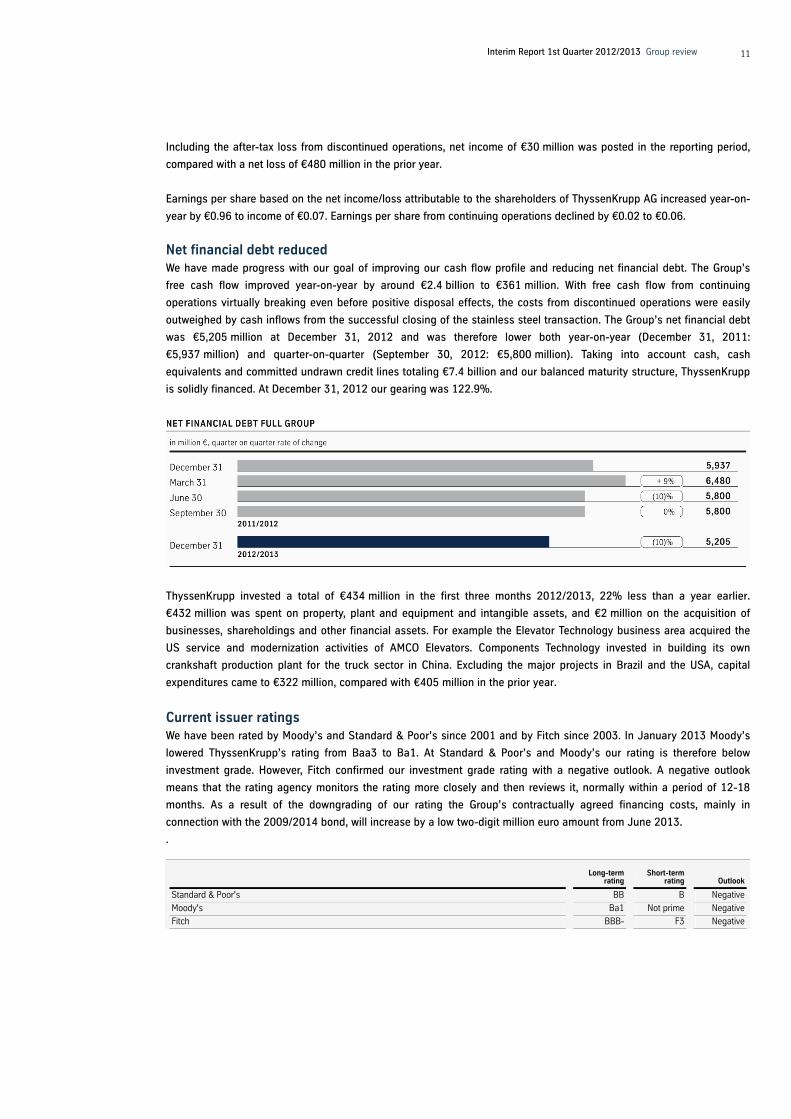
On this basis we succeeded in reducing net financial debt from €5.8 billion to €5.2 billion in the 1st quarter 2012/2013;
in the year-earlier quarter we reported an increase of around €2.2 billion.
The highlights for the first three months 2012/2013:
– Despite the divestments, order intake from continuing operations was almost level with the prior year at €9.6 billion.
The capital goods businesses reported an increase year-on-year. Plant Technology and Elevator Technology each
achieved new record orders. While plant orders more than doubled, elevator orders were up by a strong 10%. However,
weak market demand and low prices weighed on the materials business.
– Sales from continuing operations were 8% lower at €8.8 billion. Plant and elevator sales growth could not offset the
divestments and declines in other business areas.
– Adjusted EBIT from continuing operations came to €229 million, compared with €372 million in the prior-year quarter.
All business areas posted positive earnings; the biggest contribution came from Elevator Technology, which also
succeeded in improving its margin to 11%.
– EBIT from continuing operations was €219 million, down from €256 million in the prior-year period. EBIT margin was
almost unchanged at 2.5% compared with 2.7% a year earlier.
– Earnings per share from continuing operations decreased from €0.08 to €0.06.
– Including the discontinued operations Steel Americas and Stainless Global (sold at December 28, 2012) order intake
for the full Group in the first three months 2012/2013 came to €11.2 billion (prior year: €11.3 billion), and sales to
€10.4 billion (prior year: €11.1 billion). Adjusted EBIT increased from €25 million to €74 million.
– Free cash flow for the full Group improved by around €2.4 billion year-on-year to €361 million. The costs of
discontinued operations were significantly outweighed by cash inflows from the successful closing of the stainless
steel transaction.
– Net financial debt for the Group as a whole amounted to €5,205 million at December 31, 2012 and was therefore down
both year-on-year (December 31, 2011: €5,937 million) and quarter-on-quarter (September 30, 2012: €5,800 million).
Taking into account cash and cash equivalents and undrawn committed credit lines totaling €7.4 billion as well as our
balanced maturity structure, ThyssenKrupp is solidly financed. At December 31, 2012 gearing was 122.9%.

Interim Report 1st Quarter 2012/2013 Group review 06
Economic growth still weak
The economic environment remained extremely weak last year. Growth in global GDP slowed further to only 2.8% in
2012. There were significant differences in growth between the industrialized and the emerging countries.
The industrialized countries recorded GDP growth of only 1.3% in 2012. This reflected in particular the slowdown in the
euro zone, where economic output fell by a total of 0.6%. The economies of southern Europe in particular are in
recession due to the ongoing debt crisis. However, German GDP increased by a moderate 0.7% thanks to high exports
and rising consumer spending due to the positive labor market situation.
The US economy recovered only moderately in 2012. The only slow improvement on the labor market and the pressure
to consolidate public-sector budgets weighed on the economy. Nevertheless, a slight increase in consumer spending
and higher business spending contributed to growth of 2.2%. In Japan GDP grew by 1.6% due to disaster-related
reconstruction; the strong yen slowed the growth in exports.
In the emerging economies the previously mainly high growth rates slowed slightly. GDP growth in these countries fell to
5.0% overall in 2012, also due to the flat economy in Europe. Nevertheless, China and India still grew relatively strongly
at 7.8% and 5.6% respectively.
Situation in the sectors mixed
Flat carbon steel – The weak economic climate also weighed on the international steel markets. Based on provisional
estimates, global demand for finished steel increased by only 2% to roughly 1.42 billion metric tons in 2012. Global
crude steel output rose by 1% to 1.55 billion metric tons; in the 4th quarter 2012 output showed a year-on-year increase
of 3%. The smaller increase in global steel consumption was mainly due to slower growth in China, where demand
climbed by only 3% to 654 million tons in 2012. EU steel demand fell by 9% to 143 million tons. In Germany demand
decreased by 7% to 38.4 million tons. German crude steel production at 42.7 million tons was 4% down from the albeit
very high prior-year level. US finished steel demand increased by 8% to 96 million tons, mainly due to buoyant auto
industry activity.

Interim Report 1st Quarter 2012/2013 Group review 07
Demand on the European flat steel market showed a sharp decline in 2012. Above all in the southern European countries
demand from key customer sectors such as the automotive and construction industries slumped dramatically. Strongly
export-oriented customers in Germany too recently reported lower utilization levels. The fall in demand was exacerbated
by a large inventory drawdown. In the final quarter 2012 flat steel use in the EU is expected to show a further year-on-
year decline. However, the economic cycle may have reached its low point. With imports remaining moderate, European
flat steel suppliers recently recorded a slight recovery in orders. Prices on the European spot markets have also
bottomed out. However the moderate upturn towards the end of the reporting period was mainly due to a significant rise
in iron ore prices. After previously dropping sharply, prices in North America also recovered slightly in the course of the
4th quarter 2012. Alongside the automotive and energy industries, the housing construction sector recently generated
positive impetus again for steel demand.
Automotive – Global automobile production increased by an estimated 6% to just under 79 million cars and light trucks
in 2012. However there were very marked regional differences. In the USA, strong pent-up demand as a result of the
aging vehicle fleet led to a 16% increase in production to 9.8 million vehicles. Sales in the USA climbed 13% to
14.4 million vehicles; 4th-quarter sales showed a year-on-year rise of 10% to 3.6 million units. China produced an
estimated 17.3 million vehicles in 2012, 8% more than a year before. After the disaster-related slump the year before,
Japan increased its production by 19% to 9.4 million vehicles.
In western Europe an estimated 14.0 million cars and light trucks rolled off the production lines in 2012, almost 8%
fewer than the year before. Particularly in southern Europe sales declined sharply as a result of the debt crisis. New
registrations in the EU decreased by 8% to 12.1 million cars altogether, and by 10% to 2.7 million units in the 4th
quarter 2012. The German car market performed better by comparison. For the full year new registrations were down by
3% at 3.1 million vehicles, in the 4th quarter 2012 they slipped 6% to 0.7 million vehicles. Output remained virtually
unchanged; however, due to statistical changes a 7% decline in production to 5.7 million cars and light trucks will be
reported.
Machinery – Due to weaker capital spending in many countries the sector was unable to sustain the prior year’s very
high rate of expansion in 2012. Growth in machinery production slowed to 6% in the USA and to 12% in China.
Production in Japan showed a slight decline of 1%.
German machinery manufacturers increased their output by 1% in 2012, but only thanks to a high order backlog from
the prior year. New orders from the domestic market fell by 8%, while foreign orders remained stable in the course of the
year. In the 4th quarter 2012 the order situation in the German machinery sector brightened. Overall orders increased by
3% year-on-year. Demand for elevators and escalators in 2012 was down from the year before .
Construction – The construction sector in the industrialized countries was mainly weak in 2012. While the US property
market stabilized at a low level in the course of the year, there were further declines in the countries of southern Europe.
The emerging countries China and India achieved higher growth in construction output, with increases of 7.9% and 6.8%
respectively.
The German construction industry was in robust shape in 2012. Housing construction in particular showed strong
growth, benefiting from low mortgage rates and from the uncertainties emanating from the financial markets. German
construction output increased by an estimated 2% in 2012.

Interim Report 1st Quarter 2012/2013 Group review 08
ThyssenKrupp: Orders stable, sales lower
Against the background of the continuing difficult economic situation, ThyssenKrupp delivered a robust performance
overall in the 1st quarter 2012/2013. Order intake was down only slightly year-on-year while sales showed a steeper
decline mainly for cyclical reasons but also on account of disposals.
CONTINUING OPERATIONS IN FIGURES
1st quarter ended
Dec. 31, 2011
1st quarter ended
Dec. 31, 2012 Change in %
Order intake million € 9,677 9,642 0
Sales million € 9,596 8,837 (8)
EBITDA million € 676 458 (32)
EBIT million € 256 219 (14)
EBIT margin % 2.7 2.5 —
Adjusted EBIT million € 372 229 (38)
Adjusted EBIT margin % 3.9 2.6 —
EBT million € 102 66 (35)
Adjusted EBT million € 218 76 (65)
Income/(loss) net of taxes (attributable to ThyssenKrupp AG's shareholders) million € 41 29 (29)
Basic earnings per share € 0.08 0.06 (25)
Operating cash flow million € (1,327) 78 ++
Free cash flow million € (1,330) 736 ++
Employees (Dec. 31) 155,601 150,860 (3)
In the first three months of the fiscal year the continuing operations achieved new orders of €9.6 billion, roughly level
with the year before. Growth was achieved in Plant Technology and Elevator Technology, with both reporting record
orders. However, orders for industrial components and materials were down, reflecting reduced demand and disposals.
Lower volumes and above all lower prices additionally weighed on steel business in Europe and global materials sales.
Sales from continuing operations decreased 8% year-on-year to €8.8 billion. Growth achieved at Elevator Technology
and Plant Technology could not offset weaker sales in the other business areas.
Including the discontinued operations Steel Americas and Stainless Global, order intake in the Group in the first three
months 2012/2013 slipped 1% to €11.2 billion, sales were 7% lower at €10.4 billion.
Adjusted EBIT €229 million
In a difficult economic environment 1st quarter adjusted EBIT from continuing operations decreased to €229 million
from €372 million a year earlier. Nevertheless all business areas reported positive earnings, with the largest contribution
coming from the Elevator Technology business area.

Interim Report 1st Quarter 2012/2013 Group review 09
Adjusted EBIT from continuing operations was lower year-on-year. In the more cyclical materials operations this was
chiefly the result of weaker volumes and in particular weaker prices. In the capital goods businesses, profits dipped
temporarily at Plant Technology and Marine Systems, and were lower year-on-year at Components Technology as a
result of disposals and reduced demand. However, Elevator Technology reported significantly higher earnings and an
improved margin of 11%. Overall the capital goods businesses delivered a significantly larger contribution to adjusted
EBIT (€351 million) than the materials businesses (€70 million). By contrast adjusted EBIT from Corporate including
consolidation items came to €(192) million.
Adjusted EBIT margin from continuing operations decreased year-on-year from 3.9% to 2.6%.
Including Stainless Global and Steel Americas the Group’s adjusted EBIT increased from €25 million to €74 million, and
adjusted EBIT margin from 0.2% to 0.7%.
Special items with negligible effect on EBIT from continuing operations
In the 1st quarter 2012/2013 net positive special items contributed €10 million to EBIT from continuing operations.
Special items were mainly reported at Corporate for severance payments to former Executive Board members. They also
include restructuring expenses, in particular at the Materials Services business area.
SPECIAL ITEMS FROM CONTINUING OPERATIONS IN MILLION €
1st quarter ended
Dec. 31, 2011
1st quarter ended
Dec. 31, 2012 Change in %
EBIT 256 219 (14)
+/- Disposal losses/gains (52) (5) 90
+ Restructuring expense 32 13 (59)
+ Impairment 155 (1) --
+ Other non-operating expense 9 6 (33)
- Other non-operating income (28) (3) 89
Adjusted EBIT 372 229 (38)
EBT from continuing operations lower year-on-year
In the reporting period the continuing operations achieved EBIT of €66 million, compared with €102 million a year earlier.
All operating business areas generated positive earnings. The materials operations achieved unconsolidated earnings of
€37 million, the capital goods businesses €275 million. Elevator Technology and Marine Systems significantly increased
their earnings contributions year-on-year. The Corporate area reported a loss before taxes of €163 million. Including the
discontinued operations the Group as a whole reports EBT of €40 million (prior year: €(514) million). Net income for the
full Group came to €30 million, up €510 million from the prior year.

Interim Report 1st Quarter 2012/2013 Group review 10
MILLION €
1st quarter ended
Dec. 31, 2011
1st quarter ended
Dec. 31, 2012
Change in %
Adjusted EBIT Group 25 74 196
Special items (382) 130 ++
EBIT - Group (357) 204 ++
- Depreciation of capitalized borrowing costs eliminated in EBIT (11) (3) 73
+ Interest income 314 130 (59)
- Interest expense (459) (284) 38
- Items of interest income, net assigned to EBIT based on economic classification (1) (26) --
+ Items of interest expense, net assigned to EBIT based on economic classification 0 19 —
EBT - Group (514) 40 ++
- EBT Steel Americas 285 90 (68)
- EBT Stainless Global 331 (64) --
EBT from continuing operations 102 66 (35)
Analysis of the statement of income
At €8,837 million, net sales from continuing operations in the 1st quarter 2012/2013 were €759 million or 8% lower than
in the corresponding prior-year period. The cost of sales from continuing operations decreased by altogether €658 million
or 8% in parallel with the fall in sales, mainly reflecting a sales-related reduction in materials expense. Gross profit from
continuing operations decreased to €1,386 million, while gross margin remained unchanged at 16%.
The €10 million rise in research and development cost from continuing operations was chiefly attributable to the Plant
Technology and Steel Europe business areas.
Selling expenses from continuing operations decreased by €5 million, mainly reflecting lower expenses for sales-related
freight and insurance charges. General and administrative expenses from continuing operations fell by €10 million,
primarily due to lower restructuring expenses.
The €107 million reduction in other expenses from continuing operations was mainly due to the absence of the goodwill
impairment charges recognized in the prior-year quarter in connection with the sale of the civil operations of
Blohm + Voss.
Other gains and losses attributable to continuing operations were €60 million lower than a year earlier. This mainly
reflects the absence of the gains on the disposal of the Xervon group and the Brazilian Automotive Systems operations
recognized in the 1st quarter 2011/2012.
The €194 million reduction in financing income was caused primarily by exchange rate effects in connection with finance
transactions. The €203 million lower financing expense from continuing operations mainly resulted from currency losses
in connection with finance transactions.
Tax expense from continuing operations of €33 million resulted in an effective tax charge of 50% in the reporting period,
level with a year earlier.
After taking into account income taxes, the profit from continuing operations came to €33 million.
The after-tax loss from discontinued operations decreased by a substantial €531 million to €3 million. This is mainly the
result of a €265 million impairment charge for Stainless Global recognized in the prior-year quarter set against a
preliminary profit of €146 million from the disposal of the stainless steel business to Outokumpu provisionally recognized
in the reporting period pending completion of the purchase price allocation in connection with the 29.9% share in
Outokumpu.
Interim Report 1st Quarter 2012/2013 Group review 11
Including the after-tax loss from discontinued operations, net income of €30 million was posted in the reporting period,
compared with a net loss of €480 million in the prior year.
Earnings per share based on the net income/loss attributable to the shareholders of ThyssenKrupp AG increased year-on-
year by €0.96 to income of €0.07. Earnings per share from continuing operations declined by €0.02 to €0.06.
Net financial debt reduced
We have made progress with our goal of improving our cash flow profile and reducing net financial debt. The Group’s
free cash flow improved year-on-year by around €2.4 billion to €361 million. With free cash flow from continuing
operations virtually breaking even before positive disposal effects, the costs from discontinued operations were easily
outweighed by cash inflows from the successful closing of the stainless steel transaction. The Group’s net financial debt
was €5,205 million at December 31, 2012 and was therefore lower both year-on-year (December 31, 2011:
€5,937 million) and quarter-on-quarter (September 30, 2012: €5,800 million). Taking into account cash, cash
equivalents and committed undrawn credit lines totaling €7.4 billion and our balanced maturity structure, ThyssenKrupp
is solidly financed. At December 31, 2012 our gearing was 122.9%.
ThyssenKrupp invested a total of €434 million in the first three months 2012/2013, 22% less than a year earlier.
€432 million was spent on property, plant and equipment and intangible assets, and €2 million on the acquisition of
businesses, shareholdings and other financial assets. For example the Elevator Technology business area acquired the
US service and modernization activities of AMCO Elevators. Components Technology invested in building its own
crankshaft production plant for the truck sector in China. Excluding the major projects in Brazil and the USA, capital
expenditures came to €322 million, compared with €405 million in the prior year.
Current issuer ratings
We have been rated by Moody’s and Standard & Poor’s since 2001 and by Fitch since 2003. In January 2013 Moody’s
lowered ThyssenKrupp’s rating from Baa3 to Ba1. At Standard & Poor’s and Moody’s our rating is therefore below
investment grade. However, Fitch confirmed our investment grade rating with a negative outlook. A negative outlook
means that the rating agency monitors the rating more closely and then reviews it, normally within a period of 12-18
months. As a result of the downgrading of our rating the Group’s contractually agreed financing costs, mainly in
connection with the 2009/2014 bond, will increase by a low two-digit million euro amount from June 2013.
.
Long-term
rating Short-term
rating Outlook
Standard & Poor's BB B Negative
Moody's Ba1 Not prime Negative
Fitch BBB- F3 Negative

12 Interim Report 1st Quarter 2012/2013 Business area review
Business area review
Components Technology
COMPONENTS TECHNOLOGY IN FIGURES
1st quarter ended
Dec. 31, 2011
1st quarter ended
Dec. 31, 2012 Change in %
Order intake million € 1,778 1,324 (26)
Sales million € 1,753 1,345 (23)
EBIT million € 169 43 (75)
EBIT margin % 9.6 3.2 —
Adjusted EBIT million € 103 42 (59)
Adjusted EBIT margin % 5.9 3.1 —
Employees (Dec. 31) 30,936 27,789 (10)
The business area supplies a range of high-tech components for general engineering, construction equipment and wind
turbines. In the auto sector our activities are focused on crankshafts, camshafts, steering systems, dampers, springs,
stabilizers and the assembly of axle modules.
Order intake and sales lower
At Components Technology the disposals of the previous fiscal year resulted in a structurally lower volume of business
in the 1st quarter 2012/2013. Order intake was 26% down from the prior-year quarter at €1.3 billion. Excluding the
disposals, order intake was 9% lower. The economic slowdown, particularly in western Europe, impacted demand for
auto and truck components. The midsize and premium car segments were also affected. By contrast in the USA, Brazil
and China the automotive business showed a positive performance. From the beginning of the new fiscal year the heavy
truck market declined sharply in particular in Europe and the USA, and also in Brazil and China there was no noticeable
recovery in demand. In the wind energy sector the uncertain investment climate, caused in part by the debate
surrounding the expiry of subsidy programs in the USA, resulted in project deferrals. In China further delays in
connecting existing wind turbines to the grid led to weakened demand and orders for component supplies. In western
Europe and China slower demand for infrastructure projects also impacted sales of building machinery components.
In line with the trend in orders, sales decreased year-on-year by 23% to €1.3 billion on account of the disposals.
Excluding the disposals, sales were 6% lower.
Earnings down
At €43 million, Components Technology’s EBIT in the reporting period was down from the high prior-year figure, which
included positive special items relating to the proceeds from the sale of the chassis component manufacturer
ThyssenKrupp Automotive Systems Industrial do Brasil and the once-only savings for healthcare at the US foundry
Waupaca. Adjusted EBIT was likewise lower year-on-year at €42 million. This reflected the absence of Waupaca’s
operating profit, the slowdown in the western European market for car and heavy truck components, and the ramp-up of
the new plants in China and India. Added to this was continued weak demand in the wind energy and infrastructure
sectors. Adjusted EBIT margin fell to 3.1%.

Interim Report 1st Quarter 2012/2013 Business area review 13
Elevator Technology
ELEVATOR TECHNOLOGY IN FIGURES
1st quarter ended
Dec. 31, 2011
1st quarter ended
Dec. 31, 2012 Change in %
Order intake million € 1,466 1,616 10
Sales million € 1,348 1,532 14
EBIT million € 113 171 51
EBIT margin % 8.4 11.2 —
Adjusted EBIT million € 142 169 19
Adjusted EBIT margin % 10.5 11.0 —
Employees (Dec. 31) 46,581 47,897 3
The Elevator Technology business area supplies passenger and freight elevators, escalators and moving walks,
passenger boarding bridges, stair and platform lifts as well as service for the entire product range. Over 900 locations
worldwide form a tight-knit sales and service network that keeps us close to customers.
Two-digit growth in orders and sales
Elevator Technology continued its successful business performance in the 1st quarter 2012/2013. Both orders and sales
showed significant growth. Order intake was 10% higher year-on-year at €1.6 billion. In particular on the Chinese market
for new installations and on the North and South American markets, order intake continued to show a very positive
trend. The level of business in Europe was steady overall, with difficult conditions on some southern European markets,
such as Spain, being offset by positive trends on other markets.
Sales in the 1st quarter 2012/2013 were 14% higher at €1.5 billion. This pleasing growth was based on very positive
business with new installations on the Asian markets. Some sizable sales increases were also achieved in North and
South America. Overall volumes in both the new installations and the service and modernization businesses grew
continuously. In the service business the number of maintenance units under contract increased in all key regions.
Adjusted EBIT €169 million
Elevator Technology achieved EBIT of €171 million in the 1st quarter 2012/2013. Adjusted EBIT came to €169 million
and was therefore higher than in the 1st quarter of the prior year. This improvement resulted from both increased sales
and positive effects from the restructuring measures initiated in the last fiscal year. Adjusted EBIT margin was increased
to 11.0%.
Growth and investment program continued
To strengthen Elevator Technology’s competitiveness even further, we continued the growth and investment program in
the reporting period. The elevator plant in Neuhausen near Stuttgart is being expanded into a state-of-the-art
technology park. Central to this will be a development center for high-speed elevators. In addition a new technology and
customer center is to be built.

Interim Report 1st Quarter 2012/2013 Business area review 14
Plant Technology PLANT TECHNOLOGY IN FIGURES
1st quarter ended
Dec. 31, 2011
1st quarter ended
Dec. 31, 2012 Change in %
Order intake million € 871 1,825 110
Sales million € 943 1,001 6
EBIT million € 125 110 (12)
EBIT margin % 13.3 11.0 —
Adjusted EBIT million € 125 110 (12)
Adjusted EBIT margin % 13.3 11.0 —
Employees (Dec. 31) 13,786 14,359 4
The Plant Technology business area is a leading international provider of specialized engineering and construction
services with strong innovative capabilities. The product portfolio includes chemical plants and refineries, equipment for
the cement industry, innovative solutions for the mining and extraction of raw materials, and production systems for the
auto industry. The business area’s equipment and processes open up new possibilities for environmental protection and
sustainability. At January 01, 2013 the Plant Technology and Marine Systems business areas were combined into the
new Industrial Solutions business area. More information on this is provided in the section “Strategic development of the
Group”.
Steep rise in orders, continued strong sales
Plant Technology delivered an outstanding performance particularly in chemical plant construction. In the first reporting
three months new orders with a total value of €1.8 billion were won, with the result that order intake more than doubled
from the prior-year figure of €871 million. Due to the low price of gas in North America, demand for fertilizer plants is
currently high. As a result ThyssenKrupp’s plant technology business succeeded in winning a mega-order in the USA for
two fertilizer plants worth €1 billion. The low price of gas will continue to open up opportunities for further chemical
plant construction projects in the North America over the long term. Demand for production systems for the automotive
industry and products for the mining and minerals sector was down slightly from the high prior-year level. Although the
market for cement plants is relatively stable overall, project deferrals have recently been observed.
In the 1st quarter 2012/2013 Plant Technology’s sales were 6% higher than a year earlier at €1.0 billion, confirming the
stable trend. The high order backlog of €7.4 billion at December 31, 2012 continues to secure a good workload.
EBIT only slightly down from high prior-year level
With EBIT of €110 million in the 1st quarter 2012/2013, the high level of the prior year was not quite reached due to
billing technicalities. EBIT margin slipped to 11.0%. Since there were no special items, adjusted EBIT and adjusted EBIT
margin were the same.

Interim Report 1st Quarter 2012/2013 Business area review 15
Marine Systems MARINE SYSTEMS IN FIGURES
1st quarter ended
Dec. 31, 2011
1st quarter ended
Dec. 31, 2012 Change in %
Order intake million € 222 178 (20)
Sales million € 366 305 (17)
EBIT million € (116) 31 ++
EBIT margin % (31.7) 10.2 —
Adjusted EBIT million € 39 30 (23)
Adjusted EBIT margin % 10.7 9.8 —
Employees (Dec. 31) 5,301 3,817 (28)
Marine Systems is focused exclusively on naval shipbuilding. The business area’s core activities include the
development, construction and refit of submarines and naval surface vessels as well as extensive associated services.
After the completion of the sale of the civil shipbuilding operations in the prior year, work was started at the beginning of
the reporting year on further streamlining the organization of the naval shipbuilding operations and preparing the unit for
incorporation into the new Industrial Solutions business area. More information on this is provided in the section
“Strategic development of the Group”.
Order intake and sales holding up well
The markets of Marine Systems continue to perform positively; there are a number of promising projects worldwide. At
December 31, 2012 Marine Systems’ order backlog reached a record level of €9 billion.
In the 1st quarter 2012/2013 order intake amounted to €178 million. Major orders received included the modernization
of two type U206 submarines acquired by the Republic of Colombia from the German navy, and orders from the Swedish
navy. On an adjusted basis order intake was therefore higher year-on-year; the €222 million reported in the comparable
prior-year quarter included orders of €94 million in civil shipbuilding.
Sales came to €305 million. The prior-year figure of €366 million likewise contained the sales of the since sold civil
shipbuilding operations in the amount of €89 million.
Earnings at good prior-year level
Marine Systems’ EBIT at €31 million and adjusted EBIT at €30 million were level with the prior-year quarter minus the
civil shipbuilding operations. Adjusted EBIT margin was 9.8%, equaling the good prior-year level (without civil
shipbuilding).
German naval shipbuilding operations combined
To further optimize our organizational structure, we began combining our naval shipbuilding sites in Germany at the start
of the current fiscal year. This process was completed at the beginning of 2013. As a full-range supplier we provide
customers with naval vessels from a single source as well as extensive services. Our naval shipbuilding sites in Germany
are now combined under the name ThyssenKrupp Marine Systems GmbH.

Interim Report 1st Quarter 2012/2013 Business area review 16
Materials Services MATERIALS SERVICES IN FIGURES
1st quarter ended
Dec. 31, 2011
1st quarter ended
Dec. 31, 2012 Change in %
Order intake million € 3,201 2,765 (14)
Sales million € 3,145 2,815 (10)
EBIT million € 40 36 (10)
EBIT margin % 1.3 1.3 —
Adjusted EBIT million € 40 40 0
Adjusted EBIT margin % 1.3 1.4 —
Employees (Dec. 31) 27,910 26,280 (6)
With 500 locations in more than 30 countries the Materials Services business area specializes in materials distribution
including technical services.
Further decline in demand – continued price and margin pressure
Materials Services achieved order intake of almost €2.8 billion in the 1st quarter 2012/2013, down 14% from the
corresponding prior-year period. Sales were 10% lower at €2.8 billion; on a like-for-like basis, excluding the Xervon
group from the prior-year figures, sales fell by 7%. In the warehousing business sales of carbon steel, stainless steel,
tubes and nonferrous metals decreased by 1.5% to just over 1.2 million tons.
The decline in workloads and demand in the main customer industries continued, the economic slowdown was
increasingly noticeable. Warehouse sales of metals dipped slightly year-on-year, while demand fell more steeply above
all towards the end of the quarter. This was the case in all markets and regions with the exception of North America.
Price and margin pressure was universally high. This also affected our international direct-to-customer and project
business. Intense competition and increasing order deferrals were the order of the day. However, our materials and
service operations for the aerospace industry achieved further growth. Plastics sales mirrored the performance of
metals.
Demand for metallurgical raw materials was impacted by numerous production cutbacks and stoppages in the steel
industry. Thanks to several special projects in the 1st quarter, capacity utilization and sales of our steel mill services
were almost maintained at the prior-year level.
EBIT stable at prior-year level
Despite the significant slide in sales, adjusted EBIT was level with the year-earlier period at €40 million. Cost reduction
measures at all levels, particularly in logistics and administration, contributed to this. After special items, EBIT was down
from the year before at €36 million; as a result EBIT margin in the traditionally weaker 1st quarter remained at 1.3%;
adjusted EBIT margin came to 1.4%.

Interim Report 1st Quarter 2012/2013 Business area review 17
Steel Europe STEEL EUROPE IN FIGURES
1st quarter ended
Dec. 31, 2011
1st quarter ended
Dec. 31, 2012 Change in %
Order intake million € 2,705 2,403 (11)
Sales million € 2,530 2,253 (11)
EBIT million € 102 29 (72)
EBIT margin % 4.0 1.3 —
Adjusted EBIT million € 102 30 (71)
Adjusted EBIT margin % 4.0 1.3 —
Employees (Dec. 31) 28,273 27,629 (2)
The Steel Europe business area brings together the Group’s flat carbon steel activities, mainly in the European market.
Premium flat products are supplied to customers in the auto industry and other steel-using sectors. The range also
includes products for attractive specialist markets such as the packaging industry.
Orders and sales lower on account of selling prices
The persistent market weakness above all in the euro zone continued to impact the performance of the Steel Europe
business area in the 1st quarter 2012/2013. Order intake was down 11% year-on-year at €2.4 billion. Since order
volumes increased slightly, the decline was due to the lower prices at which these orders were booked.
Sales were likewise 11% lower at €2.3 billion. This too primarily reflects the softening of average selling prices against
the prior year. However, compared with previous months prices remained largely stable. Overall shipments were roughly
equal with the year before. Lower sales to the automotive industry and its suppliers, the transformer sector and other
industrial customers were offset by increased deliveries to the packaging and tubes industries. Shipments to distributors
and steel service centers were also higher year-on-year.
Production cutbacks continue
Crude steel production including supplies from Hüttenwerke Krupp Mannesmann at 2.6 million tons was 7% lower than
in the prior-year quarter when blast furnace 9 was still in operation. With demand remaining weak, it has not yet been
necessary to restart the newly relined unit. Lower operating levels also remained necessary in the downstream rolling
and coating operations. Short time working continued at numerous plants.
EBIT down sharply
EBIT fell to €29 million and EBIT margin to 1.3% in the reporting period. The main reason for this drop in earnings was
the persistent market weakness in Europe with selling prices down from the prior year. The Groupwide improvement
program impact was again only partly able to offset the negative cost and market effects. Special items had virtually no
effect on earnings: Adjusted EBIT was €30 million, adjusted EBIT margin 1.3%.

Interim Report 1st Quarter 2012/2013 Business area review 18
Corporate at ThyssenKrupp AG Corporate comprises the Group’s head office including management of the business areas. It also includes the business
services activities in the areas of finance, communications, IT and human resources, as well as non-operating real estate
and inactive companies. Sales of services by Corporate companies to Group companies in the 1st quarter 2012/2013
came to €55 million, up from €35 million a year earlier.
EBIT amounted to €(112) million, compared with €(99) million in the prior-year period. Adjusted EBIT came to €(97)
million, compared with €(101) the year before.
Steel Americas (discontinued operation) STEEL AMERICAS IN FIGURES
1st quarter ended
Dec. 31, 2011
1st quarter ended
Dec. 31, 2012 Change in %
Order intake* million € 583 560 (4)
Sales* million € 498 488 (2)
EBIT million € (288) (87) 70
EBIT margin % — — —
Adjusted EBIT million € (288) (87) 70
Adjusted EBIT margin % — — —
Employees (Dec. 31) 4,081 3,990 (2)
* including internal orders/sales within the Group
With its steelmaking and processing plants in Brazil and the USA, the Steel Americas business area is tapping into the
North American market for premium flat steel products. As part of the strategic development program, ThyssenKrupp is
to dispose of these plants. More information on this is provided in the section “Strategic development of the Group”. At
September 30, 2012 Steel Americas met the requirements for classification as a discontinued operation under IFRS.
Order intake and sales lower due to selling prices
In the 1st quarter 2012/2013 the Steel Americas business area’s order intake was 4% down from a year earlier at
€560 million. In a difficult business environment sales at €488 million were likewise 2% lower year-on-year as a result of
selling prices, while production and shipments showed a slight overall increase. The steel mill in Brazil produced around
0.9 million tons of slabs in the 1st quarter 2012/2013 which it supplied to the US processing plant, Steel Europe and
customers in Brazil and North America. Altogether the business area sold 0.6 million tons of flat steel to North American
customers and 0.1 million tons of slabs on the Brazilian and North American markets, and supplied 0.2 million tons of
slabs to Steel Europe.
Steel Americas made further progress with customer certification. The certification processes were rigorously expedited
particularly in the automotive industry and almost completed in the pipe & tube sector.
EBIT improved from year earlier
EBIT improved in the reporting period by €201 million to €(87) million, there were no special items. The improvement
resulted from progress made on the operational side – in particular with cost optimization, the amount and composition
of reducing agents consumed, and an increased focus on customer segments with stronger margin potential. Also, the
classification as a discontinued operation resulted in the absence of depreciation expenses for non-current assets,
which in the first three months 2012/2013 would have come to €111 million; these were reported in the earnings of the
prior-year quarter in the amount of €91 million. The main reason for the continued negative earnings was the difficult
business environment on the North American market with an unsatisfactory price level above all in service center
business, which is particularly important for the startup. In addition the inefficient utilization of capacities in the
prevailing climate also weighed on earnings.

Interim Report 1st Quarter 2012/2013 Business area review 19
Technical ramp-up of Brazilian steel mill completed
The technical ramp-up of the integrated iron and steel mill in Brazil was completed in the 2011/2012 fiscal year. The
final hot-dip galvanizing line at the US processing plant is ready to start operation depending on market demand.
Stainless Global (discontinued operation) STAINLESS GLOBAL IN FIGURES
1st quarter ended
Dec. 31, 2011
1st quarter ended
Dec. 31, 2012 Change in %
Order intake* million € 1,372 1,319 (4)
Sales* million € 1,438 1,402 (3)
EBIT million € (321) 72 ++
EBIT margin % (22.3) 5.1 —
Adjusted EBIT million € (56) (69) (23)
Adjusted EBIT margin % (3.9) (4.9) —
Employees (Dec. 31) 11,630 0 --
* including internal orders/sales within the Group
The discontinued operation Stainless Global, which was sold at December 28, 2012, produces premium stainless steel
flat products and high-performance materials such as nickel alloys, titanium and zirconium. The business now belongs
to the Finnish stainless steel producer Outokumpu. More information is provided in the section “Strategic development
of the Group”.
Order intake and sales lower
Stainless Global’s business performance in the 1st quarter 2012/2013 was impacted by declining prices for key raw
materials such as nickel. The lower prices for raw materials caused alloy surcharges to slip, and order intake fell by 4%
year-on-year to €1.3 billion.
Due to the lower price level and reduction in alloy surcharges, sales too were down 3% at €1.4 billion.
EBIT higher year-on-year
Including provisional deconsolidation income of €146 million, EBIT improved in the reporting quarter to €72 million, EBIT
margin to 5.1%. The continued difficult market environment for stainless steel flat products and the associated price
pressure weighed on the generally weaker earnings situation. In addition the lower nickel price had a negative impact.
Earnings also include the losses from the ramp-up of the new US stainless steel mill. At Stainless Global, too, the
classification as a discontinued operation meant that depreciation no longer had to be recognized for non-current
assets. In the first three months 2012/2013 these expenses would have amounted to €52 million; in the prior-year
quarter depreciation of €46 million was reported.
Adjusted EBIT amounted to €(69) million compared with €(56) million a year earlier, adjusted EBIT margin slipped to
(4.9)%. The decline in earnings was mainly due to ramp-up costs for the new facility in the USA; without this adjusted
EBIT came to €(24) million.
Stainless steel mill in the USA on schedule
At the US site in Calvert construction work and the ramp-up of already commissioned equipment is continuing as
planned. The ramp-up of the hot-rolled annealing and pickling line in the cold-rolling mill is almost complete. The
acceptance test certificate for the hot band annealing line was issued in December 2012. The ramp-up of the 1 million
ton per year capacity melt shop also began as planned in December 2012. Until the melt shop is fully ramped up the
location will continue to be supplied with hot band and slabs from the European mills.

Interim Report 1st Quarter 2012/2013 Business area review 20
ThyssenKrupp Group FULL GROUP
1st quarter ended
Dec. 31, 2011
1st quarter ended
Dec. 31, 2012 Change in %
Order intake million € 11,260 11,202 (1)
Sales million € 11,138 10,412 (7)
EBITDA million € 412 445 8
EBIT million € (357) 204 ++
EBIT margin % (3.2) 2.0 —
Adjusted EBIT million € 25 74 196
Adjusted EBIT margin % 0.2 0.7 —
EBT million € (514) 40 ++
Adjusted EBT million € (131) (90) 31
Net income/(loss) (attributable to ThyssenKrupp AG's shareholders) million € (460) 35 ++
Basic earnings per share € (0.89) 0.07 ++
Operating cash flow million € (1,815) (140) 92
Free cash flow million € (2,054) 361 ++
Employees (Dec. 31) 171,312 154,850 (10)
Including Steel Americas and Stainless Global, order intake for the Group as a whole came to €11.2 billion, 1% lower
than a year earlier. Sales slipped 7% to €10.4 billion. EBIT for the full Group improved from €(357) million to
€204 million. Accordingly EBIT margin increased from (3.2)% to 2.0%.

Interim Report 1st Quarter 2012/2013 ThyssenKrupp stock / Innovations 21
ThyssenKrupp stock
As a key pillar of the strategic development program, our portfolio measures substantially reduce capital employed in
the Group, particularly in our materials businesses. Together with structural improvements in our earnings and cash flow
profile and a higher proportion of more stable capital goods businesses, this should increase the potential of our stock
and improve our capital market valuation.
The visible progress made with the implementation of the Group’s strategic development program had a positive
influence on the performance of ThyssenKrupp’s stock. In addition news of steel price increases in Europe and the USA
boosted steel stocks. The subject of the debt crisis in Europe began to recede into the background.
In this environment ThyssenKrupp’s stock outperformed the DAX and DJ STOXX indices in the 1st quarter 2012/2013. In
particular the announcement of the boardroom restructuring, the publication of the annual financial statements, and the
closing of the stainless disposal in December 2012 were recognized by the capital market as visible signs of our
accelerated culture change and increased transaction confidence.
Towards the end of the 1st quarter on December 28, 2012 ThyssenKrupp’s share price stood at €17.76, 7% higher than
on September 30, 2012. In the same period the DAX and DJ STOXX indices gained 5.5% and 4.2% respectively.
Innovations
Innovations and technical progress are key factors in managing global growth and using finite resources in a sustainable
way. The following examples represent a selection of the many innovations in which our researchers and developers use
their engineering expertise to create new and resource-efficient products for our customers.
Vertical mill with individually driven rollers for the cement industry
The cement industry is responsible for 5% of global CO2 emissions. Mega trends such as population growth and
urbanization will lead to further rising demand for cement and as a result increasing emissions in the future.

Interim Report 1st Quarter 2012/2013 Innovations / Employees 22
One way of reducing these emissions is to produce high-quality cements which can be mixed with additives such as
limestone, granulated blast furnace slag or fly ash and still deliver the same concrete strength as conventional cement.
Waste products from other industrial processes such as steel manufacture are often used as additives. This places high
demands on the grinding systems, so that vertical roller mills currently in use featuring a centrally driven table are now
reaching their mechanical limits. The solution to this problem is the new QUADROPOL-RD grinding system from the Plant
Technology business area: Instead of a single drive system and a large central gear unit, it features individually driven
rollers – similar to an all-wheel drive vehicle. RD stands for “Roller Drive”. Significantly smaller standard gear units can
now be used to transmit the grinding forces. This enhances reliability and substantially reduces energy and water
consumption.
Assembled rotor shaft for electric vehicles
Our camshaft specialists in the Components Technology business area have adapted Presta’s proven joining process for
assembled camshafts for use on a rotor shaft for electric motors. This is the first time this technique – a combination of
positive and non-positive joining – has been used in the area of electric mobility.
Electric motors for battery-powered vehicles generally have to be extremely powerful but of low size and weight. The new
rotor shaft, which is supplied to customers ready-to-install, meets the associated requirements to a high degree thanks
to a load-dependent combination of different materials on a single shaft. Alongside the cams, other components such as
bearings, shaft sealing rings and closure caps can also be joined simply to the rotor shaft. In addition, rotor cooling and
sensor systems can be integrated in the hollow rotor. We have already received our first production order from a German
auto manufacturer.
Employees
ThyssenKrupp employed 150,860 people in its continuing operations on December 31, 2012, 4,741 or 3.0% fewer than
a year earlier. The decline was due to restructuring measures and in particular to disposals in connection with the
strategic portfolio optimization and affected the business areas Components Technology, Marine Systems, Materials
Services and Steel Europe. Elevator Technology and Plant Technology recruited new employees.
Compared with September 30, 2012 the number of employees decreased by 1,263 or 0.8%. The workforce in Germany
decreased by 346 or 0.6% to 58,101; its share in the total workforce was 38.5%. At the end of December 2012, 20.8%
of all employees were based in Europe outside Germany, 12.4% in North and Central America, 11.5% in South America,
15.9% in Asia and the Pacific region – in particular China and India – and 0.9% in Africa.
Including Steel Americas ThyssenKrupp had 154,850 employees worldwide at the end of December 2012, 16,462 or
9.6% fewer than a year earlier. Compared with September 30, 2012 the workforce decreased by 13,111 or 7.8%. The
employees of Stainless Global are no longer included in the Group’s numbers at December 31, 2012.

Interim Report 1st Quarter 2012/2013 Financial position 23
Financial position
Analysis of the statement of cash flows
The amounts taken into account in the statement of cash flows correspond to the item “Cash and cash equivalents” as
reported in the statement of financial position and also include the cash and cash equivalents relating to the disposal
groups including the discontinued operations. For the reporting period and the corresponding prior-year quarter the
discontinued operations comprise the activities of Steel Americas and Stainless Global.
In the 1st quarter 2012/2013 the net cash outflow from operating activities showed a significant year-on-year reduction
of €1,675 million to €140 million. Cash inflow from continuing operations amounted to €78 million, an improvement of
€1,405 million against the prior-year quarter. This was mainly due to a considerable improvement in funds tied up in
inventories and trade accounts receivable by altogether €1,063 million. In the discontinued operations, operating cash
flow improved by €270 million to €(218) million, due in particular to a smaller net loss before depreciation and deferred
taxes.
Investing activities resulted in a net cash inflow of €501 million, compared with a cash outflow of €239 million a year
earlier. In the continuing operations there was a cash inflow of €658 million compared with a cash outflow of €3 million
in the prior-year quarter. The main reason for the €661 million improvement was the disposal of the stainless steel
business to Outokumpu, which after taking into account the divested cash and cash equivalents resulted in proceeds of
€916 million; this was offset mainly by the absence of the proceeds from the sale of the Xervon group and the Brazilian
Automotive Systems operations recognized in the year-earlier quarter. In the discontinued operations the cash outflow
from investing activities was €79 million lower, above all due to reduced capital expenditure for property, plant and
equipment at Steel Americas.
Free cash flow, i.e. the sum of operating cash flows and cash flows from investing activities, in the continuing operations
improved significantly year-on-year by €2,066 million to €736 million. This was mainly the result of higher cash inflow
from operating activities. In the discontinued operations negative free cash flow was almost halved to €(375) million
thanks to reduced cash outflows from both operating activities and investing activities. Overall, free cash flow thus came
to €361 million.
Cash inflow from financing activities in the continuing operations came to €1,289 million, compared with a cash outflow
of €247 million in the prior-year quarter. The €1,536 million change resulted from a €783 million increase in net
borrowings and a €388 million reduction in cash outflow in connection with the financing of discontinued operations.
There was also a cash inflow from other financing activities of €74 million, compared with a cash outflow of €268 million
the year before. This €342 million change came about because compared with the year before the level of reductions in
liabilities to associated companies was significantly lower and smaller amounts were transferred to the factoring
company in connection with payments received from customers for already sold receivables. Cash inflow from financing
activities of discontinued operations decreased by €336 million; both in the reporting period and the prior-year quarter,
the financing activities mainly related to the inclusion of Steel Americas and Stainless Global in the Group financing
system. Overall cash inflow from financing activities increased by €1,200 million to €1,599 million.

24 Interim Report 1st Quarter 2012/2013 Financial position
Analysis of the statement of financial position
Compared with September 30, 2012 total assets decreased by a total of €1,017 million to €37,267 million. This includes
a currency translation-related reduction of €440 million, mainly due to movements in the US dollar exchange rate.
Non-current assets increased by €1,824 million. This sharp rise related mainly to two transactions resulting from the
combination of Stainless Global and the Finnish stainless steel producer Outokumpu implemented on December 28,
2012. In this connection ThyssenKrupp has a financial receivable outstanding against Outokumpu; this led to a
€1,199 million increase in non-current financial assets. In addition, ThyssenKrupp has a 29.9% share in the new
company; this resulted in particular in €481 million higher investments accounted for according to the equity method.
Deferred tax assets were €192 million higher, largely as a result of the increase in tax-deductible losses in Germany and
abroad.
Current assets decreased by a significant €2,841 million, of which €344 million related to currency translation effects.
Inventories stood at €6,566 million on December 31, 2012, up €199 million from September 30, 2012. The increase
mainly related to the Materials Services business area.
Trade accounts receivable were €504 million lower at €4,622 million. In particular this reflected measures to reduce
funds tied up in the Materials Services business area.
Of the steep €1,993 million increase in cash and cash equivalents, €736 million resulted from the positive free cash flow
in the reporting period – mainly due to a €1,000 million cash inflow from Outokumpu in connection with the disposal of
the stainless steel business at the end of December 2012 – and €1,577 million from net borrowings. This was partly
offset by cash outflows of €350 million in connection with the financing of discontinued operations.
Assets held for sale decreased by €4,607 million to €4,860 million. Of this sharp reduction, €4,383 million related to the
completed disposal of Stainless Global to Outokumpu. In addition, there was a €207 million reduction at Steel Americas
as a result of continuing business operation.
Total equity at December 31, 2012 was €4,235 million, down €291 million from September 30, 2012. The main factors
were the net actuarial losses from pensions and similar obligations (€101 million after taxes) recognized in other
comprehensive income, and unrealized losses from foreign currency translation (€167 million). The equity ratio fell
slightly from 11.8% to 11.4%.
Non-current liabilities increased by a net €1,382 million. This was mainly due to a €1,047 million increase in non-current
financial debt. The €45 million rise in accrued pension and similar obligations resulted in particular from the updated
interest rates used for the revaluation of pension and healthcare obligations at December 30, 2012, and allocations
recognized in income; this was offset by outpayments. The increase in other non-current provisions was influenced in
particular by provisions for possible effects from requirements under merger control law in connection with the disposal
of the stainless steel business to Outokumpu. Deferred tax liabilities were €105 million higher, mainly due to increased
opportunities for offsetting deferred tax assets and liabilities as a result of higher tax-deductible losses.

Interim Report 1st Quarter 2012/2013 Financial position / Subsequent events 25
Current liabilities decreased overall by €2,108 million, of which €139 million related to exchange rate effects.
Current provisions for employee benefits decreased by €87 million, mainly due to utilization. Current financial debt was
€510 million higher, mainly as a result of increased liabilities to financial institutions.
Trade accounts payable were €169 million lower, mainly due to reductions in the Components Technology and Materials
Services business areas.
Other current financial liabilities increased by €57 million mainly as a result of higher interest amounts payable. The
€79 million rise in other current non-financial liabilities mainly reflected higher advance payments.
Liabilities associated with assets held for sale decreased by €2,449 million to €1,465 million, primarily due to the
aforementioned disposal of Stainless Global to Outokumpu in December 2012 (€2,323 million). In addition, reductions of
€102 million in the Steel Americas business were the result of continuing business operation.
Subsequent events
Subsequent events between the end of the 1st quarter reporting period (December 31, 2012) and the date of
authorization for issuance (February 08, 2013) are presented in Note 11 to the interim financial statements.

Interim Report 1st Quarter 2012/2013 Expected developments 26
Expected developments and associated opportunities and risks Global economic growth remaining weak
There are still no signs of a full-scale global economic recovery this year. The reasons are the unsolved debt problems in
particular in the euro zone and slower rates of growth in the emerging economies. After 2.8% last year, global economic
growth of 3.0% is expected in 2013, with the emerging countries expanding overall by 5.3% and the industrialized
counties by only 1.4%. Stronger economic momentum is not expected before 2014.
High sovereign debt, the need for fiscal consolidation, and cautious capital investment are hampering growth in the euro
zone; GDP is therefore expected to fall slightly again in 2013. The recessionary trend in the southern European countries
is likely to continue. In Germany GDP could grow by 1.0% in 2013 – driven mainly by consumer and business spending
In the USA the pace of economic recovery will show little change. Increased consumer and business spending is
expected to lead to growth of 2.1%. In Japan, where impetus from the rebuilding process after the natural disaster is
slowing, growth of only 1.0% is forecast for 2013.
The current weaker pace of expansion in many emerging countries will continue. Nevertheless, the BRIC countries are
expected to remain the growth pillars of the global economy in 2013. GDP growth of 8.0% is forecast for China, and
6.5% for India.
Growth in sectors
Flat carbon steel – Against the background of the weak global economic recovery, the prospects for the steel market
remain subdued. Global finished steel demand is expected to increase by almost 4% to 1.47 billion metric tons in 2013;
this corresponds to crude steel production of 1.6 billion metric tons. The main impetus will come from the emerging
markets in Asia, Latin America and the Middle East. As in 2012 the growth in demand in these regions will be much
lower than in previous years. This is particularly true of China, where a 4% increase is forecast for 2013. In the USA steel
market growth will weaken to just under 4%. For the EU market we expect steel demand in 2013 to stabilize at the prior-
year level. Steel demand in Germany will be only slightly higher year-on-year at 39 million metric tons.
Automotive – The international auto market will continue to grow in 2013. Worldwide production of cars and light trucks
is expected to increase by just under 3% year-on-year to almost 81 million units. Chinese vehicle production will again
grow by 8%. In the USA growth will slow from the high prior-year level to 6%. The Brazilian auto market will recover
again, with around 4% expansion. After the catch-up effects of the prior year, auto production in Japan will show a slight
decline of around 2%. The Western European auto market remains subdued. Flat demand will cause production to fall
below the already very weak prior-year level.
Machinery – Growth in machinery production will weaken in 2013, with capital spending in many countries subdued.
Growth could slow to 2.5% in the USA and 10.5% in China. For Germany’s export-oriented machinery sector we expect
production to remain at the prior-year level.

Interim Report 1st Quarter 2012/2013 Expected developments 27
Construction – Construction activity will continue to show regional differences in 2013. In Western Europe construction
output will decrease year-on-year due mainly to continued steep declines in the southern countries. With housing
demand remaining strong, construction activity in Germany will increase slightly. The US construction sector could make
a noticeable recovery. Construction activity in India and China will remain strong with growth rates of 8.5% and over
10% respectively.
SITUATION ON IMPORTANT SALES MARKETS
2012 2013*
Demand for finished steel, million tons
World 1,419 1,471
Germany 38.4 39.0
USA 96 100
China 654 679
Vehicle production, million cars and light trucks
World 78.6 80.7
Western Europe/Turkey 14.0 13.9
Germany 5.7 5.7
USA 9.8 10.5
Japan 9.4 9.2
China 17.3 18.7
Brazil 3.0 3.2
Machinery production, real, in % versus prior year
Germany 1.0 0.0
USA 6.0 2.5
Japan (1.0) 6.0
China 12.0 10.5
Construction output, real, in % versus prior year
Germany 1.7 0.7
USA 1.8 6.7
China 7.9 10.3
India 6.8 8.5
* Forecast
Expected results of operations, financial and liquidity situation
Fiscal year 2012/2013
The Steel Americas business area is classified as a discontinued operation effective September 30, 2012, like the
Stainless Global business area before it. The following forecast therefore relates to the Group’s continuing operations;
Steel Americas and Stainless Global are no longer included. We expect to sell Steel Americas in the course of fiscal year
2012/2013. The Stainless Global transaction was closed on December 28, 2012.
Sales and earnings – From the present perspective the Group’s business performance in the 2012/2013 fiscal year will
be characterized to a very large extent by the continued absence of a global economic recovery, with an unsolved debt
crisis in particular in the euro zone and slower growth in the emerging economies.
Based on the assumption of stagnation for the most part in the core markets of our more cyclical materials and
components businesses, where in the current economic environment visibility does not extend much beyond a quarter,
our expectations for sales and adjusted EBIT compared with the prior year are currently as follows:
– We expect the Group’s sales to remain at the prior-year level (sales 2011/2012: €40.1 billion) provided there are no
major dislocations on the raw materials markets. Sales lost due to portfolio measures, in particular at Steel Europe and
Components Technology, should be largely offset by organic growth in the capital goods businesses, where planned
sales are already secured well into the second fiscal half by existing high order backlogs.

Interim Report 1st Quarter 2012/2013 Expected developments 28
– Assuming that the slower activity on the materials markets at the beginning of the new fiscal year compared with the
prior year continues but does not progressively worsen, adjusted EBIT from the Group’s continuing operations should
be around €1 billion (adjusted EBIT 2011/2012: €1.4 billion).
– In the capital goods operations (adjusted EBIT 2011/2012: €1.7 billion) earnings contributions from the Industrial
Solutions business area should remain largely steady. In the elevator business we expect to see initial improvements in
margins and earnings. The components business will be impacted by the portfolio adjustments, lower operating levels
in the existing plants, startup costs for the new facilities in China and India, and increasing competition for slewing
bearings for wind turbines.
– Adjusted EBIT from the more cyclical materials activities (adjusted EBIT 2011/2012: €0.6 billion) is expected to be
lower year-on-year.
Our goal in the 2012/2013 fiscal year continues to be to improve cash generation on a sustainable basis and reduce our
net financial debt. Despite the problems on the European financial markets, the associated difficult conditions, and the
temporary increase in gearing, our financing and liquidity in fiscal 2012/2013 will remain on a solid basis and able to
cushion fluctuations resulting from specific short-term macroeconomic issues. After the high capital expenditures for the
major projects in Brazil and the USA and the capacity optimization program at the Duisburg location, capital spending in
the Group as a whole will be well below the prior-year level.
Discontinued operations – If the discontinued operation Steel Americas were to remain in the Group for the full
2012/2013 fiscal year, we would expect a loss for this operation in the mid three-digit million euro range. This figure
does not include depreciation expenses as these are no longer required with the classification of Steel Americas as a
discontinued operation
Fiscal year 2013/2014
In the 2013/2014 fiscal year we will continue to work on the structural improvement of the Group and rigorously
implement our integrated strategic development plan to make the Group competitive and give it a sustainable
organizational structure. This may include among other things targeted growth impetus and further portfolio
optimization. Provided the economic effects of the debt crisis do not extend into our 2013/2014 fiscal year, we expect
our sales to increase with the general growth in the economy. Rising sales and structural improvements should have a
correspondingly positive impact on earnings. In 2013/2014 we additionally expect significant improvements on the
earnings side as a result of the corporate programs initiated, in particular “impact 2015”, and the continuous
improvements to efficiency provided by benchmarking. Since we additionally assume that the portfolio measures
described will be implemented, we also expect an improvement in the equity and financing situation in 2013/2014.
Opportunities in an improved economic climate
ThyssenKrupp’s continuing operations can compete in the global markets with their innovative and resource-friendly
products and processes. Particularly in the emerging countries, we see major growth opportunities given an
improvement in the economic climate. Internally we are expanding our corporate program impact so as to implement
value-enhancing measures and increase productivity on a sustainable basis in all areas of the Group. Our strategic,
operating and performance-related opportunities were presented in detail on pages 98-100 of our 2011/2012 Annual
Report; this information is still valid.

Interim Report 1st Quarter 2012/2013 Expected developments 29
Risks particularly in difficult markets
We see risks in the economic environment in the continued absence of a global economic recovery, with an unsolved
debt crisis in particular in the euro zone and slower growth in the emerging economies. With our risk management
system we monitor and continuously assess the market prospects for our global business operations and can therefore
respond quickly to new developments. In this way we manage our risks and ensure that there are no risks that could
threaten the Group’s ability to continue as a going concern.
ThyssenKrupp manages its liquidity and credit risks proactively. The Group’s financing and liquidity remain on a secure
foundation in fiscal 2012/2013. At December 31, 2012 the Group had €7.4 billion in cash, cash equivalents and
undrawn committed credit lines.
Credit risks (default risks) arise from the fact that the Group is exposed to possible default by a contractual party in
relation to financial instruments, e.g. money investments. In times of crisis default risks take on additional significance;
we manage them with particular care as part of our business policy. Financial instruments used for financing are traded
with specified risk limits only with counterparties who have very good credit standing and/or who are members of a
deposit guarantee scheme.
Further financial risks such as currency, interest rate and commodity price risks are reduced by the use of derivative
financial instruments. Restrictive principles regarding the choice of counterparties also apply to the use of these
financial instruments.
We do not consider it likely that the 150% gearing limit stipulated in some credit agreements will be exceeded at
September 30, 2013. This would only happen in the – in our opinion unlikely – event that all the Group’s business areas
performed negatively and at the same time the disposal transaction including receipt of payment for the Steel Americas
business area were not completed until after the end of the current fiscal year.
Our steel activities in particular are operating in a difficult market environment with risks for sales volumes and prices.
Increasing raw material and energy costs cause uncertainties and could compromise the competitiveness of the Steel
Europe and Steel Americas business areas. We contain these risks as far as possible with adjusted selling prices and
alternative procurement sources.
In the sale process for the Steel Americas business area (discontinued operation) we have no evidence that would lead
to a change in the valuation versus September 30, 2012. Risks from imponderabilities in connection with the negotiation
process relating to the selling price are covered by opportunities. We expect to complete the sale transaction before the
end of the 2012/2013 fiscal year.
Until the disposal of Steel Americas is completed, the Group continues to take into account the following risks: in
particular risks on the sales and procurement markets, risks from exchange rate fluctuations, and risks in connection
with the ramp-up and operation of facilities and production stages.
Sales risks result from a dependency on individual markets and sectors. ThyssenKrupp is less affected by these risks
because in terms of our business activities we are diversified and maintain good and long-standing relationships with
our customers. Further expansion of our presence in the fast-growing emerging economies will strengthen this effect.
After the closing of the disposal on December 28, 2012, ThyssenKrupp will be exposed to the risks of Stainless Global
(discontinued operation) indirectly via its 29.9% shareholding in Outokumpu and the vendor loan granted in the
transaction. In addition to the usual stainless steel market risks and fluctuating raw material prices, these are mainly
risks associated with the existing overcapacities in Europe as well as import and price pressure from Asia.

Interim Report 1st Quarter 2012/2013 Expected developments 30
Our current and planned business activities can also be affected by political developments particularly in the crisis
regions of the world. We continuously monitor and evaluate the specific risks in each country and if needed can respond
swiftly to deteriorating conditions.
Antitrust violations and corruption can have significant financial consequences. ThyssenKrupp counters these risks with
a strict compliance program at all levels and a zero tolerance policy with regard to corruption and antitrust violations. In
connection with investigations by the Federal Cartel Office relating to rail deliveries, compensation is being discussed
with individual customers, including Deutsche Bahn. A reliable estimate of the financial consequences for ThyssenKrupp
with regard to compensation payments from this so-called rail cartel is not yet possible. A provision of €30 million was
already recognized in the last fiscal year for the risk of possible fines.
Changes in the legal framework at national or international level could entail risks for our business activities if they lead
to higher costs or other disadvantages for ThyssenKrupp compared with our competitors. We support the related
discussion process and reduce the corresponding risks through close working contacts with the relevant institutions.
Beyond this, the detailed information contained in the risk report on pages 100-112 of our 2011/2012 Annual Report is
still valid.
We report on pending lawsuits, claims for damages and other risks in Note 5.

31 Condensed Interim Financial 1st Quarter 2012/2013 Consolidated statement of financial position
ThyssenKrupp AG
Consolidated statement of financial position
ASSETS MILLION €
Note Sept. 30,
2012 Dec. 31,
2012
Intangible assets 4,291 4,267
Property, plant and equipment 6,053 6,022
Investment property 283 280
Investments accounted for using the equity method 647 1,128
Other financial assets 85 1,284
Other non-financial assets 219 229
Deferred tax assets 1,479 1,671
Total non-current assets 13,057 14,881
Inventories, net 6,367 6,566
Trade accounts receivable 5,126 4,622
Other financial assets 289 333
Other non-financial assets 1,656 1,716
Current income tax assets 101 75
Cash and cash equivalents 2,221 4,214
Assets held for sale 02 9,467 4,860
Total current assets 25,227 22,386
Total assets 38,284 37,267
EQUITY AND LIABILITIES MILLION €
Note Sept. 30,
2012 Dec. 31,
2012
Capital stock 1,317 1,317
Additional paid in capital 4,684 4,684
Retained earnings (2,912) (2,987)
Cumulative other comprehensive income 470 307
thereof relating to disposal groups/discontinued operations (Sept. 30, 2012: 190; Dec. 31, 2012: 168)
Equity attributable to ThyssenKrupp AG's stockholders 3,559 3,321
Non-controlling interest 967 914
Total equity 4,526 4,235
Accrued pension and similar obligations 04 7,708 7,753
Provisions for other employee benefits 235 235
Other provisions 557 742
Deferred tax liabilities 32 137
Financial debt 5,256 6,303
Other financial liabilities 1 2
Other non-financial liabilities 8 7
Total non-current liabilities 13,797 15,179
Provisions for employee benefits 276 189
Other provisions 1,032 1,043
Current income tax liablilities 349 289
Financial debt 1,929 2,439
Trade accounts payable 3,514 3,345
Other financial liabilities 848 905
Other non-financial liabilities 8,099 8,178
Liabilities associated with assets held for sale 02 3,914 1,465
Total current liabilities 19,961 17,853
Total liabilities 33,758 33,032
Total equity and liabilities 38,284 37,267
See accompanying selected notes.

32 Condensed Interim Financial 1st Quarter 2012/2013 Consolidated statement of income
ThyssenKrupp AG
Consolidated statement of income MILLION €, EARNINGS PER SHARE IN €
Note
1st quarter ended
Dec. 31, 2011*
1st quarter ended
Dec. 31, 2012
Net sales 07 9,596 8,837
Cost of sales 08 (8,109) (7,451)
Gross profit 1,487 1,386
Research and development cost (46) (56)
Selling expenses (651) (646)
General and administrative expenses (492) (482)
Other income 45 45
Other expenses (134) (27)
Other gains/(losses) 61 1
Income/(loss) from operations 270 221
Income/(expense) from companies accounted for using the equity method 7 11
Finance income 293 99
Finance expenses (468) (265)
Financial income/(expense), net (168) (155)
Income/(loss) before income taxes 102 66
Income tax (expense)/income (48) (33)
Income/(loss) from continuing operations (net of tax) 54 33
Discontinued operations (net of tax) 02 (534) (3)
Net income/(loss) (480) 30
Attributable to:
ThyssenKrupp AG's stockholders (460) 35
Non-controlling interest (20) (5)
Net income/(loss) (480) 30
Basic and diluted earnings per share 09
Income from continuing operations (attributable to ThyssenKrupp AG's stockholders) 0.08 0.06
Net income/(loss) (attributable to ThyssenKrupp AG's stockholders) (0.89) 0.07
See accompanying selected notes. * Prior year figures have been adjusted (see in particular Note 2).
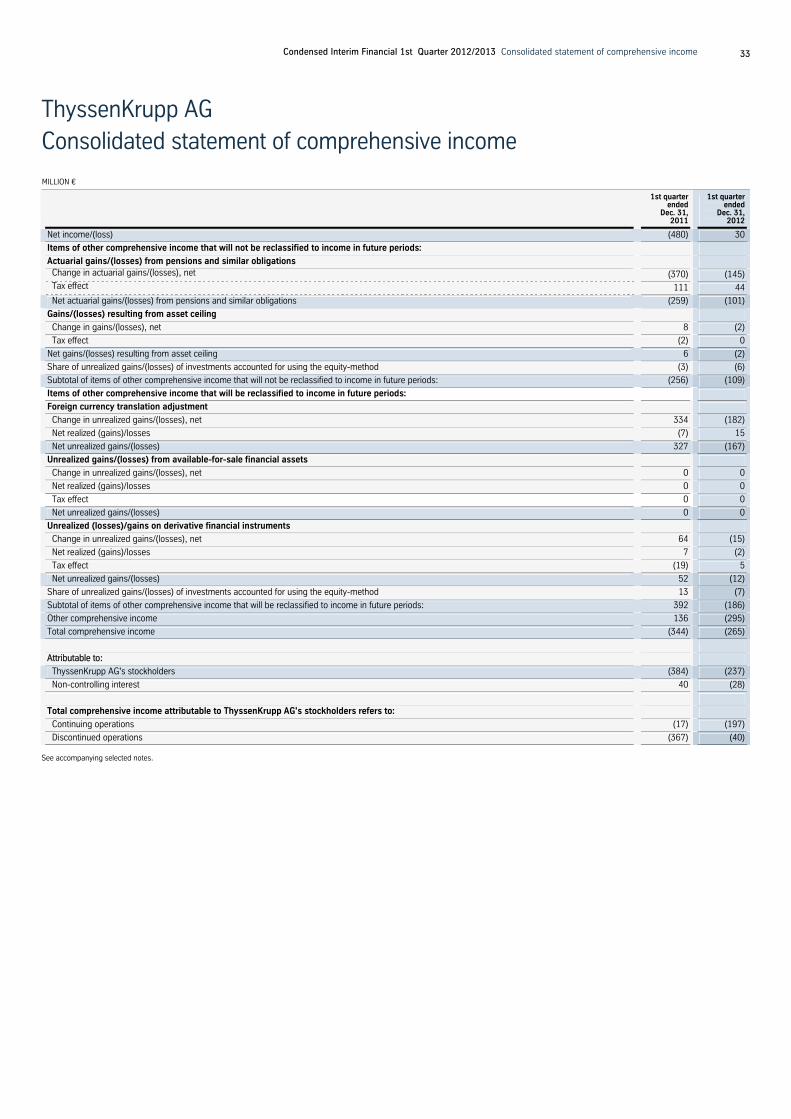
33 Condensed Interim Financial 1st Quarter 2012/2013 Consolidated statement of comprehensive income
ThyssenKrupp AG
Consolidated statement of comprehensive income MILLION €
1st quarter ended
Dec. 31, 2011
1st quarter ended
Dec. 31, 2012
Net income/(loss) (480) 30
Items of other comprehensive income that will not be reclassified to income in future periods:
Actuarial gains/(losses) from pensions and similar obligations
Change in actuarial gains/(losses), net (370) (145)
Tax effect 111 44
Net actuarial gains/(losses) from pensions and similar obligations (259) (101)
Gains/(losses) resulting from asset ceiling
Change in gains/(losses), net 8 (2)
Tax effect (2) 0
Net gains/(losses) resulting from asset ceiling 6 (2)
Share of unrealized gains/(losses) of investments accounted for using the equity-method (3) (6)
Subtotal of items of other comprehensive income that will not be reclassified to income in future periods: (256) (109)
Items of other comprehensive income that will be reclassified to income in future periods:
Foreign currency translation adjustment
Change in unrealized gains/(losses), net 334 (182)
Net realized (gains)/losses (7) 15
Net unrealized gains/(losses) 327 (167)
Unrealized gains/(losses) from available-for-sale financial assets
Change in unrealized gains/(losses), net 0 0
Net realized (gains)/losses 0 0
Tax effect 0 0
Net unrealized gains/(losses) 0 0
Unrealized (losses)/gains on derivative financial instruments
Change in unrealized gains/(losses), net 64 (15)
Net realized (gains)/losses 7 (2)
Tax effect (19) 5
Net unrealized gains/(losses) 52 (12)
Share of unrealized gains/(losses) of investments accounted for using the equity-method 13 (7)
Subtotal of items of other comprehensive income that will be reclassified to income in future periods: 392 (186)
Other comprehensive income 136 (295)
Total comprehensive income (344) (265)
Attributable to:
ThyssenKrupp AG's stockholders (384) (237)
Non-controlling interest 40 (28)
Total comprehensive income attributable to ThyssenKrupp AG's stockholders refers to:
Continuing operations (17) (197)
Discontinued operations (367) (40)
See accompanying selected notes.

34 Condensed Interim Financial 1st Quarter 2012/2013 Consolidated statement of changes in equity
ThyssenKrupp
Consolidated statement of changes in equity MILLION € (EXCEPT NUMBER OF SHARES)
Equity attributable to ThyssenKrupp AG's stockholders
Cumulative other comprehensive income
Number of shares
outstanding Capital
stock
Additional paid
in capital Retained earnings
Foreign currency
translation adjustment
Available-for-sale
financial assets
Derivative financial
instruments
Share of investments
accounted for using
the equity method Total
Non-controlling
interest Total
equity
Balance as of
Sept. 30, 2011 514,489,044 1,317 4,684 2,833 170 2 (22) 28 9,012 1,370 10,382
Net loss (460) (460) (20) (480)
Other comprehensive
income (256) 277 0 42 13 76 60 136
Total comprehensive
income (716) 277 0 42 13 (384) 40 (344)
Profit attributable to
non-controlling interest 0 (21) (21)
Other changes (14) (14) (3) (17)
Balance as of
Dec. 31, 2011 514,489,044 1,317 4,684 2,103 447 2 20 41 8,614 1,386 10,000
Balance as of
Sept. 30, 2012 514,489,044 1,317 4,684 (2,912) 463 7 (32) 32 3,559 967 4,526
Net income/(loss) 35 35 (5) 30
Other comprehensive
income (109) (144) 0 (12) (7) (272) (23) (295)
Total comprehensive
income (74) (144) 0 (12) (7) (237) (28) (265)
Profit attributable to
non-controlling interest 0 (13) (13)
Other changes (1) (1) (12) (13)
Balance as of
Dec. 31, 2012 514,489,044 1,317 4,684 (2,987) 319 7 (44) 25 3,321 914 4,235
See accompanying selected notes.

35 Condensed Interim Financial 1st Quarter 2012/2013 Consolidated statement of cash flows
ThyssenKrupp
Consolidated statement of cash flows
MILLION €
1st quarter ended
Dec. 31, 2011*
1st quarter ended
Dec. 31, 2012
Net income/(loss) (480) 30
Adjustments to reconcile net income/(loss) to operating cash flows:
Discontinued operations (net of tax) 534 3
Deferred income taxes, net (87) (86)
Depreciation, amortization and impairment of non-current assets 424 242
Reversals of impairment losses of non-current assets (1) 0
(Income)/loss from companies accounted for using the equity method, net of dividends received (6) (12)
(Gain)/loss on disposal of non-current assets, net (62) (2)
Changes in assets and liabilities, net of effects of acquisitions and divestitures and other non-cash changes: 0 0
- inventories (609) (253)
- trade accounts receivable 117 491
- accrued pension and similar obligations (81) (78)
- other provisions (131) 119
- trade accounts payable (547) (214)
- other assets/liabilities not related to investing or financing activities (398) (162)
Operating cash flows - continuing operations (1,327) 78
Operating cash flows - discontinued operations (488) (218)
Operating cash flows - total (1,815) (140)
Purchase of investments accounted for using the equity method and non-current financial assets (10) 0
Expenditures for acquisitions of consolidated companies net of cash acquired (39) (1)
Capital expenditures for property, plant and equipment (inclusive of advance payments) and investment property (216) (247)
Capital expenditures for intangible assets (inclusive of advance payments) (49) (28)
Proceeds from disposals of investments accounted for using the equity method and non-current financial assets 0 1
Proceeds from disposals of previously consolidated companies net of cash acquired 290 919
Proceeds from disposals of property, plant and equipment and investment property 14 13
Proceeds from disposals of intangible assets 7 1
Cash flows from investing activities - continuing operations (3) 658
Cash flows from investing activities - discontinued operations (236) (157)
Cash flows from investing activities - total (239) 501
Proceeds from liabilities to financial institutions 885 1,685
Repayments of liabilities to financial institutions (245) (379)
Proceeds from notes payable and other loans 151 275
Increase/(decrease) in bills of exchange 3 (4)
Decrease in current securities 0 1
Profit attributable to non-controlling interest (20) (13)
Expenditures for acquisitions of shares of already consolidated companies (15) 0
Financing of discontinued operations (738) (350)
Other financing activities (268) 74
Cash flows from financing activities - continuing operations (247) 1,289
Cash flows from financing activities - discontinued operations 646 310
Cash flows from financing activities - total 399 1,599
Net increase/(decrease) in cash and cash equivalents - total (1,655) 1,960
Effect of exchange rate changes on cash and cash equivalents - total 61 (37)
Cash and cash equivalents at beginning of reporting period - total 3,568 2,347
Cash and cash equivalents at end of reporting period - total 1,974 4,270
[thereof cash and cash equivalents within disposal groups] [136] [10]
[thereof cash and cash equivalents within discontinued operations] [71] [46]
Additional information regarding cash flows of continuing operations from interest,
dividends and income taxes which are included in operating cash flows:
Interest received 38 29
Interest paid (41) (39)
Dividends received 2 2
Income taxes paid (134) (102)
See note 10 of the selected notes. * Prior year figures have been adjusted (see in particular Note 2).

36 Condensed Interim Financial 1st Quarter 2012/2013 Selected notes
ThyssenKrupp AG
Selected notes
Corporate information
ThyssenKrupp Aktiengesellschaft (“ThyssenKrupp AG” or “Company”) is
a publicly traded corporation domiciled in Duisburg and Essen in
Germany. The condensed interim consolidated financial statements of
ThyssenKrupp AG and subsidiaries, collectively the “Group”, for the
period from October 01, 2012 to December 31, 2012, were authorized for
issue in accordance with a resolution of the Executive Board on
February 08, 2013.
Basis of presentation
The accompanying Group’s condensed interim consolidated financial
statements have been prepared in accordance with section 37x para. 3 of
the German Securities Trading Act (WpHG) and International Financial
Reporting Standards (IFRS) and its interpretations adopted by the
International Accounting Standards Board (IASB) for interim financial
information effective within the European Union. Accordingly, these
financial statements do not include all of the information and footnotes
required by IFRS for complete financial statements for year end reporting
purposes.
The accompanying Group’s condensed interim consolidated financial
statements have been reviewed. In the opinion of Management, the
interim financial statements include all adjustments of a normal and
recurring nature considered necessary for a fair presentation of results
for interim periods. Results of the period ended December 31, 2012, are
not necessarily indicative for future results.
The preparation of condensed interim financial statements in conformity
with IAS 34 Interim Financial Reporting requires Management to make
judgements, estimates and assumptions that affect the application of
policies and reported amounts of assets and liabilities, income and
expenses. Actual results may differ from these estimates.
The accounting principles and practices as applied in the condensed
interim consolidated financial statements correspond to those pertaining
to the most recent annual consolidated financial statements. A detailed
description of the accounting policies is published in the notes to the
consolidated financial statements of our annual report 2011/2012.
Recently adopted accounting standards
In fiscal year 2012/2013, ThyssenKrupp adopted the following
amendments:
In June 2011 the IASB issued amendments to IAS 1 “Presentation of
Financial Statements” under the title “Presentation of Items of Other
Comprehensive Income”. The amendments require a classification of
items presented in other comprehensive income into items that might
subsequently be reclassified to the income statement and items that will
not. The amendments to IAS 1 are compulsory for fiscal years beginning
on or after July 01, 2012. The adoption of the amendments did not have
a material impact on the Group’s consolidated financial statements.
Recently issued accounting standards
In fiscal year 2012/2013, the following amendments to already existing
standards have been issued which must still be endorsed by the EU
before they can be adopted:
In October 2012 the IASB issued “Investment Entities” as amendments to
IFRS 10, IFRS 12 and IAS 27 regarding the accounting of investment
entities. The amendments define investment entities and provide an
exception to the general consolidation requirements of subsidiaries in
IFRS 10; instead of consolidating those subsidiaries are measured at fair
value through profit or loss. In addition the amendments set out
disclosure requirements for investment entities. The amendments are
effective for fiscal years beginning on or after January 01, 2014, while
earlier application is permitted. Currently, Management does not expect
the amendments – if endorsed by the EU in the current version – to have
any relevance for the Group’s consolidated financial statements.
01 Acquisitions and disposals After the disposal of the Stainless Global business area had been
initiated as part of the program for the further strategic development as
of September 30, 2011, the transaction was completed with the
combination with the Finnish company Outokumpu on December 28,
2012. This disposal as well as other smaller disposals that are, on an
individual basis, immaterial affected in total, based on the values as of
the respective disposal date, the Group’s consolidated financial
statements as presented below:

37 Condensed Interim Financial 1st Quarter 2012/2013 Selected notes
MILLION €
1st quarter ended
Dec. 31, 2012
Other intangible assets 27
Property, plant and equipment 1,812
Investment property 12
Investments accounted for using the equity method 19
Other financial assets 2
Other non-financial assets 25
Deferred tax assets 87
Inventories 1,801
Trade accounts receivable 549
Other current financial assets 57
Other current non-financial assets 89
Current income tax assets 16
Cash and cash equivalents 85
Total assets disposed of 4,581
Accrued pension and similar obligations 351
Provisions for other non-current employee benefits 25
Other non-current provisions 106
Deferred tax liabilities 87
Non-current financial debt 39
Other non-current non-financial liabilities 1
Provisions for current employee benefits 3
Other current provisions 63
Current income tax liablilities 3
Current financial debt 137
Trade accounts payable 1,220
Other current financial liabilities 2,345
Other current non-financial liabilities 125
Total liabilities disposed of 4,505
Net assets disposed of 76
Cumulative other comprehensive income 13
Non-controlling interest (11)
Gain/(loss) resulting from the disposals 146
Selling prices 224
thereof: received in cash and cash equivalents 0
In addition in the 1st quarter ended December 31, 2012, the Group
acquired smaller companies that are, on an individual basis, immaterial.
Based on the values as of the acquisition date, these acquisitions
affected in total the Group’s consolidated financial statements as
presented below:
MILLION €
1st quarter ended
Dec. 31, 2012
Goodwill 15
Other intangible assets 11
Investments accounted for using the equity method (5)
Inventories 1
Trade accounts receivable 6
Other current non-financial assets 2
Cash and cash equivalents 2
Total assets acquired 32
Accrued pension and similar obligations 1
Deferred tax liabilities 1
Other current provisions 3
Trade accounts payable 1
Other current financial liabilities 2
Other current non-financial liabilities 3
Total liabilities assumed 11
Net assets acquired 21
Non-controlling interest 0
Purchase prices 21
thereof: paid in cash and cash equivalents 19
02 Discontinued operations and disposal groups
As part of the portfolio optimization and of the decision about the
concept for the further strategic development in May 2011, in fiscal year
2010/2011 as well as in fiscal year 2011/2012 the disposal of the Berco
group of the Components Technology business area and the disposal of
the Tailored Blanks group of the Steel Europe business area have been
initiated. Both disposals did not meet the requirements of IFRS 5 for a
presentation as a discontinued operation and were not completed as of
the balance sheet date. Therefore, revenues and expenses were
continued to be presented as income from continuing operations until the
date of the disposal. The disposal of the entire Steel Americas business
area initiated in September 2012, met the criteria for a presentation as a
discontinued operation for the first time as of September 30, 2012, for
the Stainless Global business area the criteria have already been met
since September 30, 2011 and ended December 28, 2012 with the
combination with the Finnish company Outokumpu. Therefore, for the
reporting period all revenues and expenses of the Steel Americas
business area until December 31, 2012 and all revenues and expenses of
the Stainless Global business area until December 28, 2012 will be
presented in the consolidated statement of income in the line item
“discontinued operations (net of tax)”. The prior year presentation of the
quarter in which the Stainless Global business area has already been
presented as a discontinued operation has been adjusted accordingly for
the Steel Americas business area. For entities for which the disposal has
not been completed as of the balance sheet date of the respective
reporting period, the assets and liabilities of the disposal group and of
the discontinued operation have been disclosed separately in the
consolidated balance sheet of the reporting period in the line items
“assets held for sale” and “liabilities associated with assets held for
sale”.
In September 2012 the disposal of the Berco group has been initiated in
the Components Technology business area. Berco is a leading global
supplier of undercarriages, based mainly on forged components, for the
construction machinery sector and offers a broad range of parts and
services for both OEMs and the aftermarket. Its products are used in
machinery from large mining equipment to mini excavators. In the
context of the initiated disposal an impairment loss of €4 million on
intangible assets and of €131 million on property, plant and equipment
was recognized in cost of sales in the 4th quarter of 2011/2012 resulting
from the write-down of the assets to fair value less costs to sell. At the
same time a deferred tax asset of €1 million was recognized. The assets
and liabilities of the disposal group as of December 31, 2012 are
presented in the following table:

38 Condensed Interim Financial 1st Quarter 2012/2013 Selected notes
MILLION €
Dec. 31,
2012
Other intangible assets 2
Property, plant and equipment 30
Deferred tax assets 13
Inventories 197
Trade accounts receivable 50
Other current financial assets 1
Other current non-financial assets 18
Current income tax assets 2
Cash and cash equivalents 6
Assets held for sale 319
Accrued pension and similar obligations 31
Other non-current provisions 1
Other current provisions 8
Current income tax liabilities 2
Current financial debt 3
Trade accounts payable 67
Other current financial liabilities 2
Other current non-financial liabilities 28
Liabilities associated with assets held for sale 142
In addition in September 2012 the disposal of the ThyssenKrupp Tailored
Blanks group has been initiated in the Steel Europe business area.
Tailored Blanks is supplier of body systems to the auto industry which
produces tailored steel blanks. The sale is subject to approval by the
supervisory bodies and the responsible regulatory authorities. The assets
and liabilities of the disposal group as of December 31, 2012 are
presented in the following table:
MILLION €
Dec. 31,
2012
Goodwill 6
Other intangible assets 4
Property, plant and equipment 99
Investments accounted for using the equity method 2
Deferred tax assets 3
Inventories 55
Trade accounts receivable 111
Other current financial assets 3
Other current non-financial assets 10
Current income tax assets 5
Cash and cash equivalents 4
Assets held for sale 302
Accrued pension and similar obligations 10
Provisions for other non-current employee benefits 1
Deferred tax liabilities 4
Provisions for current employee benefits 1
Other current provisions 1
Current income tax liabilities 5
Current financial debt 15
Trade accounts payable 60
Other current financial liabilities 2
Other current non-financial liabilities 11
Liabilities associated with assets held for sale 110
Discontinued operations: Steel Americas and Stainless
Global business areas
In September 2012, the Supervisory Board noted with assent the
Executive Board’s intention to open a bidding process for the Steel
Americas business area. The transaction shall be consummated in
2012/2013.
The €3,645 million impairment which became necessary as of September
30, 2012 due to the intention to sell. The impairment is based on the
expected fair value less costs to sell. Non-binding offers have been
received for each plant separately and both together. These are being
pursued by the shortlisted bidders and ThyssenKrupp. The valuation also
includes internal calculations, made in part with support from auditors
and management consultants, which take into account all knowledge
available to ThyssenKrupp from the ongoing sale process and overall
represent a best possible estimate. Value changes in the course of the
bidding process cannot be excluded.
In the context of the sale process there aren’t any indications that would
result in a change of the measurement as of September 30, 2012.
Therefore as of December 31, 2012 no additional adjustment had been
necessary.
The results of the Steel Americas business area that classifies as a
discontinued operation are as follows:
MILLION €
1st quarter ended
Dec. 31, 2011
1st quarter ended
Dec. 31, 2012
Net sales 327 373
Other income 26 32
Expenses (638) (495)
Ordinary income/(loss) from discontinued
operations (before taxes) (285) (90)
Income tax (expense)/income 59 28
Ordinary income/(loss) from discontinued
operations (net of tax) (226) (62)
Gain/(loss) recognized on measurement adjustments
of discontinued operations (before taxes) — —
Income tax (expense)/income — —
Gain/(loss) recognized on measurement adjustments
of discontinued operations (net of tax) 0 0
Discontinued operations (net of tax) (226) (62)
thereof:
ThyssenKrupp AG's stockholders (194) (54)
Non-controlling interest (32) (8)

39 Condensed Interim Financial 1st Quarter 2012/2013 Selected notes
The assets and liabilities of the discontinued operation Steel Americas
business area as of December 31, 2012 are presented in the following
table:
MILLION €
Dec. 31,
2012
Other intangible assets 23
Property, plant and equipment 2,872
Other non-financial assets 158
Inventories 746
Trade accounts receivable 171
Other current financial assets 43
Other current non-financial assets 175
Current income tax assets 5
Cash and cash equivalents 46
Assets held for sale 4,239
Non-current financial debt 630
Other current provisions 16
Current income tax liabilities 3
Current financial debt 91
Trade accounts payable 298
Other current financial liabilities 93
Other current non-financial liabilities 82
Liabilities associated with assets held for sale 1,213
On initial classification as a discontinued operation, non-current assets
are no longer amortized and depreciated, therefore in the 1st quarter
ended December 31, 2012, amortization and depreciation of €111 million
were suspended.
As of September 2011 as part of its program for the further strategic
development, the corporate, organizational and contractual conditions for
creating a separate Stainless Global and consequently the conditions for
the first-time presentation as a discontinued operation were established.
In the context with the initiated disposal, as of September 30, 2011 the
measurement of discontinued operations at fair value less costs to sell
based on internal calculations and market observations resulted in an
impairment loss of €510 million. Thereof, €45 million applied to goodwill
and the remaining impairment loss was allocated to property, plant and
equipment. The expense is recognized in income/(loss) of discontinued
operations of the 4th quarter of 2010/2011.
On January 31, 2012, the agreement to combine the Finnish stainless
steel producer Outokumpu and ThyssenKrupp’s stainless steel
operations was signed. The EU Commission approved the combination in
November 2012 with certain conditions. Based on the contract with
Outokumpu about the intented sale, in 2011/2012 the measurement
resulted in an additional impairment loss of €400 million that was
allocated to property, plant and equipment. The expense of €400 million
is recognized in income/(loss) of discontinued operations of the year
ended September 30, 2012; thereof €265 million refer to the 1st quarter
of 2011/2012.
Furthermore, due to the shut down of the Krefeld melt shop by the end of
2013, an impairment loss of €42 million on property, plant and
equipment was recognized in income/(loss) of discontinued operations of
the 2nd quarter of 2011/2012. In May 2012, Inoxum agreed with the
relevant works council on a social plan in connection with the
consolidation measures regarding the relocation of the Düsseldorf-
Benrath facility and the connected personnel reduction. The social plan
includes early retirement models and compensations for employees
leaving Inoxum. Further, it includes compensations for employees being
relocated. The social plan will apply accordingly to the planned closure of
the Krefeld melt shop in the event the Inoxum transaction is completed.
As of September 30, 2012 the overall costs in connection with that social
plan have been recognized as a restructuring provision of €58 million in
the aggregate for Düsseldorf-Benrath and Krefeld.
On December 28, 2012 the combination of the Stainless Global business
area with the Finnish company Outokumpu was completed. With the
closing of this transaction ThyssenKrupp received €1 billion in cash from
Outokumpu for the contribution of Inoxum. In addition Outokumpu took
on the external net financial debt and pension obligations. ThyssenKrupp
holds a share of 29.9% in Outokumpu and a financial receivable
outstanding against Outokumpu with a current value of around
€1.2 billion and a maximum term of 9 years. Under the purchase
agreement, this financial receivable can be adjusted by a maximum of
€200 million in the event of negative financial consequences arising for
Outokumpu from conditions imposed under merger control law.
The results of the Stainless Global business area that classifies as a
discontinued operation until December 28, 2012 are as follows:
MILLION €
1st quarter ended
Dec. 31, 2011
1st quarter ended
Dec. 31, 2012
Net sales 1,307 1,268
Other income 5 9
Expenses (1,378) (1,359)
Ordinary income/(loss) from discontinued
operations (before taxes) (66) (82)
Income tax (expense)/income 23 (5)
Ordinary income/(loss) from discontinued
operations (net of tax) (43) (87)
Gain/(loss) recognized on measurement adjustments/
disposal of discontinued operations (before taxes) (265) 146
Income tax (expense)/income — —
Gain/(loss) recognized on measurement adjustments/
disposal of discontinued operations (net of tax) (265) 146
Discontinued operations (net of tax) (308) 59
thereof:
ThyssenKrupp AG's stockholders (307) 60
Non-controlling interest (1) (1)

40 Condensed Interim Financial 1st Quarter 2012/2013 Selected notes
On initial classification as a discontinued operation, non-current assets
are no longer amortized and depreciated, therefore in the 1st quarter
ended December 31, 2012, amortization and depreciation of €52 million
were suspended (1st quarter ended December 31, 2011: €46 million).
The assets and liabilities that are assigned to the discontinued operation
Stainless Global as of December 28, 2012 are presented in the following
table:
MILLION €
Dec. 28,
2012
Other intangible assets 27
Property, plant and equipment 1,812
Investment property 12
Investments accounted for using the equity method 19
Other financial assets 2
Other non-financial assets 25
Deferred tax assets 87
Inventories 1,798
Trade accounts receivable 549
Other current financial assets 57
Other current non-financial assets 88
Current income tax assets 16
Cash and cash equivalents 84
Assets held for sale 4,576
Accrued pension and similar obligations 351
Provisions for other non-current employee benefits 25
Other non-current provisions 106
Deferred tax liabilities 87
Non-current financial debt 39
Other non-current non-financial liabilities 1
Provisions for current employee benefits 3
Other current provisions 62
Current income tax liabilities 3
Current financial debt 136
Trade accounts payable 1,220
Other current financial liabilities 2,345
Other current non-financial liabilities 122
Liabilities associated with assets held for sale 4,500
The 29.9% shareholding in Outokumpu obtained after the disposal of the
Stainless Global business area is accounted for in the consolidated
financial statements according to the equity method. As of December 31,
2012 this shareholding is initially reported with a value of €491 million,
based on the share price at the time of the transaction multiplied by the
number of Outokumpu shares received. The fair value of the shares
acquired is currently being determined in connection with the respective
purchase price allocation. Any difference will impact the carrying amount
of the investment.
03 Share-based compensation
Management incentive plans
Due to the downward trend of the TKVA, the Group recorded an income of
€3.7 million from the obligations of the mid-term and long-term incentive
plans MTI and LTI in the 1st quarter ended December 31, 2012 (1st
quarter ended December 31, 2011: income of €9.8 million); thereof
income of €0 million (1st quarter ended December 31, 2011: income of
€0.7 million) are presented in income/(loss) of discontinued operations.
In September 2010 the structure of the variable compensation for
members of the Executive Board of ThyssenKrupp AG was modified. 25%
of the performance bonus granted for the respective fiscal year and 55%
of the additional bonus granted depending on the economic situation will
be obligatorily converted into ThyssenKrupp AG stock rights to be paid
out after a three-year lock-up period based on the average ThyssenKrupp
share price in the 4th quarter of the 3rd fiscal year. In the 3rd quarter of
2010/2011 the structure of the variable compensation for additional
executive employees was modified. 20% of the performance bonus
granted for the respective fiscal year will be obligatorily converted into
ThyssenKrupp AG stock rights to be paid out after a three-year lock-up
period based on the average ThyssenKrupp share price in the 4th quarter
of the 3rd fiscal year. This compensation item resulted in expenses of
€0.4 million in the 1st quarter ended December 31, 2012 (1st quarter
ended December 31, 2011: €0.1 million).
04 Accrued pension and similar obligations Based on updated interest rates and fair value of plan assets, an updated
valuation of accrued pension and health care obligations was performed
as of December 31, 2012, taking into account these effects while other
assumptions remained unchanged.
MILLION €
Sept. 30,
2012 Dec. 31,
2012
Accrued pension liability 6,922 6,703
Accrued postretirement obligations other than pensions 850 831
Other accrued pension-related obligations 314 260
Reclassification due to the presentation as liabilities
associated with assets held for sale (378) (41)
Total 7,708 7,753
The Group applied the following weighted average assumptions to
determine pension and postretirement benefit obligations other than
pensions:
IN %
Sept. 30, 2012 Dec. 31, 2012
Germany Outside
Germany Germany Outside
Germany
Discount rate for accrued
pension liability 3.60 3.44 3.40 3.44
Discount rate for postretirement
obligations other than pensions
(only USA) — 3.50 — 3.50

Condensed Interim Financial 1st Quarter 2012/2013 Selected notes
41
The net periodic postretirement benefit cost for health care obligations is as follows:
MILLION €
1st quarter ended
Dec. 31, 2011
1st quarter ended
Dec. 31, 2012
Germany Outside
Germany Germany Outside
Germany
Service cost 19 8 27 9
Interest cost 67 23 57 20
Expected return on plan assets (3) (25) (3) (27)
Curtailment and settlement gains 0 0 0 (11)
Net periodic pension cost 83 6 81 (9)
The above presented net periodic pension cost for defined benefit plans in Germany include cost of €5 million in the 1st quarter ended December 31,
2012 (1st quarter ended December 31, 2011: €3 million) and net periodic pension cost for defined benefit plans outside Germany include cost of €0
million in the 1st quarter ended December 31, 2012 (1st quarter ended December 31, 2011: €0 million) attributable to discontinued operations.
The net periodic postretirement cost for health care obligations is as follows:
MILLION €
1st quarter ended
Dec. 31, 2011
1st quarter ended
Dec. 31, 2012
USA USA
Service cost 1 1
Interest cost 11 7
Expected return on reimbursement rights (1) 0
Past service cost (30) 0
Net periodic postretirement benefit cost/(income) (19) 8
05 Contingencies including pending lawsuits and claims for damages
Guarantees
ThyssenKrupp AG as well as, in individual cases, its subsidiaries have
issued or have had guarantees in favour of business partners or lenders.
The following table shows obligations under guarantees where the
principal debtor is not a consolidated Group company:
MILLION €
Maximum potential
amount of future
payments as of
Dec. 31, 2012
Provision as of
Dec. 31, 2012
Advance payment bonds 263 1
Performance bonds 179 1
Third party credit guarantee 186 0
Residual value guarantees 61 2
Other guarantees 92 1
Total 781 5
The terms of those guarantees depend on the type of guarantee and may
range from three months to ten years (e.g. rental payment guarantees).
The basis for possible payments under the guarantees is always the non-
performance of the principal debtor under a contractual agreement, e.g.
late delivery, delivery of non-conforming goods under a contract or non-
performance with respect to the warranted quality or default under a loan
agreement.
All guarantees are issued by or issued by instruction of ThyssenKrupp AG
or subsidiaries upon request of the principal debtor obligated by the
underlying contractual relationship and are subject to recourse provisions
in case of default. If such a principal debtor is a company owned fully or
partially by a foreign third party, the third party is generally requested to
provide additional collateral in a corresponding amount.
Commitments and other contingencies
Due to the high volatility of iron ore prices, in the Steel Europe and Steel
Americas business areas the existing long-term iron ore and iron ore
pellets supply contracts are measured for the entire contract period at the
iron ore prices applying as of the respective balance sheet date.
Compared to September 30, 2012, the purchasing commitments were
reduced by €0.4 billion to €15.2 billion due to the lower ore prices.

42 Condensed Interim Financial 1st Quarter 2012/2013 Selected notes
Pending lawsuits and claims for damages
The Group is involved in pending and threatened litigation in connection
with the purchase and sale of certain companies, which may lead to
partial repayment of the purchase price or to the payment of damages. In
addition, damage claims may be payable to contractual partners,
customers, consortium partners and subcontractors under performance
contracts. Some of these claims have proven unfounded, have been
ended by settlement or expired under the statute of limitations. A number
of these proceedings are still pending.
In connection with the so-called rail cartel, there have been no changes
compared to September 30, 2012; for more information refer to the
presentation on page 164 of the annual report 2011/2012.
There have been no significant changes since September 30, 2012 to
other contingencies, including pending litigations.
06 Derivative financial instruments The notional amounts and fair values of the Group’s derivative financial
instruments are as follows:
MILLION €
Notional amount
Sept. 30, 2012 Fair value
Sept. 30, 2012 Notional amount
Dec. 31, 2012 Fair value
Dec. 31, 2012
Derivative financial
instruments
Assets
Foreign currency
derivatives including
embedded derivatives 1,695 35 1,929 47
Interest rate derivatives* 172 5 167 4
Commodity derivatives 221 20 435 40
Total 2,088 60 2,531 91
Liabilities
Foreign currency
derivatives including
embedded derivatives 5,086 57 3,135 42
Interest rate derivatives* 1,122 70 1,122 44
Commodity derivatives 451 40 351 55
Total 6,659 167 4,608 141
* inclusive of cross currency swaps
07 Segment reporting Segment information for the 1st quarter ended December 31, 2011 and December 31, 2012 is as follows:
MILLION €
Components
Technology Elevator
Technology Plant
Technology Marine
Systems Materials Services
Steel Europe Corporate
Steel Americas*
Stainless Global*
Consoli-dation Group
1st quarter ended
Dec. 31, 2011
External sales 1,754 1,351 940 366 3,008 2,079 6 327 1,307 0 11,138
Internal sales within the
Group (1) (3) 3 0 137 451 29 171 131 (918) 0
Total sales 1,753 1,348 943 366 3,145 2,530 35 498 1,438 (918) 11,138
EBIT 169 113 125 (116) 40 102 (99) (288) (321) (82) (357)
Adjusted EBIT 103 142 125 39 40 102 (101) (102) (242) (81) 25
1st quarter ended
Dec. 31, 2012
External sales 1,343 1,532 996 305 2,731 1,837 27 373 1,268 0 10,412
Internal sales within the
Group 2 0 5 0 84 416 28 115 134 (784) 0
Total sales 1,345 1,532 1,001 305 2,815 2,253 55 488 1,402 (784) 10,412
EBIT 43 171 110 31 36 29 (112) (87) 72 (89) 204
Adjusted EBIT 42 169 110 30 40 30 (97) (87) (69) (94) 74
* Discontinued operation
Net sales and adjusted EBIT as well as operating EBIT reconcile to EBT from continuing operations as presented in the consolidated statement of
income as following:
MILLION €
1st quarter ended
Dec. 31, 2011
1st quarter ended
Dec. 31, 2012
Sales as presented in segment reporting 11,138 10,412
- Sales of Steel Americas (498) (488)
- Sales of Stainless Global (1,438) (1,402)
+ Sales of discontinued operations to Group companies 302 249
+ Sales of Group companies to discontinued operations 92 66
Sales as presented in the statement of income 9,596 8,837

Condensed Interim Financial 1st Quarter 2012/2013 Selected notes
43
MILLION €
1st quarter ended
Dec. 31, 2011
1st quarter ended
Dec. 31, 2012
Adjusted EBIT as presented in segment reporting 25 74
Special items -382 130
EBIT as presented in segment reporting -357 204
- Depreciation of capitalized borrowing costs eliminated in EBIT -11 -3
+ Finance income 314 130
- Finance expense -459 -284
- Items of finance income assigned to EBIT based on economic classification -1 -26
+ Items of finance expense assigned to EBIT based on economic classification 0 19
EBT - Group (514) 40
- EBT of Steel Americas 285 90
- EBT of Stainless Global 331 (64)
EBT from continuing operations as presented in the statement of income 102 66
08 Cost of sales Cost of sales for the 1st quarter ended December 31, 2012, includes
write-downs of inventories of €13 million which mainly relate to the
Steel Europe and Components Technology business areas. As of
September 30, 2012, write-downs amounted to €49 million. In the 1st
quarter ended December 31, 2011, cost of sales includes write-downs
of inventories of €14 million which mainly relate to the Steel Europe
business area. In addition, income/(loss) from discontinued operations
includes write-downs of inventories of €0 million in the 1st quarter
ended December 31, 2012 (1st quarter ended December 31, 2011: €47
million).
09 Earnings per share Basic earnings per share is calculated as follows:
1st quarter ended Dec. 31, 2011 1st quarter ended Dec. 31, 2012
Total amount
in million € Earnings per
share in € Total amount
in million € Earnings per
share in €
Income from continuing operations (net of tax) (attributable to ThyssenKrupp AG's stockholders) 41 0.08 29 0.06
Income/(loss) from discontinued operations (net of tax) (attributable to ThyssenKrupp AG's stockholders) (501) (0.97) 6 0.01
Net income/(loss) (attributable to ThyssenKrupp AG's stockholders) (460) (0.89) 35 0.07
Weighted average shares 514,489,044 514,489,044
Relevant number of common shares for the
determination of earnings per share
Earnings per share have been calculated by dividing net income/(loss)
attributable to common stockholders of ThyssenKrupp AG (numerator) by
the weighted average number of common shares outstanding
(denominator) during the period. Shares sold during the period and
shares reacquired during the period have been weighted for the portion
of the period that they were outstanding.
There were no dilutive securities in the periods presented.

44 Condensed Interim Financial 1st Quarter 2012/2013 Selected notes
10 Additional information to the consolidated statement of cash flows
The liquid funds considered in the consolidated statement of cash flows
correspond to the „Cash and cash equivalents“ line item in the
consolidated statement of financial position taking into account the cash
and cash equivalents attributable to the disposal groups inclusive of
discontinued operations.
Non-cash investing activities
In the 1st quarter ended December 31, 2012, the acquisition and first-
time consolidation of companies created an increase in non-current
assets of €4 million (1st quarter ended December 31, 2011: €62 million).
The non-cash addition of assets under finance leases in the 1st quarter
ended December 31, 2012 amounted to €3 million (1st quarter ended
December 31, 2011: €1 million).
In connection with the second construction stage of the “ThyssenKrupp
Quarter” located in Essen, there was a non-cash addition of property,
plant and equipment of €5 million in the 1st quarter ended December 31,
2012 (1st quarter ended December 31, 2011: 0).
Non-cash financing activities
In the 1st quarter ended December 31, 2012, the acquisition and first-
time consolidation of companies did not result in an increase in gross
financial debt (1st quarter ended December 31, 2011: €2 million).
In connection with the second construction stage of the “ThyssenKrupp
Quarter” located in Essen, there was a non-cash increase of financial
debt of €5 million in the 1st quarter ended December 31, 2012 (1st
quarter ended December 31, 2011: 0).
11 Subsequent events In January 2013 Moody’s lowered ThyssenKrupp’s rating from Baa3 to
Ba1. As a result of the downgrading of the rating the Group’s
contractually agreed financing costs, mainly in connection with the
2009/2014 bond, will increase by a low two-digit million euro amount
from June 2013.
Essen, February 08, 2013
ThyssenKrupp AG
The Executive Board
Hiesinger
Burkhard Kerkhoff Labonte

45 1st Quarter 2012/2013 Review report
Review report
To ThyssenKrupp AG, Duisburg and Essen
We have reviewed the condensed consolidated interim financial
statements - comprising statement of financial position, the statement of
income and statement of comprehensive income, the statement of
changes in equity, the statement of cash flows and selected explanatory
notes – and the interim group management report of ThyssenKrupp AG,
Duisburg and Essen, for the period from October 1, 2012, to December
31, 2012, which are part of the quarterly financial report pursuant to §
(Article) 37x Abs. (paragraph) 3 WpHG ("Wertpapierhandelsgesetz"
German Securities Trading Act). The preparation of the condensed
consolidated interim financial statements in accordance with the IFRS
applicable to interim financial reporting as adopted by the EU and of the
interim group management report in accordance with the provisions of
the German Securities Trading Act applicable to interim group
management reports is the responsibility of the parent Company’s Board
of Managing Directors. Our responsibility is to issue a review report on
the condensed consolidated interim financial statements and on the
interim group management report based on our review.
We conducted our review of the condensed consolidated interim financial
statements and the interim group management report in accordance with
German generally accepted standards for the review of financial
statements promulgated by the Institut der Wirtschaftsprüfer (Institute of
Public Auditors in Gemany) (IDW) and additional observed the
International Standard on Review Engagements "Review of Interim
Financial Information Performed by the Independent Auditor of the Entity"
(ISRE 2410). Those standards require that we plan and perform the
review so that we can preclude through critical evaluation, with moderate
assurance, that the condensed consolidated interim financial statements
have not been prepared, in material respects, in accordance with the IFRS
applicable to interim financial reporting as adopted by the EU and that
the interim group management report has not been prepared, in material
respects, in accordance with the provisions of the German Securities
Trading Act applicable to interim group management reports. A review is
limited primarily to inquiries of company personnel and analytical
procedures and therefore does not provide the assurance attainable in a
financial statement audit. Since, in accordance with our engagement, we
have not performed a financial statement audit, we cannot issue an audit
opinion.
Based on our review, no matters have come to our attention that cause
us to presume that the condensed consolidated interim financial
statements have not been prepared, in material respects, in accordance
with the IFRS applicable to interim financial reporting as adopted by the
EU nor that the interim group management report has not been prepared,
in material respects, in accordance with the provisions of the German
Securities Trading Act applicable to interim group management reports.
Without qualifying our review report, we draw attention to the disclosures
in "Discontinued operations: Steel Americas and Stainless Global
business areas" in Note 2 of the selected explanatory notes regarding the
measurement of the assets of the Steel Americas business area.
Essen, February 8, 2013
PricewaterhouseCoopers
Aktiengesellschaft
Wirtschaftsprüfungsgesellschaft
Prof. Dr. Norbert Winkeljohann Volker Linke
(German Public Auditor) (German Public Auditor)

Further information 1st Quarter 2012/2013 Report by the Supervisory Board Audit Committee 46
Report by the Supervisory Board Audit Committee
The interim report for the 1st quarter of fiscal year 2012/2013 (October
to December 2012) and the review report by the Group’s financial
statement auditors were presented to the Audit Committee of the
Supervisory Board in its meeting on February 08, 2013 and explained
by the Executive Board. The auditors were available to provide
additional information. The Audit Committee approved the interim
report.
Essen, February 08, 2013
Chairman of the Audit Committee
Prof. Dr. Bernhard Pellens

Further information 1st Quarter 2012/2013 Contact and 2012/2013 dates 47
Contact and 2013/2014 dates
Contacts
Corporate Communications
Telephone +49 201 844-536043
Fax +49 201 844-536041
E-mail [email protected]
Investor Relations
E-mail [email protected]
Institutional investors and analysts
Telephone +49 201 844-536464
Fax +49 201 8456-531000
Private investors
Infoline +49 201 844-538382
Fax +49 201 8456-531000
Address
ThyssenKrupp AG
ThyssenKrupp Allee 1, 45143 Essen, Germany
P.O. Box 45063 Essen, Germany
Telephone +49 201 844-0
Fax (0201) 844-536000
E-mail [email protected]
2013/2014 dates
May 15, 2013
Interim report
1st half 2012/2013 (October to March)
Conference call with analysts and investors
August 14, 2013
Interim report
9 months 2012/2013 (October to June)
Conference call with analysts and investors
November 21, 2013
Annual Press Conference
Conference call with analysts and investors
January 17, 2014
Annual General Meeting
February xx, 2014
Interim report
1st quarter 2013/2014 (October to December)
Conference call with analysts and investors
Forward-looking statements
This report contains forward-looking statements that reflect manage-
ment’s current views with respect to future events. Such statements
are subject to risks and uncertainties that are beyond ThyssenKrupp’s
ability to control or estimate precisely, such as future market and
economic conditions, the behavior of other market participants, the
ability to successfully integrate acquired businesses and achieve
anticipated synergies and the actions of government regulators. If any
of these or other risks and uncertainties occur, or if the assumptions
underlying any of these statements prove incorrect, then actual results
may be materially different from those expressed or implied by such
statements. ThyssenKrupp does not intend or assume any obligation
to update any forward-looking statements to reflect events or circum-
stances after the date of these materials.
Rounding differences and rates of change
Percentages and figures in this report may include rounding differ-
ences. The signs used to indicate rates of change are based on eco-
nomic aspects: Improvements are indicated by a plus (+) sign, deterio-
rations are shown in brackets ( ). Very high positive and negative rates
of change (≥1,000% or ≤(100)%) are indicated by ++ and −− respec-
tively.
Variations for technical reasons
To meet statutory disclosure obligations, the Company has to submit
the interim report to the electronic Federal Gazette (Bundesanzeiger).
For technical reasons (e.g. conversion of electronic formats) there may
be variances in the accounting documents published in the electronic
Bundesanzeiger.
This English version of the interim report is a translation of the original
German version; in the event of variances, the German version shall
take precedence over the English translation.
Both language versions of the interim report can be downloaded from
the internet at http://www.thyssenkrupp.com. An interactive online
version is also available on our website in both languages.


ThyssenKrupp Ag ThyssenKrupp Allee 145143 Essen, Germanywww.thyssenkrupp.com
i
N
U
U
S
R
T


