This slide set summarizes key study characteristics and scientific contributions of CKiD.
Chronic Kidney Disease in Children (CKiD) Dossier
March 2015
Prepared by:CKiD Data Management and Analysis Center (KIDMAC)
Phone: 410-614-4751E-mail: [email protected]
Web: http://statepi.jhsph.edu/ckid/

CKiD Participating Sites

CKiD Study Structure
•Clinical Coordinating Centers
- Midwest (Warady)
- East Coast (Furth)
•Data Management and Analysis Center
- KIDMAC (Muñoz)
•Central Laboratory- University of Rochester (Schwartz)
Sponsorship: NIDDK, NICHD, NHLBI

Central Laboratories and Repositories
•Central Biochemistry Laboratory (George Schwartz, MD)
•ABPM Coordinating Center (Joshua Samuels, MD)
•Cardiovascular Imaging Core Research Laboratory (Peace Madueme , MD)
• NIDDK Biosample Repository (NIDDK BR) at Fisher BioServices – Rockville, MD
• NIH Genetics Initiative at Rutgers University Cell and DNA Repository – New Brunswick, NJ

SubcommitteesSteering
ProgressionSusan Furth, Co-ChairRobert Mak, Co-Chair
George Schwartz, Co-Chair
NeurocognitiveStephen Hooper, Co-ChairArlene Gerson, Co-Chair
Bradley Warady, Co-Chair
CardiovascularMark Mitnesfes, Co-ChairJoseph Flynn, Co-Chair
GrowthFrederick Kaskel, Co-ChairLarry Greenbaum, Co-Chair
DataAlvaro Muñoz, Co-ChairCraig Wong, Co-Chair
LaboratoryGeorge Schwartz, Chair
TrainingJackie Ndirangu, Co-Chair
Julie Starr, Co-Chair
OSMB

CKiD Study Design•O
bservational Cohort Study- 5 year study
initially, 10 year renewal (Oct 2003 – Jul
2008, Aug 2008 – Jul 2013, Aug 2013 – Jul 2018)
- Cohort 1 enrollment: Apr 2005 - Oct 2007
- Cohort 2 enrollment: Feb 2011 – March 2014
•Cohort 1: Children age 1 to 16 with mild to moderate kidney dysfunction
sGFR: 30 – 90 ml/min|1.73m2
•Cohort 2: Children age 1 to 16 with mildly impaired kidney function
eGFR: 45 – 90 ml/min|1.73m2

CKiD Study Goals
•Recruit & retain children with CKD
•Define risk factors for CKD progression
•Define effects of CKD progression on:
- Neurocognitive development/function
- Prevalence of CVD risk factors
- Growth failure

Exclusion Criteria•R
enal, other solid organ, bone marrow or stem cell transplantation•D
ialysis treatment within the past three months•C
ancer/leukemia or HIV diagnosis/treatment within last calendar year •C
urrent pregnancy or pregnancy within past year•I
nability to complete major data collection procedures (e.g.,
hypersensitivity to Iohexol, other contrast media or iodine)•C
urrent enrollment in a randomized clinical trial in which the specific treatment is unknown•P
lans to move out of area of any participating CKiD site (Families can be transferred to another CKiD site if they move)
•History of structural heart disease
•Genetic syndromes involving the central nervous system
(e.g., Down syndrome)
•Profound developmental delay due to severe anoxic brain injury
Year 3Year 2
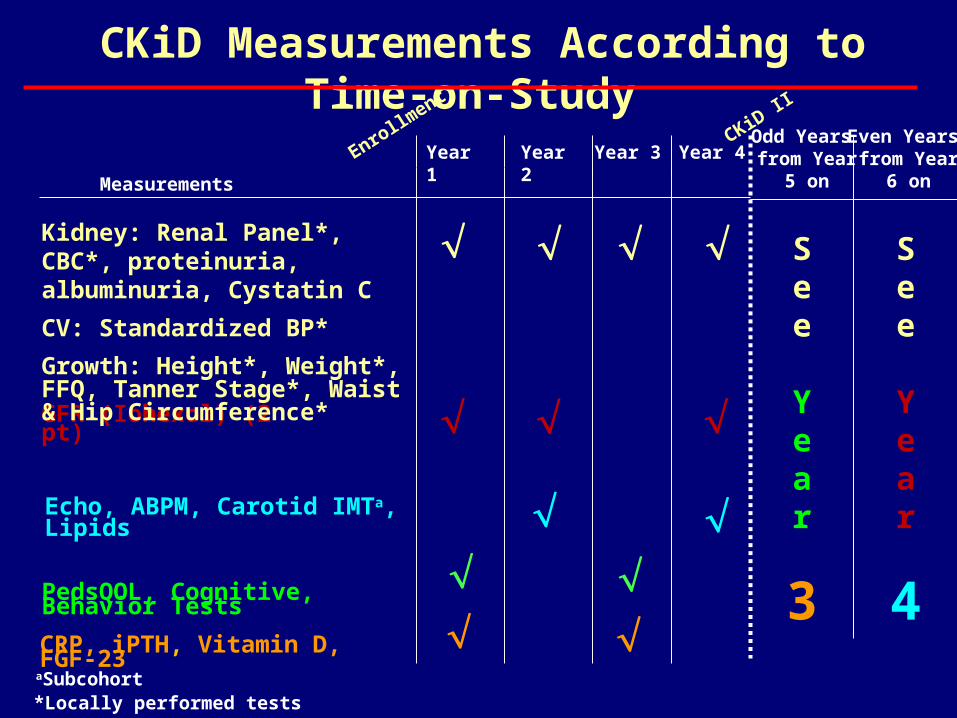
CKiD Measurements According to Time-on-Study
Enrollment
Year 1 Year 4Odd Years from Year
5 on
GFR (Iohexol) (2 pt)
Echo, ABPM, Carotid IMTa, Lipids
CRP, iPTH, Vitamin D, FGF-23
Measurements
Kidney: Renal Panel*, CBC*, proteinuria, albuminuria, Cystatin C
CV: Standardized BP*
Growth: Height*, Weight*, FFQ, Tanner Stage*, Waist & Hip Circumference*
*Locally performed tests
PedsQOL, Cognitive, Behavior Tests
aSubcohort
Even Years from Year
6 on
See Year
3
See
Year
4
CKiD II

891= 586 + 305V1a Visits with at least one
measurement of GFR
Cohorts 1 & 2 as of March 2015
275 (31%) = 128+147Glomerular
616 (69%) = 458+158Non-Glomerular
60+12a (25%)EVENT
68+135 EVENT-Free
131+3b (22%)EVENT
327+155EVENT-Free
a 60 = 16 Transplant + 43 Dialysis + 1 Death a 12 = 1 Transplant + 10 Dialysis + 1 Death
b 131 = 61 Transplant + 68 Dialysis + 2 Death b 3 = 3 Transplant + 0 Dialysis + 0 Death

2006
Publications

Glomerular Filtration Rate via Plasma Iohexol
Disappearance: Pilot Study for Chronic Kidney Disease
in Children
Schwartz, Furth, … , Muñoz Kidney Int 2006;69:2070-7.

Iohexol Disappearance Curves from the Blood
(Schwartz, Furth, … , Muñoz . Kidney Int 2006;69:2070-7.)
Minutes from Iohexol Infusion
Iohe
xol i
n m
g/m
l (lo
g sc
ale)
slow component
Minutes from Iohexol Infusion
Iohe
xol m
inus
slo
w c
ompo
nent
in m
g/m
l (lo
g sc
ale)
fast component
0 100 200 300
0.0
0.1
0.2
0.3
0.4
0.5
0.6
Iohe
xol i
n m
g/m
l
slow + fast
slow
Minutes from Iohexol Infusion
GFR (9 pts)
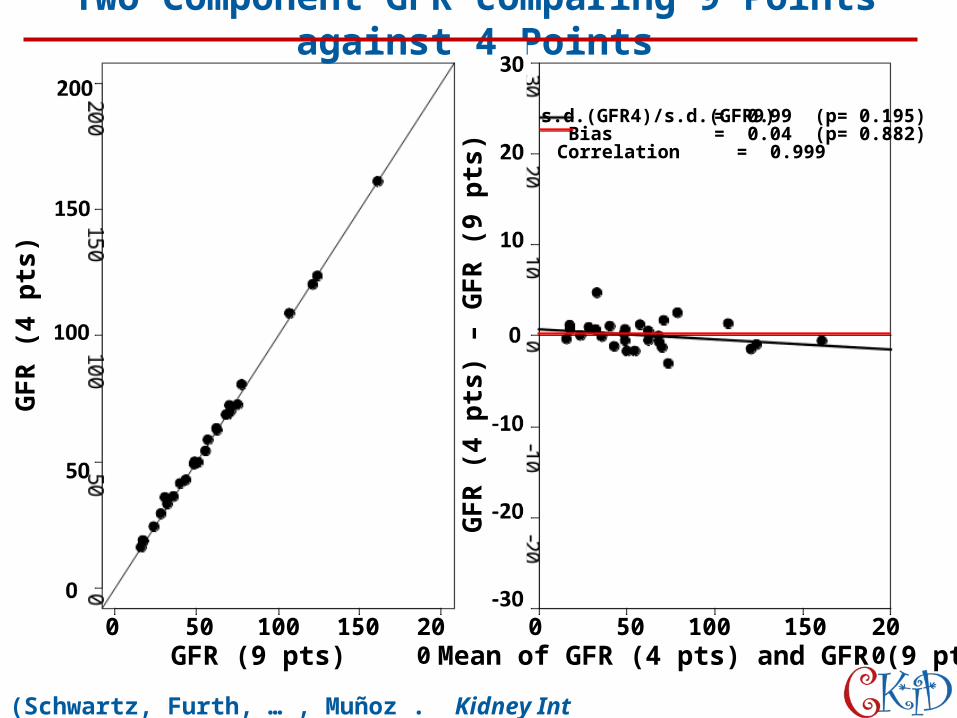
Two Component GFR comparing 9 Points against 4 Points
(Schwartz, Furth, … , Muñoz . Kidney Int 2006;69:2070-7.)
GFR
(4 p
ts)
s.d.(GFR4)/s.d.(GFR9)BiasCorrelation
= 0.99 (p= 0.195) = 0.04 (p= 0.882) = 0.999
0 50 100 150 200 0 50 100 150 200
GFR
(4 p
ts) –
GFR
(9 p
ts)
.
Mean of GFR (4 pts) and GFR (9 pts)

One Component GFR versus GFR from the Two-Compartment Model
(Schwartz, Furth, … , Muñoz . Kidney Int 2006;69:2070-7.) GFR based on slow component only
GFR
(9 p
ts)
GFR (9 pts) = 0.9950 x GFR (A) – 0.001159 x [GFR (A)]2
0 50 100 150 200 250
200
250
150
100
50
0

(Schwartz, Furth, … , Muñoz . Kidney Int 2006;69:2070-7.)
GFR
(2 p
ts)
GFR
(2 p
ts) –
GFR
(9 p
ts)
s.d.(GFR2)/s.d.(GFR9)BiasCorrelation
= 0.97 (p= 0.357) = -1.21 (p= 0.266) = 0.986
GFR (9 pts) Mean of GFR (2 pts) and GFR (9 pts)
0 50 100 150 200 0 50 100 150 200
.GFR Based on Nine Points and
One Component GFR Based on 2 Points

.GFR Based on Nine Points versus Estimated
GFR from Schwartz Formula
(Schwartz, Furth, … , Muñoz . Kidney Int 2006;69:2070-7.) GFR (9 pts) Mean of eGFR
and GFR (9 pts)
eGFR
– G
FR (9
pts
)
s.d.(eGFR)/s.d.(GFR9)BiasCorrelation
= 1.17 (p= 0.038) = 12.22 (p=<0.001) = 0.934
0 50 100 150 200 0 50 100 150 200
eGFR

.
GFR Based on Nine Points vs. Standard Urine Iohexol Clearance
(Schwartz, Furth, … , Muñoz . Kidney Int 2006;69:2070-7.) GFR (9 pts)
urin
eGFR
Mean of urineGFR and GFR(9 pts)
urin
eGFR
– G
FR (9
pts
)
s.d.(urineGFR)/s.d.(GFR9)BiasCorrelation
= 1.19 (p= 0.171) = -13.95 (p= 0.008)= 0.77
0 50 100 150 200 50 100 150 2000

Design and Methods of the Chronic Kidney Disease in
Children (CKiD) Prospective Cohort Study
Furth, Cole, … , WaradyClin J Am Soc Nephrol 2006;1:1006-15.

Statistical Power for Decline in GFR at 5% Two-Sided Significance Level with N= 540 and Overall Rate of GFR Decline of
5 ml/min per 1.73 m2 per Year.
(Furth, Cole, … , Warady. Clin J Am Soc Nephrol 2006;1:1006-15.)
Slope of exposed group/Slope of unexposed groupRelative Risk
Pow
er (%
)
100
80
60
40
20
0
1.1 1.2 1.3 1.4 1.5
40% exposed30% exposed20% exposed
2008
Publications
Hemoglobin Decline in Children with Chronic Kidney Disease:
Baseline Results from the Chronic Kidney Disease in Children Prospective Cohort Study
Fadrowski, Pierce, … , Furth Clin J Am Soc Nephrol 2008;3:457-62.

Hemoglobin versus GFR in Children with CKD
(Fadrowski, Pierce, … , Furth. Clin J Am Soc Nephrol 2008;3:457-62.)
Hem
oglo
bin
(g/d
L)
Glomerular Filtration Rate (mL/min|1.73m2)

2009
Publications

Association of Proteinuria with Race, Cause of Chronic Kidney
Disease, and Glomerular Filtration Rate in the Chronic Kidney Disease in Children Study
Wong, Pierce, … , SchwartzClin J Am Soc Nephrol 2009;4:812-9.

Urine Protein: Creatinine Ratios (Up/c) by Iohexol-Measured GFR (iGFR)
(Wong, Pierce, … , Schwartz. Clin J Am Soc Nephrol 2009;4:812-9.)Iohexol GFR, mL/min|1.73m2 (log scale)
Up/
c (lo
g sc
ale)
Non-Glomerular CKD, N= 328 Glomerular CKD, N= 91 Nephrotic Proteinuria
Significant Proteinuria
Norm
al

New Equations to Estimate GFR in Children with Chronic Kidney
Disease
Schwartz, Muñoz, … , Furth J Am Soc Nephrol 2009;20:629-37.
(Commentary by Lemley, KV in Nature Reviews Nephrology
2009;5:310-1)

Analysis of Log-Transformed Height/Scr and iGFR
(Schwartz, Muñoz, … , Furth. J Am Soc Nephrol 2009;20:629-37.)
Height (meters)/Scr
R-square= 65.0%iGFR= 41.2 (ht/Scr)0.775
Y= log(iGFR), X= log(height[meters]/Scr)
iGFR

Analysis of Log-Transformed 1.8/Cystatin C and iGFR
(Schwartz, Muñoz, … , Furth. J Am Soc Nephrol 2009;20:629-37.)
1.8/cystatin C
R-square= 43.7%iGFR= 41.9 (1.8/cystatin C)0.777
Y= log(iGFR), X= log(1.8/cystatin C)
iGFR

Analysis of Log-Transformed 30/BUN and iGFR
(Schwartz, Muñoz, … , Furth. J Am Soc Nephrol 2009;20:629-37.)
30/BUN
R-square= 39.0%iGFR= 39.8 (30/BUN)0.510
Y= log(iGFR), X= log(30/BUN)
iGFR

Bland-Altman Plot of Observed iGFR and Model III eGFR in a Testing Data Set of 168 Individuals in the CKiD Study
(Schwartz, Muñoz, … , Furth. J Am Soc Nephrol 2009;20:629-37.)
Average of eGFR and iGFR (39.4 +/- 14.4)
eGFR
- iG
FR (-
2.23
+/-
7.6
0)

Validation of Creatinine Assays Utilizing HPLC and IDMS
Traceable Standards in Sera of Children
Schwartz, Kwong, … , MuñozPediatr Nephrol 2009;24:113-9.

(Schwartz, Kwong, …, Muñoz. Pediatr Nephrol 2009;24:113-9.)
Comparison of Siemens Advia Enzymatic Assay against HPLC
Enzymatic Scr HPLC Scr
Correlation= 0.98N= 201
5
4
3
2
1.5
1
0.5

Bland-Altman Plot Comparing Siemens Advia Enzymatic Assay against High Performance Liquid Chromatography
(Schwartz, Kwong, …, Muñoz. Pediatr Nephrol 2009;24:113-9.)Mean of Enzymatic Scr and HPLC Scr
Enzy
mati
c Sc
r/H
PLC
Scr
s.d.(Enzymatic Scr)/ s.d.(HPLC Scr) = 0.992 (p= 0.523 for equality of s.d.s)Bias (Enzymatic Scr/ HPLC Scr) = 1.07 (p< 0.001 for no bias)Correlation = 0.984
Bias = 0.15 s.d of mean

Comparison of Siemens Advia Enzymatic Assay Against HPLC at Low Levels of Creatinine
(Schwartz, Kwong, …, Muñoz. Pediatr Nephrol 2009;24:113-9.)
Enzymatic Scr HPLC Scr
Correlation= 0.83N= 50
0.1
0.25
0.5
1

Comparison of Siemens Advia Enzymatic Assay Against High-Performance Liquid Chromatography (HPLC)
(Schwartz, Kwong, …, Muñoz. Pediatr Nephrol 2009;24:113-9.)
Enzymatic Scr HPLC Scr
0.1
0.25
543
2
1.5
.5
1

Urinary Incontinence in the CKiD Cohort and Health Related
Quality of Life
Dodson, Cohn, … , Furth J Urol 2009;182:2007-14.

Child Reported PedsQL by Continence Group
TotalScore
SocialFunctioning
SchoolFunctioning
PhysicalFunctioning
EmotionalFunctioning
TT BW nTT TT BW nTT TT BW nTT TT BW nTTTT BW nTT
Continence Status
Peds
QL:
Chi
ld S
elf-
Repo
rt
0
20
40
60
80
100
(Dodson, Cohn, … , Furth. J Urol 2009;182:2007-14.)

PhysicalFunctioning
SchoolFunctioning
TotalScore
SocialFunctioning
EmotionalFunctioning
TT BW nTT TT BW nTT TT BW nTT TT BW nTTTT BW nTT
Continence Status
Peds
QL:
Par
ent P
roxy
-Rep
ort
0
20
40
60
80
100
(Dodson, Cohn, … , Furth. J Urol 2009;182:2007-14.)
Parent Proxy Reported PedsQL by Continence Group

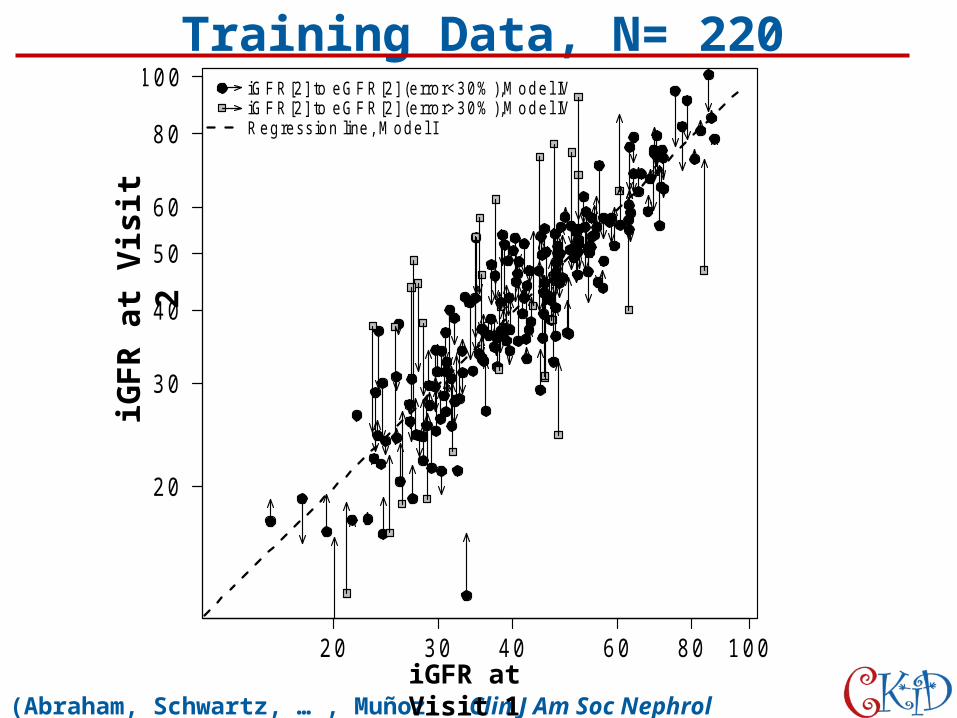
Longitudinal Formulas to Estimate Glomerular Filtration
Rate in Children with CKD
Abraham, Schwartz, … , Muñoz Clin J Am Soc Nephrol
2009;4:1724-30.
T ra ining data
iG F R at vis it 1
iGF
R a
t vi
sit
2
20 30 40 60 80 100
20
30
40
50
60
80
100 iG F R [2] to e G F R [2] (e rro r<30% ),M o de l IViG F R [2] to e G F R [2] (e rro r>30% ),M o de l IVR e gre s s io n line , M o de l I
Training Data, N= 220
(Abraham, Schwartz, … , Muñoz. Clin J Am Soc Nephrol 2009;4:1724-30.)
iGFR
at V
isit
2
iGFR at Visit 1

V alidation data
iG F R at vis it 1
iGF
R a
t vi
sit
2
20 30 40 60 80 100
20
30
40
50
60
80
100 iG F R [2] to e G F R [2] (e rro r<30% ),M o de l IViG F R [2] to e G F R [2] (e rro r>30% ),M o de l IV
Validation Data, N= 109
(Abraham, Schwartz, … , Muñoz. Clin J Am Soc Nephrol 2009;4:1724-30.)
iGFR
at V
isit
2
iGFR at Visit 1

2010
Publications

Optimizing Iohexol Plasma Disappearance Curves to Measure the Glomerular
Filtration Rate in Children with Chronic Kidney Disease
Schwartz, Abraham, … , MuñozKidney Int 2010;77:65-71.

100
150
Iohexol-Based GFR as a Function of Time of Sampling for the Slow Curve
(Schwartz , Abraham, … , Muñoz. Kidney Int 2010;77:65-71.)
N= 27 (Pilot Study)
Sampling Interval (hours)
Iohe
xol G
FR (m
l/m
in p
er 1
.73
m2 )
75
50
40
30
20
4 5 6

Relationship between GFRs based on the Slow Component only (x-axis) and the Four-Point GFR (double exponential, y-axis)
(Schwartz , Abraham, … , Muñoz. Kidney Int 2010;77:65-71.) GFR based on Slow Component Only
GFR
Bas
ed o
n Sl
ow
and
Fast
Com
pone
nts
1.0019 x slowGFR – 0.001258 x slowGFR2
90
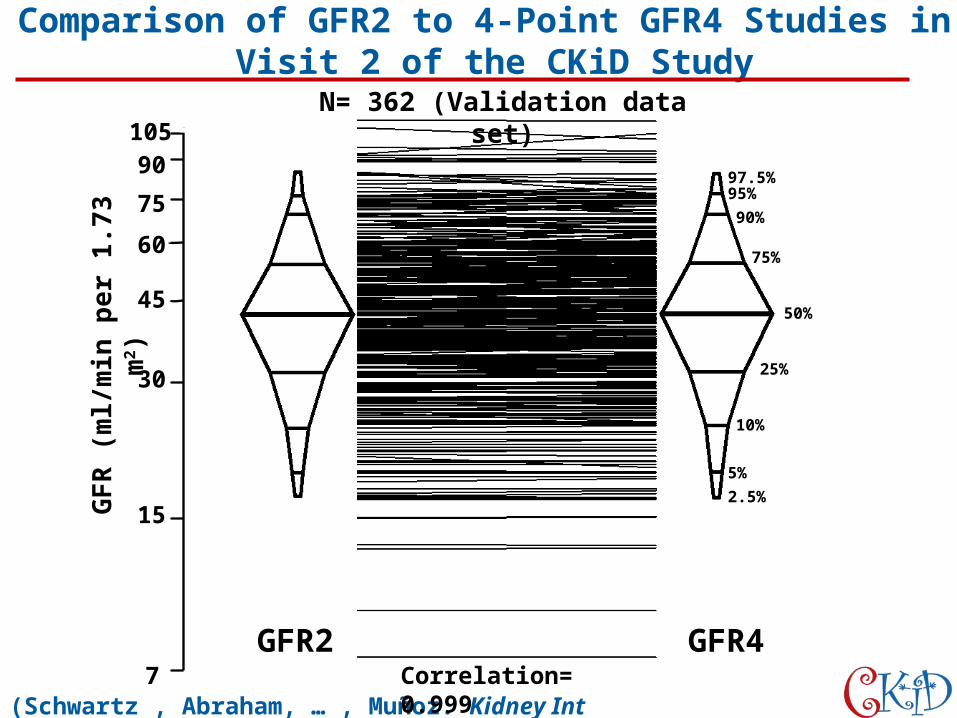
75
Comparison of GFR2 to 4-Point GFR4 Studies in Visit 2 of the CKiD Study
(Schwartz , Abraham, … , Muñoz. Kidney Int 2010;77:65-71.) Correlation= 0.999
GFR
(ml/
min
per
1.7
3 m
2 )N= 362 (Validation data set)
2.5%5%
10%
25%
50%
75%
90%95%97.5%
GFR2 GFR4
105
60
45
30
15
7

Linear Regression of GFR2 on GFR4 Showing a Very Close Agreement and a Very High Correlation
(Schwartz , Abraham, … , Muñoz. Kidney Int 2010;77:65-71.)
GFR
2 (m
l/m
in p
er 1
.73
m2 )
N= 362 (Validation data set)
GFR4 (ml/min per 1.73 m2)

Bland-Altman Analysis of GFR2 Versus Four-Point GFR Showing an Insignificant Bias of -0.002
(Schwartz , Abraham, … , Muñoz. Kidney Int 2010;77:65-71.)
N= 362 (Validation data set)
Geometric Mean of GFR2 and GFR4
GFR
2/G
FR4
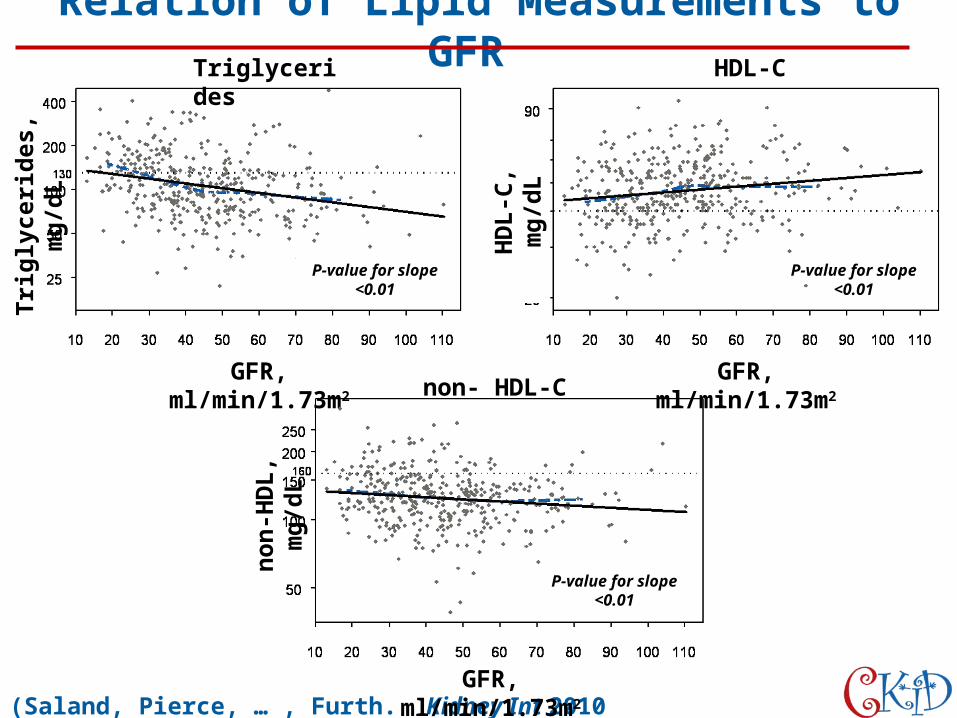
Dyslipidemia in Children with Chronic Kidney Disease: A
Report of the Chronic Kidney Disease in Children (CKiD)
Study
Saland, Pierce, … , FurthKidney Int 2010 Dec;78:1154-63.
P-value for slope <0.01
Relation of Lipid Measurements to GFR
(Saland, Pierce, … , Furth. Kidney Int 2010 Dec;78:1154-63.)
Triglycerides HDL-C
non- HDL-CGFR, ml/min/1.73m2 GFR, ml/min/1.73m2
GFR, ml/min/1.73m2
HD
L-C,
mg/
dL
non-
HD
L, m
g/dL
Trig
lyce
rides
, mg/
dL
P-value for slope <0.01
P-value for slope <0.01

(Saland, Pierce, … , Furth. Kidney Int 2010 Dec;78:1154-63.)
0
10
20
30
40
50
60
70
> = 50 [40-50] [30-40] < 30
3 markers 2 markers 1 marker
Prevalence of Dyslipidemia by GFRP
erce
nt
(%) 38%
(53/141) 31% (26/83)
53% (46/87)
65% (52/80)
iGFR, mL/min/1.73m2

0
10
20
30
40
50
60
70
80
Normal Mild Moderate Nephrotic
3 markers 2 markers 1 marker
(Saland, Pierce, … , Furth. Kidney Int 2010 Dec;78:1154-63.)
Prevalence of Dyslipidemia by Up/cP
erce
nt
(%)
35% (36/103)
44% (71/160) 46% (33/72)
73% (32/44)
Proteinuria (Up/c)

Sleep and Fatigue Symptoms in Children and Adolescents with CKD: A Cross-Sectional
Analysis from the Chronic Kidney Disease in Children
(CKiD) StudyRoumelioti, Wentz, … , Unruh
Am J Kidney Dis 2010;55:269-80.

overall >=50 40-<50 30-<40 <30
mGFR, ml/min/1.73 m²
Pe
rce
nt
0
20
40
60
80
100
Often or Almost Always Sometimes Almost Never Never
Child Report of Trouble Sleeping
N= 245 83 54 62 46
(A)
overall >=50 40-<5030-<40 <30mGFR, ml/min/1.73 m²
Pe
rce
nt
0
20
40
60
80
100
Parent Report of Trouble Sleeping
N= 244 78 58 62 46
(B)
overall >=50 40-<50 30-<40 <30
mGFR, ml/min/1.73 m²
Pe
rce
nt
0
20
40
60
80
100
N= 244 83 53 62 46
Child Report of Low Energy
(C)
overall >=50 40-<50 30-<40 <30
mGFR, ml/min/1.73 m²
Pe
rce
nt
0
20
40
60
80
100
N= 243 77 58 62 46
Parent Report of Low Energy
(D)
Distribution of Child and Parent Reports of Trouble Sleeping and Low Energy by Measured GFR Level
(Roumelioti, Wentz, … , Unruh. Am J Kidney Dis 2010; 55: 269-280.)

overall >=50 40-<5030-<40 <30
mGFR, ml/min/1.73 m²
Pe
rce
nt
0
20
40
60
80
100
Moderate or Severe Mild No Symptoms
Weakness
N= 281 91 63 64 63
(A)
overall >=50 40-<50 30-<40 <30
mGFR, ml/min/1.73 m²
Pe
rce
nt
0
20
40
60
80
100
Waking Up Early
N= 280 91 63 63 63
(B)
overall >=50 40-<5030-<40 <30
mGFR, ml/min/1.73 m²
Pe
rce
nt
0
20
40
60
80
100
Falling Asleep During Day
N= 278 89 63 63 63
(C)
overall >=50 40-<50 30-<40 <30
mGFR, ml/min/1.73 m²
Pe
rce
nt
0
20
40
60
80
100
Decreased Alertness
N= 280 90 63 64 63
(D)(Roumelioti, Wentz, … , Unruh. Am J Kidney Dis 2010; 55: 269-280.)
Distribution of Child Report of Weakness, Waking up Early, Falling Asleep During the Day, and Decreased Alertness

Adjusted Estimated QOL Scores by Child and Parent for Trouble Sleeping and Low Energy
(Roumelioti, Wentz, … , Unruh. Am J Kidney Dis 2010; 55: 269-280.)
Child ReportTrouble Sleeping
Parent ReportTrouble Sleeping
Child ReportLow Energy
Parent ReportLow Energy
Child
Ove
rall
QO
L
Child
Ove
rall
QO
L
Pare
nt O
vera
ll Q
OL
Pare
nt O
vera
ll Q
OL
Never Almost Never Sometimes Often or Almost Always N= 91 48 40 23 N= 91 56 42 16 N= 70 62 46 23 N= 66 48 62 28

Adjusted Estimated QOL Scores by Parent and/or Child Report of Symptom Severity for Weakness, Waking up too Early, Falling Asleep
During the Day, and Decreased Alertness
(Roumelioti, Wentz, … , Unruh. Am J Kidney Dis 2010; 55: 269-280.)
Weakness Waking up Early Falling Asleep During Day
Decreased Alertness
Child
Ove
rall
QO
L
N= 132 26 28 N= 155 25 5 N= 131 38 16 N= 164 11 10
No Symptoms Mild Symptoms Severe/Moderate Symptoms

Masked Hypertension Associates with Left
Ventricular Hypertrophy in Children with CKD
Mitsnefes, Flynn, … , WaradyJ Am Soc Nephrol 2010;21:137-44.
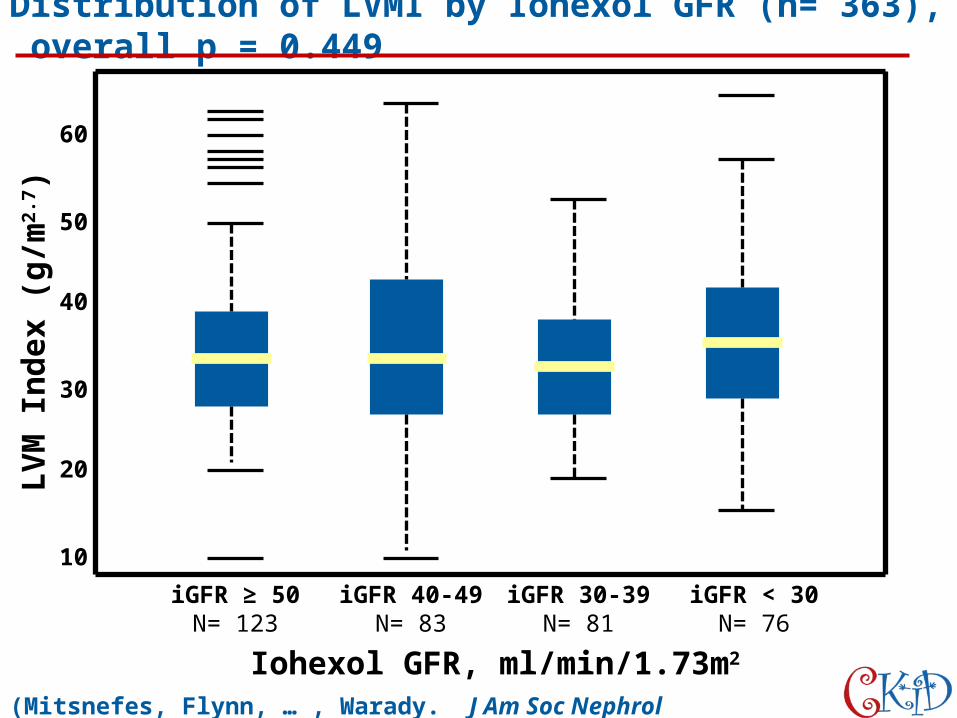
Distribution of LVMI by Iohexol GFR (n= 363), overall p = 0.449
(Mitsnefes, Flynn, … , Warady. J Am Soc Nephrol 2010;21:137-44.)
20
40
60
50
30
10
LVM
Inde
x (g
/m2.
7 )
Iohexol GFR, ml/min/1.73m2
iGFR ≥ 50N= 123
iGFR 40-49N= 83
iGFR 30-39N= 81
iGFR < 30N= 76

LVH by Casual, Sleep, and Wake Systolic Blood Pressures
(Mitsnefes, Flynn, … , Warady. J Am Soc Nephrol 2010;21:137-44.)
0
10
20
30
40
50
Normal HT0
10
20
30
40
50
Normal HT
0
10
20
30
40
50
Normal HT
LVH
, %
Casual SBP Sleep SBP Wake SBP
NormalN= 304
HypertensionN= 43
NormalN= 145
HypertensionN= 86
HypertensionN= 81
P= 0.005P= 0.006P= 0.002
NormalN= 140

(Mitsnefes, Flynn, … , Warady. J Am Soc Nephrol 2010;21:137-44.)
LVH by Casual, Sleep, and Wake Diastolic Blood Pressures
0
10
20
30
40
50
Normal HT0
10
20
30
40
50
Normal HT
0
10
20
30
40
50
Normal HT
Casual DBP Sleep DBP Wake DBP
HypertensionN= 37
HypertensionN= 95
HypertensionN= 69
P= 0.004P= 0.070P= 0.070
LVH
, %
NormalN= 311
NormalN= 131
NormalN= 157

LVH by Casual and Ambulatory BP Status (n= 198)
(Mitsnefes, Flynn, … , Warady. J Am Soc Nephrol 2010;21:137-44.)
0
10
20
30
40
50
P = 0.039
P = 0.097
Overall P = 0.003
LVH
, %
NormotensiveN= 83
White CoatHypertension
N= 4
MaskedHypertension
N= 76
ConfirmedHypertension
N= 35

Health-Related Quality of Life of Children with Mild to Moderate Chronic Kidney
Disease
Gerson, Wentz, … , FurthPediatrics 2010;125:349-57.

Percentage of CKD Group with Poor Quality of Life
(Gerson, Wentz, … , Furth. Pediatrics 2010;125:349-57.)
20
40
50
30
10
0
Falli
ng 1
SD
Bel
ow M
ean,
%
QOL Variables
ParentOverall
ParentPhysical
ParentSchool
ParentSocial
ParentEmotional
ChildOverall
ChildPhysical
ChildSchool
ChildSocial
ChildEmotional

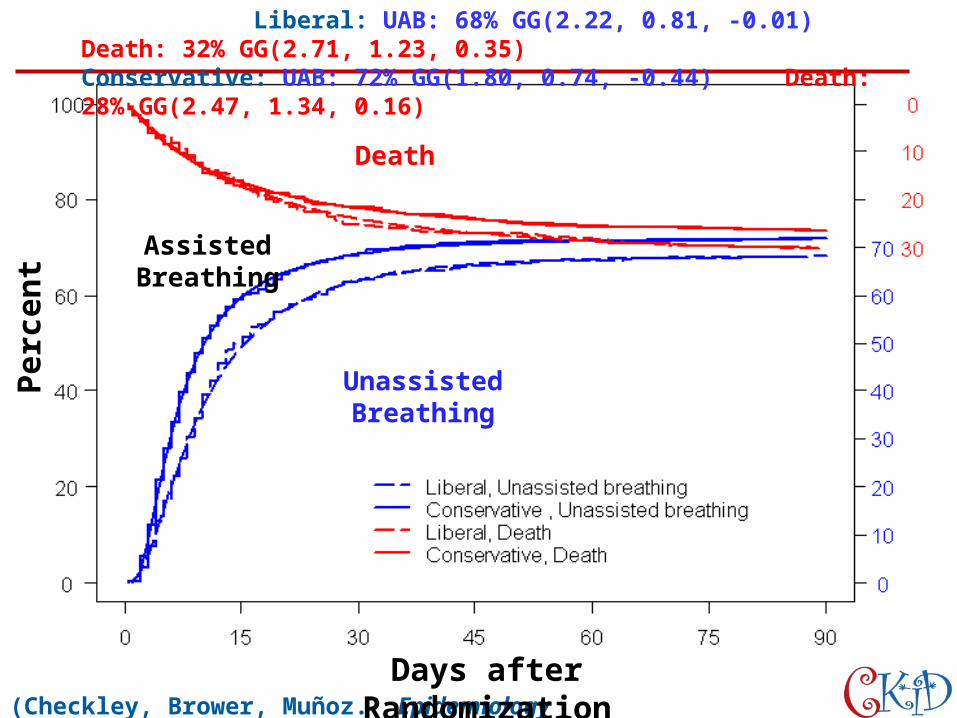
Inference for Mutually Exclusive Competing Events
through a Mixture of Generalized Gamma
Distributions
Checkley, Brower, Muñoz Epidemiology 2010;21:557-65.
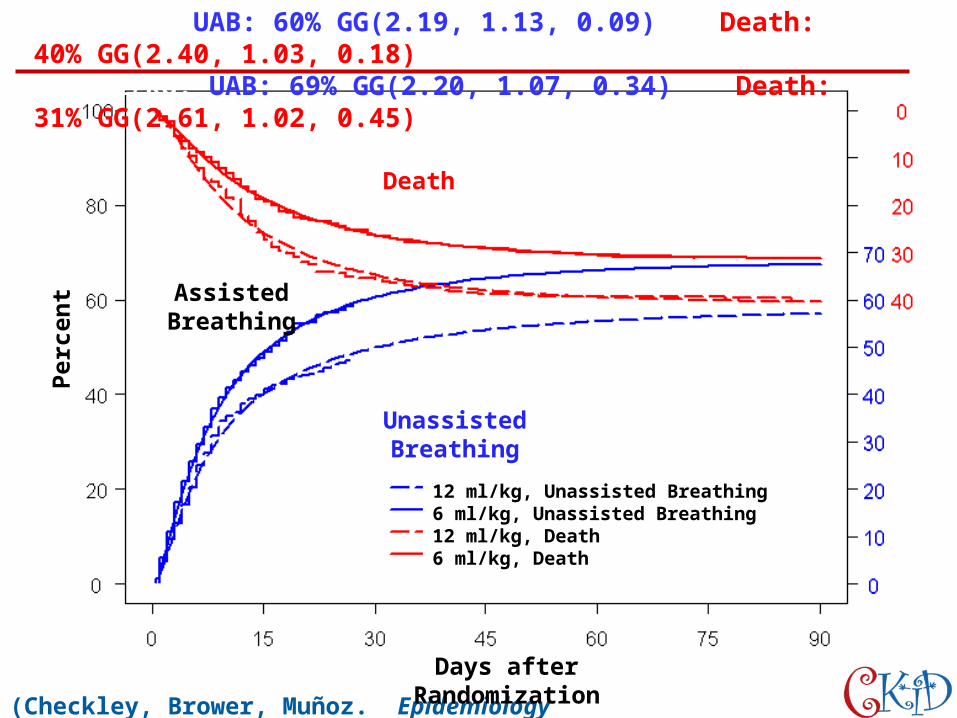
(Checkley, Brower, Muñoz. Epidemiology 2010;21:557-65.)
12 ml/kg: UAB: 60% GG(2.19, 1.13, 0.09) Death: 40% GG(2.40, 1.03, 0.18) 6 ml/kg: UAB: 69% GG(2.20, 1.07, 0.34) Death: 31% GG(2.61, 1.02, 0.45)
Days after Randomization
Perc
ent
12 ml/kg, Unassisted Breathing6 ml/kg, Unassisted Breathing12 ml/kg, Death6 ml/kg, Death
.Assisted Breathing
Death
Unassisted Breathing
Days after Randomization
Perc
ent

Times to Unassisted Breathingp-value= 0.477
Probability of Unassisted Breathingp-value= 0.005
(Checkley, Brower, Muñoz. Epidemiology 2010;21:557-65.)
Probability of Death
8.6
8.0
10.4
11.3
Times to Deathp-value= 0.718
.
.
.
.
60%31%
40%
69%

UAB: [0.69x (1-Surv of GG(2.20,1.07,0.34))] / [0.60x(1-Surv of GG(2.19,1.13,0.09))] Death: [0.31x(1-Surv of GG(2.61,1.02,0.45))] / [0.40x(1-Surv of GG(2.40,1.03,0.18))]
(Checkley, Brower, Muñoz. Epidemiology 2010;21:557-65.)
Unassisted Breathing (UAB)
Death
Days after Randomization
Rela
tive
Cum
ulati
ve In
cide
nce
of U
AB a
nd D
eath
of t
he 6
ml/
kg to
12
ml/
kg S
trat
egie
s 2/1
3/2
5/4
11/101
10/11
4/5
2/3
1/2
5 10 15 20 25
(Checkley, Brower, Muñoz. Epidemiology 2010;21:557-65.)
Death
Unassisted Breathing
.Assisted Breathing
Days after Randomization
Perc
ent
Liberal: UAB: 68% GG(2.22, 0.81, -0.01) Death: 32% GG(2.71, 1.23, 0.35)Conservative: UAB: 72% GG(1.80, 0.74, -0.44) Death: 28% GG(2.47, 1.34, 0.16)

Probability of Death
(Checkley, Brower, Muñoz. Epidemiology 2010;21:557-65.)
Times to Deathp-value = 0.693
Times to Unassisted Breathingp-value < 0.001
Probability of Unassisted Breathingp-value = 0.202
9.2
6.7
13.0
11.0
.32%
.
.
.
68%28%72%

(Checkley, Brower, Muñoz. Epidemiology 2010;21:557-65.)
Unassisted breathing (UAB)
Death
Days after Randomization
Rela
tive
Cum
ulati
ve In
cide
nce
of U
AB a
nd D
eath
of
the
Cons
erva
tive
to L
iber
al S
trat
egie
s UAB: [0.72x(1-Surv of GG(1.80,0.74,-0.44))] / [0.68x(1-Surv of GG(2.22,0.81,-0.01))] Death: [0.28x(1-Surv of GG(2.47,1.34,0.16))] / [0.32x(1-Surv of GG(2.71,1.23,0.35))]
Days after randomization
5 10 15 20 25
1/2
2/3
4/5
10/11
1
11/10
5/4
3/2
2/1
RC
I of U
AB
an
d d
ea
th o
f the
co
nse
rva
tive
to li
be
ral s
tra
teg
y

Hemoglobin Differences by Race in Children with CKD
Atkinson, Pierce, … , Furth, Am J Kidney Dis 2010;55:1009-17.
(Editorial by Filler G, Huang SS, Sharma AP, pages 981-3)

mGFR, ml/min/1.73m² (log scale)
Hb
, g
/dL
15 20 30 40 50 60 70 90 110
8
10
12
14
16
18 White (n=338) A-A (n=91)
(Atkinson, Pierce, … , Furth. Am J Kidney Dis 2010;55:1009-17.)
Hemoglobin (Hb) Level versus Log-TransformedIohexol-Measured GFR (mGFR) by Race
Hem
oglo
bin,
g/d
L
.mGFR, ml/min/1.73m2 (log scale)

(Atkinson, Pierce, … , Furth. Am J Kidney Dis 2010;55:1009-17.)
Percentile Plots Show Distribution of Hb levels for Children not Using ESAs (n= 364) Versus those Using ESAs (n= 65) by Race
Hem
oglo
bin,
g/d
L
.Race/ESA use

Univariate Race-Specific Generalized Gamma (GG)-Derived Probability Density Curves of Hb Levels with
Left-Censoring for Current ESA Users
(Atkinson, Pierce, … , Furth. Am J Kidney Dis 2010;55:1009-17.) Hemoglobin, g/dL
Prob
abili
ty D
ensi
ty

Relative Percentile Plot of HB Levels for 81 African American versus 315 White Children
(Atkinson, Pierce, … , Furth. Am J Kidney Dis 2010;55:1009-17.) p (%)
Rela
tive
Perc
entil
es o
f Hb,
A-A
v. W
hite

2011
Publications

Casual Blood Pressure and Neurocognitive Function in
Children with Chronic Kidney Disease: A Report of the
Children with Chronic Kidney Disease Cohort Study
Lande, Gerson, … , FlynnCJASN 2011;6:1831-7.

Adjusted Performance IQ by Blood Pressure Index
(Lande, Gerson, … , Flynn. CJASN 2011;6:1831-7.)
Adju
sted
Per
form
ance
IQ
Systolic BP Index
Adju
sted
Per
form
ance
IQ
Diastolic BP Index0.7 0.8 0.9 1.0 1.1 1.2 1.3 1.21.00.80.60.4
60
80
100
120
140
60
80
100
120
140

Serum Adiponectin Complexes and
Cardiovascular Risk in Children with Chronic Kidney
Disease
Lo, Salisbury, … , MitsnefesPediatr Nephrol 2011;26:2009-17.

Adiponectin Complex Distribution in Serum of a Child with Chronic Kidney Disease (CKD)
(Lo, Salisbury, … , Mitsnefes. Pediatr Nephrol 2011;26:2009-17.)

Distribution of Adiponectin Complexes According to Gender, (Median (IQR))
(Lo, Salisbury, … , Mitsnefes. Pediatr Nephrol 2011;26:2009-17.)
0
20
40
60
Per
cen
t
HMW LMW Trimer
All P> 0.15
Girls Boys Girls Boys Girls Boys

Distribution of Adiponectin Complexes According to Race, (Median (IQR))
(Lo, Salisbury, … , Mitsnefes. Pediatr Nephrol 2011;26:2009-17.)
0
20
40
60
Per
cen
t
HMW LMW Trimer
All P> 0.15
AA Non-AA AA Non-AA AA Non-AA
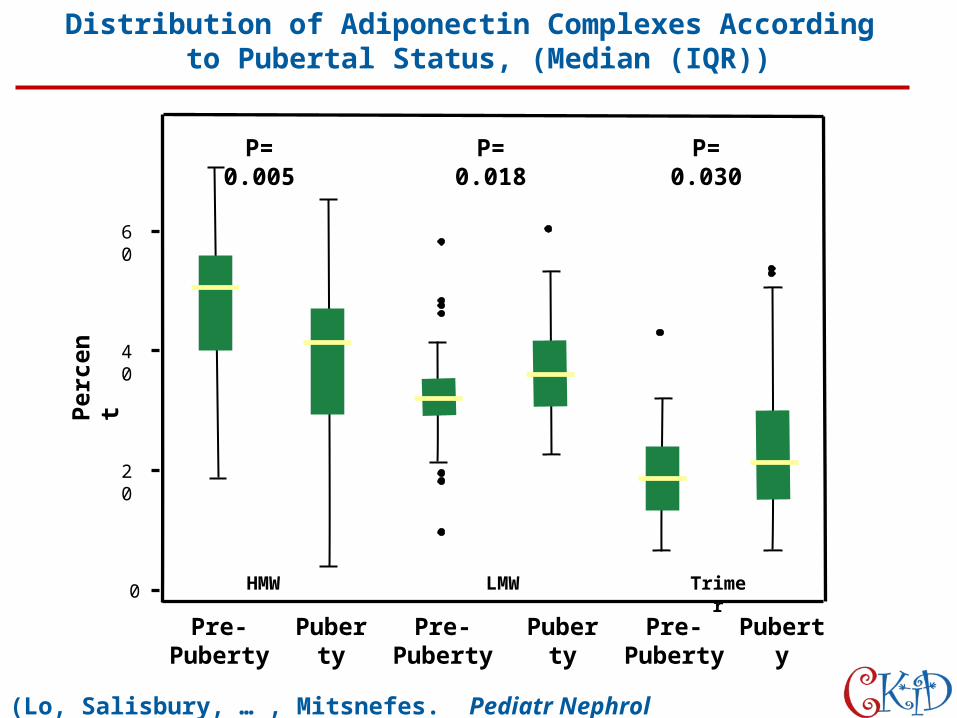
Distribution of Adiponectin Complexes According to Pubertal Status, (Median (IQR))
(Lo, Salisbury, … , Mitsnefes. Pediatr Nephrol 2011;26:2009-17.)
0
20
40
60
Per
cen
t
HMW LMW Trimer
P= 0.005
Pre-Puberty
Puberty
Pre-Puberty
Puberty
Pre-Puberty
Puberty
P= 0.018 P= 0.030
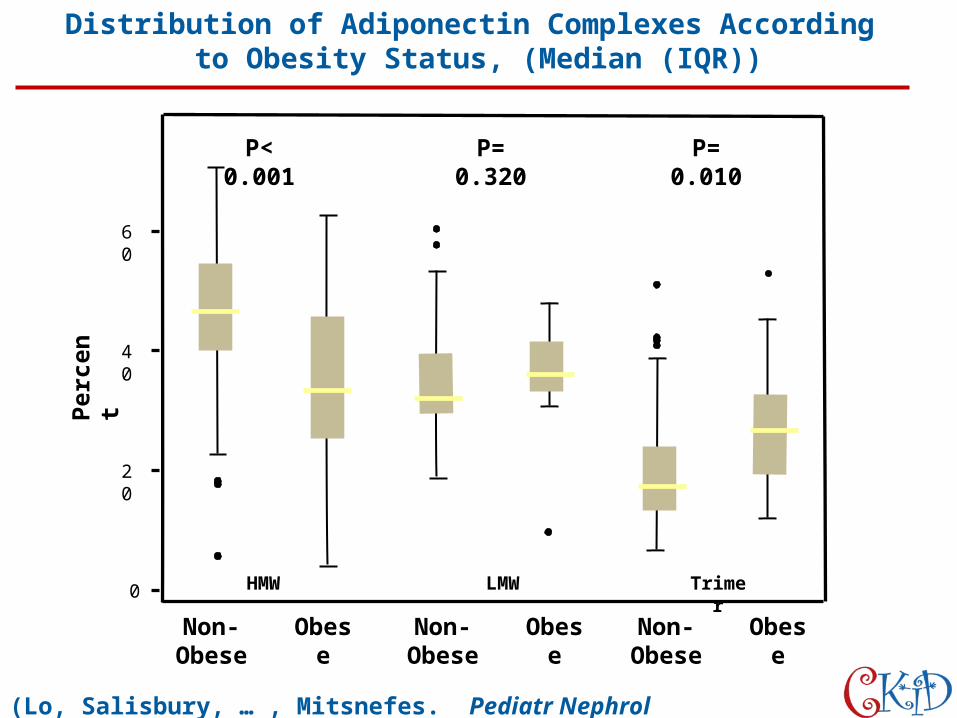
Distribution of Adiponectin Complexes According to Obesity Status, (Median (IQR))
(Lo, Salisbury, … , Mitsnefes. Pediatr Nephrol 2011;26:2009-17.)
0
20
40
60
Per
cen
t
HMW LMW Trimer
P< 0.001
Non-Obese
Obese
P= 0.320 P= 0.010
Non-Obese
Obese
Non-Obese
Obese
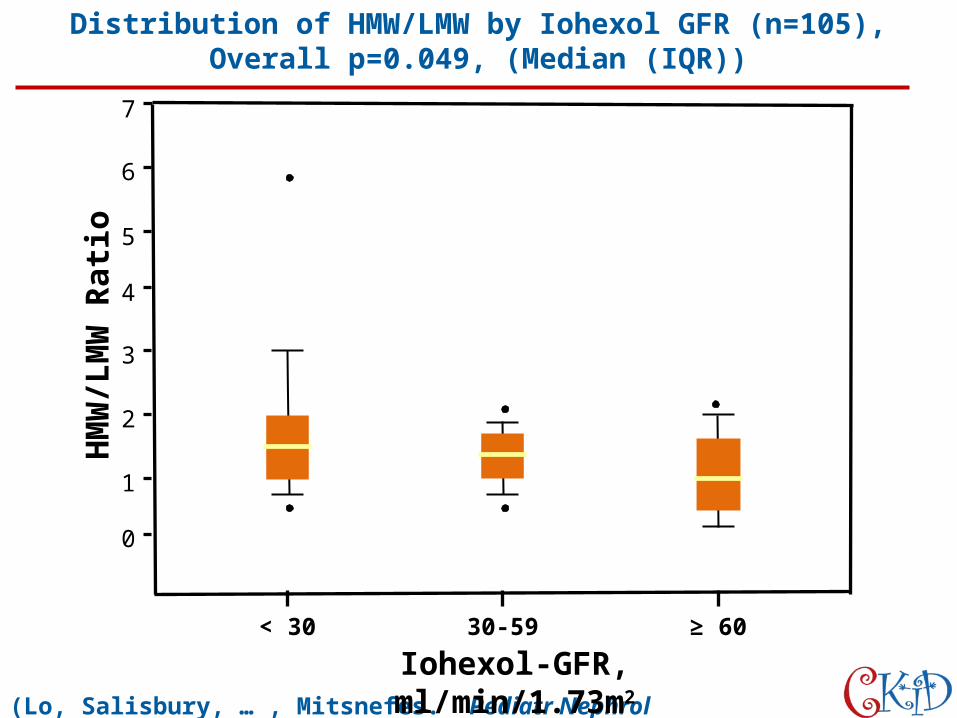
Distribution of HMW/LMW by Iohexol GFR (n=105), Overall p=0.049, (Median (IQR))
(Lo, Salisbury, … , Mitsnefes. Pediatr Nephrol 2011;26:2009-17.)
Iohexol-GFR, ml/min/1.73m2
HM
W/L
MW
Rati
o
< 30 30-59 ≥ 60
0
1
2
3
4
5
6
7

The Association between Abnormal Birth History and
Growth in Children with CKD
Greenbaum, Muñoz, … , Warady Clin J Am Soc Nephrol 2011; 6:14-21.

Histograms of Age-Sex-Specific Height and Weight Z-Scores with a Density Function from a Gaussian Distribution Superimposed
(Greenbaum, Muñoz, … , Warady. Clin J Am Soc Nephrol 2011;6:14-21.)
Height Z-Scores
Mean= -0.68SD= 1.16N= 1,393
Mean= -0.09SD= 1.27N= 1,383
Weight Z-Scores

Diff
eren
ce in
Hei
ght Z
-sco
re (a
bnor
mal
- no
rmal
)Multivariate CKD Diagnosis-Specific Repeated Measures
Analyses of Abnormal Birth History Exposures on Age-Sex-Specific Height Z-Scores
(Greenbaum, Muñoz, … , Warady. Clin J Am Soc Nephrol 2011;6:14-21.)
*Z-score expected for females, white race, 11 years of age, >90% of life with CKD,
mid-parental height of 1.71 meters and NORMAL birth history
2.0
1.5
1.0
0.5
0
-0.5-1.0-1.5
GlomerularNon-Glomerular
p= 0.124
p= 0.364
p= 0.813
p= 0.639
LBW Premature SGA ICU-1.04* -1.01* -1.27* -1.03* -1.05* -1.05* -1.13* -1.01*

Multivariate CKD Diagnosis-Specific Repeated Measures Analyses of Abnormal Birth History Exposures on
Age-Sex-Specific Weight Z-Scores
(Greenbaum, Muñoz, … , Warady. Clin J Am Soc Nephrol 2011;6:14-21.)
*Z-score expected for females, white race, 11 years of age, >90% of life with CKD,
mid-parental height of 1.71 meters and NORMAL birth history
Diff
eren
ce in
Wei
ght Z
-sco
re (a
bnor
mal
- no
rmal
)
GlomerularNon-Glomerular
-2.0
1.5
1.0
0.5
0
-0.5-1.0-1.5
LBW Premature SGA ICU-0.57* -0.24* -0.80* -0.41* -0.53* -0.42* -0.88* -0.31*
p= 0.246
p= 0.029
p= 0.172
p= 0.172

Extracellular Volume and Disease Progression in Children with Chronic
Kidney Disease
Abraham, Muñoz, … , SchwartzClin J Am Soc Nephrol 2011;6:741-7.

(Abraham, Muñoz, … , Schwartz. Clin J Am Soc Nephrol 2011;6:741-7.)
Distribution of Weight-Normalized ECV by Age and Tanner Stage
AGE (Years)
TANNER STAGE
EC
V (
L)/
WT
(kg
)E
CV
(L
)/W
T(k
g)
N= 756
N= 788

ECV versus BSA Illustrating the Correlation Between the Two Measures of Body Size, N= 790
ECV
(L)
BSA (m2)(Abraham, Muñoz, … , Schwartz. Clin J Am Soc Nephrol 2011;6:741-7.)

Distribution of Weight-Normalized ECV by Systolic Blood Pressure Categories, N= 756
96
SBP %tile >= 95SBP %tile >= 95SYSTOLIC BP PERCENTILE
ECV
(L)/
WT(
kg)
0.1
0.2
0.3
0.4
N= 660
97.5%
90%75%
50%
25%
10%
2.5%
(Abraham, Muñoz, … , Schwartz. Clin J Am Soc Nephrol 2011;6:741-7.)

Methods for Characterizing Differences in Longitudinal
GFR Changes Between Children with Glomerular
and Non-Glomerular Chronic Kidney Disease
Pierce, Cox, … , MuñozAm J Epidemiol 2011;174:604-12.

Generalized Gamma Model
(Pierce, Cox, … , Muñoz. Am J Epidemiol 2011;174:604-12.)
Mixed Model
Annualized GFR Ratio
0 0
0.050.10
0.25
0.50
0.75
0.90
0.95
Cum
ulati
ve P
roba
bilit
y
0.05
0.10
0.50
0.75
0.900.95
Cum
ulati
ve P
roba
bilit
y
0.25
1
Annualized GFR Ratio
1

Generalized Gamma - Modeled Relative Percentiles of Annualized GFR Ratio, Glomerular vs. Non-Glomerular CKD Children
Rela
tive
Perc
entil
es o
f G
lom
erul
ar to
Non
-Glo
mer
ular
Dx
P (%)(Pierce, Cox, … , Muñoz. Am J Epidemiol 2011;174:604-12.)

Baseline GFR ≤ 45 ml/min| 1.73m2
Baseline GFR > 45 ml/min| 1.73m2
Cum
ulati
ve P
roba
bilit
y
0
0.050.10
0.50
0.75
0.90
0.95
0.25
Cum
ulati
ve P
roba
bilit
y
1
Annualized GFR Ratio Annualized GFR Ratio
0
0.050.10
0.50
0.75
0.900.95
0.25
1
(Pierce, Cox, … , Muñoz. Am J Epidemiol 2011;174:604-12.)
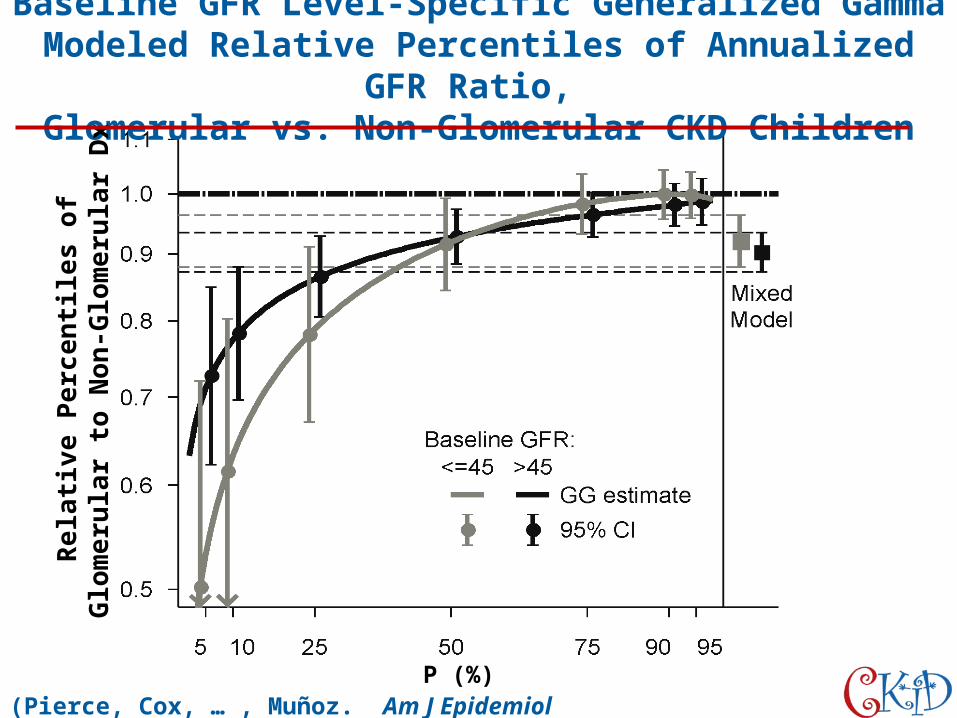
Baseline GFR Level-Specific Generalized Gamma Modeled Relative Percentiles of Annualized GFR Ratio,
Glomerular vs. Non-Glomerular CKD ChildrenRe
lativ
e Pe
rcen
tiles
of
Glo
mer
ular
to N
on-G
lom
erul
ar D
x
P (%)(Pierce, Cox, … , Muñoz. Am J Epidemiol 2011;174:604-12.)
Universal GFR Determination Based on Two Time Points During Plasma
Iohexol Disappearance
Ng, Schwartz, … , MuñozKidney Int 2011;80:423-30.

(Ng, Schwartz, … , Muñoz. Kidney Int 2011;80:423-30.)
Relationship of Fast Area on BSA
R2= 56%Fast Area= 6.46 x BSA
-1.023
BSA (m2)
Fast
Are
a (m
g m
in/m
l)

No Residual Dependence of Fast Area on Slow Area once BSA is Accounted for
R2= 0.2%
Slow Area (mg min/ml)
log(
fast
are
a) –
[log
(6.4
6) –
1.0
23 lo
g (B
SA)]
(Ng, Schwartz, … , Muñoz. Kidney Int 2011;80:423-30.)

Solid line = 0.12 x (GFR0,2 / 100)R2 = 75%
Dashed line = Nonparametric spline
GFR0,2 (GFR based on slow component only; ml/min|1.73m2)
Fast
Are
a /
Slow
Are
a =
(GFR
0,2 /
GFR
2,2)
– 1
Congruency Between CKiD and MACS
( )( )
(Ng, Schwartz, … , Muñoz. Kidney Int 2011;80:423-30.)

Agreement Between GFR and Observed GFR
2,2 2,2 2,2 2,2CKiD MACS
GFR
(ml/
min
per
1.7
3m2 )
(Ng, Schwartz, … , Muñoz. Kidney Int 2011;80:423-30.)

Metabolic Abnormalities, CVD Risk Factors and GFR
Decline in Children with CKD
Furth, Abraham, … , WaradyCJASN 2011;6:2132-2140.

Distribution of the Annual Percent Decline in GFR Presented by Non-Glomerular and Glomerular Diagnosis
(Furth, Abraham, … , Warady. CJASN 2011;6:2132-2140.)
FSGS HUS Other G ObstructUropathy
A/Hypo/Dysplastic
RefluxNeph
Polycyst(ARPKD)
Other NG
Annu
al P
erce
ntag
e Ch
ange

Urological Disorders in Chronic Kidney Disease in
Children (CKiD) Cohort: Clinical Characteristics and
Estimation of Glomerular Filtration Rate
Dodson, Jerry-Fluker, Ng, … , FurthJ of Urol 2011;186:1460-6.

Agreement Plots and Correlation of CKiD Bedside Equation Estimated GFR to Measured Iohexol GFR for
Children with Urological Diagnoses
(Dodson, Jerry-Fluker, … , Furth. J of Urol 2011;186:1460-6.)
n= 326
ml/
min
| 1.
73m
2

Bland-Altman Plot Comparing the CKiD Bedside GFR Equation with the iGFR Measurement
Beds
ide
GFR
– iG
FR (m
ean=
-0.5
+/-
11.
0)
Average of Bedside GFR and iGFR (mean= 46.3 +/- 16.5)(Dodson, Jerry-Fluker, … , Furth. J of Urol 2011;186:1460-6.)
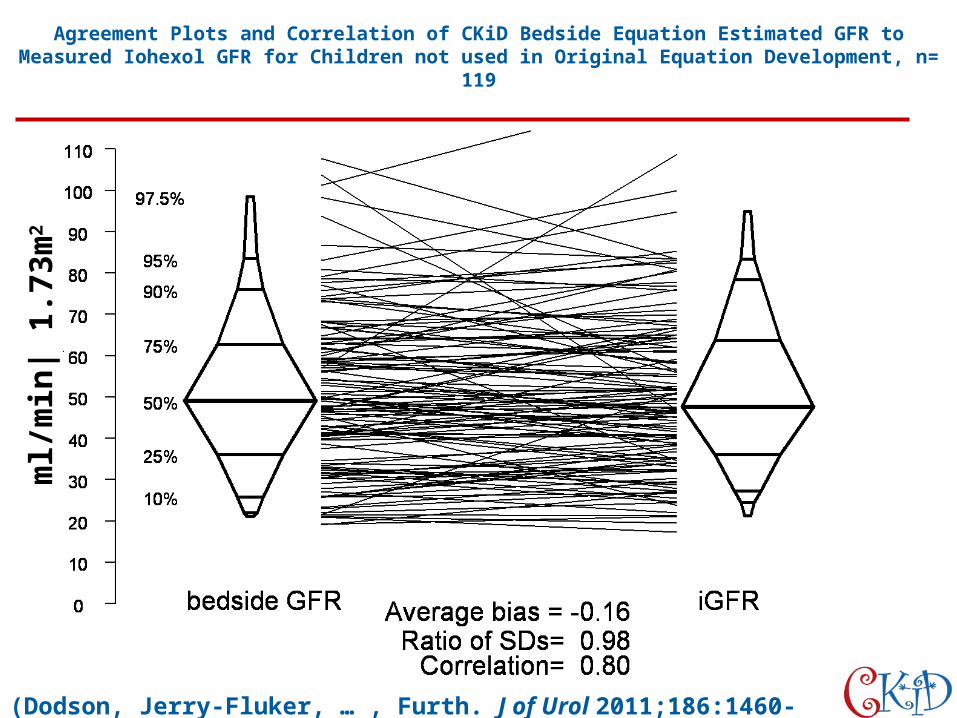
Agreement Plots and Correlation of CKiD Bedside Equation Estimated GFR to Measured Iohexol GFR for Children not used in Original Equation Development, n= 119
ml/
min
| 1.
73m
2
(Dodson, Jerry-Fluker, … , Furth. J of Urol 2011;186:1460-6.)

Prevalence and Correlates of Multiple Cardiovascular Risk Factors in Children with CKD
Wilson, Schneider, … , MitsnefesCJASN 2011; 6:2759-65.

Distribution of the Number of Cardiovascular Risk Factors (CVRF) by Category of Age-Gender Specific Body Mass Index (BMI) Percentile, n= 250
(Wilson, Schneider, … , Mitsnefes. CJASN 2011; 6:2759-65.)
Lean
Overweight ObeseBMI Percentile (age-sex specific)
Perc
ent

Prevalence of Hypertension, Dyslipidemia, and Abnormal Glucose Metabolism by Category of Age-Gender Specific Body Mass Index (BMI) Percentile, n= 250
(Wilson, Schneider, … , Mitsnefes. CJASN 2011; 6:2759-65.)
Lean
Overweight ObeseBMI Percentile (age-sex specific)
Perc
ent

HNF1B and PAX2 Mutations are a Common Cause of Renal
Hypodysplasia in the CKiD Cohort
Thomas, Sanna-Cherci, … , GharaviPediatr Nephrol 2011; 26:897-903.

Chromatograms of Novel Pathogenic Mutations
(Thomas, Sanna-Cherci, … , Gharavi. Pediatr Nephrol 2011; 26:897-903.)
A
B
C
A G G R Y352fsX352
CKiD Sample (sequencing forward)
CKiD Sample (sequencing reverse)
Wild Type
Q L G V F V N G24E
CKiD Sample
Wild Type
CKiD Sample
Wild Type
P S T| Exon
Frameshift Mutation
MIssenseMutation
Splice SiteMutation

2012
Publications

Reliability of Resting Blood Pressure Measurement and
Classification Using an Oscillometric Device in
Children with Chronic Kidney Disease
Flynn, Pierce, … , WaradyJ Pediatr 2012; 160:434-440.
(Editorial by McBryde, KD)

auscultatory SBP, mm Hg
osc
illo
me
tric
SB
P, m
mH
g
60 80 100 120 140 160 180
60
80
10
01
20
14
01
60
18
0
mean of auscultatory SBP and oscillometric SBP
SB
P, o
scill
om
etr
ic-a
usc
ulta
tory
80 100 120 140 160
-40
-20
02
04
0
0.25
-0.25
0.5
-0.5
1
-1
Scatterplot and Bland-Altman of the SBP Oscillometric Measures against their Respective Auscultatory Measures
Mean of Auscultatory SBP and Oscillometric SBPAuscultatory SBP, mm Hg
SB
P,
Osc
illo
met
ric
- A
us
cult
ato
ry
Osc
illo
met
ric
SB
P,
mm
Hg
s.d.(oscill)/s.d.(ausc)= 1.019 (P=.72 for eq. of s.d.s)Bias (oscill-ausc) = 8.658 (P<.01 for no bias)Correlation = 0.624
Bias= 76% of s.d. of mean
(Flynn, Pierce, … , Warady. J Pediatr 2012; 160:434-440.)

auscultatory DBP, mm Hg
osc
illo
me
tric
DB
P, m
mH
g
20 40 60 80 100 120
20
40
60
80
10
01
20
mean of auscultatory DBP and oscillometric DBP
DB
P, o
scill
om
etr
ic-a
usc
ulta
tory
40 50 60 70 80 90 100
-40
-20
02
04
0
0.25
-0.25
0.5
-0.5
1
-1
Scatterplot and Bland-Altman of the DBP Oscillometric Measures against their Respective Auscultatory Measures
(Flynn, Pierce, … , Warady. J Pediatr 2012; 160:434-440.)
Mean of Auscultatory DBP and Oscillometric DBPAuscultatory DBP, mm Hg
SB
P,
Osc
illo
met
ric
- A
us
cult
ato
ry
Osc
illo
met
ric
DB
P,
mm
Hg
s.d.(oscill)/s.d.(ausc) = 0.929 (P=.201 for eq. of s.d.s)Bias (oscill-ausc) = 5.709 (P<.01 for no bias)Correlation = 0.491
Bias= 60% of s.d. of mean

Correlates of Resistin in Children with Chronic Kidney Disease: The Chronic Kidney Disease in Children Cohort
Nehus, Furth, … , MitsnefesJ Pediatr 2012; 161:276-280.

Correlation of Resistin and iGFR levels in Children with CKD
(Nehus, Furth, … , Mitsnefes. J Pediatr 2012; 161:276-280.)
1
2
3
4
5L
og
Tra
nsf
orm
ed R
esis
tin
, n
g/m
L
0 10 20 30 40 50 60 70 80 90 100 110 120 130 140 150 160
iGFR, mL/min/1.73m2
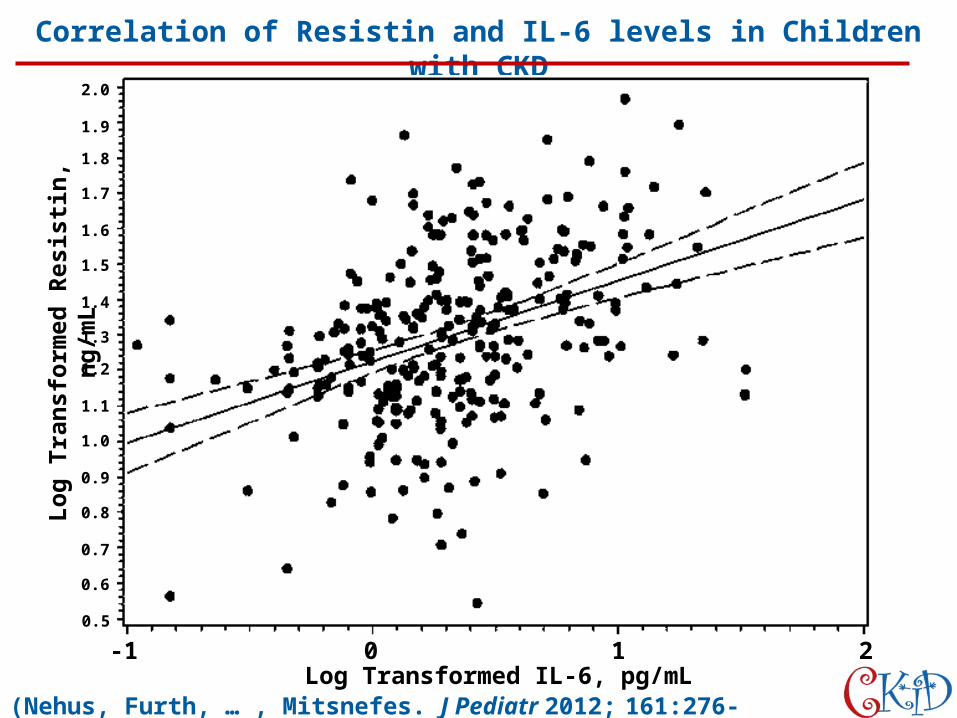
Correlation of Resistin and IL-6 levels in Children with CKDL
og
Tra
nsf
orm
ed R
esis
tin
, n
g/m
L
Log Transformed IL-6, pg/mL-1
0.5
0 1 2
0.6
0.7
0.8
0.9
1.0
1.1
1.2
1.3
1.4
1.5
1.6
1.7
1.8
1.9
2.0
(Nehus, Furth, … , Mitsnefes. J Pediatr 2012; 161:276-280.)

Correlation of Resistin and HOMA-IR Values in Children with CKD L
og
Tra
nsf
orm
ed R
esis
tin
, n
g/m
L
Log Transformed HOMA-IR, mU/L-3 -2 -1 0 1 2 3 4
1
2
3
5
4
(Nehus, Furth, … , Mitsnefes. J Pediatr 2012; 161:276-280.)
Improved GFR Estimating Equations in Children with
Chronic Kidney Disease Using Immunonephelometric
Determination of Cystatin C
Schwartz, Schneider, … , MuñozKidney Int 2012; 82:445-453.
(Commentary by Delanye P and Ebert N in Nat Rev Nephrol 2012; 8:503-504.)

Cystatin C Measured using the DAKO Turbidimetric Method vs. the Siemens Healthcare Nephelometric Method
(Schwartz, Schneider, … , Muñoz. Kidney Int 2012; 82:445-453.)
Dako(turbidimetric)
Siemens Healthcare(nephelometric)
r = 0.77
Cys
tati
n C
, m
g/L
0.75
1
2
3
4
5
6 N = 495
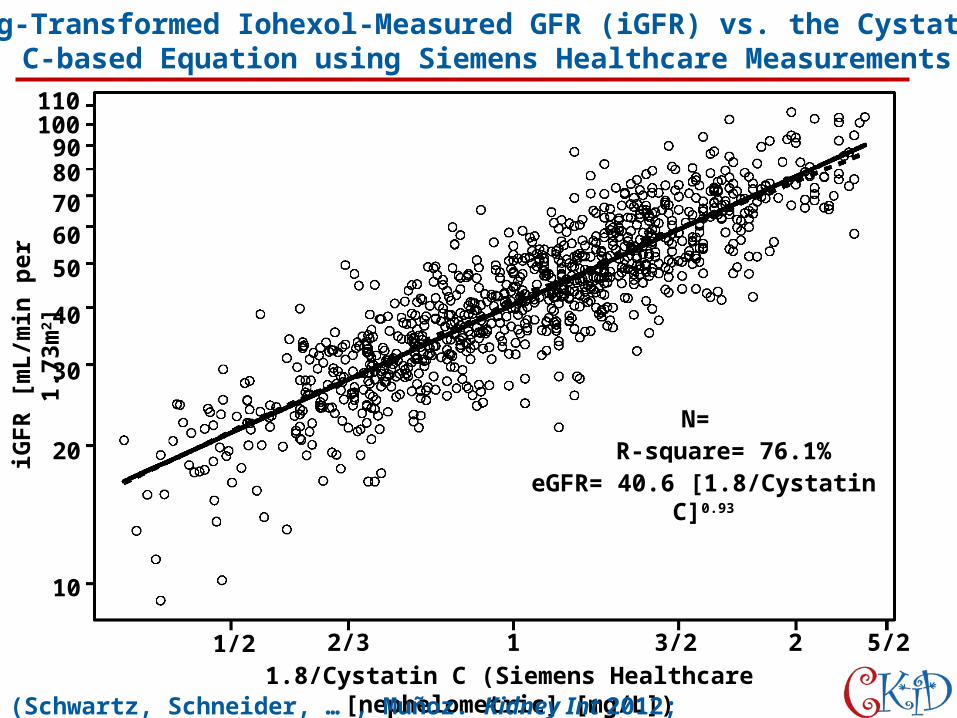
Log-Transformed Iohexol-Measured GFR (iGFR) vs. the Cystatin C-based Equation using Siemens Healthcare Measurements
10
20
30
40
5060708090
100110
iGF
R [
mL
/min
per
1.7
3m2 ]
1/2 2/3 1 3/2 2 5/21.8/Cystatin C (Siemens Healthcare [nephelometric] [mg/L])
N= 965R-square= 76.1%
eGFR= 40.6 [1.8/Cystatin C]0.93
(Schwartz, Schneider, … , Muñoz. Kidney Int 2012; 82:445-453.)

10
20
30
40
5060708090
100110
iGF
R [
mL
/min
per
1.7
3m2 ]
1/4 1/3 1/2 1 2 3Height [m] / Serum Creatinine [mg/dL]
N= 965R-square= 77.1%
eGFR= 42.3 [height / serum creatinine]0.79
.
Log-Transformed Iohexol-Measured GFR (iGFR) vs. the Cystatin C-based Equation using Siemens Healthcare Measurements
(Schwartz, Schneider, … , Muñoz. Kidney Int 2012; 82:445-453.)

Comparisons of Height/Serum Creatinine-based and Cystatin C-based eGFR against iGFR
Ht/Scr-basedeGFR
Iohexol-basedGFR
Cystatin C-basedeGFR
r = 0.872r = 0.878
10
20
40
80
100N= 965
Glo
mer
ula
r F
iltr
atio
n R
ate
[mL
/min
per
1.7
3m2 ]
(Schwartz, Schneider, … , Muñoz. Kidney Int 2012; 82:445-453.)

Association Between Common Iron Store Markers and
Hemoglobin in Children with Chronic Kidney Disease
Atkinson, Pierce, … , FurthPediatr Nephrol 2012;27:2275-2283.

Distribution of Iron Biomarker Values by Stage of CKD in 304 Iron- and Erythropoiesis Stimulating Agent-naïve Enrolled in the CKiD Study
(Atkinson, Pierce, … , Furth. Pediatr Nephrol 2012;27:2275-2283.
A) Serum Iron B) Serum Ferritin C) TSAT
Se
rum
Iro
n,
µg
/dL
Se
rum
Fe
rrit
in,
ng
/dL
TS
AT
, %
GFR, ml/min|1.73m2 GFR, ml/min|1.73m2 GFR, ml/min|1.73m2

Percentile Plots of Hemoglobin Z-Score by KDOQI Recommended Thresholds for Ferritin in 304 Iron Supplement- and Erythropoiesis Stimulating agent-naïve Children
(Atkinson, Pierce, … , Furth. Pediatr Nephrol 2012;27:2275-2283.)
Serum Ferritin, ng/mL
Hem
og
lob
in,
z-sc
ore

Percentile Plots of Hemoglobin Z-Score by KDOQI Recommended Thresholds for TSAT in 304 Iron Supplement- and Erythropoiesis Stimulating agent-naïve Children
(Atkinson, Pierce, … , Furth. Pediatr Nephrol 2012;27:2275-2283.)
Transferrin Saturation, %
Hem
og
lob
in,
z-sc
ore

Regression tree analysis examining factors predictive of hemoglobinpercentile value in 304 iron supplement- and erythropoiesis
stimulating agent-naive children.
(Atkinson, Pierce, … , Furth. Pediatr Nephrol 2012;27:2275-2283.)
N=604th %ile[2, 9]
N=17531st %ile[22, 42]
N=6969th %ile[57, 79]
p = 0.11
p = 0.08
p = 0.11
p = 0.01
p = 0.14
p < 0.001
AllN=304
31th %ile(24, 38)
GFR < 60N=216
GFR ≥ 60N=88
GFR < 30N=34
GFR [30, 60)N=182
sFE < 50N=19
sFE ≥ 50N=69
sFE < 75N=20
sFE ≥ 75N=14
sFE [50, 75)N=25
sFE ≥ 75N=44
ferritin ≥ 100N=11
ferritin < 100N=171
sFE < 50N=33
sFE ≥ 50N=13
GFR [30, 45)N=15
GFR [45, 60)N=18
p < 0.001
p = 0.001
GFR: glomerular filtration rate (ml/min/1.73m2)sFE: serum iron (µg/dL)ferritin units = ng/mL
p = 0.11
Carotid Intima-Media Thickness in Children with Chronic Kidney Disease:
Results from the CKiD Study
Brady, Schneider, … , MitsnefesClin J Am Soc Nephrol 2012;7:1930-
1937.

Box-Percentile Plots Illustrating the Distribution of cIMT Measurements in 101 Children of the CKiD and in 97 Healthy Controls
0.25
0.30
0.35
0.40
0.45
0.50
0.55
0.60
0.65
CKiD Controls
Ca
rotid
art
ery
intim
a-m
ed
ial t
hic
kne
ss (
mm
)
N= 101 97
0.432
2.5%5%
10%
25%
50%
75%
90%
95%97.5%
0.413
2.5%5%10%
25%
50%
75%
90%
95%
97.5%
(Brady, Schneider, … , Mitsnefes. Clin J Am Soc Nephrol 2012;7:1930-1937.)

2013
Publications

Second Hand Smoke Exposure is Associated with Proteinuria in Children with
Chronic Kidney Disease
Omaloja, Jerry-Fluker, … , MitsnefesPediatr Nephrol 2013;28:1243-1251.
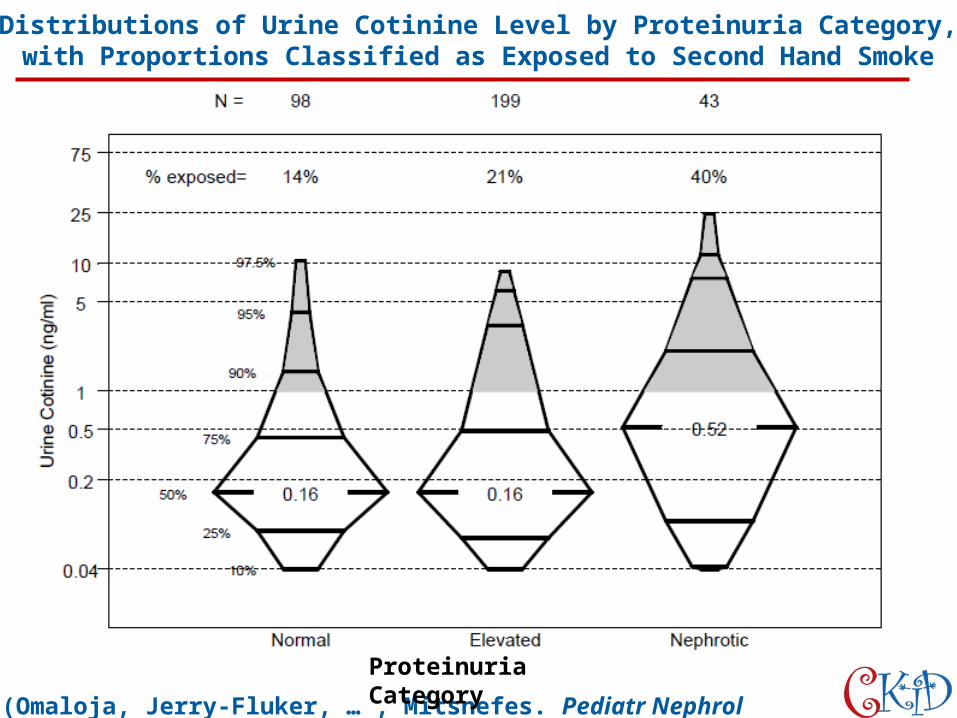
Distributions of Urine Cotinine Level by Proteinuria Category, with Proportions Classified as Exposed to Second Hand Smoke
(Omaloja, Jerry-Fluker, … , Mitsnefes. Pediatr Nephrol 2013;28:1243-1251.)
Proteinuria Category

Distributions of Urine Cotinine/Urine Creatinine Level by Proteinuria Category, with Proportions Classified as Exposed to Second Hand Smoke
Proteinuria Category
(Omaloja, Jerry-Fluker, … , Mitsnefes. Pediatr Nephrol 2013;28:1243-1251.)
Non-proportionality of Hazards in the Competing
Risks Framework
Muñoz, Abraham, … , WadaRisk Assessment: Evaluation of Predictions
Springer Verlag, 2013

Sub-Hazards and Relative Sub-Hazards for the Competing Risks Setting Defined by the True Model
(Muñoz, Abraham, … , Wada. Risk Assessment: Evaluation of Predictions; Springer Verlag, 2013)

(Muñoz, Abraham, … , Wada. Risk Assessment: Evaluation of Predictions; Springer Verlag, 2013)
Effect of Annual Income Above/Below $36,000 on the Competing Events of ESRD and Renal Transplantation in the CKiD Study

(Muñoz, Abraham, … , Wada. Risk Assessment: Evaluation of Predictions; Springer Verlag, 2013)
Effect of Annual Income Above/Below $36,000 on the Competing Events of ESRD and Renal Transplantation in the CKiD Study

(Muñoz, Abraham, … , Wada. Risk Assessment: Evaluation of Predictions; Springer Verlag, 2013)
Effect of Nephrotic Proteinuria (uP/C >2) on the Competing Events of ESRD and Renal Transplantation in the CKiD Study

(Muñoz, Abraham, … , Wada. Risk Assessment: Evaluation of Predictions; Springer Verlag, 2013)
Effect of Nephrotic Proteinuria (uP/C >2) on the Competing Events of ESRD and Renal Transplantation in the CKiD Study

(Muñoz, Abraham, … , Wada. Risk Assessment: Evaluation of Predictions; Springer Verlag, 2013)
Effect of Nephrotic Proteinuria (uP/C >2) on the Competing Events of ESRD and Renal Transplantation in the CKiD Study

(Muñoz, Abraham, … , Wada. Risk Assessment: Evaluation of Predictions; Springer Verlag, 2013)
Effect of Nephrotic Proteinuria (uP/C >2) on the Competing Events of ESRD and Renal Transplantation in the CKiD Study

2014
Publications

Nonlinear Trajectory of GFR in Children to RRT
Zhong, Muñoz, … , AbrahamJ Am Soc Nephrol 2014; 25: 913-917.

Nonlinear GFR Decline before RRT can be Approximated with a Piece-Wise Log-Linear Model
(Zhong, Muñoz, … , Abraham. J Am Soc Nephrol 2014 Jan 2. [Epub ahead of print])
Disordered FGF23 and Mineral Metabolism in Children with CKD
Portale, Wolf, … , SaluskyClin J Am Soc Nephrol 2014;9:344-353.

Mineral and Hormone Values According to Estimated GFR at 10-ml/min per 1.73 m2 Intervals in Children with CKD
(Portale, Wolf, … , Salusky. Clin J Am Soc Nephrol 2014;9:344-353.)
(A) Median concentrations of serum corrected–calcium, phosphorus, and immunoreactive parathyroid
hormone (iPTH)
(B) Median concentrations of serum 25-hydroxyvitamin D (25OHD) (ng/ml), 1,25-
dihyroxyvitamin D [1,25(OH)2D] (pg/ml), and
plasma fibroblast growth factor 23 (FGF23)
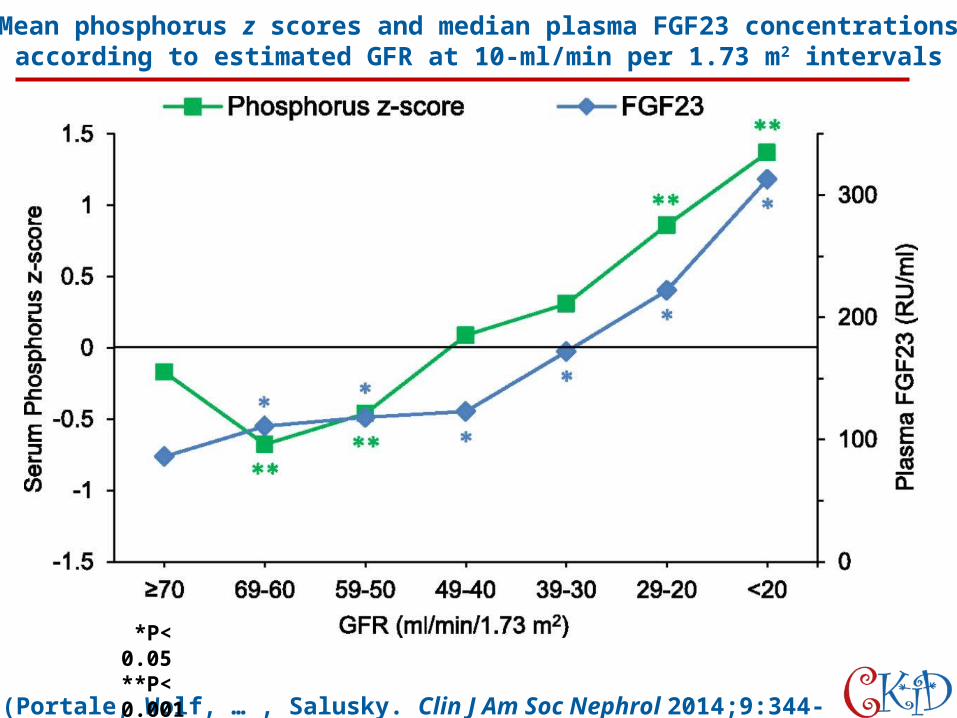
Mean phosphorus z scores and median plasma FGF23 concentrations according to estimated GFR at 10-ml/min per 1.73 m2 intervals
(Portale, Wolf, … , Salusky. Clin J Am Soc Nephrol 2014;9:344-353.)
*P< 0.05**P< 0.001

Prevalence of Hyperphosphatemia, Hyperparathyroidism, and Increased Plasma FGF23 According to GFR Groups
(Portale, Wolf, … , Salusky. Clin J Am Soc Nephrol 2014;9:344-353.)

Ceramides and Cardiac Function in Children with Chronic Kidney
Disease
Mitsnefes, Scherer, … , WaradyPediatr Nephrol 2014;29:415-422.

Comparison of Total Ceramide Levels in Healthy Children and Children with Chronic Kidney Disease (CKD)
(Mitsnefes, Scherer, … , Warady. Pediatr Nephrol 2014;29:415-422.)
No
rmal
ized
Cer
amid
es (
To
tal)
Controls CKD
14
12
10
8
6
4
P< 0.001

Distribution of Ceramides in Healthy Controls and Children with Chronic Kidney Disease (CKD)
(Mitsnefes, Scherer, … , Warady. Pediatr Nephrol 2014;29:415-422.)
Per
cen
t
60
50
40
30
20
10
0
ControlsCKD

Comparison of Individual Ceramide Levels in Healthy Children and Children with Chronic Kidney Disease (CKD)
(Mitsnefes, Scherer, … , Warady. Pediatr Nephrol 2014;29:415-422.)
P< 0.001 for all pair comparisons except C18:1
ControlsCKD
No
rmal
ized
Cer
amid
e L
evel

Distribution of Lactosylceramides C16:0L and C24:0L in Healthy Controls and Children with Chronic Kidney Disease (CKD)
(Mitsnefes, Scherer, … , Warady. Pediatr Nephrol 2014;29:415-422.)
Per
cen
t
C24:0 Metabolites
Per
cen
t
*C15:0DH is 0.27% for controls and 0.41% for CKD
Controls CKD Controls CKD
C16:0 Metabolites

BP Control and Left Ventricular Hypertrophy Regression in
Children with CKD
Kupferman, Friedman, … , MitsnefesJ Am Soc Nephrol 2014;25:167-174.

Partial Residual Plot of Log(LVMI) versus (A) SBP and (B) DBP Z-Scores
(Kupferman, Friedman, … , Mitsnefes. J Am Soc Nephrol 2014;25:167-174. )
(BP Z-score was adjusted for age, sex, and height.)

The Effect of Abnormal Birth History on Ambulatory Blood
Pressure and Disease Progression in Children with
Chronic Kidney Disease
Flynn, Ng, … , GreenbaumJ Pediatr 2014; 165: 154-162.

Distribution of Propensity Scores, by Birth History Status and Matched Data with Weighting, based on Full Constrained Matching
(Flynn, Ng, … , Greenbaum. J Pediatr 2014; 165: 154-162.)
Medication Treatment Complexity and Adherence in
Children with CKD
Blydt-Hansen, Pierce, … , FurthClin J Am Soc Nephrol 2014;9:247-254.

Distribution of Number of CKD-Related Medication Groups by CKD Stage and CKD Diagnosis (N=558)
(Blydt-Hansen, Pierce, … , Furth. Clin J Am Soc Nephrol 2014;9:247-254.)CKD diagnosis & stage
Pe
rce
nt
0
20
40
60
80
100
NG G NG G NG G NG GII IIIa IIIb IV
0 1-2 3-4 5-6 >=7Number of medication groups:
N= 89 38 120 23 153 36 76 23

Cluster Plots Showing Primary Pair-Wise Associations and Subsequently Ranked Associations between Medication Groups, Restricted to 19 Groups of Medications for Management of CKD-Specific
Complications, Treatment of Underlying Kidney Disease, and Symptom Control
(Blydt-Hansen, Pierce, … , Furth. Clin J Am Soc Nephrol 2014;9:247-254.)
Nutritional Supplements
(n=12)
Alkali Therapy(n=163)
Growth Hormones
(n=65)
ESA(n=75)
Iron Supplements
(n=166)
PO4 Binders(n=114)
ActiveVitamin D(n=206)
OR=12.8; n=165 OR=11.8; n=183
OR=4.5; n=268
OR=4.6; n=343
OR=5.9; n=240
OR=5.1; n=189
Cluster 2: N=343 patients on 1+ medications in this cluster
Lipid Lowering Rx(n=17)
Diuretics(n=38)
Other BP Meds(n=106)
OR=8.7; n=49
OR=5.0; n=131
Cluster 3: N=131 patients on 1+ medications in this cluster
Corticosteroids(n=36)
Other immunosuppressants(n=42)
Antacids(n=54)
Vitamin D(n=17)
OR=67.5; n=53
OR=11.7; n=84
OR=4.22; n=93
Cluster 1: N=93 patients on 1+ medications in this cluster

Heart Rate and Blood Pressure Variability in Children with Chronic Kidney Disease: A
Report from the CKiD Study
Barletta, Flynn, … , FurthPediatr Nephrol 2014;29:1059-1065.
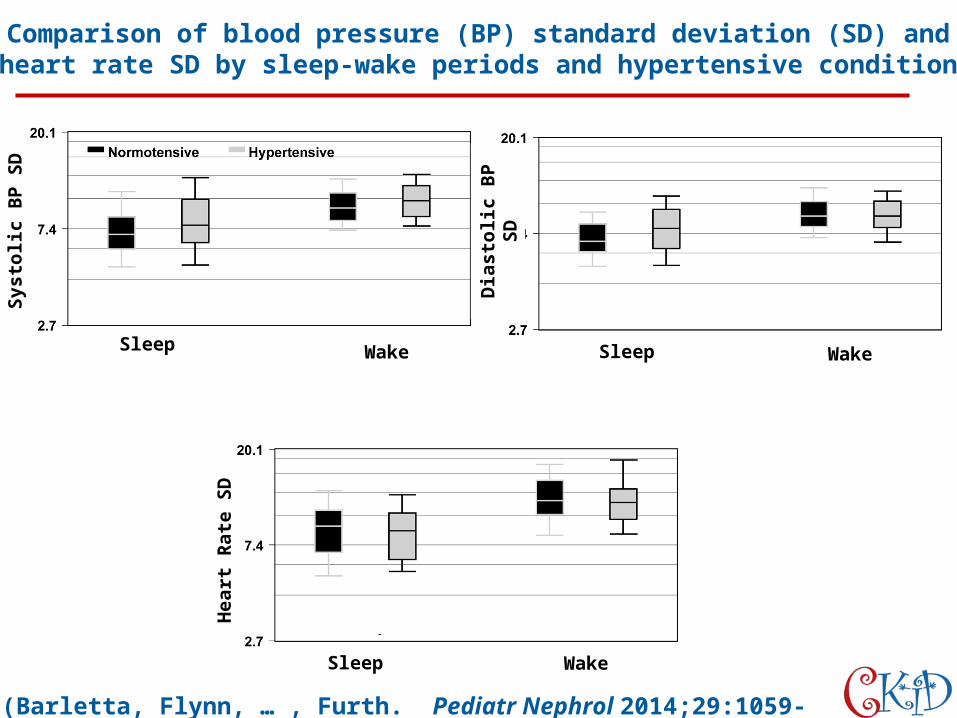
Comparison of blood pressure (BP) standard deviation (SD) and heart rate SD by sleep-wake periods and hypertensive condition
(Barletta, Flynn, … , Furth. Pediatr Nephrol 2014;29:1059-1065.)
Sys
toli
c B
P S
D
Dia
sto
lic
BP
SD
Hea
rt R
ate
SD
Sleep Sleep
Sleep Wake
WakeWake

Protein Energy Wasting in Children with Chronic Kidney
Disease
Abraham, Mak, … , FurthPediatr Nephrol 2014;29:1231-1238.
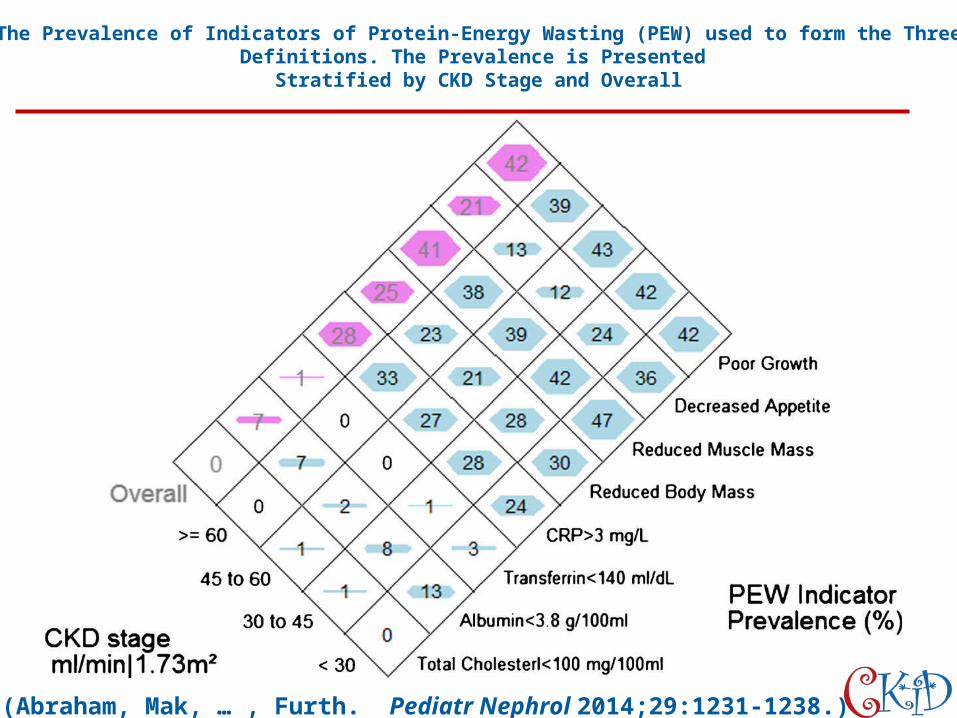
The Prevalence of Indicators of Protein-Energy Wasting (PEW) used to form the Three Definitions. The Prevalence is Presented
Stratified by CKD Stage and Overall
(Abraham, Mak, … , Furth. Pediatr Nephrol 2014;29:1231-1238.)

The Prevalence of Protein Energy Wasting (PEW) as Classified using the Three Definitions Adopted in this Study: Minimal PEW,
Standard PEW, and Modified PEW
(Abraham, Mak, … , Furth. Pediatr Nephrol 2014;29:1231-1238.)

The Unadjusted and Adjusted Incidence Rate Ratios for Hospitalization within the 2 years from Baseline Comparing the Three Protein-Energy Wasting (PEW) Definitions used in this Study
(Abraham, Mak, … , Furth. Pediatr Nephrol 2014;29:1231-1238.)
Adjusted
Unadjusted
Medication Adherence and Growth in Children with Chronic
Kidney Disease
Akchurin, Schneider, … , SkverskyClin J Am Soc Nephrol 2014;9:1519-1525.

Medication Use at the First Seven Visits of the CKiD Study
(Akchurin, Schneider, … , Skversky. Clin J Am Soc Nephrol 2014;9:1519-1525.
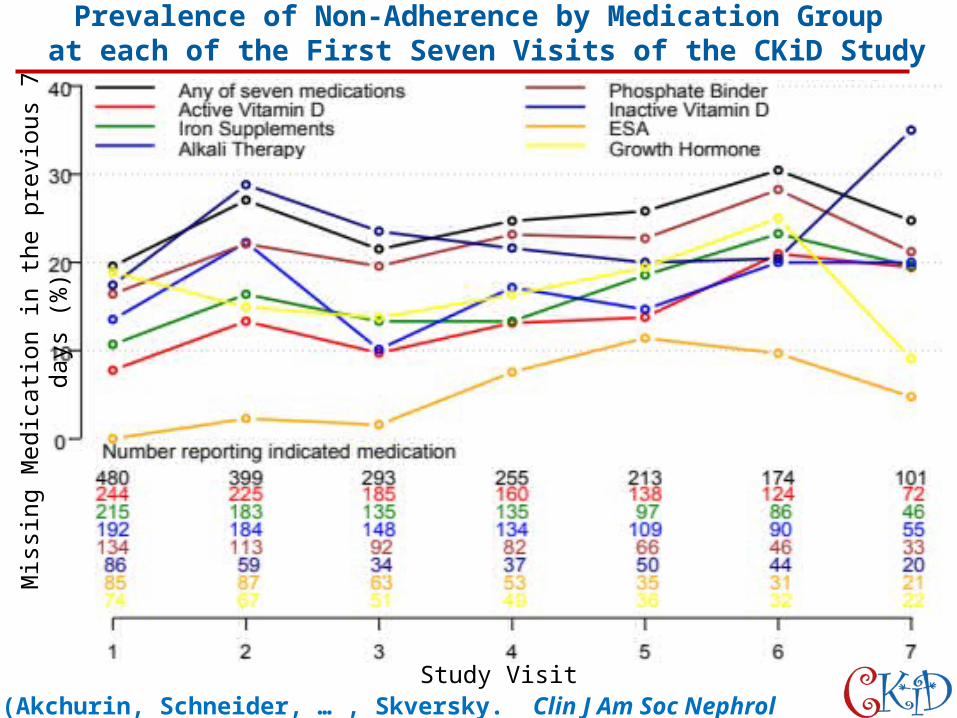
Prevalence of Non-Adherence by Medication Group at each of the First Seven Visits of the CKiD Study
Study Visit
Mis
sing
Med
icat
ion
in t
he p
revi
ous
7 da
ys (
%)
(Akchurin, Schneider, … , Skversky. Clin J Am Soc Nephrol 2014;9:1519-1525.
Hepcidin and Risk for Anemia in CKD: a Cross-Sectional and
Longitudinal Analysis in the CKiD Cohort
Atkinson, Kim, … , FurthPediatr Nephrol 2014 Nov 8 [Epublished ahead of print].

Scatterplots of Log-transformed Hepcidin vs. GFR (a), Hemoglobin (b), Ferritin (c), and Rank of log-transformed Hepcidin vs. Rank of Ferritin (d)
(Atkinson, Kim, … , Furth. Pediatr Nephrol 2014 Nov 8 [Epublished ahead of print])
ieGFR (mL/min/1.73m2)20 40 60 80 100
1.0
1.5
2.0
2.5
Lo
g(H
ep
cid
in)
(lo
g n
g/m
L)
(a) (b)
1.0
1.5
2.0
2.5
Lo
g(H
ep
cid
in)
(lo
g n
g/m
L)
(c)
1.0
1.5
2.0
2.5
Lo
g(H
ep
cid
in)
(lo
g n
g/m
L)
Ferritin (ng/mL)0 100 200 300 400 500
HGB (g/dL)10 12 14 16
Rank of Ferritin
Ra
nk
of
Lo
g(H
ep
cid
in) 60
50
40
30
20
10
00 10 20 30 40 50 60
(d)

Genome-Wide Association Studies in Nephrology: Using Known Associations for Data
Checks
Wuttke, Schaefer, … , KöttgenAm J Kidney Dis 2014 Nov 18 [Epublished ahead of print].

Effects of Serum Creatinine-based Estimated GFR Adjustment on Single-Nucleotide Polymorphism (SNP) Associations with
Serum Bilirubin Concentrations
(Wuttke, Schaefer, … , Köttgen. Am J Kidney Dis 2014 Nov 18 [Epub ahead of print])

Effects of Serum Creatinine-based Estimated GFR Adjustment on Single-Nucleotide Polymorphism (SNP) Associations with
Cystatin C Concentrations
(Wuttke, Schaefer, … , Köttgen. Am J Kidney Dis 2014 Nov 18 [Epub ahead of print])

2015
Publications

Progression of Pediatric CKD of Non-Glomerular Origin in the
CKiD Cohort
Fathallah-Shaykh, Flynn, … , WongClin J Am Soc Nephrol 2015 Jan 29
[Epublished ahead of print].
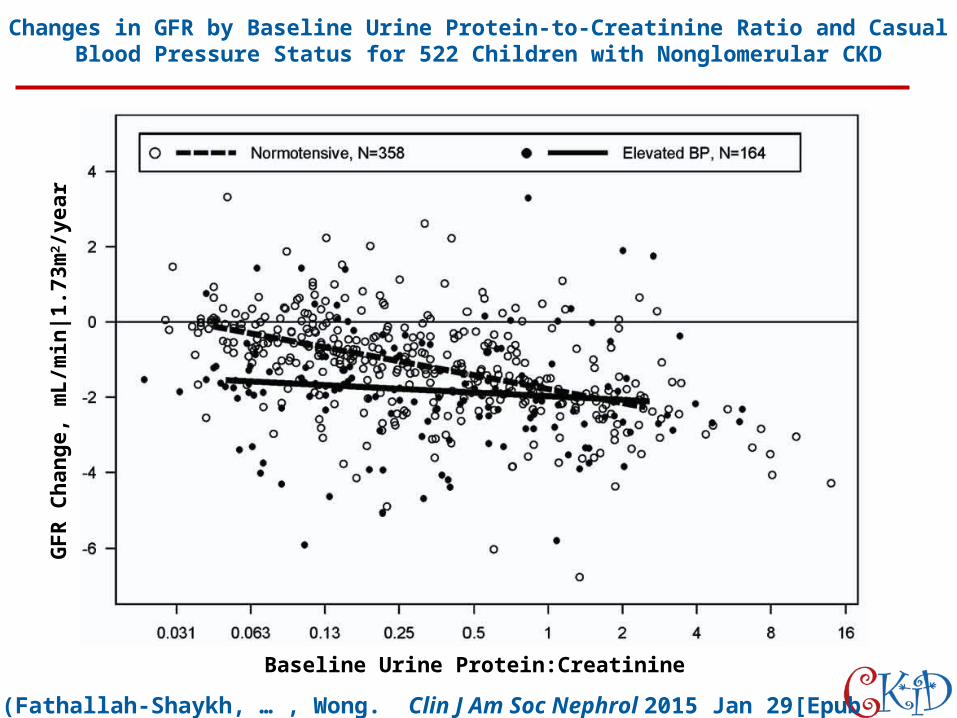
Changes in GFR by Baseline Urine Protein-to-Creatinine Ratio and Casual Blood Pressure Status for 522 Children with Nonglomerular CKD
(Fathallah-Shaykh, … , Wong. Clin J Am Soc Nephrol 2015 Jan 29[Epub ahead of print])
Baseline Urine Protein:Creatinine
GF
R C
han
ge,
mL
/min
|1.7
3m2 /
year

Predictors of Rapid Progression of Glomerular and Nonglomerular Kidney Disease in Children and
Adolescents: the Chronic Kidney Disease in Children (CKiD)
Cohort
Warady, Abraham, … , FurthAm Social J Kidney Dis 2015 Mar 12
[Epublished ahead of print].

Kaplan-Meier and Log-Normal Survival Curves for Composite Event of Baseline Urine Protein-Creatinine Ratio (UPC) for Glomerular and Nonglomerular Participants
(Warady, Abraham, … , Furth. Am Social J Kidney Dis 2015 Mar 12 [Epub ahead of print])

Kaplan-Meier Curves show the Predicted Standardized Times of the Composite Event Resulting from the Cross-Validation
(Warady, Abraham, … , Furth. Am Social J Kidney Dis 2015 Mar 12 [Epub ahead of print])W
Su
rviv
al F
un
ctio
n
Su
rviv
al F
un
ctio
n
W

Estimates of Survival Curves for the Composite Event based on Log-Normal Models of Participants with Different Constellations of Clinical Variables for Glomerular and Nonglomerular Participants
(Warady, Abraham, … , Furth. Am Social J Kidney Dis 2015 Mar 12 [Epub ahead of print])


