
[text]
THIRD QUARTER
Unaudited interim financial statements
for the nine months ended June 30, 2012 and 2011

Pétrolia Quebec’s Leader in Petroleum Exploration INTERIM REPORT – THIRD QUARTER 2012 2
UNAUDITED INTERIM FINANCIAL STATEMENTS
FOR THE NINE MONTHS ENDED
JUNE 30, 2012 AND 2011
INTERIM STATEMENTS OF FINANCIAL POSITION ............................................................................. 4 INTERIM STATEMENTS OF COMPREHENSIVE INCOME.................................................................... 5 INTERIM STATEMENTS OF CHANGES IN EQUITY.............................................................................. 6 INTERIM CONSOLIDATED STATEMENTS OF CASH FLOWS............................................................. 7 1. INCORPORATING ACTS AND TYPES OF ACTIVITIES.................................................................. 8 2. BASIS OF PRESENTATION ................................................................................................................. 8 3. GOING CONCERN BASIS .................................................................................................................... 9 4. JUDGMENTS, ESTIMATES AND ASSUMPTIONS ......................................................................... 10 5. CASH AND CASH EQUIVALENTS................................................................................................... 10 6. RECEIVABLES .................................................................................................................................... 11 7. INVESTMENTS ................................................................................................................................... 11 8. EXPLORATION AND EVALUATION ASSETS................................................................................ 12 9. PROPERTY, PLANT AND EQUIPMENT ............................................................................................ 15 10. SUPPLIERS AND OTHER CREDITORS............................................................................................ 16 11. LOANS AND BORROWINGS............................................................................................................. 16 12. PROVISION FOR SITE RESTORATION ........................................................................................... 16 13. SHARE CAPITAL ................................................................................................................................ 17 14. LEASES ................................................................................................................................................ 18 15. EMPLOYEE REMUNERATION ......................................................................................................... 19 16. FINANCIAL INCOME......................................................................................................................... 21 17. EARNINGS PER SHARE..................................................................................................................... 21 18. RELATED PARTY TRANSACTIONS................................................................................................ 22 19. CAPITAL MANAGEMENT................................................................................................................. 24 20. CONTINGENCIES ............................................................................................................................... 24 21. SUPPLEMENTAL CASH FLOW INFORMATION............................................................................ 24 22. TRANSITION TO IFRS STANDARDS............................................................................................... 25 SCHEDULES............................................................................................................................................... 31

Pétrolia Quebec’s Leader in Petroleum Exploration INTERIM REPORT – THIRD QUARTER 2012 3
UNAUDITED INTERIM FINANCIAL STATEMENTS
FOR THE NINE MONTHS ENDED
JUNE 30, 2012 and 2011
Declaration Concerning the Interim Financial Statements The administration prepared Pétrolia Inc.’s interim financial statements for the third quarter ended June 30, 2012 and the corresponding comparative data. No auditing firm has examined or audited these interim financial statements.

Pétrolia Quebec’s Leader in Petroleum Exploration INTERIM REPORT – THIRD QUARTER 2012 4
INTERIM STATEMENTS OF FINANCIAL POSITION
(Unaudited – in Canadian dollars)
As at June 30, As at September 30, 2012 2011 $ $ ASSETS Current
Cash and cash equivalents (Note 5) 18,993,562 8,151,034 Receivables (Note 6) 1,739,958 4,617,371 Prepaid expenses 1,049,826 141,158 Inventories 61,619 61,619 Investments cashable during the next fiscal year (Note 7) 1,080,000 930,000
22,924,965 13,901,182 Non-current
Exploration and evaluation assets (Note 8) 27,772,122 25,703,789 Property, plant and equipment (Note 9) 1,028,259 931,779
28,800,381 26,635,568 51,725,346 40,536,750 LIABILITIES Current
Suppliers and other creditors (Note 10) 1,668,895 1,469,518 Loans and borrowings (Note 11) - 2,243,310 Provision for site restoration (Note 12) 98,000 135,500
1,766,895 3,848,328 Non-current
Deferred lease inducements 107,319 112,273 Provision for site restoration (Note 12) 233,678 233,678 Deferred tax liabilities 1,548,082 2,239,130
1,889,079 2,585,081 3,655,974 6,433,409 EQUITY
Share capital (Note 13) 51,485,453 35,452,855 Other components of equity 2,853,451 2,395,117 Deficit (6,269,532) (3,744,631) 48,069,372 34,103,341 51,725,346 40,536,750 Going concern basis (Note 3) Contingencies (Note 20) Supplementary notes are an integral part of the interim financial statements
On behalf of the Board (signed) André Proulx (signed) Jaques L. Drouin Director Director
Pétrolia Quebec’s Leader in Petroleum Exploration INTERIM REPORT – THIRD QUARTER 2012 5
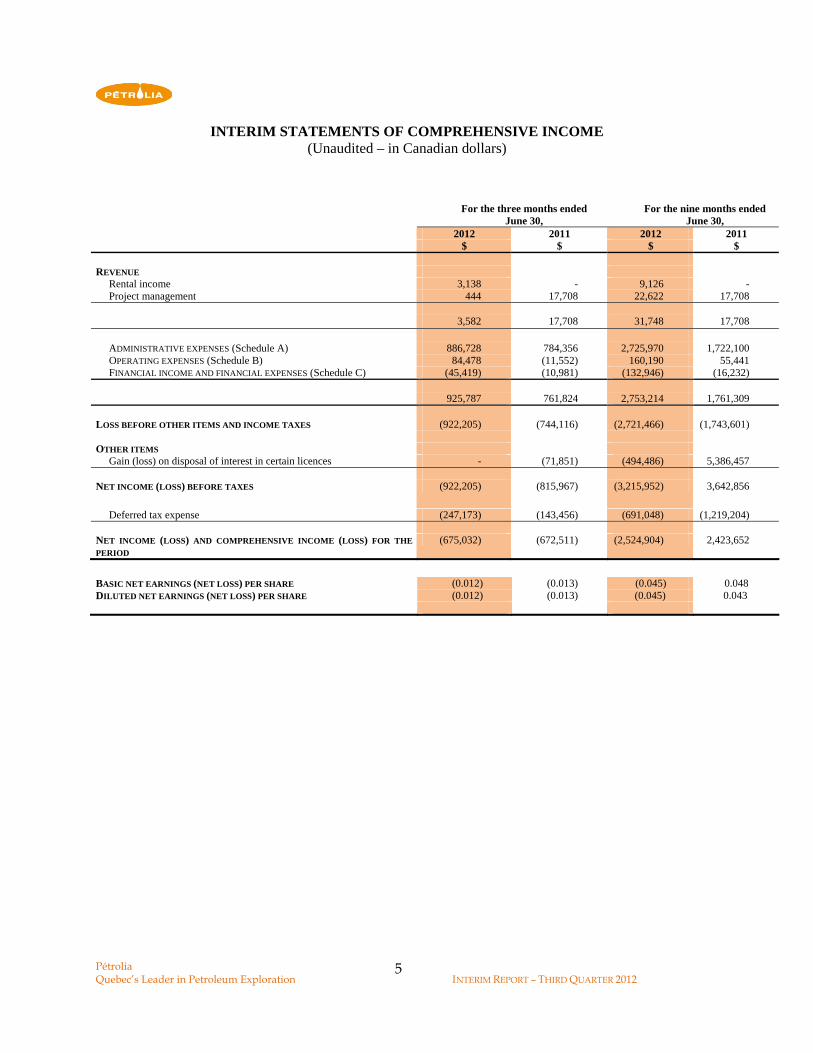
INTERIM STATEMENTS OF COMPREHENSIVE INCOME (Unaudited – in Canadian dollars)
For the three months ended
June 30, For the nine months ended
June 30, 2012 2011 2012 2011 $ $ $ $
REVENUE
Rental income 3,138 - 9,126 - Project management 444 17,708 22,622 17,708
3,582 17,708 31,748 17,708
ADMINISTRATIVE EXPENSES (Schedule A) 886,728 784,356 2,725,970 1,722,100 OPERATING EXPENSES (Schedule B) 84,478 (11,552) 160,190 55,441 FINANCIAL INCOME AND FINANCIAL EXPENSES (Schedule C) (45,419) (10,981) (132,946) (16,232)
925,787 761,824 2,753,214 1,761,309 LOSS BEFORE OTHER ITEMS AND INCOME TAXES (922,205) (744,116) (2,721,466) (1,743,601) OTHER ITEMS
Gain (loss) on disposal of interest in certain licences - (71,851) (494,486) 5,386,457 NET INCOME (LOSS) BEFORE TAXES (922,205) (815,967) (3,215,952) 3,642,856
Deferred tax expense (247,173) (143,456) (691,048) (1,219,204) NET INCOME (LOSS) AND COMPREHENSIVE INCOME (LOSS) FOR THE PERIOD
(675,032) (672,511) (2,524,904) 2,423,652
BASIC NET EARNINGS (NET LOSS) PER SHARE (0.012) (0.013) (0.045) 0.048 DILUTED NET EARNINGS (NET LOSS) PER SHARE (0.012) (0.013) (0.045) 0.043

Pétrolia Quebec’s Leader in Petroleum Exploration INTERIM REPORT – THIRD QUARTER 2012 6
INTERIM STATEMENTS OF CHANGES IN EQUITY (Unaudited – in Canadian dollars)
Share
capital Contributed
surplus Deficit Total
equity
$ $ $ $
Unaudited balance at October 1, 2010 30,416,651 2,083,981
(5,895,007) 26,605,625
Debt repayment 33,750 - - 33,750 Exercise of options 595,662 (118,376) - 477,286 Warrants exercised 326,746 - - 326,746 Stock issuance costs (252) - - (252) Share-based compensation - 495,218 - 495,218
Comprehensive income - - 2,423,652 2,423,652
Unaudited balance at June 30, 2011
31,372,557 2,460,823
(3,471,355) 30,362,025
Audited balance at September 30, 2011 35,452,855 2,395,117
(3,744,631) 34,103,341
Warrants exercised 1,094,140 - - 1,094,140 Exercise of options 460,208 (181,358) - 278,850 Stock issued 15,000,003 - - 15,000,003 Stock issuance costs (521,750) - - (521,750) Share-based compensation - 639,692 - 639,692 Net and comprehensive loss - - (2,524,904) (2,524,904)
Unaudited balance as at June 30, 2012 51,485,456 2,853,451
(6,269,532) 48,069,372

Pétrolia Quebec’s Leader in Petroleum Exploration INTERIM REPORT – THIRD QUARTER 2012 7
INTERIM CONSOLIDATED STATEMENTS OF CASH FLOWS (Unaudited – in Canadian dollars)
For the nine months ended
June 30, 2012 2011 $ $ OPERATING ACTIVITIES
Net income (net loss) (2,524,904) 2,423,652 Items not affecting cash: Depreciation of property, plant and equipment 189,611 60,591 Deferred tax expense (691,048) 1,219,204 Share-based compensation 458,334 453,893 Depreciation of deferred rental incentives (4,954) - Gain on disposal of interest in certain licences - (5,386,457)
(2,572,961) (1,229,117)
Net change in non-cash working capital items: Receivables (56,679) (352,615) Prepaid expenses (908,668) 15,998 Inventories - (67,248) Suppliers and other creditors 153,536 99,805
(811,811) (304,060) FINANCING ACTIVITIES
Issuance of shares 16,554,348 832,786 Share issuance costs (521,750) (252) Repayment of bank debt (2,243,310) -
13,789,288 832,534 INVESTING ACTIVITIES
Acquisition of property, plant and equipment (129,560) (398,041) Acquisition of investments (150,000) - Disposal of interest in certain licences - 6,690,000 Expenses for disposal of interest in certain licences - (597,832) Acquisition of oil and gas properties (1,734,210) 111,460 Increase in deferred exploration expenses net of deductions 2,451,782 (1,140,317)
438,012 4,442,350 INCREASE (DECREASE) IN CASH AND CASH EQUIVALENTS 10,842,528 3,741,707 CASH AND CASH EQUIVALENTS, BEGINNING OF PERIOD 8,151,034 1,949,055 CASH AND CASH EQUIVALENTS, END OF PERIOD (Note 5) 18,993,562 5,690,762 CASH AND CASH EQUIVALENTS ARE MADE UP OF THE FOLLOWING:
Cash 337,411 505,483 Guaranteed investment certificates (redeemable at any time) 5,354,331 5,184,279 Money market fund 13,301,820 1,000
18,993,562 5,690,762
Pétrolia Quebec’s Leader in Petroleum Exploration INTERIM REPORT – THIRD QUARTER 2012 8
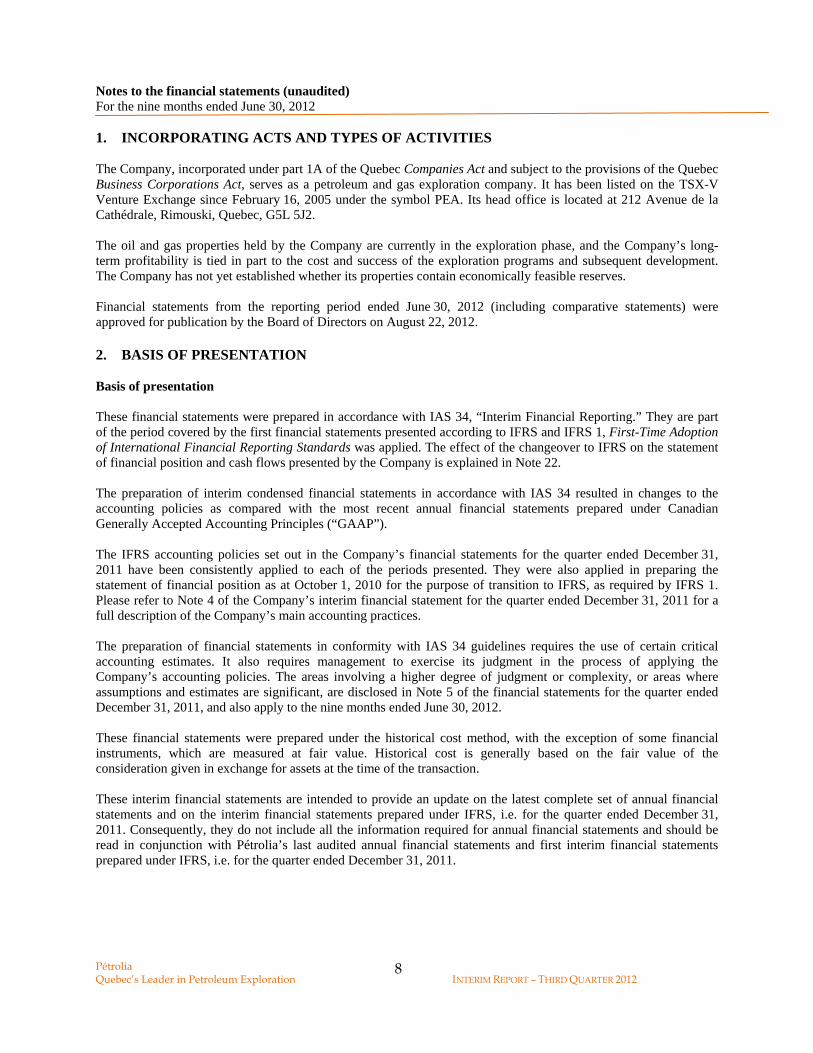
Notes to the financial statements (unaudited) For the nine months ended June 30, 2012 1. INCORPORATING ACTS AND TYPES OF ACTIVITIES The Company, incorporated under part 1A of the Quebec Companies Act and subject to the provisions of the Quebec Business Corporations Act, serves as a petroleum and gas exploration company. It has been listed on the TSX-V Venture Exchange since February 16, 2005 under the symbol PEA. Its head office is located at 212 Avenue de la Cathédrale, Rimouski, Quebec, G5L 5J2. The oil and gas properties held by the Company are currently in the exploration phase, and the Company’s long-term profitability is tied in part to the cost and success of the exploration programs and subsequent development. The Company has not yet established whether its properties contain economically feasible reserves. Financial statements from the reporting period ended June 30, 2012 (including comparative statements) were approved for publication by the Board of Directors on August 22, 2012. 2. BASIS OF PRESENTATION Basis of presentation These financial statements were prepared in accordance with IAS 34, “Interim Financial Reporting.” They are part of the period covered by the first financial statements presented according to IFRS and IFRS 1, First-Time Adoption of International Financial Reporting Standards was applied. The effect of the changeover to IFRS on the statement of financial position and cash flows presented by the Company is explained in Note 22. The preparation of interim condensed financial statements in accordance with IAS 34 resulted in changes to the accounting policies as compared with the most recent annual financial statements prepared under Canadian Generally Accepted Accounting Principles (“GAAP”). The IFRS accounting policies set out in the Company’s financial statements for the quarter ended December 31, 2011 have been consistently applied to each of the periods presented. They were also applied in preparing the statement of financial position as at October 1, 2010 for the purpose of transition to IFRS, as required by IFRS 1. Please refer to Note 4 of the Company’s interim financial statement for the quarter ended December 31, 2011 for a full description of the Company’s main accounting practices. The preparation of financial statements in conformity with IAS 34 guidelines requires the use of certain critical accounting estimates. It also requires management to exercise its judgment in the process of applying the Company’s accounting policies. The areas involving a higher degree of judgment or complexity, or areas where assumptions and estimates are significant, are disclosed in Note 5 of the financial statements for the quarter ended December 31, 2011, and also apply to the nine months ended June 30, 2012. These financial statements were prepared under the historical cost method, with the exception of some financial instruments, which are measured at fair value. Historical cost is generally based on the fair value of the consideration given in exchange for assets at the time of the transaction. These interim financial statements are intended to provide an update on the latest complete set of annual financial statements and on the interim financial statements prepared under IFRS, i.e. for the quarter ended December 31, 2011. Consequently, they do not include all the information required for annual financial statements and should be read in conjunction with Pétrolia’s last audited annual financial statements and first interim financial statements prepared under IFRS, i.e. for the quarter ended December 31, 2011.

Pétrolia Quebec’s Leader in Petroleum Exploration INTERIM REPORT – THIRD QUARTER 2012 9
Notes to the financial statements (unaudited) For the nine months ended June 30, 2012 Standards and interpretations issued but not yet effective The following standards and amendments to existing standards have been published and are mandatory for the Company’s accounting periods beginning on or after January 1, 2013, with earlier application permitted:
• IFRS 9, Financial Instruments, covers the classification and measurement of financial assets and financial liabilities.
• IFRS 10, Consolidated Financial Statements, (“IFRS 10”) and IFRS 12, Disclosure of Interests in Other Entities, (“IFRS 12”). The first standard replaces IAS 27, Consolidated and Separate Financial Statements and SIC-12, Consolidation – Special Purpose Entities, and establishes principles for identifying when an entity controls other entities. The second standard establishes comprehensive disclosure requirements for all forms of interests in other entities, including joint arrangements, associates, and special purpose vehicles.
• IFRS 11, Joint Arrangements, (“IFRS 11”) replaces IAS 31, Interests in Joint Ventures, and SIC-13, Jointly Controlled Entities – Non-monetary Contributions by Venturers, and requires a single method to account for interests in jointly controlled entities.
• Amended and re-titled IAS 27, Separate Financial Statements, and IAS 28, Investments in Associates and Joint Ventures, as a consequence of the new IFRS 10, IFRS 11 and IFRS 12.
• IFRS 13, Fair Value Measurement, provides a single source of fair value measurement and disclosure requirements in IFRS.
• Amendments to IAS 1, Presentation of Financial Statements, to require entities to group items within other comprehensive income that may be reclassified to net income.
The Company is currently evaluating the impact of adopting these standards and amendments on its financial statements. 3. GOING CONCERN BASIS The interim financial statements have been prepared on a going concern basis, which assumes that the Company will be able to realize its assets and discharge its liabilities in the normal course of business in the foreseeable future. Given that the Company has not yet found properties with economically viable hydrocarbon reserves, the Company has not generated income or cash flow from its operations to date. The Company’s ability to continue future operations is dependent on management’s ability to secure additional financing to fund exploration of its oil properties. While management has been successful on this front in the past, there can be no assurance it will be able to do so in the future. The Company has not yet determined whether its discoveries will be profitable. Neither the carrying amounts of the assets and liabilities, revenues and expenses presented in the interim financial statements nor the classification used on the statement of financial position have been adjusted, as would be required if the going concern assumption was not appropriate. Such adjustments could be material. Management did not take these adjustments into account as it believes in the validity of the going concern assumption.

Pétrolia Quebec’s Leader in Petroleum Exploration INTERIM REPORT – THIRD QUARTER 2012 10
Notes to the financial statements (unaudited) For the nine months ended June 30, 2012 4. JUDGMENTS, ESTIMATES AND ASSUMPTIONS The preparation of the financial statements in conformity with IFRS requires management to make judgments, estimates and assumptions that affect the reported amounts of assets and liabilities and contingent liabilities at the date of the financial statements and reported amounts for revenues and expenses during the reporting period. The Company also makes estimates and assumptions concerning the future. Making estimates requires using judgment based on various assumptions and other factors such as experience and current and projected economic conditions. Actual results may differ from these estimates. The areas that require significant estimates and assumptions are set out in the financial statements for the quarter ended December 31, 2011. Estimates and underlying assumptions are continuously evaluated and are based on management’s experience and other factors, including expectations of future events that are believed to be reasonable under the circumstances. 5. CASH AND CASH EQUIVALENTS Cash and cash equivalents include the following items:
As at
June 30,
As at
September 30, 2012 2011 $ $ Bank balances and cash in hand 337,411 695,699 Guaranteed investment certificates 5,354,331 7,454,331 Money market fund 13,301,820 1,004 Less: cash held for exploration (1) - - Cash and cash equivalents 18,993,562 8,151,034
(1)
Cash held for exploration represents proceeds from financing not yet incurred related to flow-through shares. According to restrictions imposed under financing arrangements, the Company must allocate these funds to the exploration of oil properties.
On June 30, 2012, cash and cash equivalents included guaranteed investment certificates with interest between 1.75% and 2.4% (1.75% and 2.4% on September 30, 2011), expiring between December 22, 2012 and May 8, 2013. These instruments are cashable at any time without penalty.
Pétrolia Quebec’s Leader in Petroleum Exploration INTERIM REPORT – THIRD QUARTER 2012 11
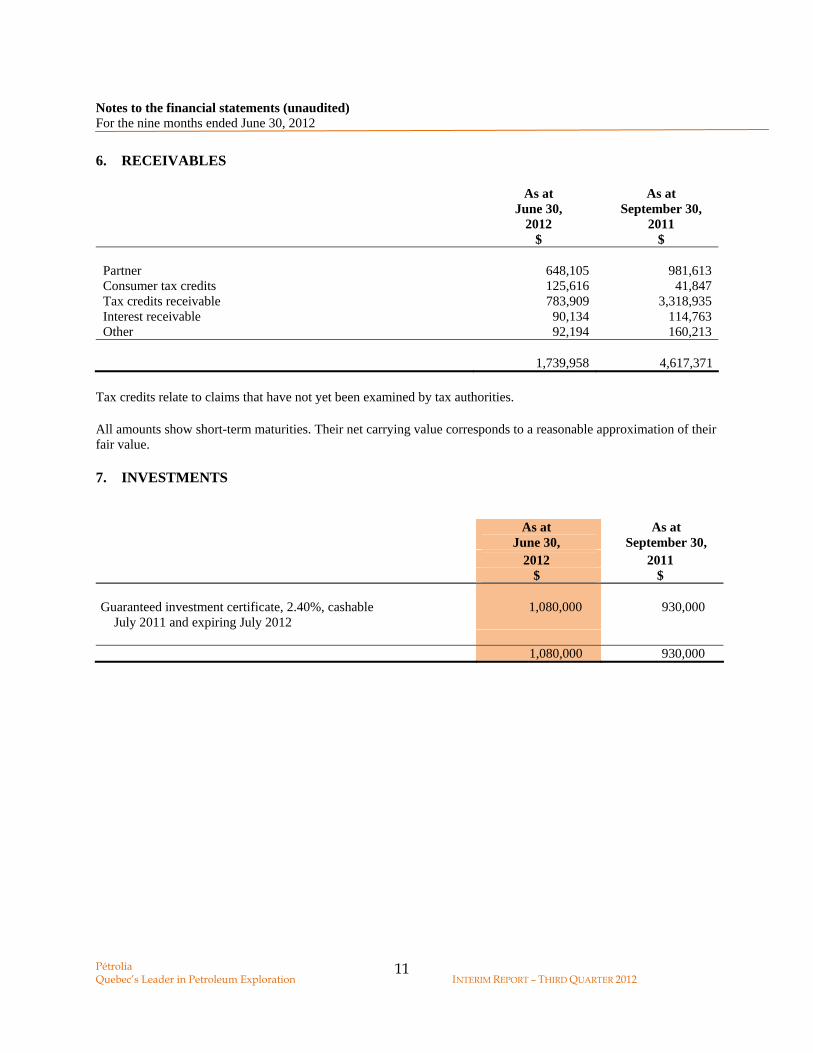
Notes to the financial statements (unaudited) For the nine months ended June 30, 2012 6. RECEIVABLES
As at June 30,
As at September 30,
2012 2011 $ $ Partner 648,105 981,613 Consumer tax credits 125,616 41,847 Tax credits receivable 783,909 3,318,935 Interest receivable 90,134 114,763 Other 92,194 160,213 1,739,958 4,617,371
Tax credits relate to claims that have not yet been examined by tax authorities. All amounts show short-term maturities. Their net carrying value corresponds to a reasonable approximation of their fair value. 7. INVESTMENTS
As at
June 30, As at
September 30, 2012 2011 $ $ Guaranteed investment certificate, 2.40%, cashable July 2011 and expiring July 2012
1,080,000 930,000
1,080,000 930,000

Pétrolia Quebec’s Leader in Petroleum Exploration INTERIM REPORT – THIRD QUARTER 2012 12
Notes to the financial statements (unaudited) For the nine months ended June 30, 2012 8. EXPLORATION AND EVALUATION ASSETS Oil and gas properties September 30,
2011 $
Write-off
$
Additions
$
June 30, 2012
$ Quebec Anticosti 1 296,297 - 44,578 340,875 Gastonguay 664,398 - - 664,398 Gaspésia – Edgar – Marcel – Tremblay 404,933 - - 404,933 Gaspé 1 1,635,540 - 1,696,943 3,332,483 New Brunswick Dalhousie 146,837 (7,311) - 139,526 Oil and gas property totals 3,148,005 (7,311) 1,741,521 4,882,215
Exploration expenses September 30,
2011 $
Write-off
$
Additions
$
June 30, 2012
$ Quebec Anticosti 6,341,925 - 192,877 6,534,802 Gastonguay 74,638 - 397 75,035 Gaspésia – Edgar – Marcel – Tremblay 3,730,267 - 39,017 3,769,284 Gaspé 2,450,597 - 176,513 2,627,110
Bourque project 3,668,983 - 171,432 3,840,415 Haldimand project 11,198,581 - 1,849,983 13,048,564 Tar Point No. 1 project 4,955,679 - 324,731 5,280,410
New Brunswick Dalhousie 1,143,494 (281,778) - 861,716 33,564,164 (281,778) 2,754,950 36,037,336 Less: Exploration subsidies and partner contributions
Anticosti 2,280,008 - 67,013 2,347,021 Gastonguay 18,796 - 112 18,908 Gaspésia – Edgar – Marcel – Tremblay 411,354 - 11,404 422,758 Gaspé 550,176 - 64,461 614,637
Bourque project 3,060,535 - 58,898 3,119,433 Haldimand project 3,667,265 - 1,616,005 5,283,270 Tar Point No. 1 project 796,565 - 291,703 1,088,268
Dalhousie 6,922 - - 6,922 10,791621 2,109,596 12,901,217 Income from evaluation of oil reserves: Gaspé
Haldimand project 216,759 - 29,453 246,212 Total exploration expenses 22,555,784 (281,778) 615,901 22,889,907

Pétrolia Quebec’s Leader in Petroleum Exploration INTERIM REPORT – THIRD QUARTER 2012 13
Notes to the financial statements (unaudited) For the nine months ended June 30, 2012 Summary as at June 30, 2012 September 30,
2011 $
Write-off
$
Additions
$
June 30, 2012
$ Properties 3,148,005 (7,311) 1,741,521 4,882,215 Exploration expenses 22,555,784 (281,778) 615,901 22,889,907 Exploration and evaluation assets 25,703,789 (289,089) 2,357,422 27,772,122
Oil and gas properties October 1,
2010 $
Disposal
$
Additions
$
September 30, 2011
$ Quebec Anticosti 1 259,970 - 36,327 296,297 Gastonguay 638,497 - 25,901 664,398 Gaspésia – Edgar – Marcel – Tremblay 382,915 - 22,018 404,933 Gaspé 1 2,427,941 (806,060) 13,659 1,635,540 New Brunswick Dalhousie 143,306 - 3,531 146,837 Oil and gas property totals 3,852,629 (806,060) 101,436 3,148,005
Exploration expenses October 1,
2010 $
Write-off
$
Additions
$
September 30, 2011
$ Quebec Anticosti 5,305,277 - 1,036,648 6,341,925 Gastonguay 73,473 - 1,165 74,638 Gaspésia – Edgar – Marcel – Tremblay 3,531,433 - 198,834 3,730,267 Gaspé 2,264,806 - 185,791 2,450,597
Bourque project 3,580,147 - 88,836 3,668,983 Haldimand project 9,383,853 - 1,814,728 11,198,581 Tar Point No. 1 project 4,699,028 - 256,651 4,955,679
New Brunswick Dalhousie 1,111,708 - 31,786 1,143,494 29,949,725 - 3,614,439 33,564,164 Less: Exploration subsidies and partner contributions
Anticosti 1,930,632 - 349,376 2,280,008 Gastonguay 18,415 - 381 18,796 Gaspésia – Edgar – Marcel – Tremblay 341,818 - 69,536 411,354 Gaspé 483,228 - 66,948 550,176
Bourque project 3,027,548 - 32,987 3,060,535 Haldimand project 2,170,519 - 1,496,746 3,667,265 Tar Point No. 1 project 626,494 - 170,071 796,565
Dalhousie 6,922 - - 6,922 8,605,576 - 2,186,045 10,791621 Income from evaluation of oil reserves: Gaspé
Haldimand project 109,738 - 107,021 216,759 Total exploration expenses 21,234,411 - 1,321,373 22,555,784

Pétrolia Quebec’s Leader in Petroleum Exploration INTERIM REPORT – THIRD QUARTER 2012 14
Notes to the financial statements (unaudited) For the nine months ended June 30, 2012 Summary as at September 30, 2011 October 1,
2010 $
Disposal
$
Additions
$
September 30, 2011
$ Properties 3,852,629 (806,060) 101,436 3,148,005 Exploration expenses 21,234,411 - 1,321,373 22,555,784 Exploration and evaluation assets 25,087,040 (806,060) 1,422,809 25,703,789
(1) P
roperties with the reference (1) are subject to royalties should they become productive. To date, the Company has satisfied all required obligations and lists only its future or potential obligations and special transactions of the year below.
Gaspé properties In May 2008, Pétrolia acquired a 100% interest in a 6,043-km2 surface area of these properties (excluding the Haldimand property), subject to a royalty of 0.5% to 2.5% on the future production of hydrocarbons. In June 2010, the Company carried out an asset exchange, increasing its interest to 100% in all Gaspé leases, a 150-km2 territory, with the exception of a 9-km2 zone in which it holds a 64% interest (Haldimand property). On December 20, 2010, the Company signed definitive agreements for the sale of 50% of its interests in the Haldimand discovery as well as in 13 leases surrounding this discovery to Québénergie Inc. (subsidiary of Investcan) for the sum of $15,190,000. A sum of $6,690,000 was paid in cash and $8,500,000 in exploration work will be carried out by Québénergie inc. over the next two years. Haldimand property On May 6, 2008, a second agreement defined a development area of 9 km2 around the Pétrolia Haldimand No. 1 well in which Pétrolia held a 45% interest, Junex 45% and Gastem 10%. Some of the licences to these properties are subject to royalty payments of 5%. Under an amendment to the original agreement signed July 22, 2009, Pétrolia became the operator of the entire 9-km2 development area. On October 1, 2009, Pétrolia acquired all of Gastem’s interest. Following its decision not to participate in the drilling of a second well, Junex saw its ownership interest decrease by 9%. After signing definitive agreements to sell 50% of the interests in the Haldimand discovery, Haldimand’s ownership is as follows: Pétrolia – 32%, Québenergié – 32% and Junex – 36%.
On December 20, 2011, Pétrolia and Québénergie paid $3.1 million to buy all of Junex’s interests in this deposit. The agreement releases Junex from the production penalties to which it was exposed by failing to participate in recent work on the properties. Following this transaction, Pétrolia and Québénergie now own an equal share in the deposit and surrounding properties.
Bourque property A few years ago, the Company signed a $20 million farmout agreement with Pilatus Energy Canada. By investing $20 million in exploration and development work over five years, Pilatus would have obtained a 70% stake in the four licences granted for the Bourque project. Unfortunately, the difficult economic situation in 2009 prevented Pilatus from meeting the obligations stipulated in the agreement signed with Pétrolia. The parties both agreed to terminate the initial agreement and in exchange Pilatus obtained a 5% stake in the project.

Pétrolia Quebec’s Leader in Petroleum Exploration INTERIM REPORT – THIRD QUARTER 2012 15
Notes to the financial statements (unaudited) For the nine months ended June 30, 2012 Anticosti property The Company acquired all of Hydro-Québec’s rights on Anticosti Island in return for an overriding royalty on oil production. Under this agreement, Pétrolia shares a 25% interest with Corridor Resources Inc. in six licences and 50% in 29 exploration licences on the island and acts as an operator for most of them. In June 2010, the Company participated in the drilling of three exploration wells and extracted a core sample to evaluate the McCasty formation’s potential as a shale gas reservoir. Once its obtains the results of the core sample analysis, the Company plans to undertake development work in order to better estimate the oil potential of Anticosti Island. 9. PROPERTY, PLANT AND EQUIPMENT Leasehold
improvements Office
equipment Rolling
stock Reservoirs
and construction
facilities
Sites
Total
$ $ $ $ $ $ Cost Balance as at October 1, 2011 565,179 266,809 236,187 115,739 75,434 1,259,348 Additions 12,304 22,069 8,301 243,417 286,091 Disposal - - - - - - Balance as at June 30, 2012 577,483 288,878 244,488 359,156 75,434 1,545,439 Accumulated depreciation Balance as at October 1, 2011 65,807 96,046 157,594 8,122 - 327,569 Retirement - - - - - - Depreciation 119,631 32,076 18,721 19,183 - 189,611 Balance as at June 30, 2012 185,438 128,122 176,315 27,305 - 517,180 Book value as at June 30, 2012 392,045 160,756 68,173 331,851 75,434 1,028,259 Book value as at September 30, 2011 499,372 170,763 78,593 107,617 75,434 931,779
Leasehold
improvements Office
equipment Rolling
stock
Reservoirs
Sites
Total $ $ $ $ $ $ Cost Balance as at October 1, 2010 18,387 160,040 236,187 - - 414,614 Additions 369,609 47,398 - 56,713 64,007 537,727 Disposal - - - - - - Balance as at June 30, 2011 387,996 207,438 236,187 56,713 64,007 952,341 Accumulated depreciation Balance as at October 1, 2010 16,831 60,713 123,911 - - 201,455 Retirement - - - - - - Depreciation 12,017 20,477 25,262 2,835 - 60,491 Balance as at June 30, 2011 28,848 81,190 149,173 2,835 - 262,046 Book value as at June 30, 2011 Book value as at October 1, 2010 1,566 99,327 112,276 - - 213,159

Pétrolia Quebec’s Leader in Petroleum Exploration INTERIM REPORT – THIRD QUARTER 2012 16
Notes to the financial statements (unaudited) For the nine months ended June 30, 2012 10. SUPPLIERS AND OTHER CREDITORS
As at June 30,
As at September 30,
2012 2011 $ $ Security deposits from partners 307,500 - Trade and other payables 961,072 895,924 Accrued liabilities 400,323 570,022 Related parties - 3,572 1,668,895 1,469,518
11. LOANS AND BORROWINGS
As at June 30,
As at September 30,
2012 2011 $ $Bank loan, in the amount of $2,500,000, bearing interest at Caisse Centrale Desjardins’ prime rate plus 1%, secured by a mortgage of $2,500,000 on the Company’s current and future claims and receivables, with a first priority claim on refundable tax credits and future tax credits, as well as an 80% surety from Investissement Québec. The principal was repaid during the first quarter.
-
2,243,310 12. PROVISION FOR SITE RESTORATION Management calculates the total provisions for future site restoration based on the estimated cost to abandon and reclaim its net ownership interest in all wells and facilities and the estimated timing of the costs to be incurred in future periods. At June 30, 2012, the future estimated total required to settle obligations related to site restoration, indexed at 3.5%, was $331,678. An amount of $98,000 of this obligation will be settled during the fiscal year. The total future amount was discounted using the weighted average rate of 5.25%, according to a payment schedule ranging from 1 to 30 years. The total undiscounted amount of the estimated cash flow required to settle this obligation is $331,678.

Pétrolia Quebec’s Leader in Petroleum Exploration INTERIM REPORT – THIRD QUARTER 2012 17
Notes to the financial statements (unaudited) For the nine months ended June 30, 2012 The following table presents the reconciliation of the provision for site restoration:
As at June 30,
As at September 30,
2012 2011 $ $
Balance, beginning of period - - Liabilities incurred 331,678 369,178
Balance, end of period 331,678 369,178 Portion of liability to be settled during the following fiscal year 98,000 135,500
233,678 233,678 13. SHARE CAPITAL Authorized Unlimited number of common, participating, voting shares without par value.
Issued: Nine months Fiscal year ended June 30, 2012 ended September 30, 2011
Number of shares
Amount
Number of shares
Amount
$ $ Balance, beginning of period 54,579,477 35,452,855 50,067,287 30,416,651 Shares issued: 11,091,552 15,000,003 Debt repayment - - 75,000 33,750 Warrants exercised 264,721 1,094,140 3,878,440 4,505,472 Exercise of stock options 650,000 460,208 558,750 487,748 Future taxes - (521,750) 10,068 Share issuance costs - (3) (834) Balance, end of period 66,585,750 51,485,453 54,579,477 35,452,855

Pétrolia Quebec’s Leader in Petroleum Exploration INTERIM REPORT – THIRD QUARTER 2012 18
Notes to the financial statements (unaudited) For the nine months ended June 30, 2012 Warrants Outstanding warrants allow holders to subscribe to an equivalent number of common shares as follows:
Nine months Fiscal year ended June 30,
2012 ended September 30,
2011
Number of warrants
Weighted
average exercise
price Number of
warrants
Weighted
average exercise
price $ $ Balance, beginning of period 264,721 1.30 10,246,493 1.23 Granted 5,545,777 1.78 - - Exercised (264,721) 1.30 (3,878,440) 1.15 Expired - - (6,103,332) 1.27 Balance, end of period 5,545,777 1.78 264,721 1.30
The number of outstanding warrants that can be exercised for an equivalent number of common shares is established as follows:
Nine months Fiscal year ended June 30,
2012 ended September 30,
2011
Expiry date
Number of warrants
Exercise
price Number of
warrants
Exercise
price $ $ December 4, 2011 - - 264,721 1.30 May 15, 2015 5,545,777 1.78 - -
14. LEASES
Minimum lease payments due Less than 1
year 1 to 5 years Total
$ $ $ June 30, 2012 286,059 806,106 1,092,165 September 30, 2011 275,306 1,009,239 1,284,545
The Company leases its offices under a lease expiring in 2012 and in 2016. Lease payments recognized as expenses during the reporting period total $202,252 ($86,657 in 2011). This amount represents minimum lease payments. No sublease or contingent rent payment was recognized as an expense. An amount of $8,982 ($0 in 2011) was received as a sublease payment. The Company’s rental contracts do not contain any contingent rent clauses, restrictions on dividends, additional debt or further leasing.
Pétrolia Quebec’s Leader in Petroleum Exploration INTERIM REPORT – THIRD QUARTER 2012 19
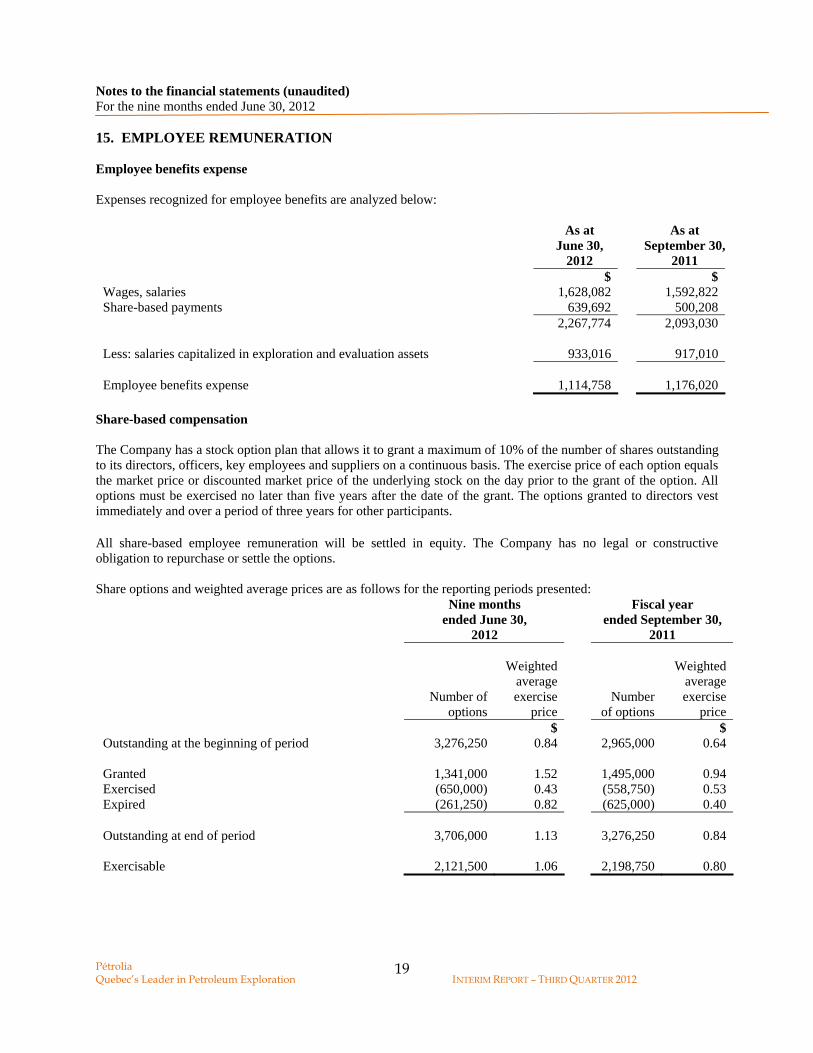
Notes to the financial statements (unaudited) For the nine months ended June 30, 2012 15. EMPLOYEE REMUNERATION Employee benefits expense Expenses recognized for employee benefits are analyzed below:
As at June 30,
As at September 30,
2012 2011 $ $ Wages, salaries 1,628,082 1,592,822 Share-based payments 639,692 500,208 2,267,774 2,093,030 Less: salaries capitalized in exploration and evaluation assets 933,016 917,010 Employee benefits expense 1,114,758 1,176,020
Share-based compensation The Company has a stock option plan that allows it to grant a maximum of 10% of the number of shares outstanding to its directors, officers, key employees and suppliers on a continuous basis. The exercise price of each option equals the market price or discounted market price of the underlying stock on the day prior to the grant of the option. All options must be exercised no later than five years after the date of the grant. The options granted to directors vest immediately and over a period of three years for other participants. All share-based employee remuneration will be settled in equity. The Company has no legal or constructive obligation to repurchase or settle the options. Share options and weighted average prices are as follows for the reporting periods presented:
Nine months Fiscal year ended June 30,
2012 ended September 30,
2011
Number of options
Weighted
average exercise
price Number
of options
Weighted
average exercise
price $ $ Outstanding at the beginning of period 3,276,250 0.84 2,965,000 0.64 Granted 1,341,000 1.52 1,495,000 0.94 Exercised (650,000) 0.43 (558,750) 0.53 Expired (261,250) 0.82 (625,000) 0.40 Outstanding at end of period 3,706,000 1.13 3,276,250 0.84 Exercisable 2,121,500 1.06 2,198,750 0.80

Pétrolia Quebec’s Leader in Petroleum Exploration INTERIM REPORT – THIRD QUARTER 2012 20
Notes to the financial statements (unaudited) For the nine months ended June 30, 2012 The following table reflects stock options issued and outstanding at June 30, 2012:
Options outstanding Number of options Exercise price Time to maturity Expiration date
$ years 400,000 0.60 0.87 February 12, 2013 327,500 1.25 1.27 July 7, 2013 120,000 0.74 2.14 May 21, 2014 270,000 0.89 2.91 February 25, 2015 672,500 0.50 3.69 December 8, 2015
75,000 1.31 3.91 February 25, 2016 500,000 1.69 4.13 May 18, 2016
1,266,000 1.52 4.68 December 4, 2016 75,000 1.51 4.90 February 22, 2017
The following table reflects stock options issued and outstanding at September 30, 2011:
Options outstanding Number of options Exercise price Time to maturity Expiration date
$ years 21,250 0.74 0.7 May 21, 2012
547,500 0.40 0.8 June 21, 2012 400,000 0.60 1.3 February 12, 2013 125,000 0.60 1.4 March 3, 2013 427,500 1.25 1.8 July 7, 2013 120,000 0.74 2.7 May 21, 2014 270,000 0.89 3.4 February 25, 2015 790,000 0.50 4.2 December 8, 2015
75,000 1.31 4.4 February 25, 2016 500,000 1.69 4.6 May 18, 2016
The weighted-average grant date fair value of the options granted in fiscal 2011 was $0.85 per option ($0.68 for the 2010 fiscal year). The fair value of the options granted during the period was calculated using the Black-Scholes option-pricing model with the following weighted average assumptions:
February
2012 December
2011 May 2011
February 2011
Share price at grant date 1.51 1.52 1.69 1.31 Risk-free interest rate 3% 3% 3% 3% Average expected volatility 91% 91% 94% 94% Average expected life (years) 5 1–5 5 5 Expected dividend yield Nil Nil Nil Nil

Pétrolia Quebec’s Leader in Petroleum Exploration INTERIM REPORT – THIRD QUARTER 2012 21
Notes to the financial statements (unaudited) For the nine months ended June 30, 2012 The underlying expected volatility was determined by reference to historical data of the Company’s shares over a period of five years since the grant date. Accordingly, the share-based compensation was allocated as follows: March
2012 December
2011 May 2011
February 2011
$ $ $ $ Statement of income 36,968 469,741 153,625 71,400 Deferred exploration expenses 43,732 89,251 7,125 - Total 80,700 558,992 160,750 71,400
16. FINANCIAL INCOME Financial income may be analyzed as follows for the reporting periods presented:
As at June 30,
As at June 30,
2012 2011 $ $ Interest income from cash and cash equivalents 145,622 85,574 Interest income from receivables - - Financial income 145,622 85,574
17. EARNINGS PER SHARE Basic earnings per share have been calculated by dividing net income for the fiscal year by the weighted average number of common shares outstanding during the period. For purposes of calculating diluted earnings per share, potential common shares such as certain options and certain warrants were not included because their conversion would have decreased the loss per share and thus had an anti-dilutive effect. Both basic and diluted earnings per share have been calculated using net income as the numerator, i.e. no adjustment to income was necessary.
As at June 30,
As at September 30,
2012 2011 Net income (2,524,904) 2,160,668 Basic weighted average number of common shares 56,302,504 51,249,243 Basic earnings per common share (0.045) 0.042 Weighted average number of diluted common shares n/a 52,590,389 Diluted earnings per common share n/a 0.041
Pétrolia Quebec’s Leader in Petroleum Exploration INTERIM REPORT – THIRD QUARTER 2012 22
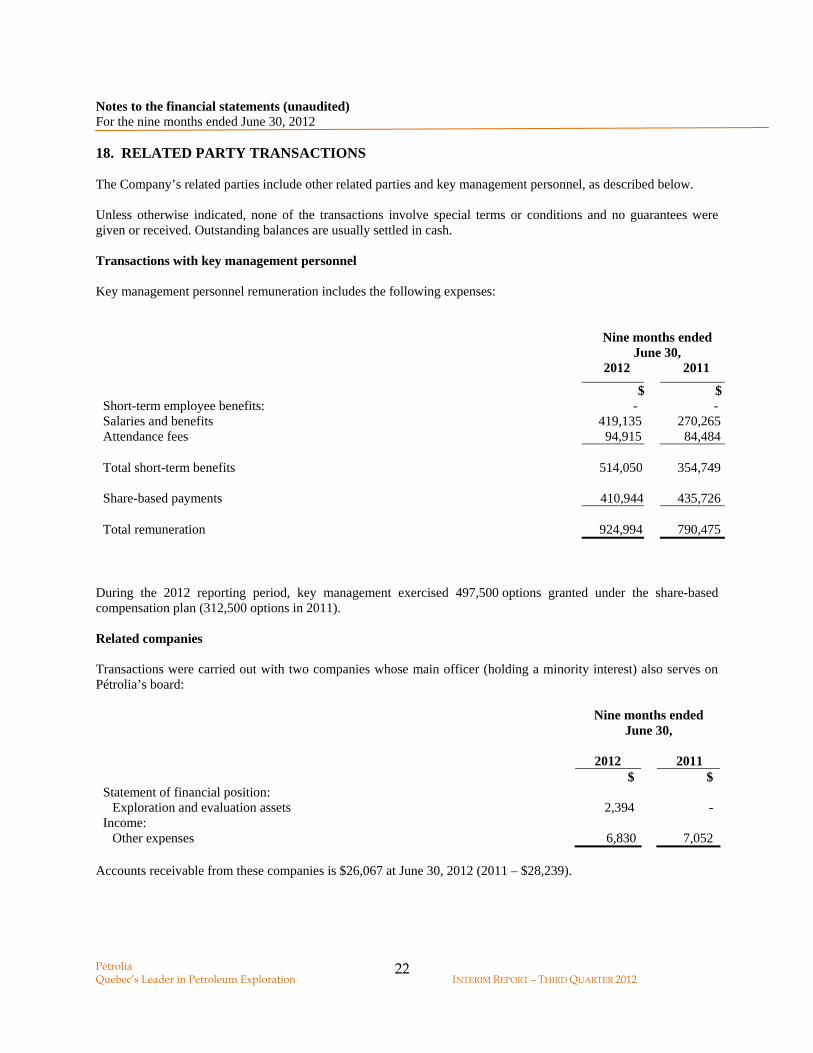
Notes to the financial statements (unaudited) For the nine months ended June 30, 2012 18. RELATED PARTY TRANSACTIONS The Company’s related parties include other related parties and key management personnel, as described below. Unless otherwise indicated, none of the transactions involve special terms or conditions and no guarantees were given or received. Outstanding balances are usually settled in cash. Transactions with key management personnel Key management personnel remuneration includes the following expenses:
Nine months ended June 30,
2012 2011
$ $Short-term employee benefits: - - Salaries and benefits 419,135 270,265Attendance fees 94,915 84,484 Total short-term benefits 514,050 354,749 Share-based payments 410,944 435,726 Total remuneration 924,994 790,475
During the 2012 reporting period, key management exercised 497,500 options granted under the share-based compensation plan (312,500 options in 2011). Related companies Transactions were carried out with two companies whose main officer (holding a minority interest) also serves on Pétrolia’s board:
Nine months ended June 30,
2012 2011 $ $
Statement of financial position: Exploration and evaluation assets 2,394 -
Income: Other expenses 6,830 7,052
Accounts receivable from these companies is $26,067 at June 30, 2012 (2011 – $28,239).

Pétrolia Quebec’s Leader in Petroleum Exploration INTERIM REPORT – THIRD QUARTER 2012 23
Notes to the financial statements (unaudited) For the nine months ended June 30, 2012 Transactions were carried out with a director acting as a consultant for the Company:
Nine months ended June 30,
2012 2011 $ $ Statement of financial position:
Exploration and evaluation assets 2,062 3,469 The balance owed to this director is $0 as at March 31, 2012 (2011 – $0). The Company entered into the following transactions with a company whose director also sits on Pétrolia’s board:
Nine months ended June 30,
2012 2011 $ $
Income:
Salaries and benefits 2,716 17,193Office supplies 700 800
The balance due from this company as at June 30, 2012 is $2,900 (2011 – $808). The Company entered into the following transactions with a close relative of a member of management, who provided services to the Company:
Nine months ended June 30,
2012 2011 $ $ Statement of financial position:
Property, plant and equipment 8,607 17,919Income:
Office maintenance 4,806 - The balance owing this supplier is $0 as at June 30, 2012 (2011 – $0). Management considers that these transactions were concluded on an arm’s length basis. These transactions took place in the normal course of business and were measured at their exchange value, which is the consideration established and accepted by related parties.

Pétrolia Quebec’s Leader in Petroleum Exploration INTERIM REPORT – THIRD QUARTER 2012 24
Notes to the financial statements (unaudited) For the nine months ended June 30, 2012 19. CAPITAL MANAGEMENT The Company’s capital management objectives are to ensure the Company’s ability to pursue its exploration activities. Capital consists of share capital. Management regularly reviews its capital management policy on a going concern basis and believes that this is a reasonable approach considering the Company’s size. The Company’s financial strategy is developed and adapted according to market conditions in order to maintain a flexible capital structure in compliance with the aforementioned objectives and to respond to the risk characteristics of the underlying assets. In order to maintain or adjust its capital structure, the Company, as a junior exploration company, issues new shares. There were no material changes to the Company’s capital management policies and procedures during the period ended June 30, 2012. The Company is not subject to any externally imposed capital requirements, regulations or contractual requirements, unless the Company closes a flow-through placement, in which case the funds are restricted to exploration activities. 20. CONTINGENCIES Environment and letters of guarantee The Company’s operations are subject to environmental protection legislation. Environmental consequences are difficult to predict, whether in terms of their outcomes, dates or impact. Currently, to the best of management’s knowledge, the Company is operating in compliance with current legislation. Letters of guarantee in the amount of $1,080,000 were issued in favour of the Ministère des Ressources naturelles to guarantee the work to shut down certain sites. These letters are secured by guaranteed investment certificates (GICs) in an equivalent amount. On January 5, 2012, a motion to institute proceedings (action on account) was filed against the Company. The amount claimed is $198,832. The Company plans to contest the claims made in the motion since the supplier is unable to provide sufficient proof and documentation to justify the amounts invoiced. If the Court finds against the Company, there will be no impact on its financial results as the Company has made a provision for the full amount. 21. SUPPLEMENTAL CASH FLOW INFORMATION Supplemental information
June 30, June 30, 2012 2011 $ $ Interest paid 15,505 66,584 Interest received 143,367 - Dividends paid n/a n/a Dividends received n/a n/a

Pétrolia Quebec’s Leader in Petroleum Exploration INTERIM REPORT – THIRD QUARTER 2012 25
Notes to the financial statements (unaudited) For the nine months ended June 30, 2012 22. TRANSITION TO IFRS STANDARDS The transition exemption elected by the Company for the transition from Canadian GAAP to IFRS as well as the additional information on an IFRS basis for the year ended September 30, 2011 considered relevant to an understanding of the interim financial statements for the three-month period ended December 31, 2011 are summarized in Note 26. The effect of the Company’s transition from Canadian GAAP to IRFS as at June 30, 2011 and for the three and nine months then ended is presented as follows:
A) Reconciliation of equity and comprehensive income reported under Canadian GAAP and IFRS
B) Adjustment to the statement of cash flows
C) Notes to the reconciliations

Pétrolia Quebec’s Leader in Petroleum Exploration INTERIM REPORT – THIRD QUARTER 2012 26
Notes to the financial statements (unaudited) For the nine months ended June 30, 2012 A) Reconciliation of equity and comprehensive income reported under Canadian GAAP and IFRS Statement of financial position as at June 30, 2011
Canadian GAAP items
Previous Canadian GAAP
Effect of transition to
IFRS
IFRS
IFRS items
$ $ $ ASSETS ASSETS CURRENT ASSETS CURRENT Cash and cash equivalents 5,690,762 - 5,690,762 Cash and cash equivalents Receivables 3,628,483 - 3,628,483 Receivables Inventories 67,248 - 67,248 Inventories Prepaid expenses 54,374 - 54,374 Prepaid expenses Investments cashable during the next fiscal year
754,331
-
754,331
Investments cashable during the next fiscal year
10,195,198 - 10,195,198 Total current assets NON-CURRENT Capital assets 690,295 - 690,295 Property, plant and equipment a) 25,519,059 25,524,055 Exploration and evaluation assets c) 4,996 Oil and gas properties 3,158,029 (3,158,029) - Deferred exploration expenses 22,361,030 (22,361,030) - 26,209,354 4,996 26,214,350 Total non-current assets 36,404,552 4,996 36,409,548 Total assets LIABILITIES LIABILITIES CURRENT LIABILITIES CURRENT Trade and other payables 1,361,776 - 1,361,776 Suppliers and other creditors Loan 2,243,310 - 2,243,310 Loans and borrowings 3,605,086 - 3,605,086 NON-CURRENT Future taxes 2,442,437 - 2,442,437 Deferred tax liabilities 6,047,523 - 6,047,523 Total liabilities SHAREHOLDERS’ EQUITY b) 2,793,592 EQUITY b) (637,500) Share capital 29,244,780 e) (28,315) 31,372,557 Share capital
185,264
Contributed surplus – Stock options 1,371,762 d) 903,797 2,460,823 Other components of equity
Contributed surplus – Expired stock options
903,797 d) (903,797) -
b) (2,793,592) c) (180,268) b) 637,500 Deficit (1,163,310) e) 28,315 (3,471,355) Deficit 30,357,029 30,362,025 Total equity
36,404,552
36,409,548
Total liabilities and equity

Pétrolia Quebec’s Leader in Petroleum Exploration INTERIM REPORT – THIRD QUARTER 2012 27
Notes to the financial statements (unaudited) For the nine months ended June 30, 2012 Statement of income and comprehensive income for the three-month period ended June 30, 2011
Canadian GAAP items
Previous Canadian GAAP
Effect of transition to
IFRS
IFRS
IFRS items
$ $ $ REVENUE OTHER REVENUE Project management
17,708
-
17,708
Project management
Interest income
33,665
-
33,665
Revenue from cash a nd cash equivalents
51,373 - 51,373 OPERATING AND ADMINISTRATIVE EXPENSES
ADMINISTRATIVE EXPENSES
Share-based compensation 160,750 183,875 344,625 Share-based compensation Salaries and benefits 433,119 - 433,119 Salaries and benefits Insurance 15,569 - 15,569 Insurance Travel 43,816 - 43,816 Travel Office supplies 15,297 - 15,297 Office supplies Training 1,300 - 1,300 Training Board of Directors expenses 48,840 - 48,840 Board of Directors fees Information for shareholders 8,694 - 8,694 Information for shareholders Interest and bank fees 21,841 - 21,841 Interest and bank fees Office rent 31,999 - 31,999 Office rent Promotion and entertainment 16,582 - 16,582 Promotion and entertainment Professional fees 49,484 - 49,484 Professional fees Telecommunications 5,402 - 5,402 Telecommunications Depreciation of capital assets
27,134 -
27,134 Depreciation of property, plant
and equipment Other expenses 102 - 102 Other expenses Allocation to deferred exploration work
(268,315)
-
(268,315)
Allocation to exploration and evaluation assets
611,614 183,875 795,489 OTHER ITEMS OTHER ITEMS Gain (loss) on disposal of interest in certain licences
(71,851)
-
(71,851)
Gain (loss) on disposal of interest in certain licences
(632,092) 183,875 (815,967) EARNINGS BEFORE INCOME TAXES NET INCOME BEFORE INCOME TAXES Future income taxes (143,456) - (143,456) Deferred tax expense NET INCOME AND COMPREHENSIVE INCOME
(488,636)
(672,511)
NET INCOME AND COMPREHENSIVE INCOME FOR THE PERIOD
BASIC EARNINGS PER SHARE (0.010) (0.013) BASIC EARNINGS PER SHARE
DILUTED EARNINGS PER SHARE (0.010) (0.013) DILUTED EARNINGS PER SHARE

Pétrolia Quebec’s Leader in Petroleum Exploration INTERIM REPORT – THIRD QUARTER 2012 28
Notes to the financial statements (unaudited) For the nine months ended June 30, 2012 Statement of income and comprehensive income for the nine-month period ended June 30, 2011
Canadian GAAP items
Previous Canadian GAAP
Effect of transition to
IFRS
IFRS
IFRS items
$ $ $ REVENUE OTHER REVENUE Project management
17,708
-
17,708
Project management
Interest income
85,574
-
85,574
Revenue from cash a nd cash equivalents
103,282 - 103,282 OPERATING AND ADMINISTRATIVE EXPENSES
ADMINISTRATIVE EXPENSES
Share-based compensation 314,950 180,268 495,218 Share-based compensation Salaries and benefits 1,253,256 - 1,253,256 Salaries and benefits Insurance 42,475 - 42,475 Insurance Travel 137,012 - 137,012 Travel Office supplies 54,016 - 54,016 Office supplies Training 6,713 - 6,713 Training Board of Directors expenses 108,034 - 108,034 Board of Directors fees Information for shareholders 69,852 - 69,852 Information for shareholders Interest and bank fees 66,584 - 66,584 Interest and bank fees Office rent 90,641 - 90,641 Office rent Promotion and entertainment 69,863 - 69,863 Promotion and entertainment Professional fees 155,291 - 155,291 Professional fees Telecommunications 21,930 - 21,930 Telecommunications Depreciation of capital assets
57,919
-
57,919 Depreciation of property, plant
and equipment Other expenses 78,525 - 78,525 Other expenses Allocation to deferred exploration work
(808,446)
-
(808,446)
Allocation to exploration and evaluation assets
1,666,615 180,268 1,846,883 OTHER ITEMS OTHER ITEMS Gain on disposal of interest in certain licences
5,386,457
-
5,386,457
Gain on disposal of interest in certain licences
5,386,457 - 5,386,457 EARNINGS BEFORE INCOME TAXES 3,823,124 (180,268) 3,642,856 NET INCOME BEFORE INCOME TAXES Future income taxes (1,219,204) - (1,219,204) Deferred tax expense NET INCOME AND COMPREHENSIVE INCOME
2,603,920 (180,268) 2,423,652 NET INCOME AND COMPREHENSIVE INCOME FOR THE PERIOD
BASIC EARNINGS PER SHARE 0.052 0.048 BASIC EARNINGS PER SHARE
DILUTED EARNINGS PER SHARE 0.046 0.043 DILUTED EARNINGS PER SHARE

Pétrolia Quebec’s Leader in Petroleum Exploration INTERIM REPORT – THIRD QUARTER 2012 29
Notes to the financial statements (unaudited) For the nine months ended June 30, 2012 B) Statement of cash flows Under Canadian GAAP, interest paid and received was presented in the notes. Under IFRS, interest is classified under investing and financing activities. There are no other material adjustments to the statements of cash flows. The components of cash and cash equivalents under previous Canadian GAAP are similar to those presented under IFRS. C) Notes to the reconciliations The following notes explain the principal differences between previous Canadian GAAP and the IFRS accounting policies applied by the Company. a) Exploration and evaluation assets The items “Oil and gas properties” and "Deferred exploration costs” have been grouped for presentation purposes under “Exploration and evaluation assets.” b) Accounting for flow-through shares Under previous Canadian GAAP, the entire proceeds received on the issuance of flow-through shares were credited to share capital. When the tax deductions associated with exploration expenditures were renounced for income tax purposes, a deferred tax liability was recognized for the taxable temporary difference that arose, and the related charges were treated as share issuance costs. Under IFRS, the issuance of flow-through shares is accounted for similarly to the issuance of a compound financial instrument. The liability component represents the obligation to revert the tax benefit to the investors. Proceeds from the issuance of shares by flow-through private placements are allocated between shares issued and a liability using the residual method. Proceeds are first allocated to shares according to the quoted price of existing shares at the time of issuance and any residual in the proceeds is allocated to the liability. The liability component is reversed in income as recovery of deferred income taxes when the eligible expenses are incurred. As there is no exemption under IFRS 1 for first-time adopters regarding flow-through shares, the treatment under IFRS needs to be applied retroactively. Effect: Eligible expenses having been incurred, a liability of $637,500 was transferred from share capital to retained earnings on October 1, 2010. In addition, the deferred tax liability, at $2,793,592, was also transferred from share capital to retained earnings. c) Share-based payments Under previous Canadian GAAP, the fair value of share-based awards with graded vesting was calculated using the straight-line method over the length of service required for vesting. Forfeitures of stock options were recognized as they occurred. Under IFRS 2, each tranche of a share-based award with different vesting dates is considered a separate grant for the fair value calculation. Each award is recognized according to the foregoing. In addition, the Company is required to estimate the number of forfeitures, which is reviewed if subsequent information indicates that the actual number of share-based payments is probably different from the estimated number. The Company decided not to retroactively apply IFRS 2—“Share-based Payment”—to stock options granted before November 7, 2002, or to options granted after November 7, 2002, whose rights became acquired before the transition date.

Pétrolia Quebec’s Leader in Petroleum Exploration INTERIM REPORT – THIRD QUARTER 2012 30
Effect: There was no effect at October 1, 2010. On June 30, 2011, an increase of $183,875 in share-based compensation was recorded in income for the period. d) Presentation differences Certain presentation differences between the accounting practices in effect before the changeover and IFRS have no effect on the income presented or on equity, specifically regarding contributed surplus – expired stock options. As the following tables show, some items are described differently in IFRS (renamed) compared to the previous GAAP terms. These presentation differences have no effect on the comprehensive income presented or on shareholders’ equity. e) Change in rates used to calculate deferred income taxes Under previous Canadian GAAP, an entity had to show in income the changes previously brought to tax rates and tax laws for amounts previously recognized in other items of comprehensive income or equity. IFRS requires that certain items be directly recognized in equity, notably a change in the tax rate or other tax rule that affects a deferred tax asset or liability related to an item that was previously recognized in equity. Effect: On October 1, 2010, the amount of $28,315 was transferred from retained earnings to share capital.

Pétrolia Quebec’s Leader in Petroleum Exploration INTERIM REPORT – THIRD QUARTER 2012 31
Schedules to the financial statements (unaudited) For the nine months ended June 30, 2012 SCHEDULES
2012 2011 2012 2011 $ $ $ $ (three months) (three months) (nine months) (nine months)
A – ADMINISTRATIVE EXPENSES
Share-based compensation - 337,500 506,709 453,893 Salaries and benefits 419,034 223,129 828,049 577,199 Insurance 16,461 14,822 45,270 40,234 Maintenance and office supplies 30,657 10,558 82,741 32,392 Board of Directors fees 43,583 48,840 131,029 108,034 Information for shareholders 9,753 8,694 76,151 69,852 Office rent 29,788 19,777 94,960 52,157 Promotion and entertainment 58,247 16,582 225,459 69,863 Transportation 49,683 34,789 137,777 104,420 Professional fees 196,214 40,340 510,195 146,147 Capital tax - - (12,663) - Telecommunications 3,166 3,202 9,669 14,640 Depreciation of property, plant and equipment 29,535 16,161 87,399 36,203 Other expenses 607 9,584 3,225 17,066
886,728 784,356 2,725,970 1,722,100
B – OPERATING EXPENSES
Share-based compensation - 7,125 132,983 41,325 Salaries and benefits 283,429 209,990 800,033 676,057 Insurance 997 747 10,606 2,241 Maintenance and office supplies 9,150 4,739 28,469 21,624 Transportation 4,781 9,027 22,020 32,592 Training 5,522 1,300 8,269 6,713 Office rent 39,384 12,222 110,934 38,484 Professional fees - 9,144 3,469 9,144 Telecommunications 2,163 2,200 6,973 7,290 Depreciation of property, plant and equipment 34,383 10,973 102,216 21,716 Other expenses 1,907 848 5,656 3,260 Allocation to deferred exploration work (297,238) (279,867) (1,071,438) (805,005)
Under (over) charge 84,478 (11,552) 160,190 55,441
C – FINANCE INCOME AND EXPENSES
Interest income (Note 17) (46,848) (33,665) (145,622) (85,574) Bank fees 1,429 843 4,361 2,758 Interest on debt - 21,841 8,315 66,584
(45,419) (10,981) (132,946) (16,232)


