
THE EFFECTS OF POPULA TION GROWTH ON SOCIAL WELF ARE INLDC's AND TURKEY
Soner ö{;ür
The objective of this paper is to investigete problems created by rapid
population growth. Theyare groupcd as urncmployment, urhanization
(rural-urban migration). income distribution. poverty, hunger and
malnutriıian, and envİronmetal degradation-main indicatars of social
welfare. Each problem İs first examincd İn relatian to LDCs İn general
and then İn the contcxt of Turkey İn sepeifk.
ı. INTRODUCTION
Sincc the turn of the 20th Centrul', as the doubling time for the world papulation
has become shorter the !vlalthusİan Theory of PopuIatian has been a rencwed concern to
politicians, and to all caocemed people. It has taken 1650 years to doulıle world population
from a mere 250 million İn A.D.l to 545 million in 1650. The doubling time sharply
declined from 200 years between 1650 and 1850 and 100 years between 1850 and 1950 to
only 40 years between 1950 and 1990. The estİmated annual increases İn world population
were 0.53. 0.65. 0.91, 2.09, 2.0, and 1.8 percents between the periods 1800-1850.
i 850- 1900- 1950, 1950-1965 i 965- 1980. 1989, rcspectively (Norton and Alwang. 1993:
58: Todaro, 1981: 159-61).
As Jang as the popularion of a ecuotry increases İn unifümıity wİıh İnvestmcnt and
empIoyment opportunities İts effeet on the economy and conseguenıIy on the welfare of
people is mare Jikely to be positive. Beginning wİth the Industrial Revolutian İn West the
death (mortality) rates considerably declined while the birth (fertility) rates ramaİned bigh
ıhus creating a population explosion, compared to the to the previous centuries, that
alamed T. Malıhus İn 1798. However, a high rates of capita1 accumulatİon and emİgration
opportunities for the Western European countrİes faciliıared arather sınaath absürptian of
growing numbers of peÖple over a relatively large span of time. By the end of the 19th
Century. the birth rates İn \Vest also decreased and the rate of population growth in most of
the developed countrİes (DC) now remaİns more or less at replacement levcL.
'"Ass. Prof.. Çukurova University. Facu!ty of Economics and Administrative Sciences. Adana. Turkey.
117

The fear of population exlosion İs now mainly centered wİthin the developing
countrİcs (LDC). As most of the se countrİes began to joİn the development momentum
only during the last half of the 20th century, the death rates have drastİcal1y decreased -
thankstü modern medicine - while the birth rates have still stuck high thus pushing up the
rate of population growth to unprecedented levels. Expcriences indicate that it is much IDare
difficult to reduce birth rates than death rates.Thcrefore. the population of the world,
especially that of LDCs, wilI continue to increase for deades even if conccrted policies to
bring down fertility rates were implemented (Todaro, i 98 i: 169).
The world population has reached to 5.3 billion in 1990, more than doubling in 40
years from 2.5 billion in 1950. Between 1985 and 1990, every year ahout 88 million
people were added to the world population. Ninety percent of this increase (about 80
million) was accounted by LDCs (UN, 1992: 100).
For the period 1986-1990 the average annual rate of the world population was aroundı. 74 percent. However, the rates for DCs and LDCs wcrc 0.64 and 2.08 percents,
respectively. This enonnous difference has been contributing to a lopsided distribution of
world population. As a result, the share of LDCs in world population has been inereasing at
an alanning rate, from 66.8 percent in 1950 to 77. ı percentin 1990, and is expected to grow
to 84 percent in 2025 (UN, 1992: 100, 103).
The problem of population growth is not simply a problem of numbers. It is a
problem of human welfare and of development. Unrestrained population growth is seen as
the major crisis facing mankind tüday. It is claimed to be the principal cause of poveny,
unemployınent, malnutrition, ill health, abnonnal urbanİzatian, environmental degradation,
and a wide array of other social probleros.
In the next section, the major problems in LDCs created by rapid population growth
will be broadly examined. Then in the following sectİon, the demographical trends İn
Turkey will be outlined and İts ec:momic and social implications will be analyzed.
2, POPULATION GROWTH AND SOCIAL WELFARE
Populalion growth is desirable as long as a country has plenty of land or human
made capitaL. More people will be used to utiIİze tehese resourees; then it is more likely
that total and per capita output will increase (Cigolla, 1965: i 15). Also, larger population
can have posith'e effect of providing market for domestkally produced goods. On the other
hand. populalion growth wiIl have negatiye effect if there is aıready a dense populatian in
118

limited area and Httle capital. In such case, as a result of diminishing marginal returns for
labor, savings necessary for capital accumulation wi11 drl' up; unemployment will spread;
income distribution will worsen; government revenues will not be suficient to provide
people with social services; and finalll' social welfare viII diminish.
Some of the problem s creatcd by the rapid population growth in LDCs are:
unemploymenL urbanİzation. income distribution, poverty, hunger and malnutritİon. and
environmental degradation. Although all six major problems or issues are intertwined. the
each wİll be separately described from a global perspective.
2.1. Unemployment
The economic development of Western Emope and North Amerİca has often been
descrİbed in terms of continuous transfer of economİe activitl' and people from rural to
urban areas both within and between countries which spread over two centuries (Ruttan,
J982: 38. 39). On ıhe other hand. ıoday many LDCs are plagued by massive rural lo urbanpopulation movements prompted by development strategies and high population growth in
much shortcr time.
The development strategies of the 1950's and] 960's emphasized the development of
industrial sectar to serve the domestİc market and to facİIİtate the absorption of surplus rural
laborers in the urban econnomy. Then, a LDC could proceed most rapidIy toward theaehievemenı of self suffıeiecy (Lewis. 1965: 233-5).
An inevitablc outcome of those strategies has been rapid growth of urban centresresulting from an accelerated influx of ruraI unskilled workers in search of scare urban jobs.
Unfortunately, prcdictions regarding the abilitl' of the industrial sector to absorb these
migrants have not been realized. This has been the most obvious faHure of the development
process over the past tour decades.
it İs now rcalized that too much emphasis can not be placed on the expansion of the
modern İndustrİaI sectür to solve unemployment problem as long as the rates of populatİongrowth in most LDCs remains in the range of 2.5 - 3.5 percent per annum. For example, if
the industrial sector employs 20 percent of a country's labür force it will oeed to increase
employment by 15 percent - that is a rate hardil' achieved by any developing country - justto absorb the İncrease İn a total work force growing 3 percent a year (Todaro, 1981: 209).Any rate of employment growth in industriaI sectür les than 15 percent will me an more
unemployment and underempIoyment, İncreased share of population in agriculturaJ and
service sectors. Therefore. high population growth İs inimical to the economic
transfonnation of a LDe.
119
furthermore, the western technology that is imported by LDCs for the industrial
sector has become more capital -İntensive nature to suit \Vesfs labor - scarce economies.
The indiscriminate transfer of technology from \Vest has obviously lessened Iabor
absorption capacity of the industry in LDCs. If the industrial sector is to contribute to
employment creation the imported western technology must be tailored to the conditions of.
labor-abundant LDC's (Xenses, 199 i: 123, 130).
2.2 Urbanİzation (Rural-Vrban Migration)
One of the most significant of all postwar demographic phenomena and the one that
promises to be more catastrophic is the rapid gro\vth of cities in LDCs. In 1950, 275
million people were Iiving in the cities of LDCs (38 percent of total world urban
population), tbe numbers increased to 651 million in 1970 (48 percent) and it İs estimated
to reach 2.12 billion in 2000 (66 percent) (Todaro, 1981: 228).
One of the major consequences of the rapid urbanization process has been the swolle
supply of urban Iaborforce that far exceeds the demand thus creating extremely high rates of
unemployment and undercmployment İn urban areas.
In the 1950's ruraI-urban migration was vieved fayorably İn eeonornic development
literature. It was thought to be a natural process in which zero or low produetivity surplus
labor was gradua1Jy withdrawn from the rural sector to providc needed manded manpower for
high productivity modern İndustrial sector (Lewis-fei-Ranis Model).
In contrast to the viewpoint above, it is now clear from the four-decade experİences
of LDCs that the rates of rurual-urban migration. that naturally fuelled by the high rate of
population growth, continue to exceed the rates of urban job creatino. Therefore, no longer
migration is vicwed by development econoists as a beneficial process tosolve problems of
growing urban labor demand. Dather, migration is see n as the major contributing factor to
growing cconomic and structura! imbalances between urban and rura! areas, to mounting
needs for investment in urban infrastructure, and to ever \vorsening socioeeonomic problems
in cİties.
The Lewis-fei-Ranis Model of the surplus labor for İndustrial development was
ehallenged by M.P. Todaro. indicating that investmellt in urban industrİal sector would
ereate jobs much ]ess than the numbers seeking jobs. Because, as long as the income
differentials between rural and urban areas are in favor of the urban, and the probability (or
chance) of eaming higher İncome in urban areas is gerater, the number of people migrating
to eities will be greater than the number ofjobs created .
120

Since 1970's, development economists have been proposing policies to sIm\' down
the rural-urban migratian trend and, therefore, to solve worsening uran unemployment
problem. These policies are grouped İn fİve key elements by Todaro (Todaro, 1981:
241-46):
a) The irnlıalances in rural-urban empIoyment opportunİties must be reduced. The
creation of more urban job without simu1taneous atternpt to improve rural incomes and
employmentleads to growing urban unemployment and rural-urban migration. Therefore,
urban job creation is an insufficient salution for the urban unemployment probJem.
b) The factor-price distortions must be eliminated. The industriaIİzation palicies of
past decades have introduced varİous capital subsidies, on the other hand, actual urban wages
generally have exceeded the market wage as a result of a variety of institutional factOfs. The
reversİng of these distortions can encaurage IDare labor-intensive modes of production.
c) Appropriate labor-intensive technologies must be chosen to encourage the
expansion of smaIl-scale industries. One of the principal factors inhihiting the success of
employment creatinon programs İs the technological dependence of LDCs on imported
machinery and cquipment from DCs. There is an urgent need to develop and/or to adapt
technologies suitable to the conditİons of labor~abundant LDCs.
d) The direct linkage between educatİon and employment must be modified. The
emergence of the "cducated unemployed" in many LDCs is calling into question the
appropriateness of massive quantİtative expansion of educational systems espencial1y at the
higher levels. Government overinvestment in postprimary educational facilities often turns
out to be an İnvestment in idle human resaurces. By creating attractive economic
opportunities İn rural areas and in small-scale labor-intensive industrİes it ma)' be com e
easİer to redirect educational system towards their needs.
c) Programs of integrated rural development should be implemented. Development
economists agree on the central impartance of agricultural development İf the urban
unemployment and rural-urban migration problems is to be solved. They propose the
restoratian of a proper balance between rural and urban incomes through the reorİentation of
economic activity and social investents toward the rural areas.
2.3. Income Distribution
In most LDCs where laborlland and laborlcapital ratios are high, there is an in\'erse
relatianship betwecn population growth and income distribution. As mentioned earljer, if
the industrial sectOf employs around 20 pecent of the wor force and the rate of populaton
121

growth is in the range of 2.5-3.0 percent it is most likely that the rate af growth in the
industry will not be sufficient to absarb the increasing number of people. The absalute
number af people in agriculture wİlJ ihcneabe causing land fragınentation and reducedincomes. The people who migrate to urban centers are most likely to be unemployed orunderemployedin infonnal service seetors where incomes are also low.
The high rates of population grawth in LDCs will aggravate the exİsting imbalanees
in income distribution. Universally, people with law incames and law edueationaIlevel
have higher fertility rates than athers. Therefore, as the number af people in law income
groups increases the income disstribution worsens. In some countries, high fenility rates
and poven)' together from a vicious circle that thereatens the welfare -Of even survival.- of
the population, especial1y children. Through malnutritian and disease, poverty leads to more
infant and child deaths, which in turn induce couples to have more children to guarentee the
survİva! of same (W.B., 1991: 58).
Undoubtedly, policies ta create jobs, to increase incomes, and to provide universal
edueatİon will have a positive effect on reducing the fate af population growth in the lang
run. However, these policies must be accompanied by family planning programs. In fact,
İncome growth is neither necessary nor sufficient to contro] populatİon. The
implementation of these programs has contributed to the decline of fertility in low- incoı,ne
countrİes such as Indonesia and Srİ Lanka (W.B. 1991: 60).
2.4. Poverty
Poverty is the dİrect consequence of the high populalion growth in most LDC's, and
can be described as the failure to achieve certaİn minimum standards of living for samesegment of population in a country. Poverty has many facets; hunger and malnutrition,poor health, high infant mortality, law life expectancy. illiteraey, urban blight, poorhousing, enciranmentaldegradation,and so on.
WhiIe poverty is found in every country, develaping of developed, the extent and
magnitude of "absolute poverty" is IDore profound in LDCs. More than i billion people in
LDCs live in poverty. This number could be reduced by a strategy of both labor-intensivc
economic growth and efficient social spending. Economic growth İs necessary to reduce
poverty, but experience show s that it is İnsufficienL Social expenditure on health eare and
schooling exhand opportunities for the paor, but again may not be enough (W.B., 1991:
64).
122

Measures to eliminate pove.rty, to create jobs, to improve income distribution will
not be succcssful unless theyare accompanied by persistent family planning programs.
2.5. Huııger and Alalnııtritioıı
Hunger and maInutrition are the most obvİous forms of poverty as being the primary
cause of poor health, high İnfant mortality, and low life expectancy.
Food supplies, that \vould increase arithrnetically in contrast with population that
would increase geometrically. were the essential ingredients of T. Malthus's theory of
population. According to his theory, insufficient suppll' of food would be the ultimate
check on population growth.
As we near the end of the second centruy since this prediction was made. it is
generally concluded that Malthus has been proven wrong. First, Malthus did not foresee the
advances in food production that have enaIed the food suppll' to grow faster than
arithrnetically, Second, world population has not grown geometrically due to increases in
per capita real income, improved health and nutrition. and spread of universal education
(Knutson, Penn and Boehm, 1983: 92).
However, as mentioned carlier, as the doubling time fOf population growth has
become shorter sincc 1950's the alarm be lls rang in both academie and political fronts,
concerning the ability of the \Vorld Planet to sustain such a large population (Meadows et
al.. 1972). Then. the concerted efforts of the U.N. and various governments on controlling
population growth produced posiıive results (U.N. World Population Conference, first hel d
İn 1974, Bueharest, Romania; second in 1984, Mexico Ci til'; and reeently held in
September 1994, Cairo, Egypt); the rate of world population growth started to deereasc
from an all-time high 2.09 percent Beıween 1950-1964 lo 1.7 percent in 1990.
For over thirty years, the global food production has been sufficient to feed all the
people İn the world. if the world's food supply were evenly divided among the world's
population. each person would receiye substantially more than the minimum aınounts of
nutrients for survİval. However, \Vorld Bank estimates that malnutrition affeets mare than 1
billion people who liye in poyerty in LDCs (W.B., 1991: 61). Hunger is both an indiyidual
problem related to the distribution of income and food within eountries and national and
regional problem related tO the geographic distribution of food, income, and population.
Whiie hunger and povertl' are found in every region of the world, Sub-Sharan Africa is the
only region where per capitka food produetion has experienced a downward trend for the past
20 years. Low agrieultural productivity, wide varİations İn yields due to natural, economİe,
123

and political causes, and rapid population growth have combined to create a very precarious
food situationİn these countrİes (Norton and Alwang, ı 993: 4,5).
2.6. Ellvironmental Degradation
As population grows in LDCs, where laborlland ratio is high, environmental
problems become more severe. Deforestation, fanning of marginallands, overgrazİng, and
misuse of pesticides have contributed to soil erosion, desertificatİon, poisoning of water
supplies, and even c1imatic changes. These problems are partieularly severe İn parts of
Africa but exist in every region of the world (Norton and Alwang, 1993: 12).
The pressure of population can raise agrieultura! demand, leading in tum to the abuse
of marginal land and other natural resources. The annual rate of deforestation in Nepal
caused land crosion and floods in India and BangIadesh. Although many part s of
Sub-Saharan Africa sti\1 have large areas of potentially cultivable lands and relatively low
population densities, a rapidly expanding population moving into the ırapical forests
aıready poscs eneironmental problems. Cote d'lvoire is said to have an annual deforestation
rate of 0- i 6 percent; its forests could disappear in in less than twenty years (W.B. i 99 i:
59).
The envİronmental problems caused by high population growth are not limİted to
rural areas. urban areas also get their shares. People mavİng to urban areas in search of a
Iİvelihood crowd citics in exeess of İnfrastructural and social serviees provided by loeal and
central governments. As a result, inappropriate garbageand scwcr disposal, poor city and
traffie planning, İnsufficient provİsions of housing health, and edueationaI serviees are all
indieatüfs of social and environmental degradation. In fact, cities in most LDCs give the
mirror images of povcrty, poor income distribution, and unemplayment caused by high
populatian growth.
3. THE DEMOGRAPHY OF TURKEY
3.1. In/roduction
Turkey is the 17th most populous country in the world. The rate of population
growth (2.13 percent betwcen 1986 and ]990) is higher than the world average (1.74
percent). and the highest in Europe (U.N., 1992: 104-6. 114).
After the proclamation of the Turkish Republic in i 923, population censuses have
been carried out regularly; the first İn ]927 and the second in 1935. Since then 13 censuses
124

Years 1927 1935 1940 1945 1950 1955 1960
Population 13,6 16,2 17,8 18.8 20,9 24,1 27,8(Million)
Annua! yncrease 2,11 1,96 1.06 2,17 2,78 2,85
Years 1965 1970 1975 1980 1985 1990
Population 3 1.4 35,6 40,3 44,7 50,7 56,5(Million)
Annual yncreasc 2,46 2,52 2,5 2,07 2.49 2.17(pereenl)
have been eondueted cvery [ive years. Af ter the 1990 Population Census, a government
deeree wİth the foree of law stipulates that "General PopulatİonCensuses wiIl heneeforth be
held in years ending with "O" (meaning that every iO years) (SIS, 1990: III),
Tablc ı below shows the populatian of Turkeyand the rates of annual increases by
eensus years. The population of Turkey more than doubled in 33 years from 13.6 million in
1927 to 27.8 million in 1960. As the rate of population growth speeded up after 1950's, the
time for doublingdeereasedto 29 years; the populationincreasedfrom 27.8 miliionin 1960to 56.5 million by the 1990 Population Census (SIS, 1993: 51-2). As nored earlier, the
world popularion doubled only in 40 years between 1950 and 1990.
TABLE I
Popularion of Turkey and Annua! Increases By Census Years
TABLE 1
Population of Turkey and Annual Increases By Census Years cont.
Souree: SIS (State Instirute of Statistics), Statistical Yearbook of Turkey, 1993: 52.
AIthough the rates of population growth in Turkey sİnee 1927 has been higher than
the world averagcs İtsgrowth trend has becn foIlowing that of the world (see Page 1). The
both trends peaked highest in the period 1960.70, then have been gradually declining since.
UN estimates indicate thar the population of Turkey will reach to 68.2 and 88. i million in
1 , --~

Indicators Ranking
The overall HDl 23rd
Access to safe water 19th
Daily ealorie supply 19th
Child malnutritİon 23rd
Real GDP per Capita (1991) 25th
GNP per eapita (1991) 27th
Adult literaey 28th
Life expeetaney 31st
Infantmorta1ity 38th
"OMean years of schooling 43rd
Souree: UNDP, 1994: 45.
126
years 2000 and 2020, respeetively. The rate of population growth will dedine to 1.89 and
1.11 percent in respeetive years (UN, 1993: 106, 115). By the period 2015-20, Turkey's
population will stabilize when the fertilityrate dec1inesto 2.1 children per woman that is
the replaeement rate for population (DPT, 1993: 6).
There are wide varİations İnfertility rates among the Regions of Turkey, especial1y
between East and West, and between rural and urban areas. According to the 1989 SPO
(State Planning Organization) Population Study, the fertility rates are 2.64 and 5.65
children in West and East, respeetive!. THe rates are found as 3,48, 3,07. and 2.02 children
for Black Sea, Central, and Mediterranean Regions, respectively. The total rale for Turkey İs
3.9 children. In urban areas, as expected, there is a tendeney for the fertility fate to deerease.
However, the fast migration from East and rural areas to the urban centers İsmaking this
thendeney rather slow (DPT, 1993: 7).
The 1994 UNDP Human Development Report presents an intefesting ranking of the
human development indieators (HDl) for 97 LDCs whieh are the outeomes of the level of
development, and are obviously the certaİn indications of population problem.
Table 2 below shows Turkey's rankİng among 97 LDC's with respect to chosen
İndicators of human development.
T ABLE 2
Ranking of Human Development Indieators (HDl) of Turkey (1992)
Notes
3,080 per day
PPP $ 4,840US $ 4,84081,9 percent66,7 years
61 per 100 live birıh3,6 years
Almost al1 of the socİoeconomic problem s in LDCs created by rapid population
growth can be İn cenaİn degress traced in Turkey: unemployment, rapİd urbanization
stemming from rural-urban migratİon, unegual İncome distribution, poverty, hunger and
malnutritİon, and cnvİromental degradation.
Although the se issues are İnterwined or overlapped wİth each other cach will be
separately dea]t.
3.2. Ullemployment
In the early years of the Turkish Republic cı 923-39) and espcciaJ\y during the period
of p!anned industrialization (1930-39), the industria! sector that grew 8,5 perccnt betwccn
!924-29 and i 1.6 percent hetween 1930-39 had difficulties in finding sufficient supply of
workforce, not to mention the most needed skilIed labor. As the composition of the
populatİon was mainly rural (remained 75 percent until 1945) the demand for industrial
labor had to be met by the İncrease in urban papulation. The dynamics of urban sectors
were not in fürce to İnduce mİgratİon from rural areas (Kepenek and Yentürk, 1994: 73).
Alsa, the rate of populatİon growth in that perİod was stilI rather low.
In the period 1946-60, the winds of change blew in jTurkey affecting both politica!
and economİca! aspects of the country. The Democratİc Party Winning elections İn a
multİ-party system carried out populist policies together wİth a sİneere dive to mod~rnize
the country that maİnJy emphasİzed on the development of urban sectar.
Urbanİzation was the most sİgnificant phenomenon İn that period speeded by
İntorductİon of tractors in farming that released rural labor. by integration of rural see to
wİth national markets, and fİnalIy by the rate of population growth gaİnİng momentum.
The government, unaware of the problems the country would face İn not-so-dİstant
future, had no serious polİcİes to deal wİth rapİd urbanİzatİon, migration, and populaLİon
issues. Consequently the cİties soon becarne unable to aecommadate growing number of
peaplep; shortage of housİng led to hİgh rents and speculation in land, and especİaIly to the
creation of shamy-towns (gecekondu) surrounding the major cities of Turkey (Kepenek and
Yentürk, 1994: 113-4).
The İnitial neglect of urbanization, migration, and population issues İn 1950's must
be the primary cause of the current problems plaguing the Turkİsh citİes.
Unemployment İn Turkey began to be a rnajor issue sinee 1950's as the country
entered a perİod of sodoeeonomİe transformation. However. the the gowernment of 1950's
and the development plans sİnee ı 963 assumed that if a target rate of economic growth was
127
achieved it would suffice to create jobs for the growing labor [orce; the development
paradigm of same nature was wİdely acceptcd by other LDCs and DCs İn the same period.
EvidentIy, after the second half of 1960'5 the emigration of the Turkish labor [orce in large
numbers to european countries alleviated the burden of potentiaHy high unempIoylenL
The passive approach to unempJoyment problem in Turkey contİnued even after the
lanuary 24th 1980 Economic Stabilization Program. As in most aspects. the Program
relied on instituting a liberal economic encironment for the labor market. it predicted that if
the labor suppJy exceeded the demand the wage rate would go down thus stirnulatİng
labor-intensİve economie activities, and eventuaHy the labor rnarked would clear (Kepenk
and Yentürk. 1994: 186-8). In ordcr to fadlitate functioning of a free labor market. with a
clear airn at substantially reducing wages, the governmenı, with the military backing,
irnposed certain restrietions on labor unions, strikes. and wage negotiations (Boratav, 1993:
134). However, the program was Icss than satisfactory with respect to employment
creation. The wages yere kept under controJ but the rate of uncmployment continued to
increase as the public sectar became reluctant to hire new employess and the population
growıh \Vas sıill high (xenses, 1983: 283-4).
The neo-c1assieal approach to unemploymenı issue \vas unlikely to be successful
give the instİtutional rigidikies and rapidly changing mode of produetion. The modern
technology has become imperative to be used even in traditional lahor-intensive sectors
such as textiJes. There wouJd be some gain in adaptaing imported westem technology to the
country's conditions. but this would not much change capital-intensive mode of production.
Even İn DCs where population rowth is stable capital-intensİvc technology (e.g.
computefs, robots, ete.) have been rapİdly expanding at the expensc of labor (hus pushing
the rate of unemployment to unprecedented levels sİnce the Great Depressİon. Considerİng
this fact. Turkeyand most LDCs have and wilI continue to have enormous difficulties in
solving unemployment problem s as Jong as theİr rates of population growth remaİn in the
range of 2.0-3.5 percent a years.
In Turkey, there were two sources of data conceming employment situation until
1988: Sıate Employment Ageney (SEA) and State Planning Organization (SPO).
Unfortunately, the data from SEA were incomplete since the Ageney reported only those
who contacted with it İn search of a job. On the other hand, SPO used to tryto give a much
global estimates of employment sİtuationin the eountry through population censuses.
However. SPO's methodology used in its estimation kept changing. For examplc. SPO in
the fifth development plan (ı 985-89) assumed thaı labor foree partieipation raıc \Vould
128

Lahor foreo slalus of non-insıiıuıional civilian populaıion. Turkey (1989-1992)
1989 1990 1991 1992
TOlal population (million) 54.292 55.523 56.776 58.090
Papulatian over 12 year 37.699 38.586 39.484 40.439(million)
Lahor foree (million) 20.677 2l.i46 20.730 21.1 84
Lahor foree parlieipation (%) 54.8 54.8 52.5 52.4
Overall unemploymcnı (%) 8.8 7.4 8.3 7.8
Urban unemployment (%) 13.2 10.9 12.1 11.7
Rural unempolyenl (%) 5.6 4.8 5.4 4.7
Source: SIS. 1993: 238.
deerease lO 56.9 percenl in 1989 from 65.5 pereenl İn 1979. This would ohviously result in
lower unemploymcnt fate as the suppIy of labor decreased. Therefore, the data concerning
unemplayment situatİon are incompletc, umeliabIe, and sümetimes distorted by
governmenıs (Kepcnek and Yenıürk. 1994: 375-7).
Thereforc. there was a oecd for cantinuing labor füree survey to be carrİcdout by SIS
as a regular[eatureof the national sıasİtical program. Accordingly. İnthe context of theproject on Lahor Markeı Infonnaıion Syslems ccordinaıed hy UNDP. in 1988 SiS launched
a laar füree survey to be conduetedsemiannual1y.The survey was dcsigned ıısİng the latest
inıernational (ILA) standards (SIS. 1993: 233).
TABLE 3
Nate: The t1gurcs İnTabJe confrom with SIS survey data taken İnüctüber of each year.
Tahle 3 indieaıes ıhaı alıhough overall unemploymenı rales ıhrough 1989-92 sccm
somewhaı similar lo. and even lower ıhan in many DCs (SIS. 1993: 691). the rale of urhan
unemployment is more than double the rate of ruaral unemployrnent. This c1early indicates
the inability of urban scc(Qrs (manufacture, trade, and services) to create jobs. However, due
to special characteristics of the agricultural sector, the lower rate of rural unemployment
does not retleet the extent of disguised and seasona] uncmployment issues.
129
Years 1927 1935 1940 1945 1950 1955 1960
Urban (%) 24.22 23.53 24.39 24.94 25.04 28.79 31.92
Rural (%) 75.78 76.47 75.61 75.06 74.96 71.21 68.08
Years 1965 1970 1975 1980 1985 1990
Urban (%) 34.42 38.45 41.81 43.91 53.03 59.01
Rural ('10) 65.58 61.55 58.19 56.09 46.97 40.99
A final word on the employment characteristics of Turkey, the labor force
participation is rather low due to a very large number of people who are eounted as "not İn
Jabor force" that incIude discouraged workers, housewives, seasonal workers, students,
retired,disabled.and propertyincomeeamers. A large numberof these people would mostlikely be willing to work if employment opportunities were available. In 1992 tehere were
19 million people in this eategory eompared to 21 million peopk in labor force. it is,
therefore, obvious that unemployment is the most serious problem s Turkey has to solve.
3.3 Urbanization (Rura/-Urban Migration)
As economic development proeeeds in a LDC it is expeeted that socioeconoroİctransformation wİIItake plaee; the share of urban population will İncrease at the expense of
the rura!; the relative contribution to GNP will deerease in agrieultural seetür but will
İnerease İn industrial and service seetors. As mentioned earlier, this socİoeconomİc
transformation that had spread over two centuries in DCs has becn oeeurring in LDCs in
less than half a century.
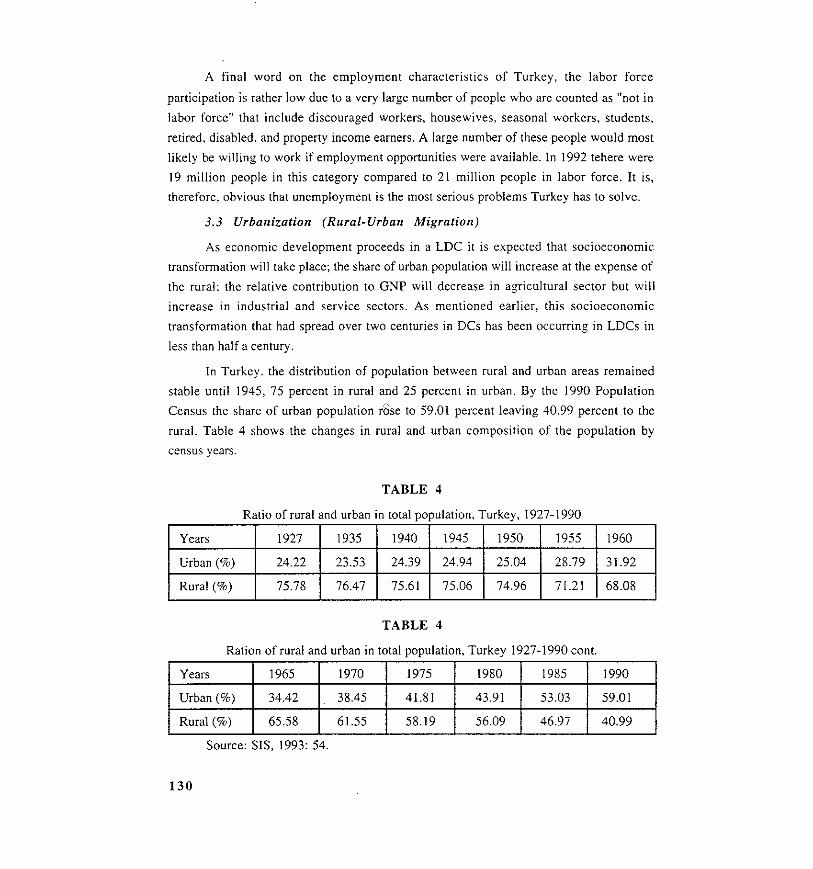
In Turkey. the distribution of population between rural and urban areas remaİned
stable until 1945,75 percent in rural and 25 percent in urban. By the 1990 Population
Census the share of urban population rose to 59.01 percent kaving 40.99 percent to the
rural. Table 4 shows the changes İnrural and urban composition of the populatİonbyeensus years.
TABLE 4
Ratio of rural and urban in total population. Turkey, 1927-1990
T ABLE 4
Ration of rural and urban İn total population, Turkey 1927-1990 eont.
Souree: SiS, 1993: 54.
130
Agriculture Industry Services Total
1962 no 7.9 15.1 100.0
1967 72.2 9.2 18.6 100.0
1972 66.9 10.7 22.4 100.0
1977 61.8 12.6 25.6 100.0
1983 60.7 12.3 27.0 100.0
1988 50.6 15.2 34.2 100.0
1992 43.7 i 8. i 38.2 100.0
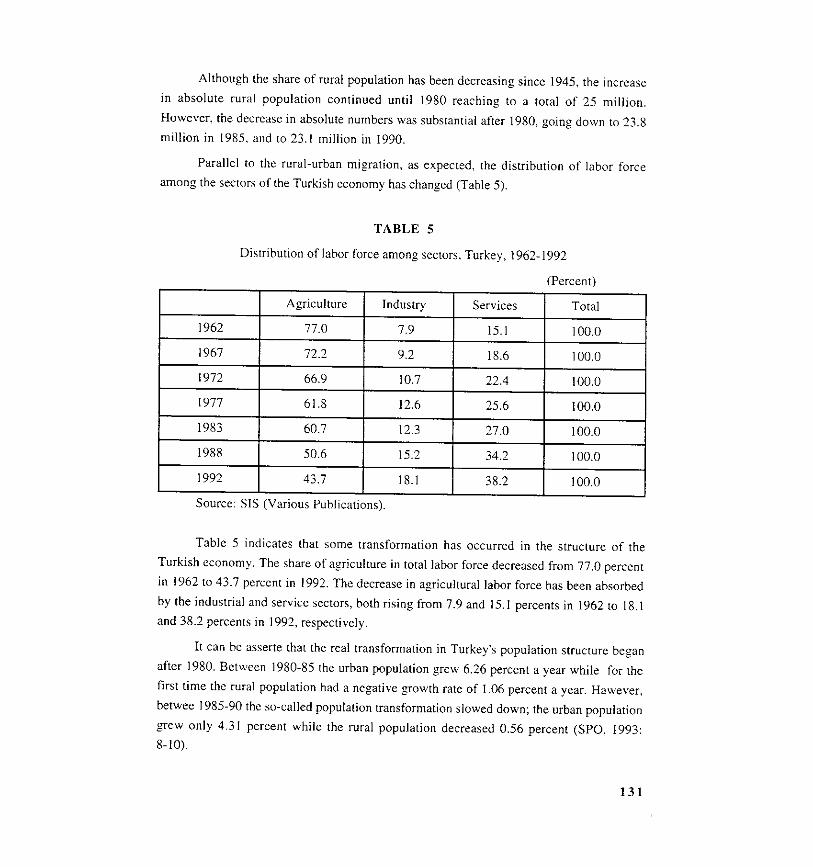
Although the share of ruraI population has been decreasing sİnce 1945, the incrcase
in absolute rural populatian contİnued until 1980 reaching to a total of 25 miııion.
However, the decrease in absolute nurnbers was substantial after 1980, going down to 23.8
million İn 1985. and to 23. i million in 1990.
Paralıcı to the rural-urban migratian, as expected. the distribution of labor force
among the sectors of the Turkish economy has changed (Table 5).
TABLE 5
Distribution of labor foree among sectors. Turkey, ı 962-1992
(Percent)
Sourcc: SIS (Various Puhlications).
Tabie 5 indicates that same transformation has oceurred in the structure of the
Turkish economy. The share of agriculture in total iabor foree deereased from 77.0 percent
in 1962 to 43.7 percent in 1992. The decrease in agriculturallabor foree has been absorbed
by the industrial and service seetors, both rising from 7.9 and 15.1 percents in 1962 [o 18.1
and 38.2 percents in 1992, respeetively.
It ean be asserte that the real transformation in Turkey's population stmeture began
af ter 1980. Between 1980-85 the urban population grew 6.26 percent a year while for the
first time the rural population had a negatiye growth rate of 1.06 percent a year. Hawever,
betwee 1985-90 the so-cal1ed populatian transformatian slowed down; the urban populatian
grew only 4.31 percent while the rural population decreased 0.56 percent (SPO, 1993:
8-10).
131

As for the number and sizes of the ruraI sett1emcnts and the cİties; between 1965-90
the rural settlements wİth population less than 2.000 inhabitans slightly decreased from
34.905 to 34.420 while their share in total population dropped from 66 percent to 30
percent. On the other hand, the cities with populatİon over 100.000 İnhabitants increased
from 14 in 1965 to 73 İn 1990, their share İn total population alsa rosc from 10 percent in
1965 to 37 percent in 1990 (SIS- 1993: 55).
So far. the rural-urban migration was simpIy meant as the movement of ruraI people
to urban areas; in fact there has been migration from the urban centers (small and large) İn
Jess developed regions to the urban centers İn more developed regions. Therefore, economİc
disparities in Turkeyare the real cause of mİgration (SPO, 1993: 8).
As compared to DCs'urban-rural population composition. Turkey's population İs
stilI rura1. As Jong as the socİoeconomic transfonnatİon continues (no doubt it wil1) and
the rate of populatİon growth remains high it is easy to predict that the cİtİes \\.i11continue
to grow 4-6 percent a year as in between 1980-90. this wilI in turn aggravate the problcms
aıready facing the 10cal and central goernments. and the eeonomy, in terms of urban
infrastructuraI İnvestments (housing, water suppI)', sewer system, city and inter-city
transportation, eommunication, health care, schools. and ete.) and İn terms of enormous
task of creatİng job opportunities for rapidly increaing urban labor forees.
3.4. Iııeome Distribution
The unegual income distribution has origins in diffewnces in labor productiviy
between ruraI and urban seetors in the beginning of a country's development process as
marginal produetivity of labor and hence income are lower in rural areas. In addition tO this,
the unegual distribution of bnd and other assets represents a second series of İncome
inequality among rural people. As the socioeeonomie transformation takes plaee, the
rural-urban migration tends to reduee income inequality as experİenced by DCs.
Howevcr, the unfortunate experienees of most LDCs İndicate that even a reasonable
socioeconomie transformatian achieved has not been sufficient to improve income
distribution. As diseussed earIİer. the capital aeeumulation in urban sectors has ereated Iess
jobs than the supply of tabor as rural-urban migration and high population growth
continued. Conseguently a second from of income incquality hetwecn the people who have
only wage and saJaries but no significant assets and the peoplc who are asset owners and
entreprencurs. Also, governments'fiscal and monetarypolicies, and seetoral subsidy
programs have directed income distribution in favor of or agaİnst certain gmups of people.
132

1963 1968 1973 1986 1987
ıst 20 % 4.5 3.0 3.5 3.9 5.24
2nd 20 % 8.5 7.0 8.0 8.4 9.61
3rd 20 % 11.5 10.0 12.5 12.6 14.06
4th 20 % 18.5 20.0 19.5 19.2 2l.l5
5ıh 20 % 57.0 60.0 56.0 55.9 49.94
Gini eoefficient 0.55 0.56 0.51 0.46 0.43
The degree of İncome inequality in a country is expressed by Ginİ coefficienıs.
Where income distribtion is dose to equality Gini coefficient approaches to zera as it is
0.201 for Japan and 0.212 for S. Korea. Conuntries with more unequal income distibution
have Gini coeffİcİents betwcen 0.40, 0.50, and even higher (Kazgan et aL., 1992: I).
\Vith respect to the information above, Turkey has severe income distribution
problem. her Gİni coefficİent has ranged between 0.56-0.43 in the period 1968-87 (Table 6).
In Turkey ıherc have been five major surveys to studythe extent of household İncome
distribution bctwcen 1963-87. The summary results of these surveys are shown in TabJe 6
by quİntiles.
TABLE 6
Household Income Distribution in Turkey By Quinıi1es
( 1963-87)
Source: Kazgan ct aL., 1992: 4; SIS, 1993: 290.
A simple glancc at Table 6 wiII reveal the enannous disparity in the distribution of
income in Turkey. WhiIe the richest 20 percent has been receiving over 50 percent of the
natİonal incomc, less than 50 percent is shared by 80 percent of the population. The
difference İn ineames of the lawest and the highest 20 percents has ranged over i0-15 times
in the period 1963-87.
There İs a problem of comparabilİty among the survey results preseMed İn Table 6.
Although the first-four surveys show somewhat similar İncome distr'İbution among the fıve
qujntiles, the J987 survey conducted by SIS as the fırst survey coverİng Turkey as a whole
133
"

produced results as if the first four quintiles improved income shares against the top 20
percent. This is contradietion considering the trend İn the sectoral distribution of national
income through 1978-87. Over this period the shares of agricultural and wage-saJary
ineames decreased from 26.7 and 35.2 percents to 19.1 and 18.1 percents, respectively. On
the other hand, the share of capital income increased from 38.1 percent to 62.8 percent over
the same period (Özmucur, 1992: 23). it is obvious that thc households with agricultural
and wage-salary ineames fall in the lower quintiles and therefore it is most unlikely for
them to have improved income shares.
3.5. Poverty
Poverty is the eonsequence of, first, the law Jevel of national income and of income
growth; second, the maldistribution of national income: and third, the high rate of
popuJation growth. Vnfortunately, Turkey satisfies all these conclitions. Although Turkey
is the 17th most populous country in the world, she is the 28th in the GNP and 53rd in pcr
capita GNP scales (W.B., 1991; 204; SPO, 1993: 16); her Gini cocfficient and rate of
population growth are higher than world averages.
The low level of Turkey's GNP represents itself. first, in overa11 welfare of the
people in terms of the country's ability to provide essential social serviees such as scholls,
hospitals, housing, justiee, social securiıy coverage, and etc. Second, the poverty of same
people is eminent due to maldistribution of aıready low GNP. Finally. the high population
growth İn Eastcm part of the country and in rural areas. and among law income groups
aggravate the extent of poverty.
The low level of GNP and the inabiliıy of effectiye taxation by governments have
eaused reductions in the already-insufficient Jevel of social spending in Turkey. Spending on
education decreased form 18. i percent of the total public expenditurc in 1972 to 15.7
percent in 1989; spending on health also decreased from 3.2 percent to 2.9 percent; spending
on housing and social securiıy renained 3.1 percent İn respective years (W.B., 199 ı: 225).
The extent of social secilrity coverage in a country is an important indication of
goyernment's ability of and determination to seeuring welfare of its people. In Turkey, the
percentage of non-agrieultuarl1aborforce coyered by social security schemens reached to 83
percent in 1983 from 42.9 percent in 1962; however iı decreased to 69.6 percent in 1992.
The percentage of people with healt security eoverage was only 58.3 percent İn 1992
(Kepcnek and Yenturk, 1994: 394). lt is obvious that ıhe peoplc who are not covered by
any social security scheme are unemployed, city yendors. old, and mainly smaIl farrnersand
134

landless rural people who are in the lower social and economic echelenos; poveny and
desperation must he prcealent among them.
3.6. Hunger and A1alnufritioll.
Although Turkey is one of the few eountrİes in the world that has aehievedself-suffieieney in food produetion, and the rate of growth in agrieultural output hasexeeeded that of population, malnutritionaxists among the poor, especialIy among childrenand women in pOOTfamilies.
Availability of food in a eountry, poor or rich. is not a guarantee for its effıeient or
equal distribution among people. The unequal distribution of national income and the extent
of unemployment are the real faetors behind hunger and malnutrition. However. there is no
outright hunger problem in Turkey as seen in some LDCs.
3.7. Ellvirollmelltal Degradation
As in most LDCs where population pressure on natural resourees is high, Turkey
has been having environmental problems at inereasing rate. As the rural populatian has
increased in absolute numbers until 1980, the numbur of farm households have alsa
increased from 2.5 millian in 1950 to 3.1 millian in 1980 (İTalim, 1981: 40-1). Hawever,
the 1991 Agricultural Census reported 4.09 millian farm househô1ds as of 1991. The direct
consequence of inereasing number of fam housholds has been the expansion of eultivated
land from 14.5 millian hectares in 1950 to 23.9 millian hectares in 1991 (SIS, 1993: 305).
A great deal of this inerease in eultivated land has been gained at the expense of pasture land
and forest areas whİeh had the [unerions of water and soİl proteetion. As a result of this,
Turkey has been faccd with alanning soİl erosion (It is estimated that Turkey loses top soil
equai to the area of Cyprus eaeh year), flooding, and sihation of dam reservoirs. The
pollution of water resources by indiseriminate use of herbicides and inseetieides is anather
serİous concem.
The extcnt of the environmental degradation in urban areas İs no less than İn
countryside. As diseussed earlier. the problems ereated by rapid urbanization sinee 1950's
have overpowered any efforts by loeal and central governments in terms of proper urban
planning and provision of most urgent social services. The eoncentration of industfial
plants in OTnear eities has been eausing extensive air, water. and noise pollution.
Probably the most fearful degradation for anation ereated by rapid population
grmowth is the social degradation. In addition to government's helplessness to provide
adequate edueation, housing, health, and social securÜy services for a fast growing
135

population, unemployment, unequal distribution of national income, and hence poverty
hinder the most desired improvements İn social welfare of a country.
4. CONCLUSION
The rapid population growth in LDCs and Turkey has been the major contributing
factor to low levels of living for people. The deveiopment model s of 1950's and 60's that
emphasized economic growth to raise income and social weJfare in LDC's have not been so
successful, and have even created new ~problemssuch as rapid urbanİzation, unemployment,
and income distribtion.
lt has been realized that populaton control in LDCs is the tey to improve social
welfare and to sol ve economic problems and rnust be carried out simultaneously with
econornk development efforts. Because, even a high rate of economic growth may worsen
income distribution and social welfare as long as population growth is high (Kazgan et aL.,
1992: 6).
Edueation has the highest priority in terms of slowing population growth and
stimu)ating eeonomie growth. Provision of universal education for all has been the major
factor in bringing down the rate of population growth in some LDCs. And the educated
people have higher productİvity and therefore can contribute more to economic growth.
Increased public spending on social services such as health, food aİd to pregnant
women and children, publİc servİces in rural areas will help to bring down the rate of
population growth, and İncrease productivity. This sort of public spending will alsa, to
same degree, reduce income inequality as the taxpayers are in the higher income brackets.
Above all, an integrated rural developmel)t program can bring together various
socioeconomİe programs to deal with the issues of population growth, rural-urban
migration, urban unemployment, and even income distribution.
REFERENCES
Boratav. K. (1993), Türkiye yktisat Tarihi 1908-1985. Gerçek Yayınevi.
Cipolla.C. M. (1965), The Economic History of World Population, Penguin Book>.
Kazgan, G. et ai. (1992), Türkiye'de Gelir Bölülümünü Bozan Etkenler ve yyiıeJtirilmesineylilkin Politikalar. Ankara: Sevinç Matbas!.
136
Kepenek, Y. and Yentürk, N. (1994), Türkiye Ekonomisi, ystanbul: Remzi Kiıabevi.
Knutson, RD.. Penn J. B., and Boehm, W.T. (1983), Agricultural and Food Policy, New
Jersey: Prentice-Hall. Ine.
Lewis, W.A. (1965), Theory of Economic Growth, London: George Allen and Unwin Ltd.
Meadows, DL et aL. (1972), The Limits to Growth, New York: Universe.
Norton. G.W. and Alwang, J. (1993), Introduetion to Economİcs of Agricultural
Development, McGraw-Hill, Ine.
Ruttan, V.W. (1982), "Models of Agrieultural Development", in Agricultural Development
in the Third World, ed.
Carl K. Eicher and John M. Staatz, The John Hopkins University Press.
Özmucur, S. (l992), "Pricing and Distribution in an Economy with an Impartant Public
Sectar", ystanbul: Booaz- içi Universitiy Research Paper.
SIS (State Institute of Statisties) (1990), Census of Population, Administrative Division,
Ankara.
(1993), Statistical Yearbook of Turkey, Ankara.
SPO (State Planning Organization) (1993), VII. Bel Yıllık Kalkınma Planı, Nüfus,
Nüfusun Yapısı ve Aile Planlaması Özel )ihtisasKomisyonu, Nüfus Yapısıve
Dcoifimi Alt Grubu Raporu. Ankara.
xenses, F. (1983), "An Assessnıent of Turkey's Liberalization Attempts since 1980 against
the Background of her Stabilization Program". METU Studies in Development,
LO (3), 271-321.
and Kırını. A. (1991), "Türkiye'de i 980 Sonrası Ekonomik Politikalar-Sanayiıe!me
Etkiıdirni ve Sanayiin Yeniden Yapılanma Gerek!eri", METU Studies İn
Development, 18 (1-2) 111-141.
Talim, M. (1981), "Türkiye'de Tarımın Yapısı ve Bu Yapının yyıe!tirilmesine ylilkin
Görüf1cr", 2. Türkiye yktisat Kongresi, TarımKomisyonu Teblioleri. yzmir.
Todaro, M.P. (1981), Economic Development in the Third World, New York: Longman.
UNDP (1994) Launehing of the 1994 UNDP Human Development Report, Ankara.
United Nations (1992), World Population Prospects: The 1992 Revision, New York.
World Bank (1991), World Development Report 1991, New York: Oxford University Press.
137


