
Click to edit
Master title
style
The Western Washington
Foodshed Study Sponsored by American Farmland Trust and
University of Washington Funded by PCC Farmland Trust and Whole Foods Markets

What is a Foodshed?
Foodshed
n. The region in which food is produced and
consumed and the pathways on which that food
travels from farm to table.

• Consumer preference
• Support local economy
• Global natural resource competition
• Decreased carbon emissions
• Aesthetic and cultural value
Why Local?
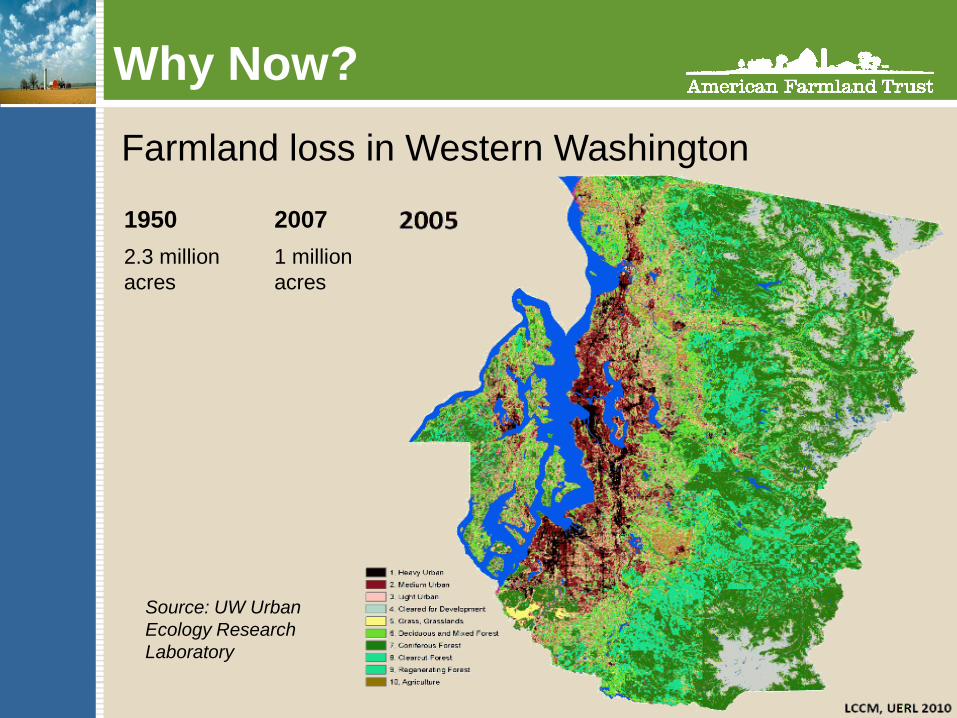
Farmland loss in Western Washington
Why Now?
1950 2007
2.3 million
acres
1 million
acres
Source: UW Urban
Ecology Research
Laboratory

How much food do we produce
and consume?
Purpose of the Study
How do we re-localize our
foodshed?

How Much Food?

Western Washington
Production
0.6% 3.4%
28.7%
61.5%
5.8%
0.0%
Total
Production:
3.7B lbs per
year

Western Washington
Consumption
12%
21%
18% 17%
20%
12%
Total
Consumption:
8.6B lbs per
year

Production Consumption
Our Current State
43%

Our Focus: Potential
What we know:
• Food supply chains are
immensely complicated
• Most of the 706 lbs. per person
produced in the region is exported
What this means:
The production: consumption ratio
shows the POTENTIAL for our
region to supply the food demanded
by our residents
Our project focuses primarily on
ways to increase the region’s
POTENTIAL to produce the amount
of food our residents demand

What is the Potential?
2.0%
7.0%
68.9%
155.7%
12.4%
0.1%
42.9%
0% 20% 40% 60% 80% 100% 120% 140% 160% 180%
Grains
Fruit
Vegetables
Dairy
Protein
Other
Overall
Is there potential to fulfill consumption with the current production of the region?
Consumption
Amount

What Do We Grow?
barley herbs canola trout
mollusks milk
rhubarb pumpkins potatoes
green peas beets
raspberries blackberries
cranberries
blueberries
cucumbers
sweet corn
snap beans
corn oats rye wheat apples apricots cantaloupe cherries grapes honeydew kiwifruit peaches
pears tomatoes strawberries plums and prunes watermelon asparagus carrots garlic leafy greens mushrooms onions squash
cattle chestnuts chickens dry edible beans eggs goats hazelnuts pork sheep turkeys walnuts honey
rice avocados bananas dates figs grapefruit lemon
lime mango olives oranges papaya pineapple tangerines
artichokes okra coconut peanuts cane sugar
broccoli brussel sprouts cauliflower celery escarole and endive eggplant lima beans
peppers radishes sweet potatoes dried peas and lentils beet sugar corn sweeteners In Balance
Grown in Surplus Grown in Deficit
Not Grown in W. WA
Feasib
le
No
t
Feasib
le
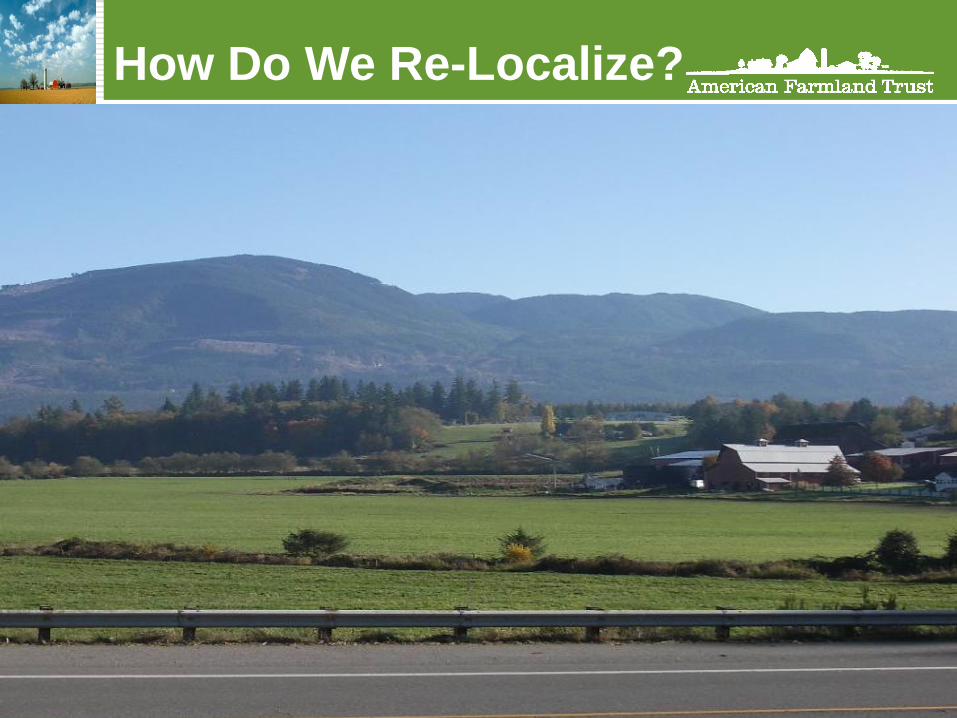
How Do We Re-Localize?

Options For
Re-Localization
Halt Farmland Loss
Bring More Land Into Production
Increase Crop Production
Localize the Supply Chain
Reduce Food Waste
Shift the Local Diet

Evaluating the Options
Balance of production/consumption ratio
Environmental Impact
Financial Feasibility
Sociopolitical Feasibility

Halt Farmland Loss
Impact on Mass Balance
Current Mass
Balance
10%
Implementation
25%
Implementation
50%
Implementation
43% 43% 43% 43%
Promote Strong Agricultural Zoning Codes
• 600,000 acres of farmland in agricultural
zoning out of the current 1 million acres
• To meet current consumption, would
require 1.5 million acres
• Considerations:
• Requires political coordination
• Potentially lowers land values

Impact on Mass Balance
Current Mass
Balance
10%
Implementation
25%
Implementation
50%
Implementation
43% 43% 43% 43%
• Open Space Taxation Act
allows for farmers to have their
lands valued according to
current use rather than at its
speculative value
• Considerations:
• Increases economic
viability of farming
• Structure already in place
for counties.
Enhance Tax Incentives
Halt Farmland Loss

Bring Historic Farmland Into Production
• 1950-2012: 1.3 million acres lost
• Considerations:
• Time and resources needed to
identify suitable lands
• Need government incentives to
make this strategy financially
feasible for landowners
• Competing land use interests
Impact on Mass Balance
Current Mass
Balance
10%
Implementation
25%
Implementation
50%
Implementation
43% - - -
Bring More Land
Into Production

Expand Production on Mixed Agricultural Land
• RTI identified an additional 1.3 million acres not identified by WSDA.
• 460,000 of intensive agriculture
• 620,000 of mixed agriculture
• 270,000 of other agriculture
• Potential for these additional lands to be farmed more intensely
• Considerations:
• Current land use
• Infrastructural expansion
Impact on Mass Balance
Current Mass
Balance
10%
Implementation
25%
Implementation
50%
Implementation
43% - - -
Bring More Land
Into Production

• ~500,000 acres currently
• 166,000 acres of low-density
residential, >5 acres, with prime
soils or soils of statewide
importance.
• Considerations:
• Current land use
• Competing land use interests
• Potentially lowers land values
Bring Low-density Agricultural Land Into Production
Impact on Mass Balance
Current Mass
Balance
10%
Implementation
25%
Implementation
50%
Implementation
43% 44% 45% 46%
Bring More Land
Into Production

Increase Crop Production
• 115,000 acres of public property for
government services and 26,000 acres of
land for utilities
• Garden space in backyards accounts for
1,240 acres.
• Considerations:
• Competing land use interests
• Implementation, labor and management
• Leasing public land as a potential source
of revenue
Bring More Suburban and Urban Land Into Food Production
Impact on Mass Balance
Current Mass
Balance
10%
Implementation
25%
Implementation
50%
Implementation
43% 43% 44% 46%

Increase Crop Production
• Christmas Trees = 11,785 acres
• Flowers = 1,932 acres
• Considerations:
• Difficult shift from high-
valued floriculture production
to lower valued vegetables
• Vegetables require more
labor than woody crops
Impact on Mass Balance
Current Mass
Balance
10%
Conversion
25%
Conversion
50%
Conversion
43% 43% 43% 43%
Shift Production From Horticulture and Floriculture To Edible Foods

Increase Crop Production
• 509,000 acres for corn
silage, hay, and
pastureland
• Considerations:
• High demand for local meat
• Increased labor costs in shift
to vegetable production
• Potential increased imports of
feed
Impact on Mass Balance
Current Mass
Balance
10%
Implementation
25%
Implementation
50%
Implementation
43% 43% 48% 54%
Shift Production From Animal Feed to Edible Foods

Increase Crop Production
• Hydroponics
• Considerations:
• Potential 1.5 - 8
times increase over
conventional farming
• Energy costs
Impact on Mass Balance
Current Mass
Balance
10% Implementation
25% Implementation
50% Implementation
43% - - -
Use Technological Advances and Non-traditional Techniques

Increase Crop Production
• Greenhouses/hoop houses
• Considerations:
• Additional costs for
heating/cooling and
irrigation systems
Impact on Mass Balance
Current Mass
Balance
10% Implementation
25% Implementation
50% Implementation
43% - - -
Extend the Local Growing Season

Increase Demand For Local Food
• “Eat Local” campaign
• Incentives for local
institutions
• Vertical integration
• Regional multi-purpose
processing center
• Mobile meat processing unit
Increase Access To Processing For Small-scale Producers
Localize the Supply Chain

Impact on Mass Balance
Current Mass
Balance
10% Waste
Reduction
25% Waste
Reduction
50% Waste
Reduction
43% 43% 43% 43%
Increase Scale of Local Producers
• Build a food
hub in a local
community
Localize the Supply Chain

Reduce Food Waste
0.0%
10.0%
20.0%
30.0%
40.0%
50.0%
60.0%
70.0%
Overall Vegetables Meat & beans
Fruits Fats Grains Added sugars
Dairy
Loss Between Primary & Retail
Additional Loss Between Retail & Consumer
Additional Loss at Consumer Level
Over 43% of food never gets
eaten
The majority of food loss
happens at the consumer level

Reduce Food Waste
Education of Consumers and Food Service Providers
Innovation into Waste Reduction Tools and Packaging
Impact on Mass Balance
Current Mass
Balance
10% Waste
Reduction
25% Waste
Reduction
50% Waste
Reduction
43% 45% 48% 55%

Shift the Local Diet
215%
81%
63%
119%
170%
26%
64%
153%
98%
9%
59%
0% 50% 100% 150% 200% 250%
Grains
Fruit
Vegetables
Dairy
Protein
Overall
Produced Consumed
Production & Consumption as a Percentage of USDA Standard Diet
USDA Standard Diet
973%
900% 950% 1000%

• Eating only what we produce greatly
improves the mass balance
• Current production could satisfy 59% of the
USDA-recommended standard diet
• Considerations:
• Unhealthy
• Dramatic departure from
current dietary preferences
• Restricted by seasonality
Shift the Local Diet
Shift to the Hyper-Local Diet

Shift the Local Diet
24%
33%
40%
96%
87%
81%
19%
185%
0%
210%
14%
153%
0% 50% 100% 150% 200% 250%
Dark Green
Red & Orange
Legumes
Starchy
Other
Overall
Vegetable Production & Consumption as a Percentage of USDA-Recommended Consumption
Produced
Consumed
USDA-Recommended Servings

Shift the Local Diet
• Current production could satisfy 59% of the USDA-
recommended standard diet
• Efforts to shift diet can be integrated with other re-
localization efforts:
• Educational programs
• Buy Local Campaigns
• Considerations: • Efficacy of dietary
• Recommendations?
• Requires complementary shifts
in production
Promote Adoption of the USDA Standard Diet

Shift the Local Diet
Impact on Mass Balance
Current Mass Balance USDA Standard Diet Hyper-Local Diet
35% 59% 170%
• Identify high-demand, low supply
crops that are also under-
consumed
• i.e. Broccoli
• Considerations: • Supply and demand chicken-or-
egg problem
Encourage Production to Support the USDA Standard Diet

Best Strategies
• Promote strong agricultural zoning codes
Halt farmland loss
• Farm mixed agricultural land
Bring More Land Into Production
• Extend the local growing season Increase Crop
Production
• Increase access to processing for small-scale producers
Localize the Supply Chain
• Promote food waste education Reduce Food
Waste
• Switch to a USDA recommended diet Shift the Local
Diet
• Enhance tax incentives
• Farm low-density land
• Increase demand for local food

Some sort of combining strategies
discussion

Questions?

Analyzing the Options
Balance of
Consumption/Production Other
Criteria
Halt farmland loss
Promote strong agricultural zoning codes
Enhance tax incentives
Bring more land into production
Farm mixed agricultural land
Farm low-density land
Farm suburban/urban land
Farm historic farmland
Increase crop production
Extend the local growing season
Change horticulture, floriculture, horses to edible foods
Implement non-traditional techniques
Change animal feed to edible foods
Localize the supply chain
Increase access to processing for small-scale producers
Increase demand for local food
Increase scale of local producers
Reduce food waste
Promote food waste education
Promote innovation in waste reduction and packaging
Shift the local diet
Switch to a USDA recommended diet
Switch to a hyper-local diet

116%
13%
198%
64%
153%
80%
0% 50% 100% 150% 200% 250%
Dairy
Protein
Grains
Fruit
Vegetables
Overall
Production as a Percentage of USDA-Recommended Consumption
Shift the Local Diet

24%
33%
40%
96%
87%
19%
185%
0%
210%
14%
0% 50% 100% 150% 200% 250%
Dark Green
Red & Orange
Legumes
Starchy
Other
Production & Consumption of Vegetable Sub-Groups as a Percentage of USDA-Recommended Consumption
Produced
Consumed
Shift the Local Diet

54%
881%
491%
334%
53%
214%
116%
13%
198%
64%
153%
80%
0% 100% 200% 300% 400% 500% 600% 700% 800% 900% 1000%
Dairy
Protein
Grains
Fruit
Vegetables
Overall
Current Production & Consumption as Percentages of USDA-Recommended Consumption
Production
Consumption
Shift the Local Diet


