
International Journal of Scientific & Engineering Research, Volume 5, Issue 8,August-2014 84 ISSN 2229-5518
IJSER © 2014 http://www.ijser.org
The Use of Artificial Bayesian Intelligence for Development of Optimum Well Control Practices
Abdullah Al-Yami, Jerome Schubert and Vikrant Wagle
Abstract— Many well control incidents have been analyzed, resulting in the optimum practices, as outlined in this paper. To the best of the authors' knowledge, there are no systematic guidelines for well control practices. The objective of this paper is to propose a set of guidelines for the optimal well control operations, by integrating current best practices through a decision-making system based on Artificial Bayesian Intelligence. Best well control practices collected from data, models, and experts' opinions, are integrated into a Bayesian Network BN to simulate likely scenarios of its use that will honor efficient practices when dictated by varying operation, kick details, and kick severity. The proposed decision-making model follows a causal and an uncertainty-based approach capable of simulating realistic conditions on the use of well control operations. For instance, as the user vary the operation, rig and crew capabilities, kick details (such as slim hole, deviated or horizontal well), the system will show the optimum practices for circulation method. Well control experts' opinions were considered in building up the model in this paper. The advantage of the artificial Bayesian intelligence method is that it can be updated easily when dealing with different opinions. The outcome of this paper is user-friendly software, where you can easily find the specific subject of interest, and by the click of a button, get the related information you are seeking. Index Terms— artificial intelligence, Bayesian, well control, drilling and uncertainty-based approach.
—————————— ——————————
1 INTRODUCTION The purpose of development of well control procedure is to prevent catastrophes that could result from blowouts. The objective of this paper is to propose a model to serve as a training tool. The development of up to date source of proper well control practices is a challenging task. Using current methods of flow charts in decision making does not allow enough room for different or changing well control practices to be included. The design of optimum well control practises de-pends mainly on previous experience and knowledge to suc-cessfully complete with a degree of confidence. Effective communication is also an important factor for successful well control operations. Good coordination is required between the engineer, the service company and the rig foreman. Knowledge transfer in well control operations is therefore fundamental for the optimal design of the job. Field experiences are required for well control special-ists to select optimum practices. In some instances, well con-trol operation failures can occur because of the lack of knowledge or lack of knowledge transfer. There are different methods that companies have ap-proached to make guidelines for their engineers to save on operations cost and time. However, these methods can not be used by other companies or experts with different opinions or with different field conditions. Al-Yami et al. (2010) were the first to propose a sys-tematic approach to build expert systems that can be used in optimum selection and execution of successful cementing op-erations using Artificial Bayesian Intelligence. The Bayesian paradigm can be defined as:
Representing the probability of a hypothesis condi-
tioned upon the availability of evidence to confirm it. This means that it is required to combine the degree to plausibility of the evidence given the hypothesis or likelihood p(evidence|hypothesis), and the degree of certainty of the hypothesis or p (hypothesis) called prior. The intersection be-tween these two probabilities is then normalized by p (evi-dence) so the conditional probabilities of all hypothesis can sum up to 1. This work introduces the use of Bayesian networks as a way to provide reasoning under uncertainty, using nodes representing variables either discrete or continuous. Arcs are used to show the influences among the variables (nodes). Thus, Bayesian networks can be used to predict the effect of interventions, immediate changes, and to update inferences according to new evidences. Bayesian networks are known as directed acyclic graphs because generating cycles are not allowed. The terminology for describing a Bayesian Network follows a hierarchical par-enting scheme. A node is named a parent of another node named child if we have an arc from the former to the later. The arcs will represent direct dependencies. Evidence can be in-troduced to the Bayesian network at any node, which is also known as probability propagation or belief updating. It is im-portant to define the conditional probability distributions to each node (Korb and Nicholson, 2004). In order to prove the concept and the benefits of using this approach, one simple BDN model simulating the decision-making process of the selection of swelling packer is intro-duced in Fig.1, Al-Yami et al. (2011). This model contains one decision node (swelling packer), three uncertainty nodes (treating fluid, type of drilling fluid, and Consequences), and one value node (Completion Expert System). In this model, our selection for swelling packers is affected by our selection of treating fluid and drilling fluids.
=
)()()(
)(evidencep
hypothesisphypothesisevidencepevidencehypothesisp
IJSER

International Journal of Scientific & Engineering Research, Volume 5, Issue 8,August-2014 85 ISSN 2229-5518
IJSER © 2014 http://www.ijser.org
Once the structure of the BDN is defined, it is required to de-fine the probability states associated with each node. These are given in Table 1 through Table 5. The model is designed in a way that the engineer will select his uncertainty nodes (treat-ing fluid and/or type of drilling fluid) to get the recommend-ed type of swelling packer (oil swelling or water swelling packer, Table 1). Table 2 shows the probability states of treat-ing fluids based on swelling packers. Table 3 shows the prob-ability states of type of drilling fluids based on swelling pack-ers and treating fluids. Table 4 defines the extent of the proba-bility states of the consequences, which are defined as recom-mended and not recommended. The input utility value associ-ated with the consequences is given in Table 5. The expected utility outcomes considering all possible cases of evidence set a minimum value of zero, which is the “not recommended” case, and a maximum value of one, which assumed to be the “recommended” case.
Table 1: Swelling Packers water swelling pack-
er oil swelling packer
Table 2: Probability states of treating fluids based on swelling
packers
Swelling packer
water swelling packer
oil swell-ing
packer Lactic acid 0.9 0.5 HCl acid 0.1 0.5
Table 3: Probability states of type of drilling fluids based on
swelling packers and treating fluids Swelling packer
water swell-ing oil swelling
Treating Fluid
lactic acid
HCl acid
lactic acid
HCl acid
Formate drilling
fluid 0.8 0.2 0.8 0.2 CaCO3 drilling
fluid 0.2 0.8 0.2 0.8
Table 4: Probability states of the consequences swelling packers
water swelling packer oil swelling packer
Type of drilling
fluid
Formate drilling fluid
CaCO3 drilling
fluid
Formate drilling
fluid
CaCO3 drilling
fluid treating
fluid Lactic acid
HCl acid
lactic acid
HCl acid
lactic acid
HCl acid
lactic acid
HCl acid
Recomm- ended
0 0 1 0 1 0 0 1
Not recomm-
ended 1 1 0 1 0 1 1 0
Table 5: Input utility values associated with the consequences
Consequences Recommended Not recom-
mended Value 1 0
The main goal after the required inputs are entered into the model is to simulate the uncertainty propagation from the existing sources of evidence, which means moving the infor-mation forward starting from the swelling packers node. First the total probability is calculated for the type of drill-ing fluid. The above model shows that our selection of drilling fluid will affect the treating fluid and our swelling packers. The below equation is used:
The results are shown in Table 6. Tables 2&3 are used for this
calculation for example:
Table 6: Total probability for type of drilling fluid
Swelling packer
water swelling packer
oil swelling packer
Formate drill-ing fluid 0.74 0.5
CaCO3 drill-ing fluid 0.26 0.5
Then Bayesian equation can be used as shown below:
Which is the same thing as:
The results are shown in Table 7. Tables 2, 3 and 6 are used for this calculation. The calculation shows the probabili-ties of selecting treating fluids (lactic acid or HCl acid) when the engineer wants to use a certain drilling fluid (formate or CaCO3) for a particular swelling packer (oil or water swell-ing). The detailed calculations for water swelling packer are shown below:
)()(1
i
m
ii APABP∑
=
( ) ( ) 74.02.01.08.09.0)()(1
=×+×=∑=
acidlacticPacidlacticfluiddrillingformatePm
ii
9729.074.0
9.08.0
)()()(
)(
=×
=
=
formatepacidlacticpacidlacticformatep
formateacidlacticp
=
)()()(
)(evidencep
hypothesisphypothesisevidencepevidencehypothesisp
IJSER
International Journal of Scientific & Engineering Research, Volume 5, Issue 8,August-2014 86 ISSN 2229-5518
IJSER © 2014 http://www.ijser.org
For oil swelling packer, the calculations are:
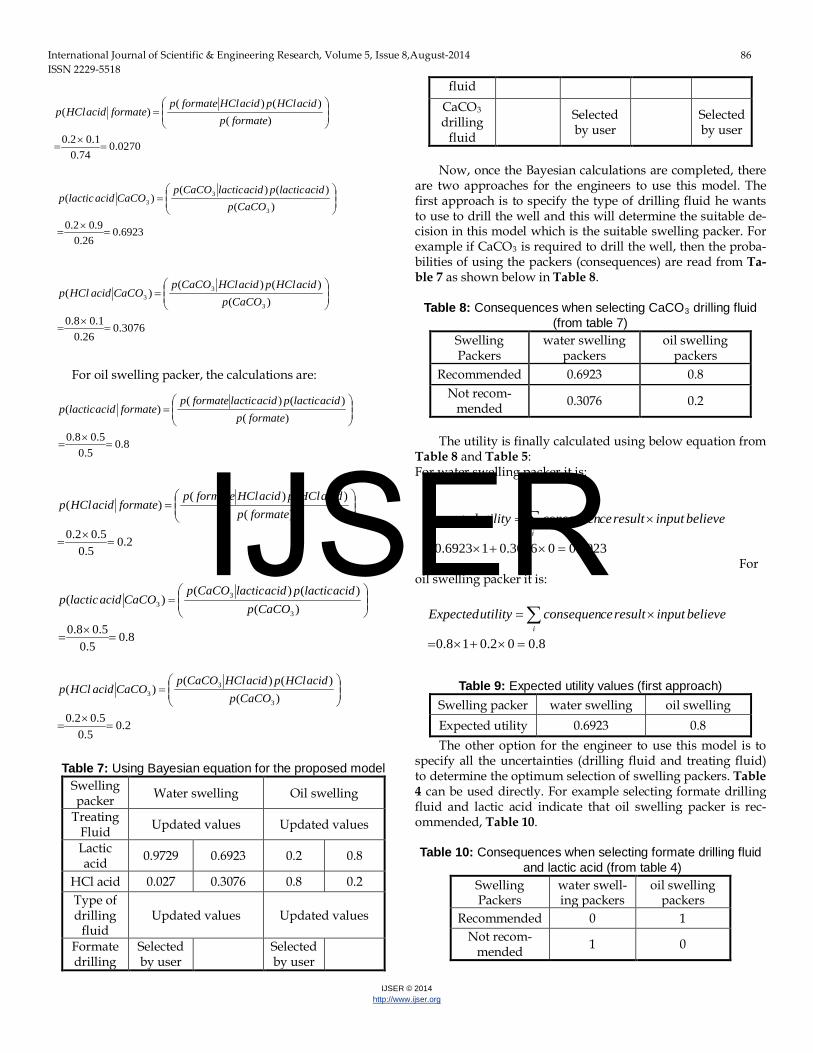
Table 7: Using Bayesian equation for the proposed model
Swelling packer Water swelling Oil swelling
Treating Fluid Updated values Updated values
Lactic acid 0.9729 0.6923 0.2 0.8
HCl acid 0.027 0.3076 0.8 0.2 Type of drilling
fluid Updated values Updated values
Formate drilling
Selected by user Selected
by user
fluid CaCO3 drilling
fluid Selected
by user Selected by user
Now, once the Bayesian calculations are completed, there are two approaches for the engineers to use this model. The first approach is to specify the type of drilling fluid he wants to use to drill the well and this will determine the suitable de-cision in this model which is the suitable swelling packer. For example if CaCO3 is required to drill the well, then the proba-bilities of using the packers (consequences) are read from Ta-ble 7 as shown below in Table 8.
Table 8: Consequences when selecting CaCO3 drilling fluid (from table 7)
Swelling Packers
water swelling packers
oil swelling packers
Recommended 0.6923 0.8 Not recom-
mended 0.3076 0.2
The utility is finally calculated using below equation from
Table 8 and Table 5: For water swelling packer it is:
For
oil swelling packer it is:
Table 9: Expected utility values (first approach)
Swelling packer water swelling oil swelling Expected utility 0.6923 0.8 The other option for the engineer to use this model is to
specify all the uncertainties (drilling fluid and treating fluid) to determine the optimum selection of swelling packers. Table 4 can be used directly. For example selecting formate drilling fluid and lactic acid indicate that oil swelling packer is rec-ommended, Table 10. Table 10: Consequences when selecting formate drilling fluid
and lactic acid (from table 4) Swelling Packers
water swell-ing packers
oil swelling packers
Recommended 0 1 Not recom-
mended 1 0
0270.074.0
1.02.0
)()()(
)(
=×
=
=
formatepacidHClpacidHClformatep
formateacidHClp
6923.026.0
9.02.0
)()()(
)(3
33
=×
=
=
CaCOpacidlacticpacidlacticCaCOp
CaCOacidlacticp
3076.026.0
1.08.0
)()()(
)(3
33
=×
=
=
CaCOpacidHClpacidHClCaCOp
CaCOacidHClp
8.05.0
5.08.0
)()()(
)(
=×
=
=
formatepacidlacticpacidlacticformatep
formateacidlacticp
2.05.0
5.02.0
)()()(
)(
=×
=
=
formatepacidHClpacidHClformatep
formateacidHClp
8.05.0
5.08.0
)()()(
)(3
33
=×
=
=
CaCOpacidlacticpacidlacticCaCOp
CaCOacidlacticp
2.05.0
5.02.0
)()()(
)(3
33
=×
=
=
CaCOpacidHClpacidHClCaCOp
CaCOacidHClp
6923.003076.016923.0 =×+×=
×=∑i
believeinputresultceconsequenutilityExpected
8.002.018.0 =×+×=
×=∑i
believeinputresultceconsequenutilityExpected
IJSER
International Journal of Scientific & Engineering Research, Volume 5, Issue 8,August-2014 87 ISSN 2229-5518
IJSER © 2014 http://www.ijser.org
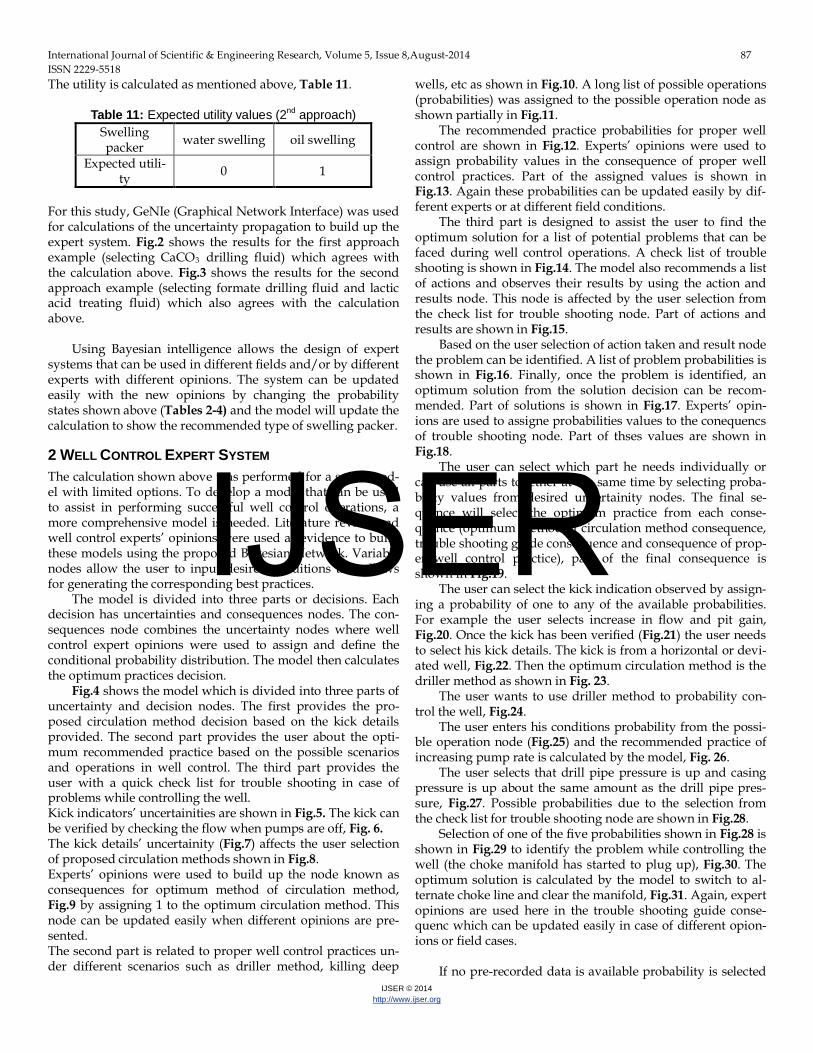
The utility is calculated as mentioned above, Table 11.
Table 11: Expected utility values (2nd approach) Swelling packer water swelling oil swelling
Expected utili-ty 0 1
For this study, GeNIe (Graphical Network Interface) was used for calculations of the uncertainty propagation to build up the expert system. Fig.2 shows the results for the first approach example (selecting CaCO3 drilling fluid) which agrees with the calculation above. Fig.3 shows the results for the second approach example (selecting formate drilling fluid and lactic acid treating fluid) which also agrees with the calculation above. Using Bayesian intelligence allows the design of expert systems that can be used in different fields and/or by different experts with different opinions. The system can be updated easily with the new opinions by changing the probability states shown above (Tables 2-4) and the model will update the calculation to show the recommended type of swelling packer.
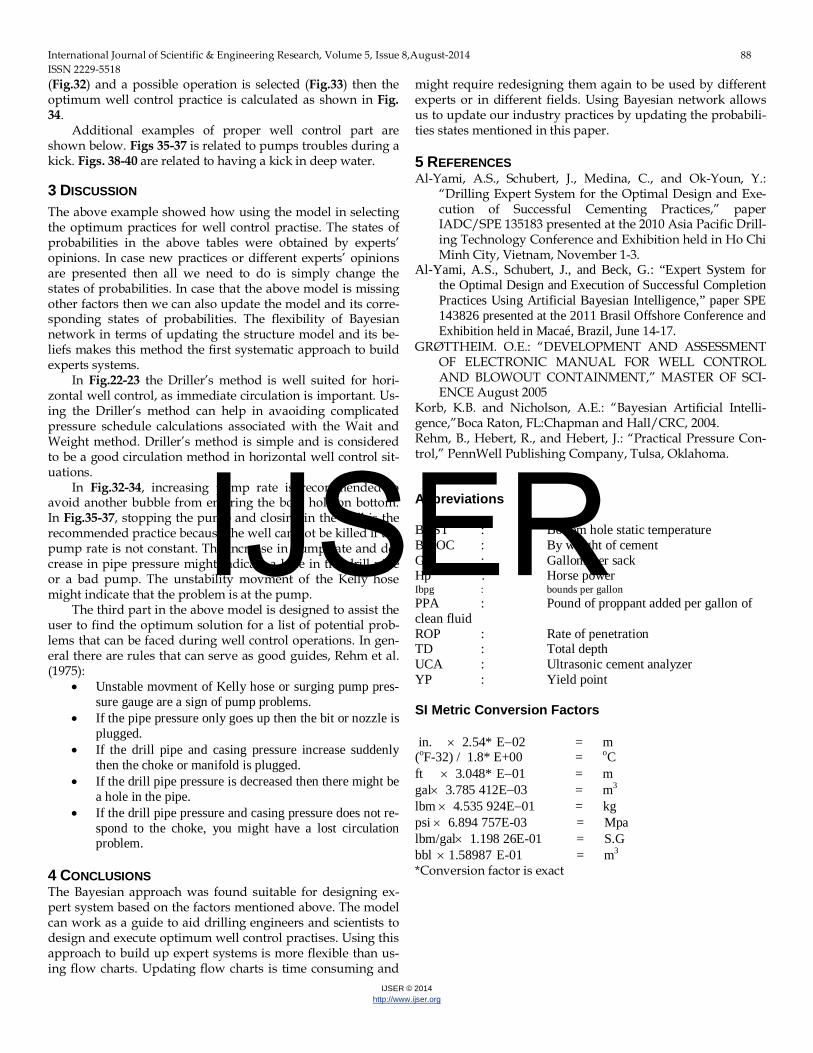
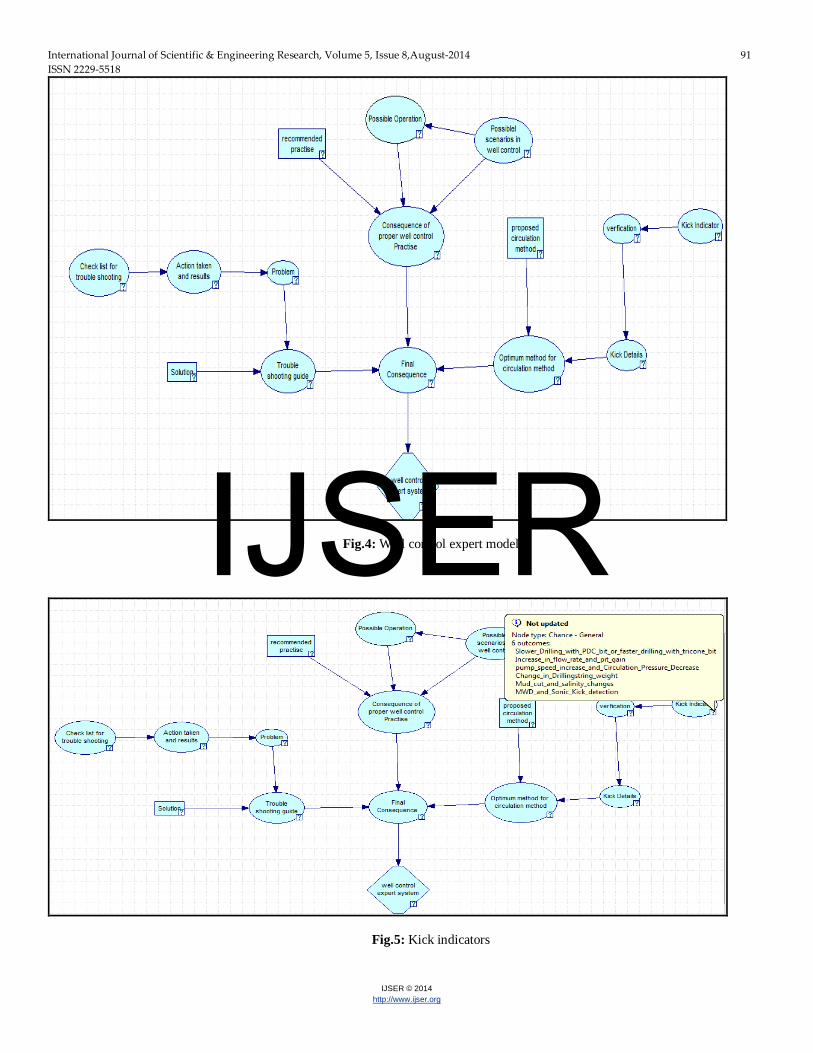
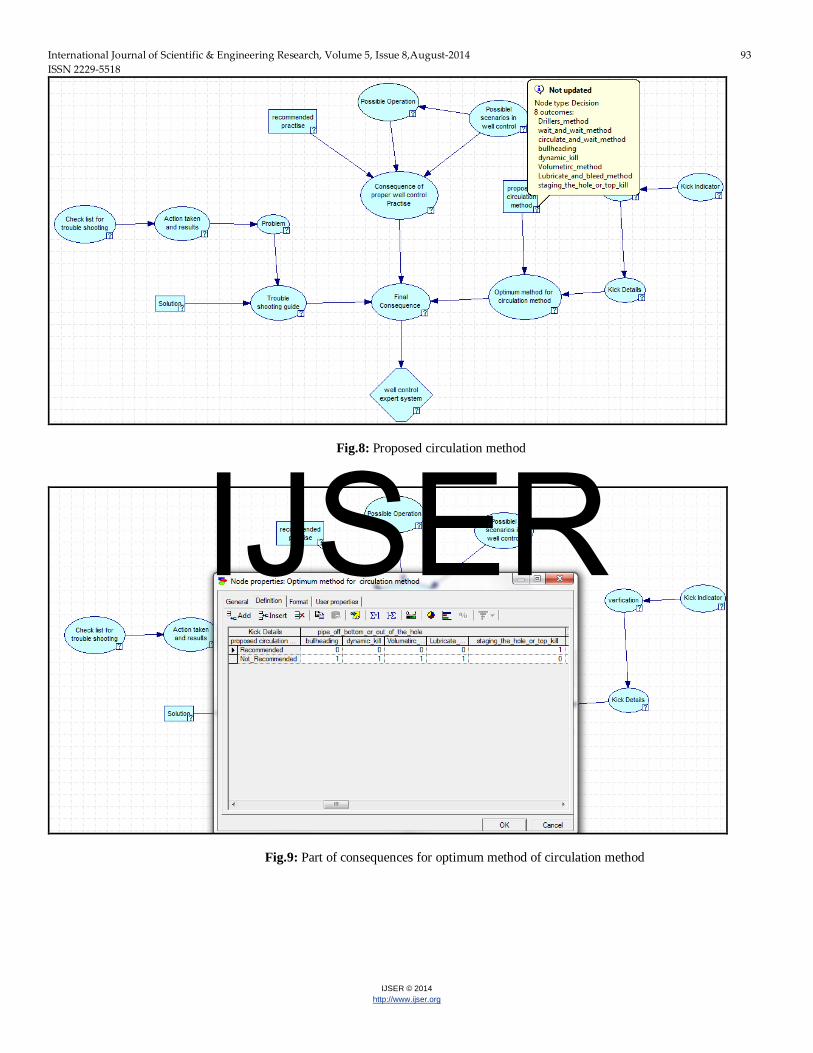
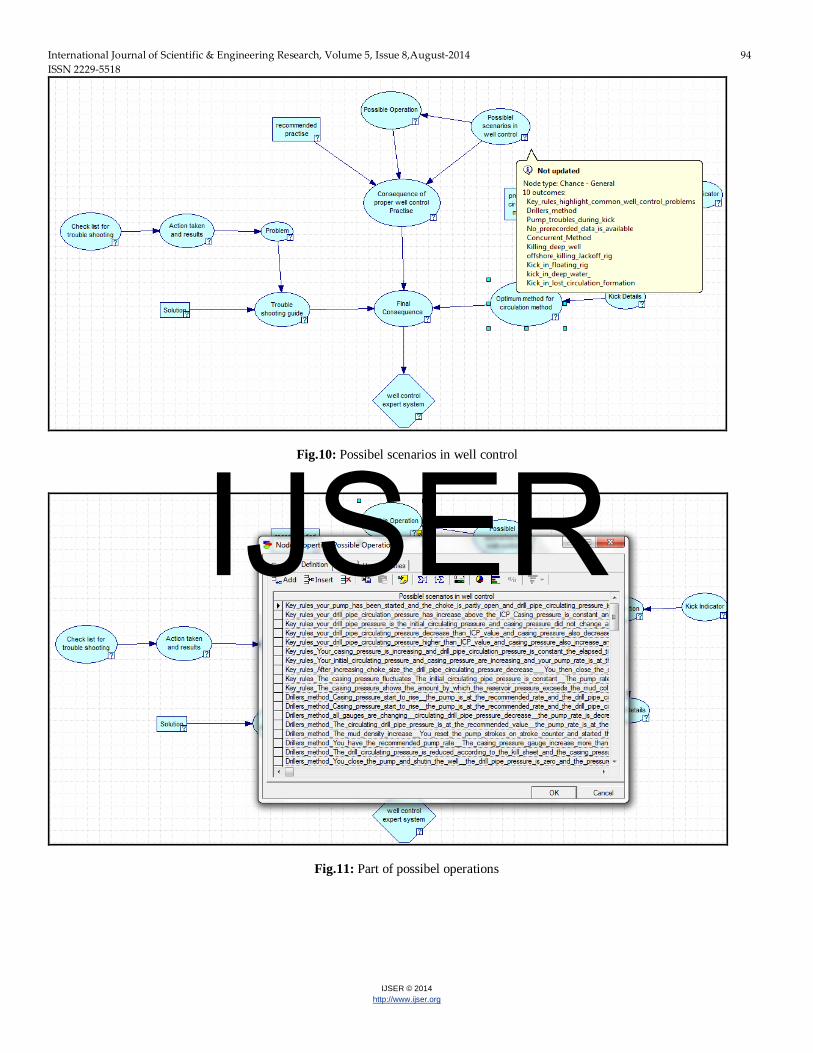
2 WELL CONTROL EXPERT SYSTEM The calculation shown above was performed for a small mod-el with limited options. To develop a model that can be used to assist in performing successful well control operations, a more comprehensive model is needed. Literature review and well control experts’ opinions were used as evidence to build these models using the proposed Bayesian Network. Variable nodes allow the user to input desired conditions that allows for generating the corresponding best practices. The model is divided into three parts or decisions. Each decision has uncertainties and consequences nodes. The con-sequences node combines the uncertainty nodes where well control expert opinions were used to assign and define the conditional probability distribution. The model then calculates the optimum practices decision. Fig.4 shows the model which is divided into three parts of uncertainty and decision nodes. The first provides the pro-posed circulation method decision based on the kick details provided. The second part provides the user about the opti-mum recommended practice based on the possible scenarios and operations in well control. The third part provides the user with a quick check list for trouble shooting in case of problems while controlling the well. Kick indicators’ uncertainities are shown in Fig.5. The kick can be verified by checking the flow when pumps are off, Fig. 6. The kick details’ uncertainity (Fig.7) affects the user selection of proposed circulation methods shown in Fig.8. Experts’ opinions were used to build up the node known as consequences for optimum method of circulation method, Fig.9 by assigning 1 to the optimum circulation method. This node can be updated easily when different opinions are pre-sented. The second part is related to proper well control practices un-der different scenarios such as driller method, killing deep
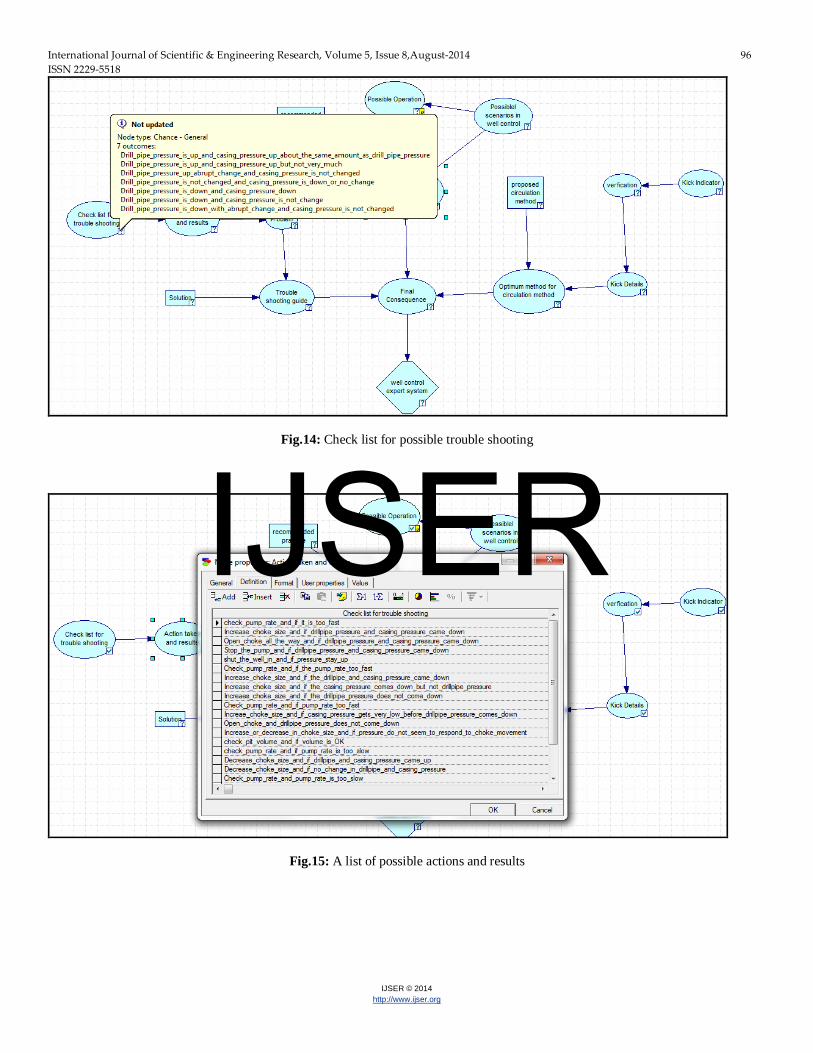
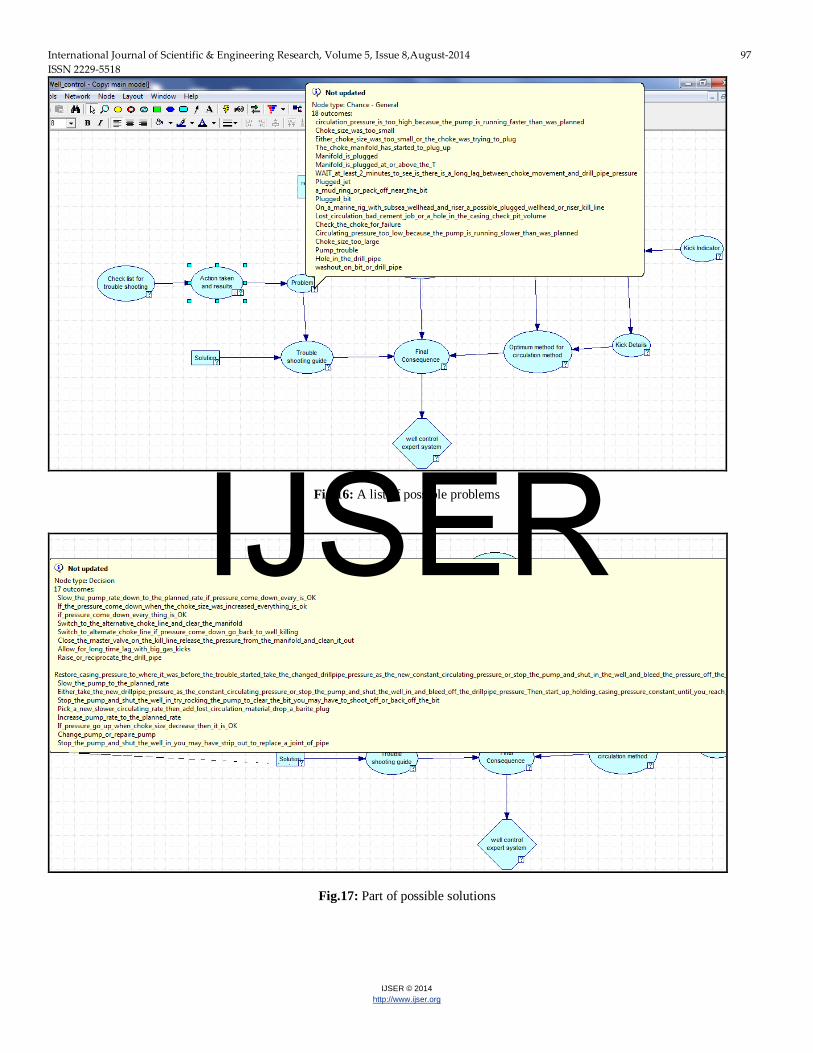
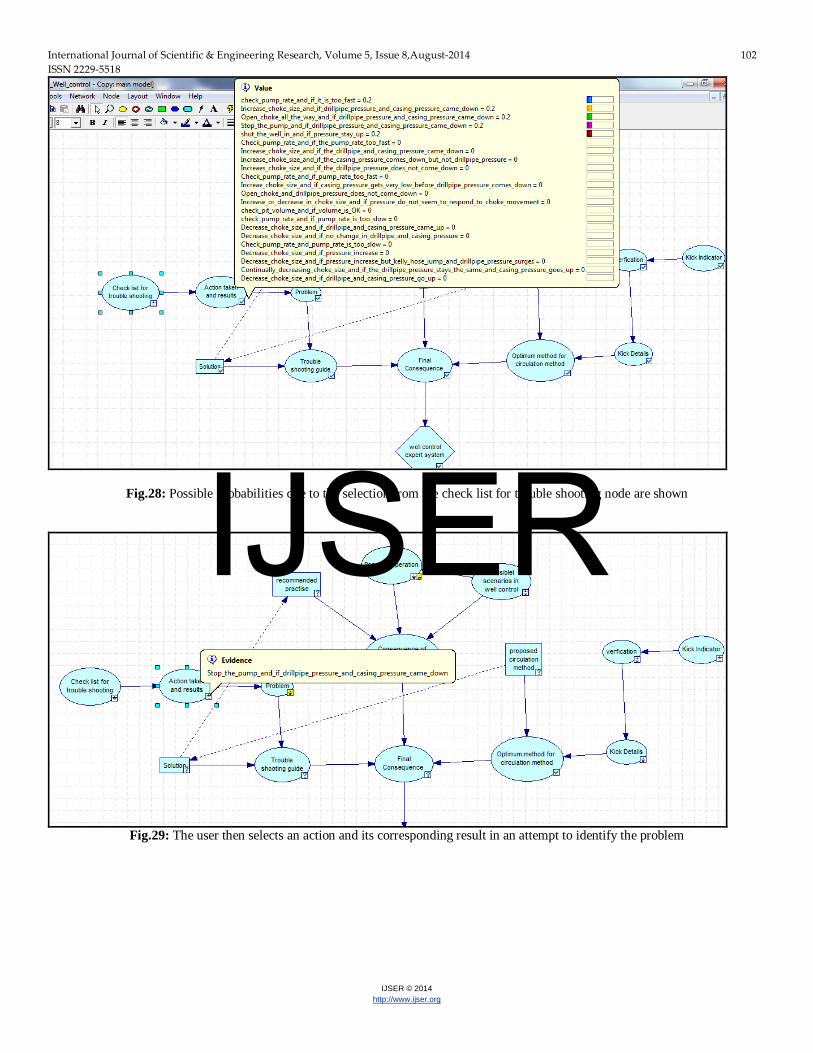
wells, etc as shown in Fig.10. A long list of possible operations (probabilities) was assigned to the possible operation node as shown partially in Fig.11. The recommended practice probabilities for proper well control are shown in Fig.12. Experts’ opinions were used to assign probability values in the consequence of proper well control practices. Part of the assigned values is shown in Fig.13. Again these probabilities can be updated easily by dif-ferent experts or at different field conditions. The third part is designed to assist the user to find the optimum solution for a list of potential problems that can be faced during well control operations. A check list of trouble shooting is shown in Fig.14. The model also recommends a list of actions and observes their results by using the action and results node. This node is affected by the user selection from the check list for trouble shooting node. Part of actions and results are shown in Fig.15. Based on the user selection of action taken and result node the problem can be identified. A list of problem probabilities is shown in Fig.16. Finally, once the problem is identified, an optimum solution from the solution decision can be recom-mended. Part of solutions is shown in Fig.17. Experts’ opin-ions are used to assigne probabilities values to the conequencs of trouble shooting node. Part of thses values are shown in Fig.18. The user can select which part he needs individually or can use all parts together at the same time by selecting proba-bility values from desired uncertainity nodes. The final se-quence will select the optimum practice from each conse-quence (optimum method of circulation method consequence, trouble shooting guide consequence and consequence of prop-er well control practice), part of the final consequence is shown in Fig.19. The user can select the kick indication observed by assign-ing a probability of one to any of the available probabilities. For example the user selects increase in flow and pit gain, Fig.20. Once the kick has been verified (Fig.21) the user needs to select his kick details. The kick is from a horizontal or devi-ated well, Fig.22. Then the optimum circulation method is the driller method as shown in Fig. 23. The user wants to use driller method to probability con-trol the well, Fig.24. The user enters his conditions probability from the possi-ble operation node (Fig.25) and the recommended practice of increasing pump rate is calculated by the model, Fig. 26. The user selects that drill pipe pressure is up and casing pressure is up about the same amount as the drill pipe pres-sure, Fig.27. Possible probabilities due to the selection from the check list for trouble shooting node are shown in Fig.28. Selection of one of the five probabilities shown in Fig.28 is shown in Fig.29 to identify the problem while controlling the well (the choke manifold has started to plug up), Fig.30. The optimum solution is calculated by the model to switch to al-ternate choke line and clear the manifold, Fig.31. Again, expert opinions are used here in the trouble shooting guide conse-quenc which can be updated easily in case of different opion-ions or field cases.
If no pre-recorded data is available probability is selected
IJSER
International Journal of Scientific & Engineering Research, Volume 5, Issue 8,August-2014 88 ISSN 2229-5518
IJSER © 2014 http://www.ijser.org
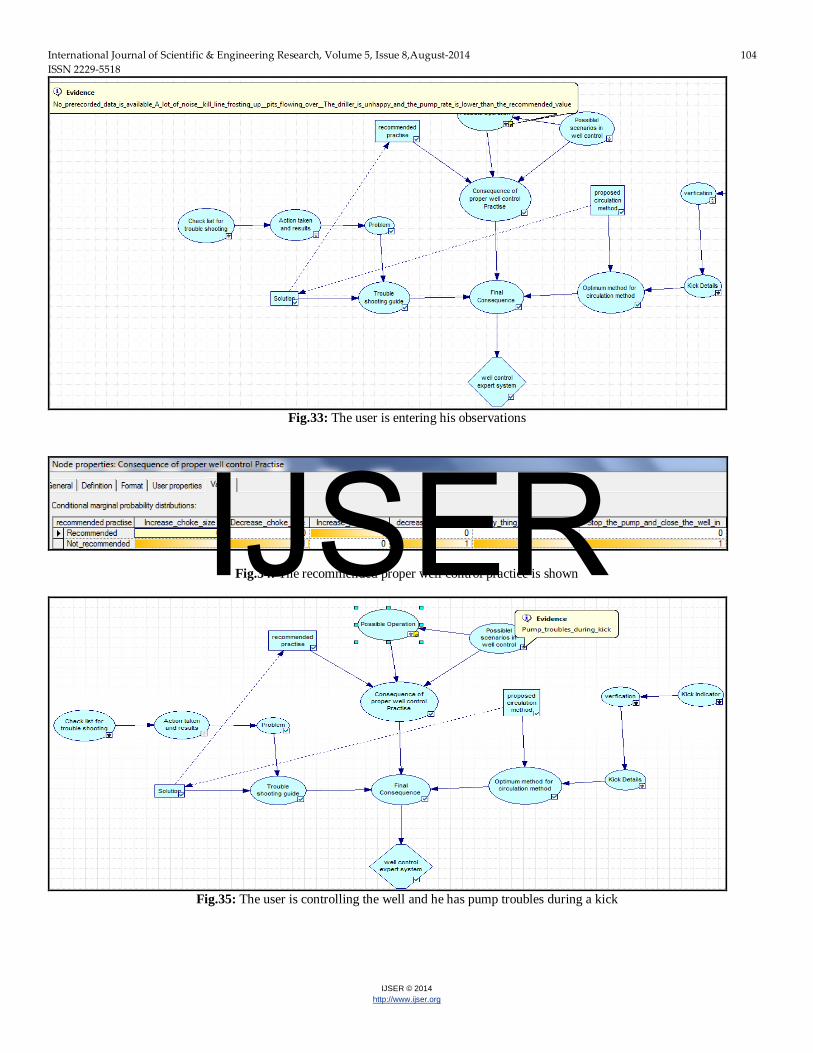
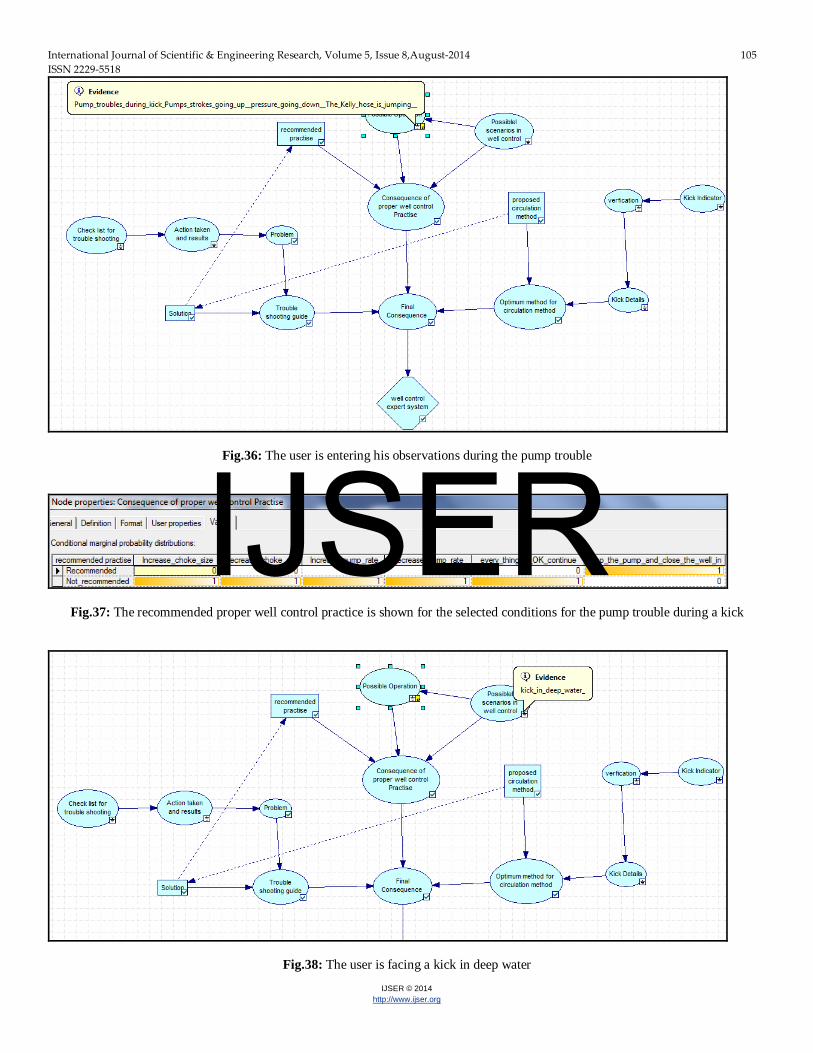
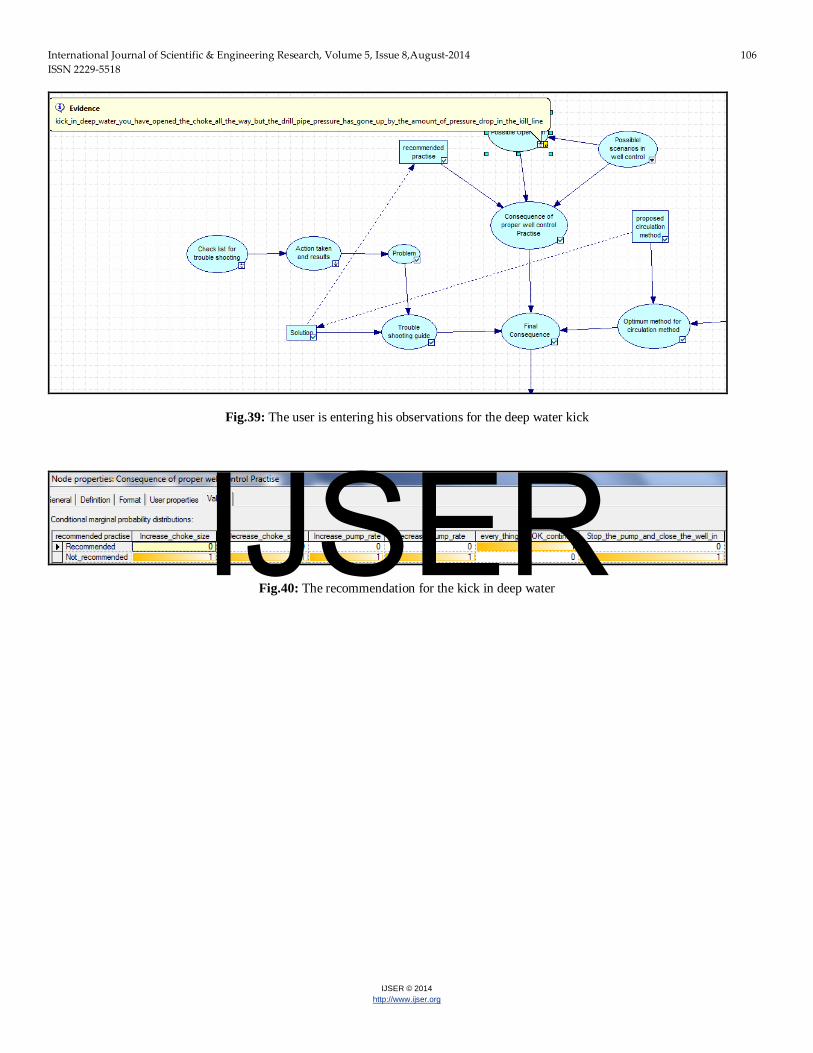
(Fig.32) and a possible operation is selected (Fig.33) then the optimum well control practice is calculated as shown in Fig. 34. Additional examples of proper well control part are shown below. Figs 35-37 is related to pumps troubles during a kick. Figs. 38-40 are related to having a kick in deep water.
3 DISCUSSION The above example showed how using the model in selecting the optimum practices for well control practise. The states of probabilities in the above tables were obtained by experts’ opinions. In case new practices or different experts’ opinions are presented then all we need to do is simply change the states of probabilities. In case that the above model is missing other factors then we can also update the model and its corre-sponding states of probabilities. The flexibility of Bayesian network in terms of updating the structure model and its be-liefs makes this method the first systematic approach to build experts systems. In Fig.22-23 the Driller’s method is well suited for hori-zontal well control, as immediate circulation is important. Us-ing the Driller’s method can help in avaoiding complicated pressure schedule calculations associated with the Wait and Weight method. Driller’s method is simple and is considered to be a good circulation method in horizontal well control sit-uations. In Fig.32-34, increasing pump rate is recommended to avoid another bubble from entering the bore hole on bottom. In Fig.35-37, stopping the pump and closing in the well is the recommended practice because the well can not be killed if the pump rate is not constant. The increase in pump rate and de-crease in pipe pressure might indicate a hole in the drill pipe or a bad pump. The unstability movment of the Kelly hose might indicate that the problem is at the pump. The third part in the above model is designed to assist the user to find the optimum solution for a list of potential prob-lems that can be faced during well control operations. In gen-eral there are rules that can serve as good guides, Rehm et al. (1975):
• Unstable movment of Kelly hose or surging pump pres-sure gauge are a sign of pump problems.
• If the pipe pressure only goes up then the bit or nozzle is plugged.
• If the drill pipe and casing pressure increase suddenly then the choke or manifold is plugged.
• If the drill pipe pressure is decreased then there might be a hole in the pipe.
• If the drill pipe pressure and casing pressure does not re-spond to the choke, you might have a lost circulation problem.
4 CONCLUSIONS The Bayesian approach was found suitable for designing ex-pert system based on the factors mentioned above. The model can work as a guide to aid drilling engineers and scientists to design and execute optimum well control practises. Using this approach to build up expert systems is more flexible than us-ing flow charts. Updating flow charts is time consuming and
might require redesigning them again to be used by different experts or in different fields. Using Bayesian network allows us to update our industry practices by updating the probabili-ties states mentioned in this paper. 5 REFERENCES Al-Yami, A.S., Schubert, J., Medina, C., and Ok-Youn, Y.:
“Drilling Expert System for the Optimal Design and Exe-cution of Successful Cementing Practices,” paper IADC/SPE 135183 presented at the 2010 Asia Pacific Drill-ing Technology Conference and Exhibition held in Ho Chi Minh City, Vietnam, November 1-3.
Al-Yami, A.S., Schubert, J., and Beck, G.: “Expert System for the Optimal Design and Execution of Successful Completion Practices Using Artificial Bayesian Intelligence,” paper SPE 143826 presented at the 2011 Brasil Offshore Conference and Exhibition held in Macaé, Brazil, June 14-17.
GRØTTHEIM. O.E.: “DEVELOPMENT AND ASSESSMENT OF ELECTRONIC MANUAL FOR WELL CONTROL AND BLOWOUT CONTAINMENT,” MASTER OF SCI-ENCE August 2005
Korb, K.B. and Nicholson, A.E.: “Bayesian Artificial Intelli-gence,”Boca Raton, FL:Chapman and Hall/CRC, 2004. Rehm, B., Hebert, R., and Hebert, J.: “Practical Pressure Con-trol,” PennWell Publishing Company, Tulsa, Oklahoma. Abbreviations BHST : Bottom hole static temperature BWOC : By weight of cement Gps : Gallons per sack Hp : Horse power Ibpg : bounds per gallon PPA : Pound of proppant added per gallon of clean fluid ROP : Rate of penetration TD : Total depth UCA : Ultrasonic cement analyzer YP : Yield point SI Metric Conversion Factors in. × 2.54* E−02 = m (oF-32) / 1.8* E+00 = oC ft × 3.048* E−01 = m gal× 3.785 412E−03 = m3 lbm × 4.535 924E−01 = kg psi × 6.894 757E-03 = Mpa lbm/gal× 1.198 26E-01 = S.G bbl × 1.58987 E-01 = m3
*Conversion factor is exact
IJSER

International Journal of Scientific & Engineering Research, Volume 5, Issue 8,August-2014 89 ISSN 2229-5518
IJSER © 2014 http://www.ijser.org
Fig.1: BDN model for the proof of the concept
Fig.2: Model for the proof of concept (first approach)
IJSER

International Journal of Scientific & Engineering Research, Volume 5, Issue 8,August-2014 90 ISSN 2229-5518
IJSER © 2014 http://www.ijser.org
Fig.3: Model for the proof of concept (second approach)
IJSER
International Journal of Scientific & Engineering Research, Volume 5, Issue 8,August-2014 91 ISSN 2229-5518
IJSER © 2014 http://www.ijser.org
Fig.4: Well control expert model
Fig.5: Kick indicators
IJSER

International Journal of Scientific & Engineering Research, Volume 5, Issue 8,August-2014 92 ISSN 2229-5518
IJSER © 2014 http://www.ijser.org
Fig.6: Verification
Fig.7: Possible kick details
IJSER
International Journal of Scientific & Engineering Research, Volume 5, Issue 8,August-2014 93 ISSN 2229-5518
IJSER © 2014 http://www.ijser.org
Fig.8: Proposed circulation method
Fig.9: Part of consequences for optimum method of circulation method
IJSER
International Journal of Scientific & Engineering Research, Volume 5, Issue 8,August-2014 94 ISSN 2229-5518
IJSER © 2014 http://www.ijser.org
Fig.10: Possibel scenarios in well control
Fig.11: Part of possibel operations
IJSER

International Journal of Scientific & Engineering Research, Volume 5, Issue 8,August-2014 95 ISSN 2229-5518
IJSER © 2014 http://www.ijser.org
Fig.12: A list of recommended practices
Fig.13: Part of consequences of proper well control practices
IJSER
International Journal of Scientific & Engineering Research, Volume 5, Issue 8,August-2014 96 ISSN 2229-5518
IJSER © 2014 http://www.ijser.org
Fig.14: Check list for possible trouble shooting
Fig.15: A list of possible actions and results
IJSER
International Journal of Scientific & Engineering Research, Volume 5, Issue 8,August-2014 97 ISSN 2229-5518
IJSER © 2014 http://www.ijser.org
Fig.16: A list of possible problems
Fig.17: Part of possible solutions
IJSER

International Journal of Scientific & Engineering Research, Volume 5, Issue 8,August-2014 98 ISSN 2229-5518
IJSER © 2014 http://www.ijser.org
Fig.18: Part of conequencs of trouble shooting
Fig.19: Final consequences
Fig.20: kick indicator example
IJSER

International Journal of Scientific & Engineering Research, Volume 5, Issue 8,August-2014 99 ISSN 2229-5518
IJSER © 2014 http://www.ijser.org
Fig.21: Verification of the kick
Fig.22: The kick is from a horizontal or deviated well
Fig.23: The recommended circulation method of this example is driller method
IJSER

International Journal of Scientific & Engineering Research, Volume 5, Issue 8,August-2014 100 ISSN 2229-5518
IJSER © 2014 http://www.ijser.org
Fig.24: The user is controlling the well using driller method
Fig.25: The user is entering his pipe, casing and pump operational conditions
IJSER

International Journal of Scientific & Engineering Research, Volume 5, Issue 8,August-2014 101 ISSN 2229-5518
IJSER © 2014 http://www.ijser.org
Fig.26: The optimum practice of proper well control is shown
Fig.27: The user shows his problem by selecting drill pipe and casing pressure response
IJSER
International Journal of Scientific & Engineering Research, Volume 5, Issue 8,August-2014 102 ISSN 2229-5518
IJSER © 2014 http://www.ijser.org
Fig.28: Possible probabilities due to the selection from the check list for trouble shooting node are shown
Fig.29: The user then selects an action and its corresponding result in an attempt to identify the problem
IJSER

International Journal of Scientific & Engineering Research, Volume 5, Issue 8,August-2014 103 ISSN 2229-5518
IJSER © 2014 http://www.ijser.org
Fig.30: The problem is identified
Fig.31: A recommendation is given to solve this problem
Fig.32: The user is controlling the well without any prerecorded data
IJSER
International Journal of Scientific & Engineering Research, Volume 5, Issue 8,August-2014 104 ISSN 2229-5518
IJSER © 2014 http://www.ijser.org
Fig.33: The user is entering his observations
Fig.34: The recommended proper well control practice is shown
Fig.35: The user is controlling the well and he has pump troubles during a kick
IJSER
International Journal of Scientific & Engineering Research, Volume 5, Issue 8,August-2014 105 ISSN 2229-5518
IJSER © 2014 http://www.ijser.org
Fig.36: The user is entering his observations during the pump trouble
Fig.37: The recommended proper well control practice is shown for the selected conditions for the pump trouble during a kick
Fig.38: The user is facing a kick in deep water
IJSER
International Journal of Scientific & Engineering Research, Volume 5, Issue 8,August-2014 106 ISSN 2229-5518
IJSER © 2014 http://www.ijser.org
Fig.39: The user is entering his observations for the deep water kick
Fig.40: The recommendation for the kick in deep water
IJSER


