Download - The TA Energy Scale Douglas Bergman Rutgers University Aspen UHECR Workshop 2007 17 April 2007

The TA Energy Scale
Douglas BergmanRutgers UniversityAspen UHECR Workshop 200717 April 2007

Introduction
• TA is just now being deployed– Can’t say honestly what we will do– Can only say what I think we should do
• TA is a Hybrid Detector– Use fluorescence detector (FD) to calibrate
surface detector (SD)– This limits model dependence in SD
reconstruction
Outline
• Working from what we know to what we wish to know– Fluorescence Detector Energy Scale– Surface Detector Energy Calibration using the
Fluorescence Detector– Using the Surface Detector at the High Energies

Outline
• Working from what we know to what we wish to know– Fluorescence Detector Energy Scale– Surface Detector Energy Calibration using the
Fluorescence Detector– Using the Surface Detector at the High Energies

The FD Energy Scale
• From the shower to the data (and back again!)– Missing energy and the EM portion of the shower– Depositing shower energy in the atmosphere– Fluorescence yield– Atmospheric losses– Light collection– Photometric scale– Shower parameterization and fitting– Verification with MC (Data/MC comparisons)– Finding the aperture (more Data/MC comparisons)
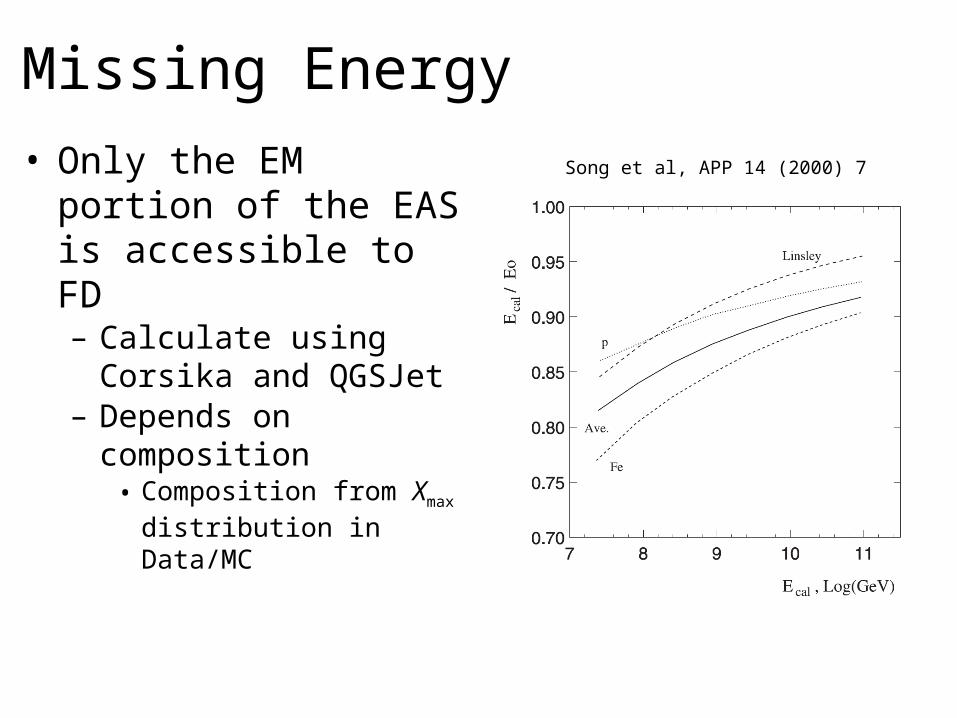
Missing Energy
• Only the EM portion of the EAS is accessible to FD– Calculate using Corsika
and QGSJet– Depends on composition
• Composition from Xmax distribution in Data/MC
Song et al, APP 14 (2000) 7

Missing Energy
• Only the EM portion of the EAS is accessible to FD– Calculate using Corsika
and QGSJet– Depends on composition
• Composition from Xmax distribution in Data/MC
– There are measurements• Do we believe Yakutsk?
Knurenko et al, NPB(ps) 151 (2006) 92

Energy Deposited in Atmosphere
• The energy deposited by an electron depends on its energy– The average electron
energy depends on the age, but also on the model
– At any age have given average energy
Song et al, APP 14 (2000) 7

Energy Deposited in Atmosphere
• The energy deposited by an electron depends on its energy– The average electron
energy depends on the age, but also on the model
– At any age have given average energy
– Average over all ages• New version of QGSJet
gives 10% different <dE/dx>
Song et al, APP 14 (2000) 7

Fluorescence Yield
• Each MeV deposited in the atmosphere gives some number of fluorescence photons– Use fit to FLASH,
Nagano and Kakimoto results
• This is Kakimoto * (1.00±0.06)
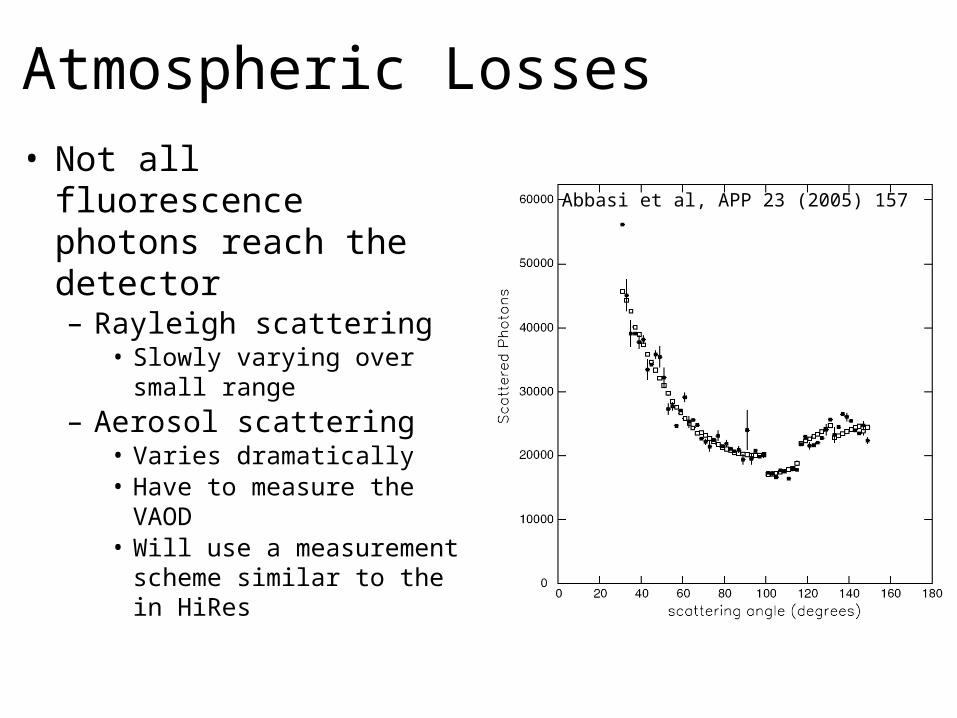
Atmospheric Losses
• Not all fluorescence photons reach the detector– Rayleigh scattering
• Slowly varying over small range
– Aerosol scattering• Varies dramatically• Have to measure the
VAOD• Will use a measurement
scheme similar to the in HiRes
Abbasi et al, APP 23 (2005) 157
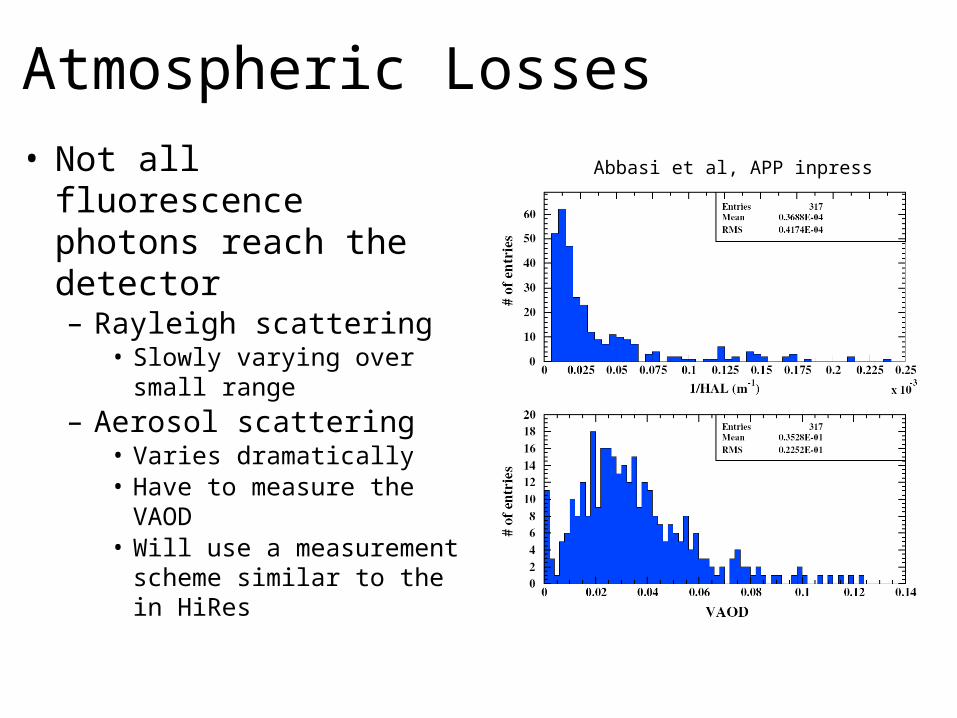
Atmospheric Losses
• Not all fluorescence photons reach the detector– Rayleigh scattering
• Slowly varying over small range
– Aerosol scattering• Varies dramatically• Have to measure the
VAOD• Will use a measurement
scheme similar to the in HiRes
Abbasi et al, APP inpress
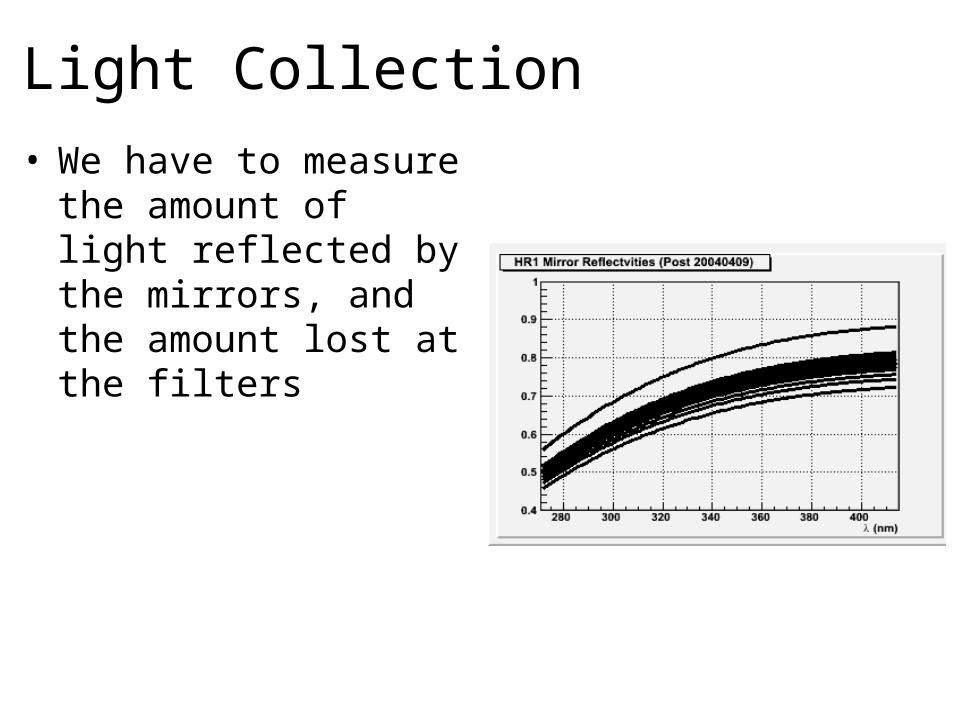
Light Collection
• We have to measure the amount of light reflected by the mirrors, and the amount lost at the filters

Photometric Calibration
• The response of each PMT must be adjusted and calibrated.
• Can calibrate many mirrors with one source at Middle Drum!– Will include mirror and
filter losses

Photometric Calibration
• The response of each PMT must be adjusted and calibrated.
• Can calibrate many mirrors with one source at Middle Drum!– Will include mirror and
filter losses• Will also have an
electron beam!– End-to-end calibration
with a known Ne

Fitting Showers
• Have to fit profile in data to a parametric form– Gaussian in “age”– Gaisser-Hillas

Fitting Showers
• Have to fit profile in data to a parametric form– Gaussian in “age”– Gaisser-Hillas
• Gaisser-Hillas works well for HiRes, we’ll use it in TA too

Data/MC Comparisons
• Have to put all of the above into the detector simulation
• How does one know that the simulation is right?– Any and all distributions observed in the data
should be able to be reproduced by MC– Any distribution that does not agree between data
and MC is a systematic error– To the level one can tell that distributions agree
lets one assign systematic uncertainties

The Aperture Calculation
• For FD, MC is needed to calculate the aperture– How can we be confident
in the calculation?• Data/MC comparisons
– Which distributions are most important?
• How far away (RP)• What directions (θ or Ψ)• How much light (shower
brightness)• Xmax (if cutting on shower
shape parameters)Abbasi et al, APP inpress

Outline
• Working from what we know to what we wish to know– Fluorescence Detector Energy Scale– Surface Detector Energy Calibration using the
Fluorescence Detector– Using the Surface Detector at the High Energies

From the FD to the SD Energy
• Geometric Reconstruction– Hybrid reconstruction gives both FD and SD
reconstruction resolution• SD Energy Reconstruction
– MIP normalization of counter response– S(1000) vs EFD – Attenuation correction– LDF slope compared to Xmax
– Rise time compared to Xmax (no muons!)
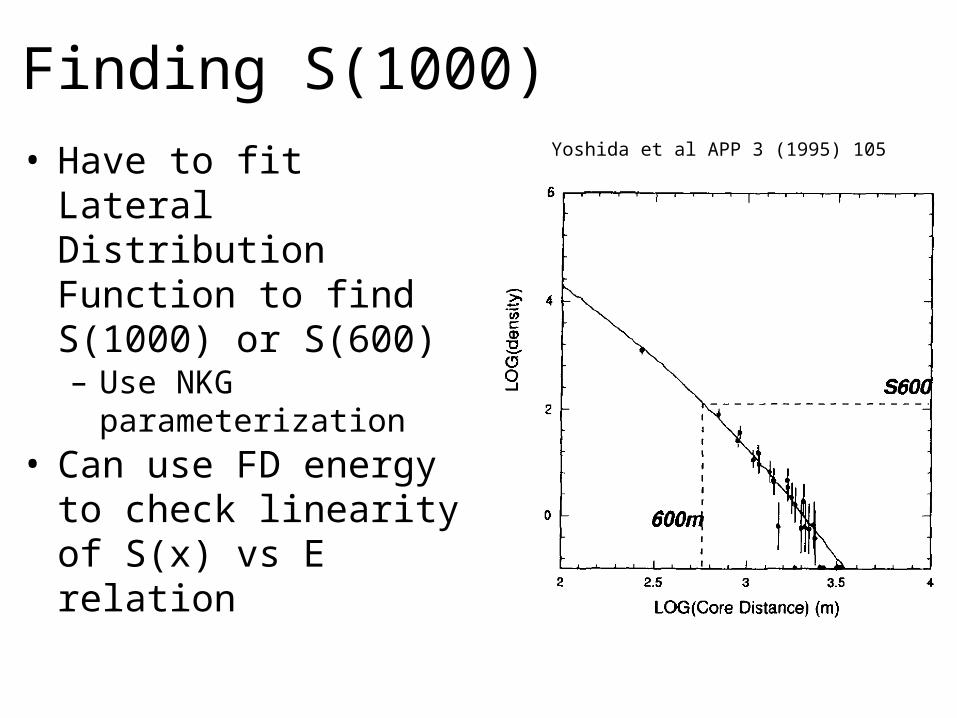
Finding S(1000)
• Have to fit Lateral Distribution Function to find S(1000) or S(600)– Use NKG
parameterization• Can use FD energy to
check linearity of S(x) vs E relation
Yoshida et al APP 3 (1995) 105

Attenuation Corrections
• Can get attenuation correction from data using hybrid without making constant intensity cuts– But only at energies with
sufficient hybrid data
Sakaki et al 27th ICRC (2001) 333

Rise time compared to Xmax
• TA can measure the rise time of the shower front (and how it changes with distance from core)
• Can be used to measure composition
Walker & Watson JPG 7 (1981) 1297

Outline
• Working from what we know to what we wish to know– Fluorescence Detector Energy Scale– Surface Detector Energy Calibration using the
Fluorescence Detector– Using the Surface Detector at the High Energies

SD at the Highest Energies
• Highest half-decade in energy is just SD– 10% FD duty cycle
• Extrapolations– Extrapolate S(1000) vs E and attenuation– Base the extrapolation on MC– Check MC by Data/MC comparisons
• LDF Slopes– If linearity changes differently between data and MC, will LDF
slope distribution show it?
• Rise times– Showers only accurately modeled if rise times agree in data and
MC
• Zenith Angle Distribution


