
The Supply of Physician Assistants, Nurse Practitioners, and Certified Nurse
Midwives in Arizona
A report prepared for the:
J. Tabor, N. Jennings, L. Kohler, B. Degnan, D. Derksen, D. Campos-Outcalt, & H. Eng
Center for Rural Health Mel and Enid Zuckerman College of Public Health
The University of Arizona | June 2014

i
Acknowledgements The Supply of Physician Assistants, Nurse Practitioners, and Certified Nurse Midwives in Arizona was
produced by the Center for Rural Health (CRH), at the University of Arizona (UA) Mel and Enid
Zuckerman College of Public Health (MEZCOPH) and funded by the Arizona Area Health Education
Centers Program (AzAHEC).
We thank the Arizona State Board of Nursing, the Arizona Regulatory Board of Physician Assistants, the
Arizona State Association of Physician Assistants for providing data used in the analysis. Special thanks
are given to Cynthia Reilly, Randy Danielsen, and Rick Dehn.
Authors, Affiliations, and Contributions
Joe Tabor, Assistant Professor, CRH UA -Tucson, principal investigator.
Nick Jennings, DrPH graduate student, Public Health Policy & Management Section, MEZCOPH UA-
Tucson, data processing and report preparation.
Lindsay Kohler, PhD graduate student, Epidemiology Division, MEZCOPH UA-Tucson, data analysis and
report preparation.
Bill Degnan, MPH student, Biostatistics Division, MEZCOPH UA-Tucson, statistical analysis.
Dan Derksen, Professor & CRH Director UA-Tucson, co-investigator.
Doug Campos-Outcalt, Professor & Chair of Family & Community Medicine, UA-Phoenix, co-investigator.
Howard Eng, Assistant Professor, CRH UA-Tucson, co-investigator.

ii
Acronyms
ACA Patient Protection and Affordable Care Act
AHCCCS Arizona Health Care Cost Containment System is Arizona’s Medicaid agency
AHEC Area Health Education Center Program
APRN advanced practice registered nurses
ARS Arizona Revised Statutes http://www.azleg.gov/ArizonaRevisedStatutes.asp
ASAPA Arizona State Association of Physician Assistants
Az Arizona
AzSBN Arizona State Board of Nursing
CAH critical access hospital
CI confidence interval
CMS US HHS’s Centers for Medicare and Medicaid Services
CNM certified nurse midwife
CON College of Nursing
CRH Center of Rural Health, the University of Arizona
DGME direct graduate medical education
DNP doctor of nursing practice
DPC direct patient care
Flex Medicare Rural Hospital Flexibility Program
FPL federal poverty level
FQHC federally qualified health centers
FTE full time equivalent
GME graduate medical education
HHS US Department of Health and Human Services
HIPAA Health Insurance Portability and Accountability Act
HPSA Health Professional Shortage Areas
HRSA US HHS’s Health Resources and Services Administration
IHS Indian Health Service
IME indirect medical education
IRS US Internal Revenue Service
Marketplace Health Insurance Marketplace
MUA/P medically underserved areas, and medically underserved populations
NHSC National Health Service Corp
NP nurse practitioner
PA physician assistant
RHC rural health clinic
RUCA rural-urban commuting area
SAS EG SAS Enterprise Guide
SHIP Small Rural Hospital Improvement Program
SPA state plan amendment
THC Teaching health centers
UA University of Arizona
US United States

iii
Contents Acknowledgements ........................................................................................................................................ i
Authors, Affiliations, and Contributions ........................................................................................................ i
Acronyms ...................................................................................................................................................... ii
Executive Summary ....................................................................................................................................... 1
1. Introduction .......................................................................................................................................... 2
1.1 Scope of Practice, Training Standards, Liability Insurance, and Reimbursement for Health
Services ..................................................................................................................................................... 3
1.2 Rural Urban Commuting Area ....................................................................................................... 4
1.3 Funding the Rural Health Infrastructure ....................................................................................... 5
1.4 Current Workforce ........................................................................................................................ 7
Arizona Current State Profile ................................................................................................................ 7
Age distribution of PA, NP, and CNM Providers ................................................................................. 10
Comparison to Other States ............................................................................................................... 12
2. PA, NP, and CNM Provider Surveys ..................................................................................................... 14
2.1 Respondent Demographics ......................................................................................................... 14
Ethnicity .............................................................................................................................................. 14
Age ...................................................................................................................................................... 14
Gender ................................................................................................................................................ 14
2.2 Educational Attainment .............................................................................................................. 16
2.3 Current Employment................................................................................................................... 17
Work Hours at Primary Practice Site ................................................................................................... 17
Payer Mix in Provider Practices .......................................................................................................... 19
Future Practice Plans .......................................................................................................................... 19
2.4 Factors Affecting Decision to Accept Current Primary Position ................................................. 26
2.5 Supply of PA, NP, and CNM providers ........................................................................................ 28
Limitations of Licensing Board Data when Estimating Arizona Workforce Capacity .......................... 28
3. Recommendations .............................................................................................................................. 32
Improve Data Collection ..................................................................................................................... 32
Improve the Workforce Supply and Distribution ................................................................................ 33
Improve the Workforce Utilization ..................................................................................................... 33
4. Conclusion ........................................................................................................................................... 33

iv
References .................................................................................................................................................. 34
Appendix 1: Methodology ...................................................................................................................... 38
Data Sources ....................................................................................................................................... 38
Licensing board data methods ............................................................................................................ 38
Survey methods .................................................................................................................................. 39
Rural assignment methods ................................................................................................................. 42
Statistical Analysis methods ................................................................................................................ 43
Distribution of Arizona’s Population, Providers, and Survey Respondents ........................................ 45
Appendix 2. Survey response data .......................................................................................................... 52
A2.1 Physician assistant licensure and survey data ............................................................................ 52
A2.2 Nurse Practitioner licensure and survey data ............................................................................ 60
A2.3 Certified Nurse Midwife data ..................................................................................................... 68

1
Executive Summary The Arizona Area Health Education Centers Program (AzAHEC) commissioned The Supply of Physician Assistants, Nurse Practitioners, and Certified Nurse Midwives in Arizona.
Assuring access to high quality health care requires:
1) An adequate supply and distribution of health services, through the training, recruitment, and
retention of the health workforce.
2) Efficient use of health practitioners practicing to the full extent of their education and training.
3) Physical, financial and timely access to high quality health care and services.
When this triad is off balance disparities in health outcomes appear. Health workforce data, trends and
analysis can alert policymakers to deficits in access, supply, distribution, and cost efficient use of health
services. These inform public and private sector interventions and policies to assure access to high
quality, high value health care for all Arizonans.
Arizona has a strong health infrastructure to build on, and unprecedented opportunities to transform its
health system. In rural Arizona, 15 critical access hospitals (CAHs), community health centers including
20 federally qualified health centers (FQHCs) with clinics in over 60 communities and rural health clinics
(RHCs) in over 20 cities, and Indian Health Service (IHS) sites in the Phoenix Area and Tucson Area IHS,
and others provide crucial health services, jobs, and economic benefits. Yet Arizona has unique
challenges – it has two large urban and many widely dispersed rural populations, a high percentage of
uninsured overall, and uninsured rates exceeding 30% in rural, border, Hispanic/Latino and American
Indian populations. Many face poverty, unemployment and limited access to health care.
Rural Arizona has fewer providers compared to urban areas. Overall 11% of PA, NP, and CNM providers
work in rural areas, and serve 15% of Arizona’s population. Most (89%) work in urban Arizona. Of the
3,068 nurse practitioners (NPs), 91% are in urban Arizona, of the 182 certified nurse midwives (CNMs)
82% and of the 2,039 physician assistants (PAs) 87% are urban. Too few providers delays necessary care,
worsens health outcomes and increases costs through greater hospital and emergency department use.
Oversupply is associated with unnecessary procedures, poorer health outcomes, and higher costs. Fine
scale geographical data, such as postal zip codes, can elucidate whether a population is underserved,
adequately served or oversupplied for specialty and primary care.
Primary carea is recognized as a cornerstone in population health. However, many physicians and other
clinical providers subspecialize and work in urban areas, reducing the primary care workforce in rural
areas. NPs, CNMs, PAs are crucial to primary care capacity and provide high quality care. Yet few studies
assess their important contribution to a well-functioning, accessible health system.
The Supply of Physician Assistants, Nurse Practitioners, and Certified Nurse Midwives in Arizona used
licensing board data, training and graduation numbers from PA and NP colleges, and interviews with
a The Institute of Medicine defined primary care as the provision of integrated, accessible health care services by
clinicians who are accountable for addressing a large majority of personal health care needs, developing a sustained partnership with patients, and practicing in the context of family and community. http://www.nap.edu/openbook.php?record_id=9153&page=1

2
individual PAs, NPs, and CNMs. The study calculates Arizona’s provider to population ratio, compares it
to the national average, reports the number of PA, NP, and CNM providers attending Arizona schools by
specialty and primary care, and estimates the number needed in Arizona to meet national benchmarks.
Recommendations are made to improve provider supply and distribution to areas of need, enhance
access to health care in rural areas, and increase the PA, NP, and CNM provider workforce.
Key Findings of the PA, NP, and CNM Arizona Workforce Study:
The Arizona health workforce is aging - 54% of CNMs, 41% of NPs, 26% of PAs are age 55 or older;
Many plan to retire in the next ten years;
Many choose where to practice based on job description and location;
Only 58% of PAs, 54% of NPs and 50% of CNMs accept new Medicare/Medicaid patients;
The majority of PAs, NPs, CNMs work in direct patient care, and over 40 hours a week;
Rural Arizona has fewer NP and PA providers per capita than urban areas;
Urban Arizona has fewer CNMs per capita than rural areas;
Most PA, NP, and CNM providers do not own their practice;
CNMs identified reimbursement rates as a reason to stop practicing in the next ten years;
The majority of PAs, NPs, and CNMs practicing in Arizona were recruited from other states;
Only 50 to 60% of the PAs and NPs trained in Arizona practice in Arizona;
There are numerous opportunities to address workforce shortages and improve access to high
quality, cost efficient health care in Arizona’s rural and urban underserved areas and populations.
1. Introduction
As the Patient Protection and Affordable Care Act (ACA) coverage provisions – Health Insurance
Marketplace (Marketplace), and Medicaid expansion – are progressing, demand for health care is
growing. The Supply of Physician Assistants, Nurse Practitioners, and Certified Nurse Midwives in
Arizona estimates the supply of PAs, NPs, and CNMs as crucial components of the state’s health
provider capacity. The study used licensing board data, training and graduation numbers from PA and
NP colleges, and interviews with providers. The study calculates Arizona’s provider to population ratio,
compares it to the national average, reports the number of PA, NP, and CNM providers attending
Arizona schools by specialty and primary care, and estimates the number needed in Arizona to meet
national benchmarks.
There are 100,388 PAs in the United States (US)1 and 2,039 (2.0%) in Arizona2; 180,233 US NPs3 and
3,068 (1.7%) in Arizona4; and 12,383 US CNMs5 and 182 (1.5%) in Arizona.4 Graduate level education is
required for each.
Primary care is a cornerstone of public and population health. Strengthening primary care as more are
covered by the Marketplace and by Medicaid (AHCCCSb) can reduce health disparities, improve
population health outcomes, and increase preventive services such as cancer screening. Yet, the primary
care workforce is insufficient to meet national needs.6 For example, many health professions students
b Arizona Health Care Cost Containment System is Arizona’s Medicaid agency, http://www.azahcccs.gov/.

3
choose to work in adequately served urban areas and to subspecialize to earn higher compensation. This
creates shortages of providers in inner city urban, poor and rural populations.7
1.1 Scope of Practice, Training Standards, Liability Insurance, and
Reimbursement for Health Services
As more are covered by AHCCCS and the Marketplace, public and private sectors must respond to
increased demand for health services. In Arizona, many areas are federally designated as Health
Professional Shortage Areas (HPSA)c for primary care, dental and behavioral health. Assuring a well-
trained and distributed health workforce requires timely data, analysis and interventions to address
shortages. The health professions training pipeline can be long, costly and inefficient in distributing
graduates to areas of need especially for physicians.d PAs, NPs, and CNMs practicing to the full extent of
their education and training can help assure access to high quality, cost efficient care.
Obstacles to health professions supply and distribution to areas and populations in need include state
scope-of-practice laws,8 institutional credentialing and privileging processes, liability insurance costs and
other factors that restrict practice. Intense professional ‘turf battles’ revolve around supervision, quality
of care, safety, education subsidies, preceptor (‘field faculty’) credentials at community based training
sites, and payment for services. Many states allow independent practice, and address liability costs
through insurance risk pools and other strategies.9, 10
Health practitioners are licensed, certified and otherwise regulated by boards, with state specific scope-
of-practice laws and regulations. Scope-of-practice includes legislation and licensing regulations on
provider procedures, practice, actions, that are permitted or prohibited, and overseen by state licensing
boards, for individual providers.11, 12, 13, 14, 15 Each state defines the scope-of-practice for health care
professionals licensed by the state.
Physician assistants perform physical examinations, diagnose and treat illness, order and interpret lab
tests, do procedures, assist in surgery, provide patient education and counseling and make rounds in
hospitals and nursing homes.16 They provide services under the supervision of a licensed physician.
Arizona PA regulations do not require supervising physician presence when a PA provides care, but
stipulate weekly meetings in person or by phone.14 PAs practice and prescribe medication in all 50
states.16 Median PA compensation is $91,000/yr.17 Insurance reimbursement for PA services is generally
85% of physician payment.18
Nurse practitioners provide a wide range of health services. They “take health histories and provide
complete physical exams; diagnose and treat acute and chronic illnesses; provide immunizations;
prescribe and manage medications and other therapies; order and interpret lab tests and x-rays; and
provide health teaching and supportive counseling.”19 In Arizona, NPs can perform health care facility
c HPSA http://hpsafind.hrsa.gov/
d Primary care physicians include family medicine, general pediatrics, general internal medicine and some
definitions include obstetrics/gynecology - require 3 to 4 years of residency, 4 years of medical (allopathic or osteopathic) school, and 4 years of undergraduate education.

4
admissions and discharges. Arizona is one of 18 states where NPs can practice without physician
supervision.20 Median NP compensation is $90,000/yr.21 Medicare NP reimbursement is 85% of the
physician rate.22
Certified nurse midwivese are licensed, independent providers with prescriptive authority in all 50
states.23 They provide primary and prenatal care to women including gynecological exams and family
planning, manage low-risk labor and delivery, and provide neonatal and newborn care.19 Practice
settings include hospitals, birthing centers, community clinics and patient homes.19 In Arizona, CNMs are
regulated by the State Board of Nursing (AzSBN) under the Nurse Practice Act. A CNM is allowed to care
for low risk clients, and is required to inform the client, both orally and in writing, of the midwife’s
scope-of-practice prior to providing care.13, 23 Median CNM compensation is $90,000/yr.24 Medicaid
CNM reimbursement is 90% of physician payment. CNM third-party reimbursement is mandated in
Arizona. In 2007, Arizona CNMs delivered 5,389 babies and accounted for 5.2% of births.11, 25
Scope-of-practice limits procedures, actions, and care permitted to assure quality and safety. However,
they can create market distortions that impair efficient care delivery and fair payment for services. For
example, federally designated rural health clinics (RHCs)f are exempt from state scope-of-practice laws,
receive special Medicare and Medicaid reimbursement, and NPs receive the same Medicare payment
rate as primary care physicians.20, 26, 27, 28 In other practice sites in Arizona, NPs and CNMs are paid 90%
of AHCCCS/Medicaid physician payment. Addressing PA, NP and CNM scope-of-practice and
reimbursement policies may expand primary care capacity in underserved rural and urban areas.11
Organizations can maximize the efficient output of workforce services through the use of economic
production functions29 and manage their workforce accordingly. Hospitals and practice sites verify
licensing and board certification, approve and credential providers to practice in inpatient and
outpatient settings, and can restrict or expand provider scope-of-practice in their facilities. Thus, scope-
of-practice varies widely between states and within institutions. Scope-of-practice can be expanded
though formal degree programs, board certification, supervision (ex. PAs), and through employment in
supportive systems such as CNMs in New Mexico (See page 12, Comparison to Other States).
1.2 Rural Urban Commuting Area There are significant demographic, economic, and infrastructural differences between urban and rural areas. For example, rural areas have fewer health resources available, average incomes are lower, risks from traumatic injuries are higher, and male suicide rates are higher.30 Federal and state governments and agencies implement laws, regulations and policies that can mitigate or exacerbate the root causes of the health disparities between rural and urban, racial, ethnic and socioeconomic populations. The Supply of Physician Assistants, Nurse Practitioners, and Certified Nurse Midwives in Arizona
stratified the state health workforce by urban and rural areas to improve the power of the analysis and
e CNMs are not the same as Licensed Midwives who are licensed by AzDHS http://www.azdhs.gov/als/midwife/
f RHCs are federally qualified health clinics located in medically underserved areas. http://www.hrsa.gov/healthit/toolbox/RuralHealthITtoolbox/Introduction/ruralclinics.html

5
the quality of the results. There is no single, universally preferred definition of rural. Useful definitions of
rural include:
Rural-urban commuting areas (RUCAs) - define degrees of rural and urban by their proximity to
urban areas and the portion of the populations that commute from rural to urban areas.31 This is the
rural classification system used in this report.
The U.S. Census Bureau - bases rurality on a combination of population density, relationship with
cities, and population size.
The Office of Management and Budget (OMB) - classifies counties on the basis of their population
size and integration with large cities.
The U.S. Department of Agriculture - bases rurality on typology that identifies groups of U.S. non-
metropolitan counties sharing important economic and policy traits.
The Department of Health and Human Services (HHS) Administration on Aging - uses the Census
Bureau urbanized area definition and postal zip code boundaries to classify urban or rural zip codes.
The State of Arizona - defines rural as (1) a county with a population < 400,000 persons according to
the most recent US decennial (every 10 years) census, and (2) a census county division with < 50,000
persons in a county with a population of 400,000 or more persons from the most recent census.g
The rural-urban commuting areas (RUCAs) classification system was established by the University of
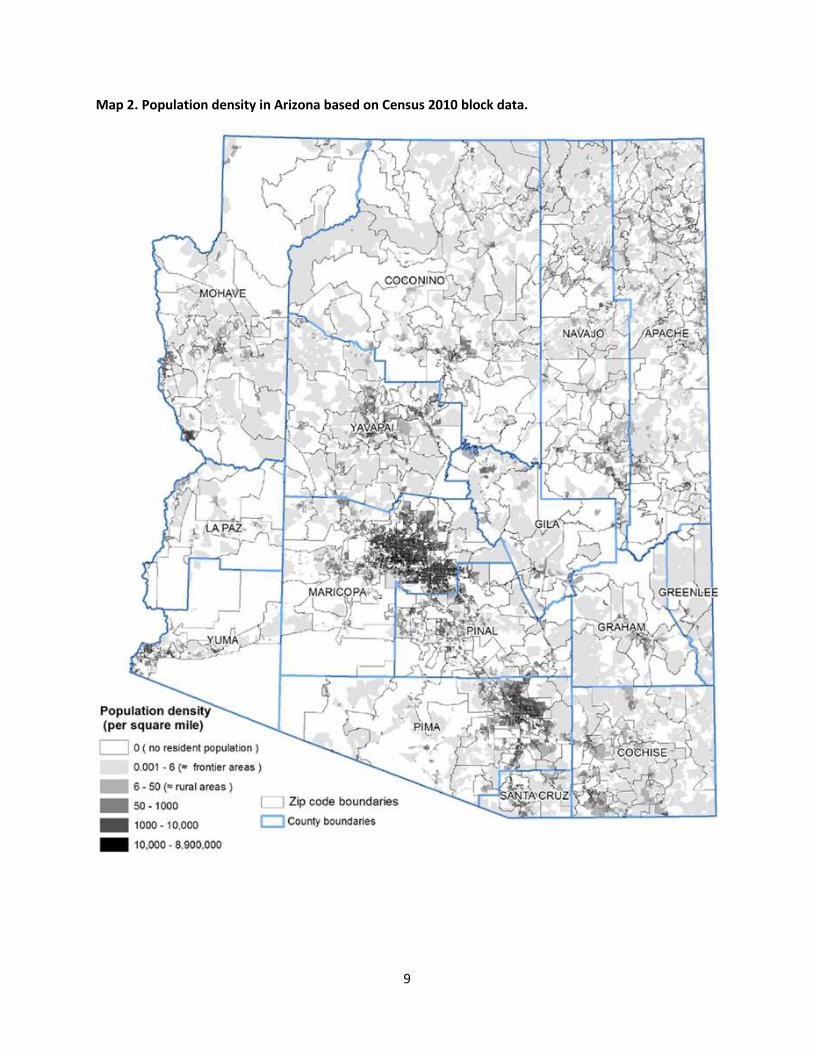
Washington’s Rural Health Research Center. Map 1 illustrates RUCAs. Map 2 shows fine scale variability
in Arizona’s population density with respect to countyh and zip code boundaries. These illustrate
population coverage by providers and survey participation by profession (Maps A2.1-A2.6). See
Appendix 1 for additional information on rural classifications used in this report.
Scoring for federal funding is based on the specific rural definition criteria used. For example, over 30
federal programs use the Health Professional Shortage Areas, Medically Underserved Areas, and
Medically Underserved Populations (HPSA, MUA/P) scoring criteria. Scoring also affects funding for
communities to receive National Health Service Corp (NHSC) loan repayment to attract providers to
practice in rural areas, the Conrad 30 J-1 Visa Program that supports physicians to practice in
underserved areas, telehealth, RHCs, Community Health Center funding, enhanced Medicare/Medicaid
payment, Area Health Education Center funding and other programs intended to improve rural health.
See Section 1.3.
The HHS’s Health Resources and Services Administration (HRSA) defines frontier areas for federal
funding purposes as “sparsely populated rural areas that are isolated from population centers and
services.”i
1.3 Funding the Rural Health Infrastructure
Rural health funding includes grants, tax and assessment subsidies, tax exemptions, and other sources.
g A.R.S. 36-2171. (2004) http://www.azleg.gov/arizonarevisedstatutes.asp?Title=36.
h Arizona has 15 very large counties compared to states with many small counties. For example, Pima County, at
9,186 sq. miles, population 992,394 is the size of Vermont (9,614 sq. miles, pop. 626,011 and 14 counties). i What it the definition of frontier? http://www.raconline.org/topics/frontier/faqs/

6
Examples of funding supporting rural health infrastructure and services include: 1) Grants include private foundations, federal, state and other funding. Grant programs that support
rural health include:
Area Health Education Center Program – AzAHEC partners with five regional centersj focused on
developing integrated, sustainable statewide health professions workforce education programs with
emphasis on primary care and increasing access in Arizona’s rural and underserved communities.
Medicare Rural Hospital Flexibility Program (Flex) - improves access to and assures the fiscal viability
of America’s smallest and most vulnerable rural hospitals. Arizona’s Flex Program includes 15
critical access hospitals (CAHs) and assists with quality and performance improvement, integrates
emergency medical services within the health system, and stabilizes rural hospital finances;
Small Rural Hospital Improvement Program (SHIP) - supports quality improvement and reporting,
meaningful use of health information technology, implementation the prospective payment system
and the Health Insurance Portability and Accountability Act (HIPAA).
State Offices of Rural Health Program – is a focal point for rural health issues in each state. AzSORHk
is housed in the UA Center for Rural Health. The CRH includes Arizona’s Flexl and SHIPm Programs.
2) Tax and Assessment Subsidies
State subsidies to support rural health are generated by revenues from assessments and/or taxes on
income, gross receipts, property, hospital, business, tobacco, alcohol, sugared beverages, fast foods,
and others. Arizona examples include the Rural Hospital Inpatient Fund Payments, a $2 per pack
excise tax on cigarettes that supports AHCCCS (Arizona’s Medicaid program) and smoking cessation
services; state general fund dollars that support critical access hospitals through AHCCCS
supplemental payments for uncompensated care (CAH pool); and an assessment on hospitals that
helps the state pay its share of restoring AHCCCS eligibility to 100% of the Federal Poverty Level
(FPL) for childless adults. Tobacco settlement dollars are used to pay a portion of the state share of
costs related to the expansion of Medicaid to 100% FPL that occurred by voter mandate in 2000.
Provider (hospital) assessments cover the costs of that expansion, and restoration in 2013, not
covered by tobacco settlement dollars.
State-Federal Programs - states levy taxes and assessments to help pay the state’s share of Medicaid
costs. States changing provider payment methodology must submit a state plan amendment (SPA)
to the Centers for Medicare and Medicaid Services (CMS). CMS makes sure that such payments “are
consistent with efficiency, economy and quality of care and are sufficient to enlist enough providers
so that the care and services are available under the plan at least to the extent that such care and
services are available to the general population in the geographic area.”n
Medicare and Medicaid graduate medical education (GME) direct (DGME) and indirect (IME)
payments to teaching hospitals support resident training. Medicare and Medicaid pay $13 billion
per year to teaching hospitals. Forty states participate in Medicaid direct and/or indirect GME with
j AzAHEC at: http://azahec.ahsc.arizona.edu/
k AzSORH http://crh.arizona.edu/programs/sorh
l Az Flex http://crh.arizona.edu/programs/flex m
Az SHIP http://crh.arizona.edu/programs/ship n Medicaid Financing and Reimbursement: http://www.medicaid.gov/Medicaid-CHIP-Program-Information/By-
Topics/Financing-and-Reimbursement/Financing-and-Reimbursement.html

7
$3.8 billion/year paid to teaching hospitals. Arizona eliminated its general fund support of Medicaid
GME, but allows teaching hospitals to pay the state share of Medicaid GME expense.
Teaching health centers (THC) support increasing the number of primary care residents and dentists
trained in ambulatory patient care settings, but funding must be reauthorized in 2016. Example: if
Arizona restored Medicaid GME funding, submitted a state plan amendment to CMS to request that
qualified teaching hospitals, and the new THC in Flagstaff, AHCCCS GME could be used to finance
and help move the health professions training pipeline, including contemporary interprofessional
team based training and care delivery, into areas of need.
Other rural health federal subsidies – include disproportionate share hospital (DSH) Medicare and
Medicaid payments, community health center funding, and National Health Service Corps
scholarships and loan repayment to attract health providers to practice in rural areas.
3) Tax exemptions – nonprofit hospitals and other health delivery entities often receive city, county,
state and federal tax exemptions and discounts in exchange for demonstrating community benefit
such as charity care. ACA Section 9007 expands and standardizes financial assistance policies,
requires a community health needs assessment every three years, and standardizes hospital
charges, billing and collection practices. All tax exempt organizations must submit an IRS Form 990
Schedule H, “Charity Care and Certain Other Community Benefits at Costs” detailing a hospital’s
unreimbursed costs for: means tested government programs including Medicaid, health professions
education, community benefit operations and improvement services, and subsidized health services.
1.4 Current Workforce
The aging US population coupled with ACA coverage expansion contribute to health workforce
shortages. By 2030, 78 million baby boomers will reach or exceed age 65.32 ACA is projected to cover 26-
32 million uninsured over the next 10 years.33 The health workforce is aging. Over 40% of NPs are over
50, many will retire in the next 10 to 15 years.34 How will retirements from an aging workforce affect
rural areas?35
The national forecast is for significant primary care physician shortages36, 37 even with PA supply
increases.38 Arizona’s population will increase by 2.3 million (35%) by 203039 and increase the demand
on the health care system. Will NPs, PAs and CNMs fill the gap, especially in rural areas?36, 40, 41
Arizona Current State Profile
As of 2013, there are 2,005 PAs, 3,068 NPs and 182 CNMs with an active license and practice address in
Arizona. The majority reside in urban areas including Phoenix and Tucson (Table 1). Per capita NPs are
higher in urban than rural areas, while PAs are nearly equally distributed and CNMs are higher for rural
areas (3.43 per 100,000) than urban areas (2.74 per 100,000) (Table 2). PA and NP per capita supply is
low in rural Arizona compared to the US. Arizona’s rural CNM supply is above the national average.

8
Map 1. Location of rural-urban commuting areas (RUCA v2) based on postal zip code geography and Census 2000 data.
9
Map 2. Population density in Arizona based on Census 2010 block data.

10
Table 1. Number of PA, NP, and CNM providers in Arizona by RUCA classification 20132, 4
Table 2. Coverage of PA, NP, and CNM providers in Arizona per 100,000 population.2, 4, 42
Age distribution of PA, NP, and CNM Providers
Age is included in Arizona State Board of Nursing’s NP and CNM data, but not in Arizona Regulatory
Board of Physician Assistants’ data. PA age was estimated from graduation dates. For PAs with missing
graduation dates, the age was imputed using the average age of all the PAs in the licensure data. PA age
estimates were consistent with the Arizona State Association of Physician Assistants’ (ASAPA) 2012
survey data, where 46% were < 40 years old. The majority of PA respondents were either from
Generation X (1965-1979) or the Millennial Generation (1980-2000).43
Physician Assistant Age Distribution
The majority (52%) of Arizona PAs is under age 40; the age distribution is similar for urban and rural
areas (Figure 1). Retirement of the PA workforce in the next 10 years is less of a factor than for NPs.
o Data in table based on June 2013 PA data. December 2013 total was 2039 licensed PAs that reside in Arizona.
Rural Urban Commuting
Area Classification
Population
(Census 2010)
# of Licensed
Physician
Assistantso
# of Licensed
Nurse
Practitioners
# of Licensed
Certified Nurse
Midwives
Urban 5,430,946 1,751 2,781 149
Large Rural Town 474,811 138 150 7
Small Rural Town 378,765 95 111 24
Isolated Small Rural
Town 107,226 21 26 2
Total 6,391,448 2,005 3,068 182
Rural Urban Commuting Area Classification
Population Coverage Per 100,000 (Census 2010)
Physician
Assistants
Nurse
Practitioners
Certified Nurse
Midwives
Urban 32.2 51.2 2.7
Large Rural Town 29.1 31.6 1.5
Small Rural Town 25.1 29.3 6.3
Isolated Small Rural Town 19.6 24.3 1. 96
United States Average 27.0 58.0 2.9

11
Figure 1. Number of active licensed physician assistants by age grouping for urban and rural areas.
Nurse Practitioner Age Distribution
Many Arizona NPs are nearing retirement age. About 31% of the actively licensed nurse practitioners are
over age 55 (Figure 2). Some may have deferred retirement due to the recession and may retire as soon
as the economy recovers. The NP age distribution is similar for urban and rural areas.
Figure 2. Number of active licensed nurse practitioners by age grouping for urban and rural areas.
Certified Nurse Midwives Age Distribution
The number of Arizona CNMs is small. Only 24 (13%) of the CNMs are under the age of 40. About 46% of
urban CNMs and 70% of the rural CNMs are over age 55, may retire in the next 10 years, and reduce
providers caring for pregnant women, especially in rural Arizona (Figure 3).
600 500 400 300 200 100 0 100
25-29
30-34
35-39
40-44
45-49
50-54
55-59
60-64
65-69
70-74
Rural
Urban
500 400 300 200 100 0 100
20-24
25-29
30-34
35-39
40-44
45-49
50-54
55-59
60-64
65-69
70-74
75-79
80 +
Rural
Urban

12
Figure 3. Number of active licensed certified nurse midwives by age grouping for urban and rural areas.
Comparison to Other States
Many states face health workforce shortages (Table 3). For example, New Mexico estimated that the
current 1,327 advanced practice registered nurses (APRNs)p are 285 short for serving its 2.1 million
residents.44 New Mexico has 63.2 APRNs (57 NPs) per 100,000 population and needs 76.8 per 100,000.
Arizona has 56.3 APRNs (45 NPs) per 100,000 population - less than New Mexico.4, 42, 44, 45
New Mexico’s CNMs combine high quality care at lower cost,44 ranking 2nd nationally in per capita CNMs,
and 1st in attended births (Table 3). Its infant mortality rate (5.7 per 1000 live births) is the 13th lowest
nationally even though it has the 3rd highest poverty and teen pregnancy rates (48.8 births per 1000).
CNMs delivered babies in 23 of New Mexico’s 33 counties with the majority in Albuquerque and Las
Cruces hospitals.46, 47, 48 The low mortality rates are attributed to ready access to CNMs, socio-
demographics factors,49, 50 team-based medical care, and in-house back up by obstetricians,
neonatologists, and perinatologists.
Washington (population 6.7 million) has health workforce shortages with 3,811 licensed NPs (56.5 per
100,000), 2,621 licensed PAs (38.9 per 100,000), and 258 CNMs (3.8 per 100,000).45, 46, 51 In 2012 the
Washington Health Care Personnel Shortage Task Force identified gaps between supply and demand for
both nurses and PAs.52 The state implemented policies to increase training program completion rates
and increased PA graduates by 16%.52
Nevada has health workforce shortages.53 It has 613 licensed PAs (23 per 100,000), 718 licensed NPs
(26.0 per 100,000), and 23 CNMs (0.8 per 100,000).46, 51, 54 Nevada ranks 34th for PAs, 47th for CNMs, and
51st for NPs. Much of Nevada is federally designated as a HPSA.53 The shortages are magnified by an
aging population, large rural areas, and a high percentage of uninsured expected to gain coverage.53
p Advance practice registered nurses include NPs, CNMs, certified registered nurse anesthetists, and clinical nurse
specialists.
50 40 30 20 10 0 10 20
25-29
30-34
35-39
40-44
45-49
50-54
55-59
60-64
65-69
70-74
Rural
Urban

13
Arizona faces similar challenges. It has 947,878 of its 1.2 million uninsured eligible for Marketplace or
Medicaid coverage.55 Arizona has over 2 million (31%) over age 50.42 Those >50 are higher users and
thus more costly.56 These factors increase demand on the state’s health workforce, especially for
primary care and direct care workersq that are needed in nursing homes, long-term-care facilities,
hospice agencies, and homes.57
Table 3. State rankings for the number of practicing PA, NP, and CNM providers per population and number of CNM attended births per total births46, 51, 54
State PA NP CNM
State PA NP CNM
per population per births per population per births
AL 49 47 51 3 (19%) MT 4 33 22 16 (9.7%)
AK 1 4 1 2 (20.8%) NE 7 34 46 35 (5.1%)
AZ 28 30 20 32 (5.2%) NV 35 51 48 44 (4.2%)
AR 48 6 49 51 (0.6%) NH 10 2 7 5 (15.4%)
CA 41 42 31 23 (7.6%) NJ 45 26 19 20 (8.2%)
CO 6 25 6 22 (7.8%) NM 30 31 2 1 (33.3%)
CT 9 5 5 15 (9.7%) NY 19 10 10 14 (10%)
DE 26 13 26 41 (4.3%) NC 11 46 36 13 (10.7%)
DC 3 1 9 40 (4.3%) ND 14 17 43 45 (4.0%)
FL 34 19 15 12 (10.7%) OH 42 41 28 27 (7.1%)
GA 33 38 13 8 (14.7%) OK 29 50 45 46 (3.3%)
HI 43 23 27 42 (4.3%) OR 22 21 8 6 (15.3%)
ID 13 45 41 43 (4.3%) PA 20 28 30 17 (9.6%)
IL 38 49 33 29 (5.9%) RI 32 22 12 11 (12.9%)
IN 46 40 44 34 (5.2%) SC 40 14 37 36 (4.9%)
IA 27 44 29 30 (5.4%) SD 2 29 24 26 (7.1%)
KS 21 15 34 39 (4.5%) TN 39 7 38 33 (5.2%)
KY 36 18 32 37 (4.8%) TX 37 48 42 48 (2.6%)
LA 44 36 50 50 (1.4%) UT 24 37 21 21 (8.1%)
ME 5 9 11 7 (15.1%) VT 8 12 3 4 (18.3%)
MD 18 27 17 28 (6.7%) VA NA 11 23 38 (4.5%)
MA 23 3 4 10 (13.4%) WA 31 32 16 19 (9.1%)
MI 17 43 25 31 (5.3%) WV 15 39 18 9 (13.9%)
MN 12 35 14 18 (9.1%) WI 25 24 35 25 (7.4%)
MS 50 8 47 49 (2.0%) WY 16 16 40 24 (7.5%)
MO 47 20 39 47 (3.1%) Rankings are based on # of providers per 100,000 population, and # of CNM attended births per # total births (%)
q “Nurse aides, home health aides, and personal and home care aides -- are the primary providers of paid hands-on
care for more than 13 million elderly and disabled Americans. They assist individuals with a broad range of support including preparing meals, helping with medications, bathing, dressing, getting about (mobility), and getting to planned activities on a daily basis.”
57

14
2. PA, NP, and CNM Provider Surveys
Three web-based health workforce survey instruments were developed and administered to amplify
Arizona licensing board data. Questions included demographics, practice status, educational attainment,
future practice plans, and factors influencing practice location. Response rates were 9.7% for PAs, 11.3%
for NPs and 23.0% for CNMs. Refer to Appendix 1 for Methodology details.
2.1 Respondent Demographics
Ethnicity
The majority (86%) of PA, NP, and CNM provider survey respondents self-identified as White - 95% of
CNMs and 86% of NPs and PAs (Table 4). This reflects the makeup of the overall population from 2010
Census data, where 84% of Arizonans reported being White.42 The results also correlate with the 2012
ASAPA survey that reported 86.9% of PA respondents were White.43
Table 4. PA, NP, and CNM survey response by provider type and ethnicity.
Ethnicity CNM NP PA
American Indian or Alaskan Native 1 1 7
Asian / Pacific Islander 0 8 12
Black or African American 0 4 7
Hispanic 0 15 24
Other 1 20 34
White / Caucasian 40 298 499
Total 42 346 583
Age
The age distribution of survey participants by urban and rural practice locations (Figures 4-6) correlated
well with the data obtained from the Arizona license boards for PAs, NPs, and CNMs (Figures 1-3). The
survey did not show selection bias due to age.
Many of the survey respondents are nearing retirement age. Over 37% of respondents reported being
age 55 or older. Retirement will affect the CNM workforce quickly as 54% of CNM respondents reported
being over age 55, followed by NPs (41%) and PAs (27%). Retirement and reduction of direct patient
care effort decrease capacity. Current and near term public and private sector policies and the economy
will impact near term provider practice decisions, and in turn affect rural access to health care.
Gender
A high proportion of the respondents were female (Table 5). Survey results correlate well with the state
licensing board data. Over 90% of NP survey respondents and state board data licensees are female. For
PAs, gender is not reported in the license data. PA survey respondents were 60% female and 40% male.
These results are similar to the 2012 ASAPA survey that reported 57.5% female respondents and 42.5%
male respondents.

15
Figure 4. Count of physician assistant respondents in urban and rural areas by age group.
Figure 5. Count of nurse practitioner respondents in urban and rural areas by age groups.
Figure 6. Count of certified nurse midwife respondents in urban and rural areas by age groups.
35 25 15 5 5 15
25-29
30-34
35-39
40-44
45-49
50-54
55-59
60-64
65-69
70-74
Rural
Urban
60 40 20 0 20
25-29
30-34
35-39
40-44
45-49
50-54
55-59
60-64
65-69
70-74
75-79
80 +
Rural
Urban
10 8 6 4 2 0 2 4
25-29
30-34
35-39
40-44
45-49
50-54
55-59
60-64
65-69
70-74
75-79
80 +
Rural
Urban

16
Table 5. Comparison of gender distribution of survey respondents to license data.2, 4, 43
CNM
Survey CNM License Board Data
NP Survey
NP License Board Data
PA Survey
ASAPA 2012 Survey
Male 0 1 35 (10%) 285(9.2%) 78 (40%) 135 (42.5%)
Female 42 (100%) 181(99.9%) 311 (90%) 2,783(90.7%) 117 (60%) 183 (57.5%)
Total 42 182 346 3,068 195 318
2.2 Educational Attainment
The majority of PA, NP, and CNM providers responding to the workforce surveys had advanced training
and education beyond a bachelor’s degree: 76% of PA respondents, 96% of NPs, and 74% of CNMs had
at least a master’s degree. Many older PAs began practice with bachelor’s degrees, and is reflected in
the large number of PA respondents selecting “Other” (Table 6).
Table 6. Respondent’s highest level of educational attainment.
Nu
rsin
g D
iplo
ma
AS
in
Nu
rsin
g
BS
in
Nu
rsin
g
MS
in
Nu
rsin
g
MN
MS
in P
A
Stu
die
s
MM
S
Ph
D
EdD
DN
P
ND
DH
SC
Oth
er
No
t
An
swe
red
Tota
l
CNM 1 3 0 26 3 7 2 42
NP 4 9 245 31 18 1 21 1 16 346
PA 1 4 1 78 33 1 3 40 34 195
AS -Associate of Science, BS - Bachelor of Science, MS - Master of Science, MN - Master of Nursing, MMS - Master of Medical Science, DNP - Doctorate of Nursing Practice, DHSC - Doctorate of Health Science
Many PA, NP, and CNM providers who received their degree in Arizona are choosing to practice in the
state (Table 7): 50% of PA respondents, 59% of NP respondents, and 71% of CNM respondents reported
receiving degrees in Arizona. This correlates with state license data (Figure 18). PA data are consistent
with the ASAPA study43 (48%) and Arizona Regulatory Board of Physician Assistants (47%) data.
Table 7. Proportion of Licensed Providers Receiving Professional Degrees in Arizona.
Profession # of survey
respondents Received degree in
Arizona Survey
estimate Licensing
board data
CNM 42 30 71% N/A
NP 346 205 59% N/A
PA 195 98 50% 47%
Total 583 333 57%

17
2.3 Current Employment
Work Hours at Primary Practice Site
Rural PAs, NPs and CNMs spend more time each week at their primary practice site than their urban
counterparts (Figure 7), but much of this time is spent on non-patient care (Figures 7 and 8).
Figure 7. Average hours spent per week at primary practice site.
Figure 8. Average hours spent per week on direct patient care.
The average time spent on research for respondents is small (Figure 9). Overall, 64% did not respond to
the question, while the most frequent response (29%) was less than five hours per week.
0
10
20
30
40
50
60
70
80
90
100
Urban Rural Urban Rural Urban Rural
Physician Assistants Nurse Practitioners Certified NurseMidwives
% o
f R
esp
on
dan
ts
>40 hours
20-40 hours
<20 hours
0
10
20
30
40
50
60
70
80
90
100
Urban Rural Urban Rural Urban Rural
Physician Assistants Nurse Practitioners Certified NurseMidwives
% o
f R
esp
on
dan
ts
No response
>40 hours
20-40 hours
<20 hours

18
Figure 9. Average hours per week spent on research.
The majority of providers commuted less than one hour each day to their primary practice (69.8%) while
less than 2% commuted more than 2 hours each day (Figure 10).
Figure 10. Provider round-trip commute times to primary practice.
0
10
20
30
40
50
60
70
80
90
100
Urban Rural Urban Rural Urban Rural
Physician Assistants Nurse Practitioners Certified NurseMidwives
% o
f R
esp
on
dan
ts
No response
>40 hours
20-40 hours
<20 hours
0
20
40
60
80
100
Urban Rural Urban Rural Urban Rural
Physician Assistants Nurse Practitioners Certified NurseMidwives
% o
f R
esp
on
dan
ts
No response
>4 hours
2-4 hours
1-2 hours
<1 hour

19
Payer Mix in Provider Practices
Providers were asked to estimate the percentage of payers in their practice. These did not always add
up to 100%. Some providers may not know the payer mix in their practice (Figure 11).
Figure 11. Provider estimates of payer mix percentages in their practice.
Future Practice Plans
The survey asked about plans to retire within 10 years, and by urban versus rural practice (Figures 2 and
12, and Table 8). Those with plans to retire within ten years (n=144) averaged 60 years old (range 36-
74); in >10 years (n=215) age 44 (range 25-69); and with no plans to retire (n=153) age 43 (range 26-72).
Those that did not respond (n=71) were on average 54 years old (range 30-76). All three professions
have similar workforce losses to retirement. NPs will have the greatest and most immediate workforce
losses (Figure 2). The relatively large proportion of rural PAs planning to retire (Figure 12) was likely due
to disproportionate participation of older PAs practicing in rural areas (compare Figures 1 with 4).
0
10
20
30
40
50
60
70
80
90
Urban Rural Urban Rural Urban Rural
Physician Assistants Nurse Practitioners Certified NurseMidwives
Me
an %
Payment Type Estimated by Provider
Medicare
Medicaid
Tricare/VA/IHS
Private
Self pay
Bad debt/Charity
Other

20
Figure 12. Provider plans to retire.
Table 8. Provider plans to retire within 10 years
n Average Age (years) Std. Dev. (years) Age Range
Physician Assistants
Urban 33 60.0 8.2 36-74
Rural 14 59.8 6.9 43-68
Nurse Practitioners
Urban 79 59.3 5.3 45-71
Rural 8 59.0 6.9 47-70
Certified Nurse Midwives
Urban 9 61.0 2.7 57-66
Rural 1 59.0 . 59-59
The survey explored future plans to reduce work hours (Figure 13 and Table 9). Those with plans to
significantly reduce practice hours within ten years (n=188) averaged 52 years old (range 25-73); in > 10
years (n=103) age 43 (range 28-62); with no plans to reduce hours (n=204) age 46 (range 26-72). Those
that did not respond (n=88) were on average 56 years old (range 30-76).
0
10
20
30
40
50
60
70
80
90
100
Urban Rural Urban Rural Urban Rural
PhysicianAssistants
Nurse Practitioners Certified NurseMidwives
% No response
No plans
>10 years
Within 10 years

21
Figure 13. Provider plans to reduce work hours.
Table 9. Provider plans to reduce hours within 10 years.
n Average Age (years) Std. Dev. (years) Age Range
Physician Assistants
Urban 50 46.3 13.7 25-73
Rural 12 56.0 10.0 34-68
Nurse Practitioners
Urban 108 53.7 9.7 28-71
Rural 13 52.5 10.0 33-70
Certified Nurse Midwives
Urban 4 59.0 6.1 51-66
Rural 1 59.0 . 59-59
Few providers plan to move their practice within or outside of Arizona (Figures 14 and 15).
Figure 14. Provider plans to move practice within Arizona.
0102030405060708090
100
Urban Rural Urban Rural Urban Rural
Physician Assistants Nurse Practitioners Certified NurseMidwives
No response
No plans
>10 years
Within 10 years
0
10
20
30
40
50
60
70
80
90
100
Urban Rural Urban Rural Urban Rural
PhysicianAssistants
NursePractitioners
Certified NurseMidwives
% No response
No plans
>10 years
Within 10 years
22
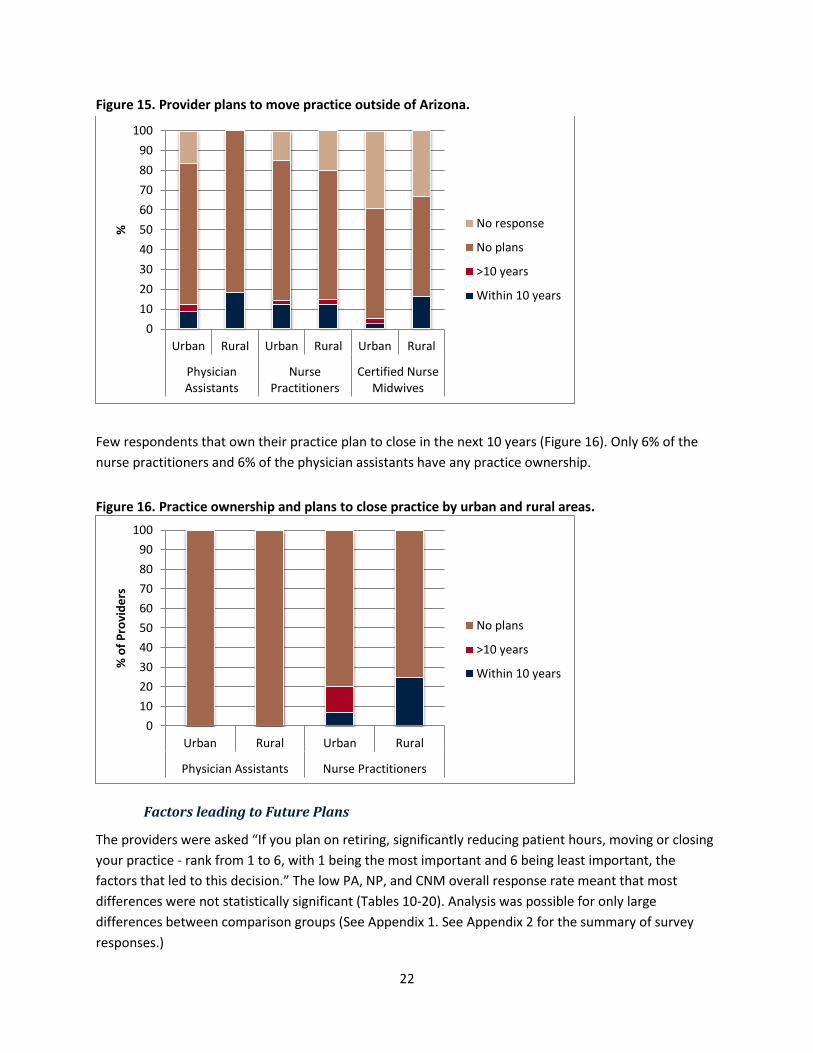
Figure 15. Provider plans to move practice outside of Arizona.
Few respondents that own their practice plan to close in the next 10 years (Figure 16). Only 6% of the
nurse practitioners and 6% of the physician assistants have any practice ownership.
Figure 16. Practice ownership and plans to close practice by urban and rural areas.
Factors leading to Future Plans
The providers were asked “If you plan on retiring, significantly reducing patient hours, moving or closing
your practice - rank from 1 to 6, with 1 being the most important and 6 being least important, the
factors that led to this decision.” The low PA, NP, and CNM overall response rate meant that most
differences were not statistically significant (Tables 10-20). Analysis was possible for only large
differences between comparison groups (See Appendix 1. See Appendix 2 for the summary of survey
responses.)
0
10
20
30
40
50
60
70
80
90
100
Urban Rural Urban Rural Urban Rural
PhysicianAssistants
NursePractitioners
Certified NurseMidwives
% No response
No plans
>10 years
Within 10 years
0
10
20
30
40
50
60
70
80
90
100
Urban Rural Urban Rural
Physician Assistants Nurse Practitioners
% o
f P
rovi
de
rs
No plans
>10 years
Within 10 years

23
Age
There were no statistical differences in age affecting work plans between urban and rural areas (Tables
10 and 11).
Table 10. Comparison of age affecting work plans between rural and urban areas.
Urban Rural Difference
p-value n Mean 95% CI n Mean 95%CI
PA 69 2.56 2.07, 3.05 23 2.60 1.75, 3.46 0.928
NP 148 2.64 2.35, 2.94 16 3.06 1.88, 4.23 0.472
CNM 12 1.75 0.80,2.69 2 4 -21.41, 29.41 0.436
Table 11. Comparison of age affecting work plans between urban and rural areas for those planning to reduce hours or retire within 10 years.
Urban Rural Difference
p-value n Mean 95% CI n Mean 95%CI
PA 17 1.41 0.86, 1.95 9 2 0.91, 3.08 0.292
NP 45 2.2 1.74, 2.65 5 2.2 -0.02, 4.42 1.000
CNM 4 1.25 0.45, 2.04 1 2 . .
Lack of job satisfaction
There were no statistical differences in lack of job satisfaction affecting work plans between urban and
rural areas for any provider (Tables 12 and 13).
Table 12. Comparison of lack of job satisfaction affecting work plans between rural and urban areas.
Urban Rural Difference
p-value n Mean 95% CI n Mean 95%CI
PA 64 3.31 2.91, 3.70 15 3.6 2.51, 4.68 0.602
NP 128 3.13 2.83, 3.43 16 3.56 2.53, 4.59 0.406
CNM 8 3.5 2.01, 4.98 3 3 -1.96, 7.96 0.721
Table 13. Comparison of lack of job satisfaction affecting work plans between urban and rural areas for those planning to reduce hours or retire within 10 years
Urban Rural Difference
p-value n Mean 95% CI n Mean 95%CI
PA 15 3.66 2.89, 4.44 6 3.5 1.32, 5.67 0.861
NP 39 3.25 2.64, 3.86 5 4.6 2.52, 6.67 0.146
CNM 2 4 -8.70, 16.70 1 3 . .

24
Speed/rate of reimbursement
There were no statistical differences in speed/rate of reimbursement affecting work plans between
urban and rural areas for any provider (Tables 14 and 15). The urban versus rural difference in response
was marginally significant for PAs over all (Table 14).
Table 14. Overall comparison of speed/rate of reimbursement affecting work plans between rural and urban areas.
Urban Rural Difference
p-value n Mean 95% CI N Mean 95%CI
PA 53 4.16 3.83, 4.50 16 3.37 2.55, 4.19 0.072
NP 120 4.41 4.15, 4.67 16 4.31 3.59, 5.03 0.776
CNM 11 5.54 5.19, 5.89 1 2 . .
Table 15. Comparison of lack of speed/rate of reimbursement affecting work plans between urban
and rural areas for those planning to reduce hours or retire within 10 years
Urban Rural Difference
p-value n Mean 95% CI N Mean 95%CI
PA 13 4 3.18, 4.81 8 3.87 2.36, 5.38 0.868
NP 42 4.23 3.73, 4.73 4 4.5 2.44, 6.55 0.721
CNM . . . . . . .
Health
There were no statistical differences in health affecting work plans between urban and rural areas for
any provider (Tables 16 and 17). The urban versus rural difference in response was marginally significant
for CNMs over all (Table 16).
Table 16. Overall comparison of health affecting work plans between rural and urban areas.
Urban Rural Difference
p-value n Mean 95% CI N Mean 95%CI
PA 66 3.83 3.40, 4.25 17 4.52 3.77, 5.28 0.102
NP 136 3.30 3.03, 3.58 13 3.30 2.40, 4.21 0.998
CNM 12 3.16 2.23, 4.09 2 4.5 -1.85, 10.85 0.088
Table 17. Comparison of lack of health affecting work plans between urban and rural areas for those planning to reduce hours or retire within 10 years
Urban Rural Difference
p-value n Mean 95% CI N Mean 95%CI
PA 13 4.23 3.17, 5.28 7 4.71 3.23, 6.19 0.541
NP 41 3.73 3.20, 4.25 5 3.4 0.97, 5.82 0.730
CNM 4 2 0.70, 3.29 1 5 . .

25
Increasing administrative burden
There were no statistical differences in increasing administrative burden affecting work plans between
urban and rural areas for any provider (Tables 18 and 19).
Table 18. Overall comparison of increasing administrative burden affecting work plans between rural and urban areas.
Urban Rural Difference
p-value n Mean 95% CI n Mean 95%CI
PA 66 3.19 2.79, 3.59 18 3.33 2.55, 4.11 0.748
NP 133 3.24 2.97, 3.50 19 3.21 2.41, 4.00 0.940
CNM 12 3.25 2.38, 4.11 2 2.5 -16.55, 21.55 0.692
Table 19. Comparison of lack of increasing administrative burden affecting work plans between urban
and rural areas for those planning to reduce hours or retire within 10 years
Urban Rural Difference
p-value n Mean 95% CI n Mean 95%CI
PA 17 2.82 2.04, 3.59 7 2.71 1.43, 3.99 0.866
NP 45 2.95 2.48, 3.43 7 2.71 1.33, 4.09 0.702
CNM 5 3.2 0.81, 5.58 1 4 . .
Practice
There were no statistical differences in practice affecting work plans between urban and rural areas for
NPs or CNMs (Tables 20 and 21). There was a low p-value (p=0.022) for the difference between PAs in
urban and rural areas that plan to reduce hours or retire within 10 years the difference was statistically
significant (Table 21). Further investigation to determine why practice is a factor between urban and
rural areas may identify ways of encouraging PAs to defer retirement longer.
Table 20. Overall comparison of practice affecting work plans between rural and urban areas.
Urban Rural Difference
p-value n Mean 95% CI n Mean
PA 73 3.52 3.16, 3.87 19 3.89 3.17, 4.61 0.338
NP 133 3.76 3.50, 4.02 17 3.41 2.48, 4.33 0.446
CNM 7 4 2.80, 5.19 2 2 -10.70, 14.70 0.188
Table 21. Comparison of practice affecting work plans between urban and rural areas for those
planning to reduce hours or retire within 10 years
Urban Rural Difference
p-value n Mean 95% CI n Mean 95%CI
PA 16 3.25 2.41, 4.08 8 4.5 3.72, 5.27 0.022
NP 44 4 3.57, 4.42 5 3.8 0.96, 6.63 0.856
CNM 3 5 2.51, 7.48 1 1 . .

26
Other
There were no statistical differences from other factors affecting work plans between urban and rural
areas for any provider (Tables 22 and 23).
Table 22. Overall comparison of other factors affecting work plans between rural and urban areas.
Urban Rural Difference
p-value n Mean 95% CI n Mean 95%CI
PA 24 3.37 2.39, 4.35 6 4.16 1.82, 6.50 0.459
NP 54 3.53 2.94, 4.12 6 2.83 0.79, 4.87 0.432
CNM 2 2.5 -16.55, 21.55 1 6 . .
Table 23. Comparison of other factors affecting work plans between urban and rural areas for those planning to reduce hours or retire within 10 years.
Urban Rural Difference
p-value n Mean 95% CI n Mean 95%CI
PA 8 4.87 3.36, 6.38 3 4 -0.96, 6.38 0.539
NP 15 3.93 2.79, 5.06 3 3 0.51, 5.48 0.262
CNM . . . . . . .
2.4 Factors Affecting Decision to Accept Current Primary Position
The providers were asked “Please rank the influences for your decision to accept your current primary
position” (Figure 17). The low PA, NP, and CNM response allowed comparison of only large differences
between comparison groups that are unlikely to have occurred by chance alone (i.e., are statistically
significant) (Appendix 1).
The following results compare urban and rural areas using t-tests for two independent samples with
unequal variances for each provider type on each decision. Each test produces a test statistic and a p-
value. The p-value is the probability that the test statistic would be as extreme as or more extreme than
observed if the difference in averages between the compared groups was truly zero. A small p-value
suggests that the observed difference in averages is not due to chance alone. Differences whose p-
values are less than or equal to 0.05 are called "statistically significant" in most scientific work.
Equivalently, 95% confidence intervals (CIs) can be constructed around each difference in urban and
rural average. The 95% CIs in this analysis indicate that the upper and lower limits of the interval include
the differences between urban and rural average values with 95% confidence (19 times out of 20 it is
correct). A negative and positive value for the two CI values means that the estimates are not
significantly different unless the p-value is small. It indicates the relative positions (higher or lower)
between urban and rural values may actually be the reverse of what the sample averages indicate. (See
Appendix 2 for a summary of survey responses).
Figure 17. Average influence of location, salary, benefits, job description, and other on decision to
accept current primary position.

27
Location
There were no statistical differences in a location’s influence on decisions for urban versus rural practice
for CNMs (p=0.545, CI -0.84, 1.45). A one-sided test demonstrated location is more influential for rural
than urban NPs (p=0.042), while the two-tailed test was marginally significant (p=0.0844, CI -0.77, 0.05).
For PAs location was more influential for those in urban than rural areas (p=0.057) in a one-sided test.
Salary
There were no statistical differences on the influence of promised salary on decisions to accept their
current primary position for urban versus rural CNMs (p=0.497; CI -1.75, 3.12) or for NPs (p=0.628; CI -
0.44, 0.27). PAs were statistically different for urban versus rural practitioners (p=0.038; CI 0.03, 1.14)
with salary being more important for those in urban areas (p=0.018).
Benefits
The influence of benefits was different for CNMs (p=0.084, CI -0.37, 3.53) with a higher importance for
those in urban areas (p=0.042). There was no statistical difference on the influence of promised benefits
on decision to accept their current primary position for urban versus rural NPs (p=0.270, CI -0.22, 0.79)
or PAs (p=0.988, CI -0.60, 0.60).
1
2
3
4
5
Urban Rural Urban Rural Urban Rural
Physician Assistants Nurse Practitioners Certified Nurse Midwives
Me
an In
flu
en
ce
1-
Leas
t In
flu
en
tial
5-
Extr
em
ely
In
flu
en
tial
Location
Salary
Benefits
Job Description
Other

28
Job Description
The influence of job description was marginally statistically different for CNMs (p=0.028, CI 0.17, 2.46)
with a higher importance for those in urban areas (p=0.014). There was no statistical difference on the
influence of promised job description on decision to accept their current primary position for urban
versus rural NPs (p=0.310, CI -21, 0.65) or for PAs (p=0.186, CI –0.17, 0.85); however, those PAs in urban
areas valued job description higher than those in rural areas (p=0.093).
Other
The influence of an ‘other’ factor was statistically different for CNMs (p=0.04, CI -3.24, -0.08) with a
higher importance for those in rural areas (p=0.021). There was no statistical difference on the influence
of something else on decision to accept their current primary position for urban versus rural NPs
(p=0.235, CI -0.38, 1.46) or for PAs (p=0.780, CI -1.31, 1.00).
2.5 Supply of PA, NP, and CNM providers
Limitations of Licensing Board Data when Estimating Arizona Workforce Capacity
Arizona’s licensing board data has limitations in providing timely, complete workforce information to
inform policy decisions. By Arizona statute, licensing boards assure that licensees meet minimum
professional standards and authorize them to practice in the state.
Underestimating, Overestimating and Accurately Estimating Arizona’s Health Workforce - The four-year
NP and CNM licensing renewal period obstructs timely data updates on direct patient care effort and
practice location. In contrast, the two-year PA license renewal cycle and requirement to report changes
in work or residence within 30 days, allows more real time data reporting and analysis.r Arizona’s
licensing boards do not assess provider full time equivalent (FTE) or direct patient care (DPC) effort.
Because Arizona has reciprocity agreements with other states for nurses,58 an active license does not
mean an active practice here. Federal health provider employees working in Indian Health Service,
Veteran’s Administration and in other sites are exempt from state licensure requirements, and therefore
may not be counted in FTE totals.s Some professionals with active Arizona licenses do not provide any or
only a small percentage of their FTE in DPC, have retired, or moved to another state to practice and kept
an active license. Licensing board data limitations challenge accurate workforce assessment. Some
states (Oregon, New Mexico) require data collection by boards (FTE, DPC, practice site, hours/week,
weeks/year worked) at the time of licensing and renewal allowing detailed analysis of health workforce
capacity.
The survey response rates were sufficient to draw statistically significant conclusions for large
differences between groups. However, the data cannot provide detailed interpretation of factors
r AZ Rev Stat § 32-2527, http://www.azleg.state.az.us/FormatDocument.asp?inDoc=/ars/32/02527.htm&Title=32&DocType=ARS
AZ Rev Stat § 32-2523, http://www.azleg.state.az.us/FormatDocument.asp?inDoc=/ars/32/02523.htm&Title=32&DocType=ARS s AZ Rev Stat § 32-2524, http://www.azleg.gov/FormatDocument.asp?inDoc=/ars/32/02524.htm&Title=32&DocType=ARS

29
affecting the PA, NP, and CNM workforce capacity. Multiple, multimodal efforts were made to increase
the survey response rate including emails, mailings, and phone calls.
Training
Many actively licensed Arizona PAs and NPs graduated from Arizona universities (Figure 18). There are
no Arizona CNM training programs. There are CNM graduate programs in the neighboring states of
Colorado, New Mexico, Utah, and California. Accredited CNM programs offer post-baccalaureate
certificates and master's degrees in nurse-midwifery and midwifery.59
There are three PA programs in Arizona accredited by the Accreditation Review Commission on
Education for the Physician Assistant.60 They are:
A.T. Still University - Arizona School of Health Sciences, in Mesa (http://www.atsu.edu), offers a
Master of Science degree in PA studies, requires 14 didactic and 12 months clinical coursework;
Midwestern University, in Glendale (http://www.midwestern.edu), offers a Master of Medical
Science in PA studies, requires 13.5 didactic and 13.5 months clinical coursework; and
Northern Arizona University - Department of PA Studies, in Flagstaff, offers a Master’s of PA
Studies, (http://www.nau.edu/chhs/pa/welcome/), requires a 24-month curriculum, with 53
didactic and 47 clinical units in collaboration with the UA College of Medicine in Phoenix.
Figure 18. Number of active licensed physician assistants, nurse practitioners, and certified nurse
midwives in Arizona from 2007 to 2013 along with the number that were trained in Arizona.4, 61
The majority of PAs licensed and residing in Arizona were trained in other states. The annual increase
PAs can be attributed to the production and retention of Arizona trained PAs, based on the slopes of the
total PAs and Arizona trained PAs per year (Figure 18). The very slight increase of PAs trained in Arizona
in 2013 compared to 2012 can be attributed to loss from retirements and/or moving out of state. The
production and retention of recently trained PAs from Arizona schools has otherwise been steady
(Tables 24 and 25). There appears to be 4-year lag period for a PA graduation cohort to attain its peak
contribution to the Arizona workforce (Table 25).
0
500
1000
1500
2000
2500
3000
3500
4000
2007 2008 2009 2010 2011 2012 2013
# o
f P
rovi
der
s
Year
Total NP's
Arizona trained NPs
Total PA's
Arizona trained PAs
Total CNMs

30
The average PA Program tuition cost is $51,000 for an in-state and $61,000 for an out-of-state resident.
The average PA student debt is $100,000. Few PA students work and attend school full-timet.
Table 24. Annual profile of physician assistant training in Arizona.
Matriculation/ Graduation 2010 2011 2012 2013 2014
A.T. Still University 69/67 73/73 70/69 70/70 67/--
Midwestern University 90/? 90/? 90/85 90/90 90/--
Northern Arizona University 25/0 25/0 50/24
Table 25. Annual number and percent of physician assistant graduate cohorts that contribute to the workforce in Arizona by university, graduation year, and year.
Active Arizona Licensed PA Cohorts Year Reported by Licensing Board
2010 2011 2012 2013
A.T. Still University graduates 2010 33(49%) 33(49%) 34(51%) 36(54%)
2011 41(56%) 46(63%) 48(66%)
2012 43(62%) 47(68%)
2013 36(51%)
Midwestern University graduates
2010 43 50 51 51
2011 62 65 66
2012 42(49%) 43(51%)
2013 47(52%)
There are five Arizona NP programs approved by the Arizona State Board of Nursing and accredited by
the Commission on Collegiate Nursing Education. They are:
Arizona State University - College of Nursing & Health Care Innovation offers doctor of nursing
practice (DNP) specialization in adult-gerontology, family, family psychiatric and mental health,
neonatal, pediatric, and women's health.
Grand Canyon University - College of Nursing & Health Sciences offers a master degree as family
nurse practitioner (MS-FNP).
Northern Arizona University - School of Nursing offers a master degree as family nurse
practitioner (MS-FNP).
University of Arizona - College of Nursing (CON) offers online DNP programs with specialization
in adult acute care, family, and pediatric. It provides a Graduate Certificate in NP for those that
have a MS in nursing and want to become an NP in family, adult-gerontology acute care,
pediatric, or psychiatric mental health. The CON offers a Doctor of Philosophy (PhD) in nursing.
These graduates must have received NP training in another program to practice as a NP. The
numbers provided in Tables 26 and 27 are based on those students that resided in Arizona;
students and graduates that resided in other states were not included.
University of Phoenix - College of Health and Human Services offers a master degree as family
nurse practitioner (MS-FNP).
The yearly increase in Arizona NPs (Figure 18) is only slightly due to the production and retention of
Arizona trained NPs, based on the slopes of the total NPs and Arizona trained NPs per year. The steady
t http://www.aapa.org/the_pa_profession/quick_facts/resources/item.aspx?id=3839

31
annual increase in number of NPs licensed in Arizona is primarily from out of state recruitment. Arizona
is one of 18 states where NPs can practice without physician oversight or supervision.20 There appears to
be 4-year lag period from NP graduation to peak contribution to the Arizona workforce (Tables 26 and
27).
Table 26. Annual profile of nurse practitioner training in Arizona.
Matriculation/ Graduation Type 2010 2011 2012 2013
Arizona State University* DNP
Grand Canyon University* MS-FNP
Northern Arizona University MS-FNP ?/5 ?/12 ?/16 ?/20
University of Arizona DNP 44/28 46/1 38/6 47/51
NP Certificate 2/10 6/9 11/1 9/9
University of Phoenix MS-FNP, MS-NP ?/147 ?/143 ?/122 ?/166 * Blank cells indicate no information was provided by respective university.
Table 27. Annual number and percent of nurse practitioner graduate cohorts that contribute to the workforce in Arizona by university, graduation year, and year.
Active Arizona Licensed NP Cohorts Year Reported by Licensing Board
2010 2011 2012 2013
Arizona State University* 2010 1 39 45 46
2011 29 29 29
2012 1 1
2013 39
Grand Canyon University* 2010 18 28 29 30
2011 24 29 29
2012 20 39
2013 31
Northern Arizona University 2010 4(80%) 5(100%) 5(100%) 5(100%)
2011 6(50%) 7(58%) 8(67%)
2012 14(88%) 14(88%)
2013 19(95%)
University of Arizona 2010 19(50%) 26(68%) 26(68%) 27(71%)
2011 2(20%) 2(20%) 2(20%)
2012 3(43%) 4(57%)
2013 23(38%)
University of Phoenix 2010 29(20%) 36(24%) 36(24%) 37(25%)
2011 37(26%) 56(39%) 57(40%)
2012 55(45%) 62(51%)
2013 77(46%) * Percent contribution could not be calculated because no information was provided by the respective university.
Universities, communities and legislators can implement policies to improve PA and NP graduate retention in Arizona. Clinical training location influences where providers practice after graduation.62

32
3. Recommendations
Improve Data Collection
Provider data from the Arizona licensing boards has limited utility to inform policy decisions regarding
the training, recruitment, and retention of the health workforce. Using licensing data overestimates
supply, affects federal designation of Health Professional Shortage Areas, and reduces HPSA/MUA/P
scoring which in turn reduces funding from the 30 federal programs that use the scoring to prioritize
award sites and amounts. Reduced funding means less resources to train, attract, retain and support
the rural health infrastructure. This study collected data using low cost, web-based survey methods.
While the survey response rates were sufficient to draw statistically significant conclusions for large
differences between groups, they were too low (9.7% for PAs, 11.3% for NPs and 23.0% for CNMs) to
make precise workforce estimates or detect differences between groups about factors that public and
private sector policy changes could improve. More comprehensive, real time, reliable data collected at
the time of licensing and renewal will allow analysis by credible experts to help identify cost drivers, and
suggest interventions to assure high quality, cost efficient, value base health care for all Arizonans.
Recommendations to improve health workforce data collection and analysis to inform policy are to:
Obtain direct patient care (DPC) full time equivalent (FTE) effort at the time of licensing and
renewal with a required, simple, 10-minute, online survey. Timely workforce data can inform
policy decisions to address shortages and assure access to quality health care for all Arizonans.
Accurate workforce data will improve federal funding including scholarships, loans, grants, and
Medicare and Medicaid payment for undeserved and rural areas. Oregon, North Carolina and
New Mexico are statesu that enacted health workforce data collection and analysis at the time
of licensing and renewal. Arizona’s licensing boardsv do not collect workforce information.
Simple legislation would allow them to implement data collection at the time of licensing and
renewal and to cover costs.63, 64, 65 Analysis could be performed by appropriate entities to inform
policy. Purchasing private sector data (e.g., health insurance companies) and acquiring public
sector data (e.g., AHCCCS and Medicare) could assure more accurate and timely health
workforce data collection and analysis to inform policy.
Study and Develop Policies Enhance Arizona’s Rural Health Professions Training, Supply and Distribution to areas of need. Other states have implemented initiatives to improve access to quality health care including retention strategies (e.g., Rural Health Professions Tax Credit in NM, OR), increasing community-based training in rural and underserved areas; Teaching Health Centers AL, AK, CA, CT, ID, IL, IA, KY, ME, MA, MI, MO, MT, NM, NY, NC, OK, PA, TX, WA, WV);
u SB 14 Health workforce Data Collection, Analysis and Policy Act
http://www.nmlegis.gov/sessions/11%20regular/final/SB0014.pdf, ftp://www.nmlegis.gov/bills/house/HB0019.pdf v These licensing boards are part of the governor’s “90/10” agency, http://www.azgovernor.gov/bc/, where 90% of
licensing fee revenues is deposited to the board’s fund for appropriation by the Legislature toward fulfillment of the Board’s statutory mandates. The remaining 10% of the funds collected are deposited into the State’s General Fund for unrestricted use as determined by the Legislature.

33
Allocate state general fund support for rural, community-based, interprofessionsal training infrastructure. (NM- Medicaid GME to expand Teaching Health Centers)
Study and make recommendations to enhance Arizona’s scope-of-practice for PA, NP, and CNM including payment for services.
Improve the Workforce Supply and Distribution
Retirement of Arizona’s NP and CNM workforce will dramatically impact provider capacity over the next
ten years as 70% of rural CNMs, 46% of urban CNMs, and 31% of NPs are age 55 or older. Providing an
environment that supports recruitment of PA, NP, and CNM providers to rural and underserved areas
can be an important tool in attracting providers to the state. Researchers in New Mexico surveyed
graduates from health professional programs in New Mexico including PA and nursing programs, to
determine factors associated with recruitment and retention to rural areas.66 They found that
participation in rural training programs and financial incentives such as rural health professions tax
credits and loan forgiveness programs were important in the decision to start and remain in practice in a
rural location.66 Significant investment, planning, partnering, residencies, clinical rotations and other
training in rural locations will benefit help assure a well-trained health workforce to meet the needs of
all Arizonans, and provide jobs and economic development in rural areas.
Improve the Workforce Utilization
Other states demonstrate infant mortality reductions using team based care using CNMs. Reforming
Arizona’s scope-of-practice regulations8 and provider reimbursement could facilitate value based, team
based service and learning models. Physician assistants, NPs, and CNMs are key to enhancing access to
high quality health care.
4. Conclusion
Access to high value, high quality care is attainable. Ensuring a well-trained and distributed health
workforce for all Arizonans is paramount to improving health outcomes in rural areas, spurring
economic development, and meeting health needs. Enhancing the rural, community based health
professions training infrastructure could move the supply pipeline to areas of need, using community
health centers (RHCsw and FQHCs), Indian Health Service, and Critical Access Hospitalsx to serve as
clinical training sites for PAs, NPs, and CNMs.
w
Community health centers or CHCs (also known as Federally Qualified Health Centers or FQHCs) are non-profit clinics located in medically underserved areas – both rural and urban – throughout Arizona. They share a mission of making comprehensive primary care accessible to anyone regardless of insurance status. http://www.aachc.org/what-is-a-healthcare-center/ x Critical access hospitals are rural acute care hospital consisting of no more than 25 inpatient beds. The Critical
Access Hospital must not exceed a ninety-six (96) hour length of stay and will have agreements, contracts or affiliations for transfer and services. Critical Access Hospitals must also be located more than a 35-mile drive from any other hospital or CAH (in mountainous terrain or in areas with only secondary roads available, the mileage criterion is 15 miles). http://crh.arizona.edu/programs/flex/cahs-list

34
References
1. AAPA, 2013. PAs and Where They Work. Available at: http://www.aapa.org/the_pa_profession/quick_facts/resources/item.aspx?id=3848
2. AZPA, 2013. Physican assistant workforce data. Phoenix: Arizona Regulatory Board of Physician Assistants. Available at: http://www.azpa.gov
3. Kaiser, 2011. Total Nurse Practitioners 2011. Available at: http://kff.org/other/state-indicator/total-nurse-practitioners
4. AZBN, 2014. Mailing List: Arizona State Board of Nursing. Available at: https://www.azbn.gov/MailingList.aspx
5. HRSA, 2013. The U.S. Health Workforce Chartbook Part I: Clinicans: U.S. Department of Health and Human Services, Health Resources and Services Administration, National Center for Health Workforce Analysis. Available at: http://bhpr.hrsa.gov/healthworkforce/supplydemand/usworkforce/chartbook/chartbookpart1.pdf
6. Petterson SM, Cai A, Moore M, Bazemore A, 2013. State-level projections of primary care workforce, 2010-2030. Available at: http://www.graham-center.org/online/graham/home/tools-resources/state-wrkfrc-proj-intro.html
7. Tabor JA, Eng HJ, 2012. Arizona Rural Health Workforce Trend Analysis 2007-2010. Tucson: Arizona Area Health Education Centers and Center for Rural Health, the University of Arizona. Available at: http://crh.arizona.edu/sites/crh.arizona.edu/files/u25/AZ_Workforce_Trend_Analysis_2007-10_0.pdf
8. Dower C, Moore J, Langelier M, 2013. Analysis & Commentary: It Is Time To Restructure Health Professions Scope-Of-Practice Regulations To Remove Barriers To Care. Health Affairs 32(11): 1971-1976. Available at: http://www.ncbi.nlm.nih.gov/pubmed/24191088
9. Buppert C, 2013. Collaborative physician liabilty for nurse pratitioner malpractice. Available at: http://dhhs.ne.gov/publichealth/licensure/documents/PhysLiaNPMalpractice.pdf
10. Christian S, Dower C, O'Neil E, 2007. Overview of Nurse Practitioner Scopes of Practice in the United States – Discussion: Center for the Health Professions, Center for the Health Professions. Available at: http://futurehealth.ucsf.edu/Content/29/2007-12_Overview_of_Nurse_Practitioner_Scopes_of_Practice_In_the_United_States_Discussion.pdf
11. 2012. An Act Relating to the Licensing and Regulation of Midwifery H.B. 2247. Available at: http://www.azleg.gov/legtext/50leg/2r/bills/hb2247h.pdf
12. AAC, 1995. Scope of Practice of a Registered Nurse Practitioner. Arizona Administrative Code 4. R4-19-508. Arizona Department of State, Phoenix. Available at: http://www.azsos.gov/public_services/Title_04/4-19.htm#ARTICLE
13. AAC, 2002. Responsibilities of the Licensed Midwife. Arizona Administrative Code 9. R9-16-106. Arizona Department of State, Phoenix. Available at: http://www.azsos.gov/public_services/Title_09/9-16.htm#Article_1
14. AAC, 2012. Arizona Regulatory Board of Physician Assistants. Arizona Administrative Code 4. Chapter 17. Arizona Department of State, Phoenix. Available at: http://www.azsos.gov/public_services/Title_04/4-17.htm
15. AAPA, 2013. Arizona Physician Assistants: State Laws and Regulations. Assistants AAoP, ed. Available at: http://www.aapa.org/uploadedFiles/content/The_PA_Profession/Federal_and_State_Affairs/Resource_Items/Arizona_2013.pdf
35
16. AAPA, 2013. What is a PA? Available at: http://www.aapa.org/the_pa_profession/what_is_a_pa.aspx
17. USBLS, 2012. Occupational Employment and Wages, Physician Assistants. Available at: http://www.bls.gov/oes/current/oes291071.htm
18. AASPA, 2013. Reimbursement. Available at: https://www.aaspa.com/page.asp?tid=100&name=Reimbursement&navid=32
19. IOM, 2010. The Future of Nursing: Leading Change, Advancing Health. Washington, DC: Institute of Medicine. Available at: http://www.iom.edu/Reports/2010/The-future-of-nursing-leading-change-advancing-health.aspx
20. Yee T, Boukus E, Cross D, Samuel D, 2013. Primary Care Workforce Shortages: Nurse Practitioner Scope-of-Practice Laws and Payment Policies. Washington, DC: National Institute for Health Care Reform. Available at: http://www.nihcr.org/index.php?download=1tlcfl229
21. USBLS, 2012. Occupational Employment and Wages, Nurse Practitioners. Available at: http://www.bls.gov/oes/current/oes291171.htm
22. Tran K, 2013. Nurse Practitioners Push To Help Care For Health Law's Newly Insured. Available at: http://www.kaiserhealthnews.org/stories/2013/february/20/nurse-practitoners-treating-newly-covered.aspx
23. ACNM, 2013. Essential Facts about Midwives. Available at: http://midwife.org/Essential-Facts-about-Midwives
24. USBLS, 2012. Occupational Employment and Wages, Certified Nurse Midwives. Available at: http://www.bls.gov/oes/current/oes291161.htm
25. ACNM, 2008. Certified Nurse-Midwives in Arizona. Available at: http://midwife.org/index.asp?bid=59&cat=11&button=Search&rec=175
26. 1978. Social Security Act. 42 U.S.C. 1302 and 1395hh. USA. Available at: http://www.ecfr.gov/cgi-bin/retrieveECFR?gp=&SID=bd5ea765b228085fc1b9f5a7366f85a0&n=42y2.0.1.2.5.15&r=SUBPART&ty=HTML#42:2.0.1.2.5.15.33.10
27. AMA, 2009. AMA Scope of Practice Data Series: Nurse practitioners: American Medical Association. Available at: http://api.ning.com/files/TFd2SeJkQVKB8Dfdb5IvPQoR1*l7SLgILZG-s-I1g4VpXNbrJ4Z4xgB*k2U08AEgeo6cTPZ78SK5u8rQwQTT4A*Arlbpoke7/AMA080424SOPNurseRevised1009.pdf
28. Barraza L, 2008. Arizona Rural Health Clinic Designation Manual, 98. Available at: http://crh.arizona.edu/sites/crh.arizona.edu/files/pdf/data-resources/ArizonaRuralHealthCliniclDesignationManual2008.pdf
29. Chen PGC, Mehrotra A, Auerbach DI, 2014. Do We Really Need More Physicians? Responses to Predicted Primary Care Physician Shortages. Medical Care 52(2): 95-96. Available at: http://www.ncbi.nlm.nih.gov/pubmed/24309673
30. NRHA, 2013. What's different about rural health care? Available at: http://www.ruralhealthweb.org/go/left/about-rural-health
31. Morrill R, Cromartie J, Hart G, 2005. RUCA Data, Version 2.0. Available at: http://depts.washington.edu/uwruca/ruca-data.php
32. AFHR, 2011. Health Care Workforce: Future Supply vs. Demand. Available at: http://www.allhealth.org/publications/Medicare/Health_Care_Workforce_104.pdf
33. CBO, 2014. Updated Estimates of the Effects of the Insurance Coverage Provisions of the Affordable Care Act, April 2014. Available at: http://www.cbo.gov/sites/default/files/cbofiles/attachments/45231-ACA_Estimates.pdf

36
34. Auerbach DI, 2012. Will the NP Workforce Grow in the Future? New Forecasts and Implications for Healthcare Delivery. Medical Care 50(7): 606-610. Available at: http://www.ncbi.nlm.nih.gov/pubmed/22354213
35. Fordyce MA, Doescher MP, Skillman SM, 2013. The Aging of the Rural Primary Care Physician Workforce: Will Some Locations Be More Affected than Others? Seattle: WWAMI Rural Health Research Center, University of Washington. Available at: http://depts.washington.edu/uwrhrc/uploads/RHRC_FR127_Fordyce.pdf
36. Dill MJ, Salsberg ES, 2008. The Complexities of Physician Supply and Demand: Projections Through 2025. Washington, DC: Association of American Medical Colleges, 91. Available at: https://members.aamc.org/eweb/upload/The%20Complexities%20of%20Physician%20Supply.pdf
37. Carrier ER, Yee T, Stark L, 2011. Matching Supply to Demand: Addressing the U.S. Primary Care Workforce Shortage. Washington, DC. Available at: http://www.nihcr.org/index.php?download=1tlcfl41
38. Hooker RS, Cawley JF, Everett CM, 2011. Predictive Modeling the Physician Assistant Supply: 2010-2025. Public Health Reports 126(5): 708-716. Available at: http://www.ncbi.nlm.nih.gov/pmc/articles/PMC3151188/pdf/phr126000708.pdf
39. AzOEPS, 2013. Populaton Projections. Available at: http://www.workforce.az.gov/population-projections.aspx
40. Barton Associates, 2014. Interactive nurse practitioner (NP) scope of practice law guide. Available at: http://www.bartonassociates.com/nurse-practitioners/nurse-practitioner-scope-of-practice-laws/
41. Henry LR, Hooker RS, 2007. Retention of physician assistants in rural health clinics. Journal of Rural Health 23(3): 207-214. Available at: http://www.ncbi.nlm.nih.gov/pubmed/8423489
42. USCB, 2013. American FactFinder - Results. Available at: http://factfinder2.census.gov/faces/tableservices/jsf/pages/productview.xhtml?src=bkmk
43. ASAPA, 2013. A Profile of Arizona's Physician Assistant Workforce. Phoenix. Available at: http://www.asapa.org/resource/resmgr/Docs/A_Profile_of_AZ_PAs_2013.pdf
44. NMHWC, 2013. 2013 Annual Report: New Mexico Health Workforce Committee. Available at: http://nmhealth.org/phd/dist3/documents/2013AnnualReportNewMexicoHealthWorkforceCommittee.pdf
45. Kaiser, 2013. Total Nurse Practitioners per 100,000 Population. Available at: http://kff.org/other/state-indicator/nurse-practitioners-per-100000-pop/
46. ACNM, 2013. ACNM Library: State Fact Sheets. Available at: http://midwife.org/ACNM-Library 47. Kaiser, 2009. Infant Mortality Rate (Deaths per 1,000 Live Births). Available at:
http://kff.org/other/state-indicator/infant-death-rate/ 48. Martin JA, Hamilton BE, Ventura SJ, Osterman JK, Mathews TJ, 2013. Births: Final Data for 2011
National Vital Statistics Reports: National Center for Health Statistics. Available at: http://www.cdc.gov/nchs/data/nvsr/nvsr62/nvsr62_01.pdf#table02
49. Census U, 2013. State & County QuickFacts: New Mexico. Available at: http://quickfacts.census.gov/qfd/states/35000.html
50. MacDorman M, Mathews TJ, 2013. QuickStats: Infant Mortality Rates, by Race and Hispanic Ethnicity of Mother — United States, 2000, 2005, and 2009. Morbidity and Mortality Weekly Report 65(5): 1. Available at: http://www.cdc.gov/mmwr/preview/mmwrhtml/mm6205a6.htm
51. Kaiser, 2013. Physician Assistants per 100,000 Population by Primary State of Employment. Available at: http://kff.org/other/state-indicator/physician-assistants-per-100000-pop/
52. WTECB, 2012. Health Care Personnel Shortage Task Force 2012 Annual Report. Available at: http://www.wtb.wa.gov/Documents/HealthCareReport2012.pdf

37
53. Packham J, Griswold T, Marchand C, 2013. UNSOM Health Policy Report: Health Workforce in Nevada 2013 Edition: University of Nevada School of Medicine. Available at: http://www.medicine.nevada.edu/ohprp/documents/HWIN%202013%20-%20FINAL%20REPORT%20-%20MARCH%202013.pdf
54. Kaiser, 2013. Registered Nurses per 100,000 Population. Available at: http://kff.org/other/state-indicator/registered-nurses-per-100000-population/
55. DHHS, 2013. How the Health Care Law is Making a Difference for the People of Arizona. Available at: http://www.hhs.gov/healthcare/facts/bystate/az.html
56. Alemayehu B, Warner KE, 2004. The Lifetime Distribution of Health Care Costs. Health Serv Res 39(3): 627-42. Available at: http://dx.doi.org/10.1111/j.1475-6773.2004.00248.x
57. Khatutsky G, Wiener J, Anderson W, Akhmerova V, Jessup EA, Squillace MR, 2011. Understanding Direct Care Workers: A Snapshot of Two of America’s Most Important Jobs Certified Nursing Assistants and Home Health Aides: Office of the Assistant Secretary for Planning and Evaluation. Available at: http://aspe.hhs.gov/daltcp/reports/2011/CNAchart.htm
58. NCSBN, 2013. Nurse Licensure Compact. Available at: https://www.ncsbn.org/nlc.htm 59. ACNM, 2013. Midwifery Education Programs. Available at: http://www.midwife.org/Education-
Programs-Directory 60. ARCPA, 2013. Accredited Entry-Level Progaram. Available at: http://www.arc-
pa.org/acc_programs/ 61. ARBPA, 2014. Medical Directory. Phoenix Arizona: Arizona Regulatory Board of Physician
Assistants. Available at: http://www.azpa.gov/Medical%20Directory/Medical_Directory.aspx 62. Rabinowitz HK, Diamond JJ, Markham FW, Rabinowitz C, 2005. Long-term retention of graduates
from a program to increase the supply of rural family physicians. Academic Medicine 80(8): 728-732. Available at: http://journals.lww.com/academicmedicine/Abstract/2005/08000/Long_Term_Retention_of_Graduates_from_a_Program_to.4.aspx
63. Fraher E, Gaul K, Spero J, 2013. Why States Need to Build Better Nursing Workforce Data Systems. Available at: http://www.rwjf.org/content/dam/farm/reports/issue_briefs/2013/rwjf409031
64. Fraher E, Gaul K, Spero J, 2013. How States Can Develop Better Nursing Workforce Data Systems. Available at: http://www.rwjf.org/content/dam/farm/reports/issue_briefs/2013/rwjf408490
65. Fraher E, Gaul K, Spero J, 2013. What Data States Can Collect to Build Better Nursing Workforce Data Systems. Available at: http://www.rwjf.org/content/dam/farm/reports/issue_briefs/2013/rwjf408492
66. Daniels ZM, VanLeit BJ, Skipper BJ, Sanders ML, Rhyne RL, 2007. Factors in recruiting and retaining health professionals for rural practice. Journal of Rural Health 23(1): 62-71. Available at: http://onlinelibrary.wiley.com/doi/10.1111/j.1748-0361.2006.00069.x/pdf

38
Appendices
Appendix 1: Methodology
Data Sources
Data sources:
Arizona State Board of Nursing data on current advanced practice registered nurses, March 2013.
Arizona Regulatory Board of Physician Assistants data on current physician assistants, June 2013.
US Census 2010 data
Rural-urban commuting area data (2006 ZIP version 2.0)y
Licensing board data methods
PA data were received from the Arizona Regulatory Board of Physician Assistants. The file contained
information on all PAs with active and inactive licenses in Arizona. This file was imported to SAS
Enterprise Guide (EG) version 4.3. The data was edited and cleaned to correct variation in data structure
and formats, and filtered to remove individuals that did not currently reside in Arizona, and individuals
who did not have an active license. Missing data was imputed deductively based on existing data for
each record; however individuals with complete missing data (street address, zip code etc.) were
excluded from the analysis.
Advanced practice registered nurse data (NP and CNMs) were acquired from the Arizona State Board of
Nursing. The file contained information on all practicing APRNs in the state of Arizona. The file was
imported to SAS EG and cleaned to correct variation in data structure and formats. Individuals with an
advanced practice specialty defining themselves as NPs were selected for analysis. This included the
following AP specialty types:
Acute care nurse practitioner
Adult nurse practitioner
Adult psychiatric and mental health nurse practitioner
Family nurse practitioner
Family psychiatric and mental health nurse practitioner
Gerontological nurse practitioner
Neonatal nurse practitioner
Nurse practitioner
Pediatric acute care nurse practitioner
Pediatric nurse practitioner
Psychiatric and mental health nurse practitioner
Psychiatric mental health nurse practitioner
School nurse practitioner
Women’s health care nurse practitioner
y http://depts.washsington.edu/uwruca/ruca-download.php

39
Where possible missing information including city, state, and zip code were deductively imputed based
on existing information for the member record. Individuals with complete missing information (including
first/last name, address, zip code, etc.), an inactive license status, or individuals listing an address
outside of Arizona were excluded from the analysis.
Both data sets were limited by several factors. First the data only provided one current address for the
provider. It was not specified whether this is a home address or practice location. According to the
survey information many PA, NP, and CNM providers, especially NPs, practice in multiple locations
(Figure A1.1). As only one location is reported on the licensing board data, there is the potential to
underestimate the rural workforce.7 Multiple work addresses are not reported or captured in the
current licensing data and represents a limitation of the workforce analysis.
Second the licensing data does not indicate whether the provider is actively practicing. While a provider
may have an active license this does not indicate they are practicing in the state. When comparing the
license data to the survey results we observed that many providers indicated that they are not practicing
or are employed in a non-practice capacity (Figure A1.2). While these individuals maintain an active
license they are not actively treating patients and can overinflate the provider counts and estimated
coverage, especially in rural areas with small populations.
Third the data does not provide a description of the number of hours practiced each week or a means to
calculate an FTE. This artificially inflates the counts of provider coverage and can give an inaccurate
representation of the healthcare workforce in a specific location. As an example, one third of CNM
survey respondents reported working less than 35 hours a week at their primary practice location; 38%
of NP survey respondents reported working less than 35 hours a week; while 30% of PAs reported
working less than 35 hours per week at their primary practice location (Figure A1.3).
The standard method for evaluating workforce coverage of a population is by dividing the number of
providers by the estimated population that they serve and multiplying this proportion by 100,000 to
produce a comparable metric, count per 100,000 population. This method is designed to allow a more
direct comparison between different locations. Due to limitations with the licensing data it is possible
these counts are inflated as individuals listed as practicing providers are counted when they are in fact
not providing full time direct-care services (e.g., work time spent as administrators, supervisors,
preceptors, etc.).
Survey methods
In 2012 and early 2013 survey instruments were developed for each PA, NP, and CNM provider group.
The intent of the survey was to understand issues related to workforce in the state. These included
decisions to accept the provider’s primary position, factors affecting decisions to continue to practice,
whether the provider is planning to retire or reduce practice hours in the future, etc. The instruments
were finalized and made available to the providers via Survey Monkey. Different outreach strategies
were utilized for the APRNs and the PAs.

40
Figure A1.1 Number of practice locations by provider type.
Figure A1.2 Number of survey respondents who reported being employed in a provider capacity.
Figure A1.3 Hours per week worked at primary practice location.
In 2012 and early 2013 survey instruments were developed for each PA, NP, and CNM provider group.
The intent of the survey was to understand issues related to workforce in the state. These included
decisions to accept the provider’s primary position, factors affecting decisions to continue to practice,
23 4 1 14
244
57
12 33
150
26 8 11
0
50
100
150
200
250
300
One PracticeLocation
Two PracticeLocations
Three PracticeLocations
Did NotAnswer
CNM
NP
PA
29 12 1
315
15 16
186
1 8
0
50
100
150
200
250
300
350
Employed asProvider
Not Employed asProvider
Did Not Answer
CNM
NP
PA
0
50
100
150
200
250
0-10 10-20 20-30 30-40
CNM
NP
PA

41
whether the provider is planning to retire or reduce practice hours in the future, etc. The instruments
were finalized and made available to the providers via Survey Monkey. Different outreach strategies
were utilized for the APRNs and the PAs.
All APRNs (NPs and CNMs) with a valid email address were sent an email with a statement of informed
consent and a link to the Survey Monkey instrument. For NPs, 2994 emails were sent, 142 email
addresses came back as invalid. For CNMs 176 emails were sent, 10 CNM emails bounced back as
invalid. The individuals with invalid email addresses were sent a post card reminder with a link to the
Survey Monkey instrument; 21 of the mailings were returned due to inaccurate addresses (Figure A1.4).
The Arizona State Board of Nursing limited our recruitment efforts to one contact by email or postcard.
No further recruitment efforts were permitted to achieve higher response rates.
Figure A1.4 Nurse practitioner and certified nurse midwife response during survey recruitment period.
PAs were sent two emails regarding the survey instrument in May 2013. The initial email explained the
survey and requested participation. The second email provided a further request to participate in the
study. Both emails were sent from the president of the Arizona State Association of Physician Assistants
(ASAPA).
A post card reminder was sent with information about the survey to all non-respondents in June 2013. A
total of 181 of the post cards were returned due to insufficient addresses. Phone outreach to increase
participation rates was conducted in July and August 2013 using phone numbers from the licensing
board data for non-respondents. Phone calls were placed at various times during the work day including
early evening in an effort to increase contact rates and survey participation (Figure A1.5).
With the multi-modal outreach conduct for PAs an analysis was conducted to determine the most
effective means of contacting the PA’s in the state. The majority of the survey responses were obtained
from the initial and follow up emails sent from the ASAPA president. The post card mailings, which
referenced the University of Arizona, the Arizona AHEC, and the ASAPA, generated a small increase in
response rates. Phone outreach was the least effective and produced a small number of survey
responses.
0
20
40
60
80
100
120
140
160
5/1/2013 6/1/2013 6/20/2013 7/24/2013
Count of NPRespondents
Count of CNMRespondents

42
Reaching the PA population by phone presented a number of challenges. First many of the phone
numbers provided in the licensing board data were for places of employment, not personal lines. This
represented a challenge as many PAs work in large organizations that are reluctant to connect non
patient calls. Second many of the numbers were inaccurate as the PA was no longer employed at the
location and had no forwarding number. Finally, many PAs did not return messages left for them at their
place of employment. It is possible that as the majority of PAs are under the age of 50, they are more
likely to respond to a digital outreach method. Based on the results of this study, phone contact is not
an appropriate outreach method for the PA population in the state.
Figure A1.5 Physician assistant response during survey recruitment period.
Rural assignment methods
The 34 rural-urban commuting area (RUCA) codes (version 2.0)z are based on Census 2000 tract level
information. The classification is based on a combination of population density and
commuting/connectivity information (e.g., percent flow to urban area) to characterize US Census tracts
and finer scale US postal zip codes. This report aggregates the assigned RUCA codes into four classes: (1)
urban areas (e.g., Phoenix) that include peri-urban and small town areas with good connectivity to
urban areas (e.g. Maricopa), (2) large rural towns and surrounding areas (e.g., Payson), (3) small rural
towns and surrounding areas (e.g., Chinle), and (4) isolated small rural towns and surrounding areas
(e.g., Ashfork and Tombstone) (Tables A1.1-A1.4). These four categories are commonly used for health
related projects.
Due to limited sample size from the web based survey the three rural categories were combined in the
analysis. The resulting urban and rural categories approximate the US Office of Management and
Budget’s metro and non-metro classification. The location specific workforce information in this report
z Version 3 that is based on 2010 Census data and postal zip codes will be published early in 2014.

43
is based on self-reported addresses that professionals entered in a web-based survey or provided the
licensing boards during applications or renewals.
Physician assistants, NPs and CNMs data records from board data and survey data were joined by postal
zip code assignments with a rural-urban commuting area (RUCA) classification dataset and prepared for
analysis. Missing county and postal zip code data for residence or business locations were imputed from
street address and city data, and internet website searches of practitioner’s names. Unclear
determinations were assigned to the more urban areas to reduce relative error.
Statistical Analysis methods
Survey data was assessed for missing variables using Stata 12.1. Missing age was imputed using
graduation date with the assumption of graduation at the average age of 29aa. Two-group mean-
comparison tests with unequal variances using Welch’s approximation were performed by provider type
to assess differences in age, age by sex, and age by urban versus rural. Two-group mean comparisons
were also computed for influence of factors leading to decisions to accept current primary position,
retire, reduce patient hours, move practice within or outside of Arizona, or close practice. Two-sample,
two-sided test for differences in both hypergeometric and binomial proportions were performed.
The difference in binomial proportions (0.011) between the urban versus rural survey responses of PAs
was not statistically significant (p-value = 0.67). The survey sample sizes (n=168 for urban, n=27 for rural,
n=195 total) are too small to detect proportional differences less than 0.16 at the 80% statistical power
benchmark (Figure A1.6). For the PA survey, a sample size of 195 only has 68% power to detect a
modest 0.14 difference in response proportions; a sample size of 250 would be required to achieve the
80% power threshold. For future follow-up studies, sample sizes smaller than 250 are possible but only if
detectable differences in response proportions greater than 0.14 can be tolerated.
Figure A1.6. Power vs total (urban + rural) sample size for detectable differences in response proportions.
aa
http://www.midwestern.edu/programs-and-admission/az-physician-assistant-studies.html

44
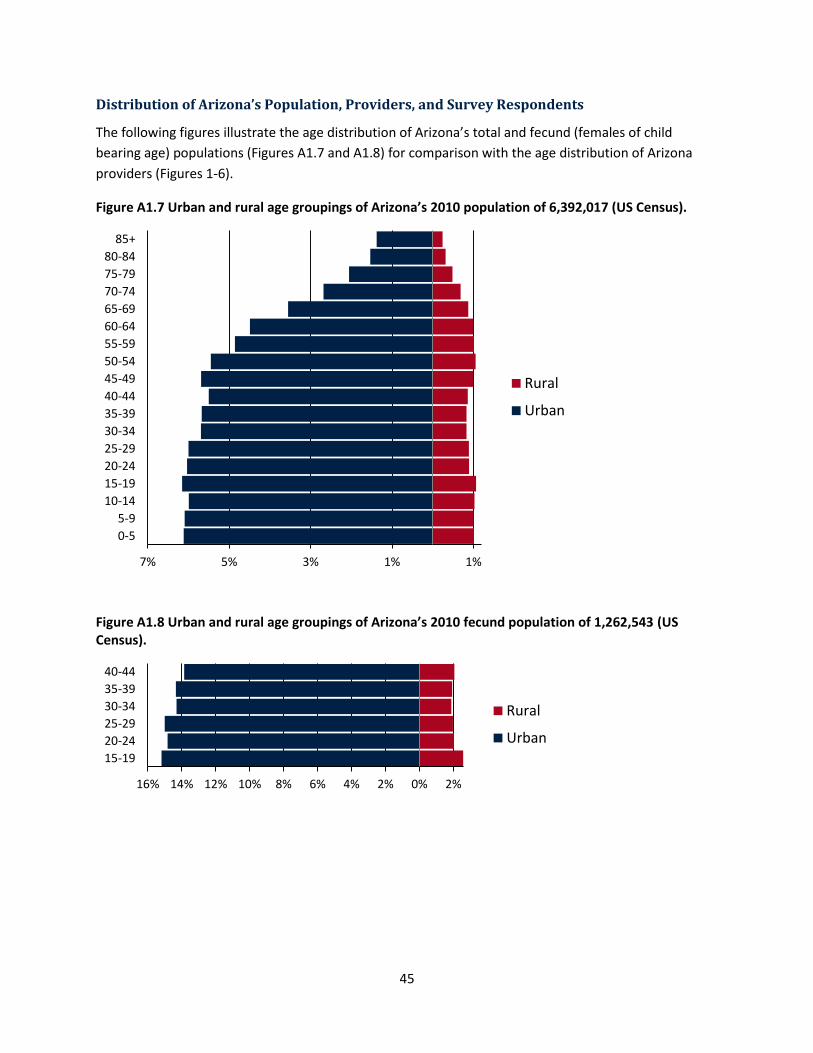
45
Distribution of Arizona’s Population, Providers, and Survey Respondents
The following figures illustrate the age distribution of Arizona’s total and fecund (females of child
bearing age) populations (Figures A1.7 and A1.8) for comparison with the age distribution of Arizona
providers (Figures 1-6).
Figure A1.7 Urban and rural age groupings of Arizona’s 2010 population of 6,392,017 (US Census).
Figure A1.8 Urban and rural age groupings of Arizona’s 2010 fecund population of 1,262,543 (US Census).
7% 5% 3% 1% 1%
0-5
5-9
10-14
15-19
20-24
25-29
30-34
35-39
40-44
45-49
50-54
55-59
60-64
65-69
70-74
75-79
80-84
85+
Rural
Urban
16% 14% 12% 10% 8% 6% 4% 2% 0% 2%
15-19
20-24
25-29
30-34
35-39
40-44
Rural
Urban

46
Table A1.1 Distribution of population, providers, and survey respondents by RUCA urban cities and towns.
Urban zip code RUCA assignments
City/Town area Total pop.
Fecund pop.
PA survey
PA board
NP survey
NP board
CNM survey
CNM board
Aguila* 1,197 187
Amado* 2,231 403
Apache Junction 49,387 6,858 1 7 3 15
Arivaca* 698 60
Arlington* 752 149
Avondale 74,817 17,881 1 23 5 26 2
Bellemont* 385 92
Black Canyon City 2,886 364 2
Buckeye 63,868 12,681 7 8
Carefree 3,051 222 1 1 5
Cave Creek 26,960 4,421 2 29 1
Chandler 255,641 54,535 13 92 17 161 2 12
Chino Valley 15,822 2,344 1 5
Congress 2,146 167 1
Crown King* 177 17
Dewey 8,858 985 7
El Mirage 31,787 7,382 1 2
Flagstaff 84,499 22,144 3 35 9 76 5
Fort McDowell 1,249 235 1
Fountain Hills 22,684 2,729 5 3 20
Gadsden* 700 150
Gila Bend* 2,793 553
Gilbert 211,167 48,053 14 94 17 187 2 8
Glendale 280,389 60,015 13 101 7 109 5
Glendale Luke Air Force Base 1,485 248 4
Gold Canyon 12,246 1,084 1 7 1 9
Goodyear 67,037 15,965 2 34 2 45 1
Gray Mountain* 62 8
Green Valley 28,220 1,323 2 4 2 10
Happy Jack* 703 34
Humboldt 1,179 180 1
Kirkland* 1,637 158
Laveen 35,586 8,937 1 3 2 13
Leupp* 1,802 338
Litchfield Park 26,262 5,583 4 14 1
Lukeville* 39 8
Mammoth* 1,725 295
Marana 22,873 3,908 2 2 21
Maricopa 51,612 11,343 2 1 11 1
Mayer 5,734 759 2
Mesa 478,404 93,901 13 160 25 183 5
Mormon Lake* 77 9
Morristown 1,578 231 1
Mount Lemmon* 50 6
New River 7,708 1,258 1 10
Oracle 4,073 607 4
Palo Verde* 196 35
Paradise Valley 17,047 2,280 4 1 15
Paulden 4,985 838 1
Peoria 158,093 31,617 4 47 10 98 2 4
Phoenix 1,312,922 287,017 37 556 57 574 6 33
Prescott 55,321 6,758 3 30 10 59 1 3
Prescott Valley 41,635 7,409 6 3 13
Queen Creek 48,870 10,898 7 1 30 1
Red Rock 2,106 532 2
Rillito* 97 14
Rio Verde* 2,111 54
Sahuarita 23,568 5,084 2 16
San Luis 25,517 6,010 5 1
San Tan Valley 71,726 16,488 4 3 16 1
Sasabe* 54 5
Scottsdale 268,597 46,428 17 155 22 246 4 10

47
Urban zip code RUCA assignments
City/Town area Total pop.
Fecund pop.
PA survey
PA board
NP survey
NP board
CNM survey
CNM board
Skull Valley* 743 110
Somerton 21,214 4,260 1 3 2
Stanfield* 1,368 280
Sun City 45,145 1,916 2 31 4 8
Sun City West 27,703 442 27 5
Superior 2,872 431 1 1
Surprise 119,941 22,825 4 21 6 43
Tacna* 461 72
Tempe 167,311 43,270 4 47 10 68 1 2
Tolleson 31,011 7,695 1 2
Tonopah* 6,645 1,269
Tucson 880,383 175,726 26 165 67 529 14 42
Vail 21,753 4,225 2 20 1 2
Waddell 8,745 1,846 1 10
Wellton 4,539 604 1 1
Wickenburg 8,621 1,129 4 2
Wittmann 6,700 1,210 3
Yarnell 663 36 1
Youngtown 6,156 1,143 1 2
Yuma 141,891 26,539 6 53 4 36 3 7
* Towns without actively licensed PAs, NPs, and CNMs as reported by the Arizona licensing boards.

48
Table A1.2 Distribution of population, providers, and survey respondents by RUCA rural large towns.
Large town zip code RUCA assignments
City/Town area Total pop.
Fecund pop.
PA survey
PA board
NP survey
NP board
CNM survey
CNM board
Arizona City 10,677 1,944 1
Bapchule* 2,178 496
Casa Grande 62,569 11,538 4 22 4 17 1
Central 623 108 1 1 1
Chloride* 403 24
Cibola* 259 37
Clarkdale 4,168 596 3
Cottonwood 23,344 3,746 13 3 16 1 1
Dolan Springs* 2,224 203
Douglas 21,230 3,694 1 3 1
Eden* 21 4
Ehrenberg* 1,482 244
Florence 33,556 3,242 10 1 4
Fort Huachuca 5,601 1,432 3
Fort Thomas* 408 56
Globe 13,345 2,143 1 10 2
Golden Valley 12,103 1,201 1 1 2
Hackberry* 224 21
Hereford 9,413 1,427 1 2 8 1
Huachuca City 5,566 957 1
Jerome 477 71 1 1
Kingman 50,760 8,161 3 24 2 19 1 1
Lake Havasu City 55,808 7,706 1 15 2 20
Meadview 1,289 66 1
Miami* 4,520 684
Nogales 23,054 4,487 4
Payson 21,877 2,676 1 5 1 8
Peach Springs* 1,490 289
Pima 3,822 697 1 2
Pine 2,949 195 1
Pirtleville* 1,021 195
Rio Rico 19,080 4,112 4
Safford 19,677 3,287 1 17 4 1 1
Sierra Vista 50,006 9,319 13 3 28 1
Solomon* 405 63
Temple Bar Marina* 76 12
Thatcher 6,218 1,367 2
Tonto Basin* 1,501 92
Valentine* 76 10
Wikieup* 222 26
Willow Beach* 311 28
Young* 778 62
* Towns without actively licensed PAs, NPs, and CNMs as reported by the Arizona licensing boards.
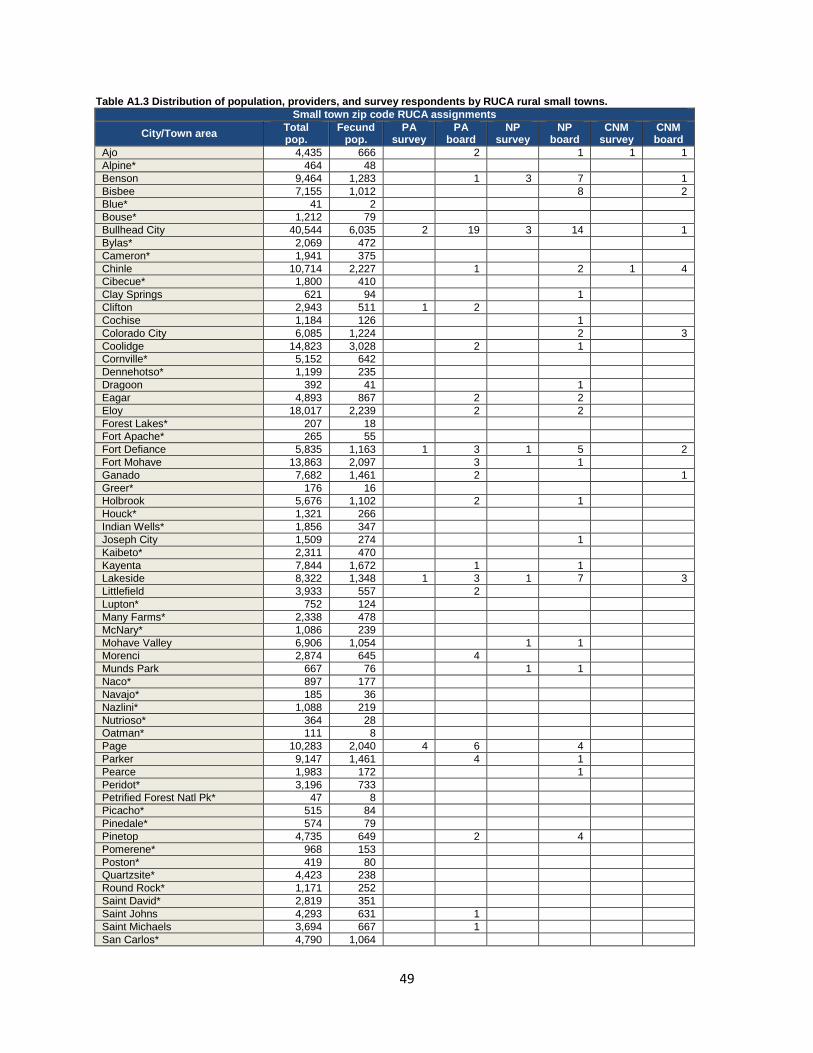
49
Table A1.3 Distribution of population, providers, and survey respondents by RUCA rural small towns.
Small town zip code RUCA assignments
City/Town area Total pop.
Fecund pop.
PA survey
PA board
NP survey
NP board
CNM survey
CNM board
Ajo 4,435 666 2 1 1 1
Alpine* 464 48
Benson 9,464 1,283 1 3 7 1
Bisbee 7,155 1,012 8 2
Blue* 41 2
Bouse* 1,212 79
Bullhead City 40,544 6,035 2 19 3 14 1
Bylas* 2,069 472
Cameron* 1,941 375
Chinle 10,714 2,227 1 2 1 4
Cibecue* 1,800 410
Clay Springs 621 94 1
Clifton 2,943 511 1 2
Cochise 1,184 126 1
Colorado City 6,085 1,224 2 3
Coolidge 14,823 3,028 2 1
Cornville* 5,152 642
Dennehotso* 1,199 235
Dragoon 392 41 1
Eagar 4,893 867 2 2
Eloy 18,017 2,239 2 2
Forest Lakes* 207 18
Fort Apache* 265 55
Fort Defiance 5,835 1,163 1 3 1 5 2
Fort Mohave 13,863 2,097 3 1
Ganado 7,682 1,461 2 1
Greer* 176 16
Holbrook 5,676 1,102 2 1
Houck* 1,321 266
Indian Wells* 1,856 347
Joseph City 1,509 274 1
Kaibeto* 2,311 470
Kayenta 7,844 1,672 1 1
Lakeside 8,322 1,348 1 3 1 7 3
Littlefield 3,933 557 2
Lupton* 752 124
Many Farms* 2,338 478
McNary* 1,086 239
Mohave Valley 6,906 1,054 1 1
Morenci 2,874 645 4
Munds Park 667 76 1 1
Naco* 897 177
Navajo* 185 36
Nazlini* 1,088 219
Nutrioso* 364 28
Oatman* 111 8
Page 10,283 2,040 4 6 4
Parker 9,147 1,461 4 1
Pearce 1,983 172 1
Peridot* 3,196 733
Petrified Forest Natl Pk* 47 8
Picacho* 515 84
Pinedale* 574 79
Pinetop 4,735 649 2 4
Pomerene* 968 153
Poston* 419 80
Quartzsite* 4,423 238
Round Rock* 1,171 252
Saint David* 2,819 351
Saint Johns 4,293 631 1
Saint Michaels 3,694 667 1
San Carlos* 4,790 1,064

50
Small town zip code RUCA assignments
City/Town area Total pop.
Fecund pop.
PA survey
PA board
NP survey
NP board
CNM survey
CNM board
San Manuel 3,630 629 1
Sedona 17,669 1,777 1 3 13 2
Shonto* 1,935 369
Show Low 17,207 2,621 1 10 7 1 2
Snowflake 7,638 1,207 1 3 1
Springerville 2,366 409 2 3
Sun Valley* 320 47
Taylor 4,400 788 1
Tonalea* 3,825 778
Topock* 2,104 170
Tuba City 11,354 2,484 6 1
Vernon* 1,443 198
White Mountain Lake* 178 21
Whiteriver 9,941 2,212 3 1 1
Willcox 9,810 1,543 3 4
Window Rock 2,894 592 1
Winslow 14,970 2,713 5 7
Woodruff* 80 8
Yucca* 913 64
* Towns without actively licensed PAs, NPs, and CNMs as reported by the Arizona licensing boards.

51
Table A1.4 Distribution of population, providers, and survey respondents by RUCA isolated rural small towns.
Isolated small town zip code RUCA assignments
City/Town area Total pop.
Fecund pop.
PA survey
PA board
NP survey
NP board
CNM survey
CNM board
Ash Fork* 1,885 220
Bagdad 2,219 427 1
Blue Gap* 1,793 369
Bowie 597 75 1
Camp Verde 11,480 1,692 1 1 4
Chambers* 1,464 222
Concho* 2,683 279
Dateland* 790 122
Duncan* 2,588 390
Elfrida 1,333 183 1
Elgin* 965 118
Fredonia 2,210 404 1 2
Grand Canyon 2,627 652 1
Hayden* 630 111
Heber 1,102 135 1 1
Hotevilla* 1,374 233
Keams Canyon 2,271 433 1
Kearny 2,329 345 1
Kykotsmovi Village* 1,467 280
Lukachukai* 2,340 497
Marble Canyon* 388 61
McNeal 1,277 157 2
Mexican Hat* 20 2
Monument Valley* 280 66
North Rim* 28 8
Overgaard* 3,033 280
Parks 759 100 1
Patagonia 1,426 173 1 1 1
Pinon 5,358 1,051 1
Polacca 1,778 344 2
Red Valley* 1,267 232
Rimrock 4,806 758 2
Rock Point* 1,650 342
Roll* 716 126
Roosevelt* 583 49
Sacaton 4,543 1,057 1 8
Salome 2,786 174 1
San Simon 835 88 1
Sanders 2,439 474 1
Second Mesa* 1,798 364
Seligman* 1,267 135
Sells 6,490 1,389 1 1 2 2
Sonoita 1,268 118 1 1 3
Supai* 487 116
Teec Nos Pos* 3,011 549
Tombstone* 1,973 224
Tsaile 2,090 514 2
Tubac 1,311 89 1 1
Tumacacori* 441 76
Wenden* 761 113
Williams 6,090 958 3
Winkelman* 2,120 308
* Towns without actively licensed PAs, NPs, and CNMs as reported by the Arizona licensing boards.

52
Appendix 2. Survey response data
A2.1 Physician assistant licensure and survey data
Table A2.1 Respondent characteristics of physician assistant survey.
Characteristic
Overall Urban Large rural town
Small rural town
Isolated small
rural town
Licensed PA Respondents 195 168 13 11 3
Licensed obtained in AZ 98 87 6 3 2
Age in years Mean (SD) 48.8
(12.0)
48.4
(12.0)
52.6
(13.2)
50.6
(9.9)
54.2
(11.2)
Female 19.4% 81.2% 80.6% 71.4% 77.8%
Ethnicity % (n)
Alaskan Native/Native American 2.7 (5) 2.5 (4) 9.1 (1)
Asian or Pacific Islander 2.2 (4) 2.5 (4)
Black/African American (non-Hispanic) 1.6 (3) 1.9 (3)
Hispanic/Latino 4.9 (9) 5.7 (9)
White (non-Hispanic) 87.0
(161)
85.4
(135)
100
(13)
90.9
(10)
100
(3)
Other 1.6 (3) 1.9 (3)
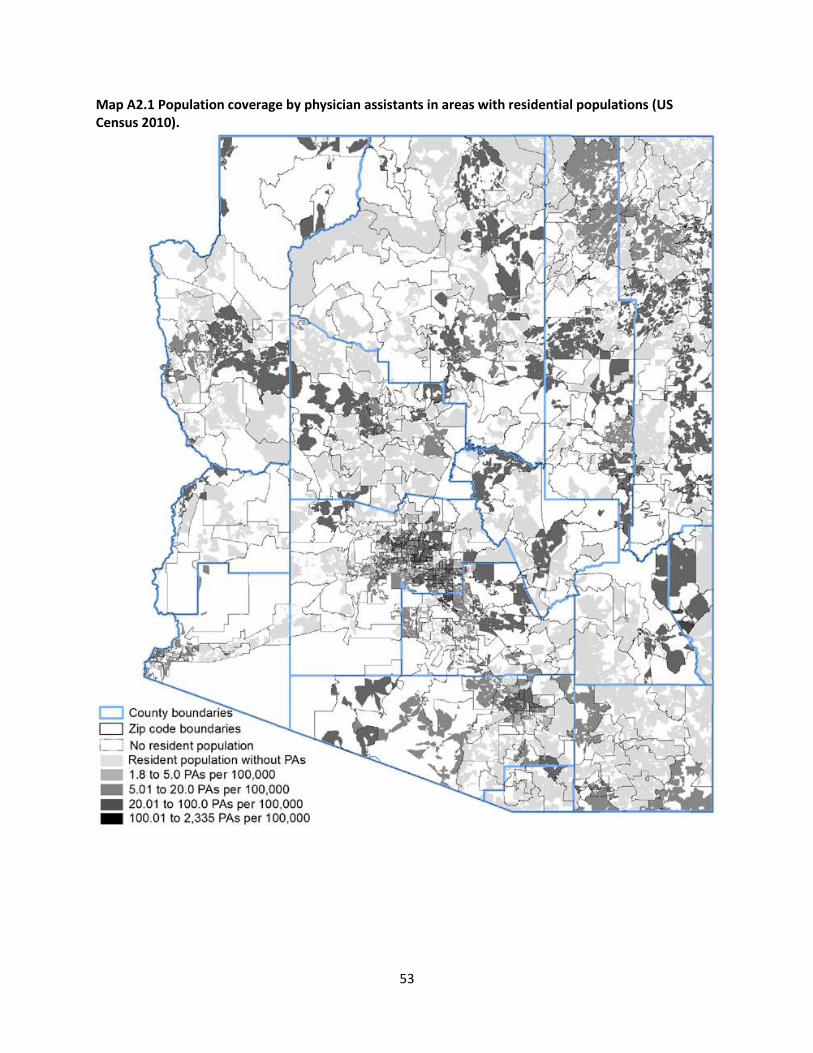
53
Map A2.1 Population coverage by physician assistants in areas with residential populations (US Census 2010).
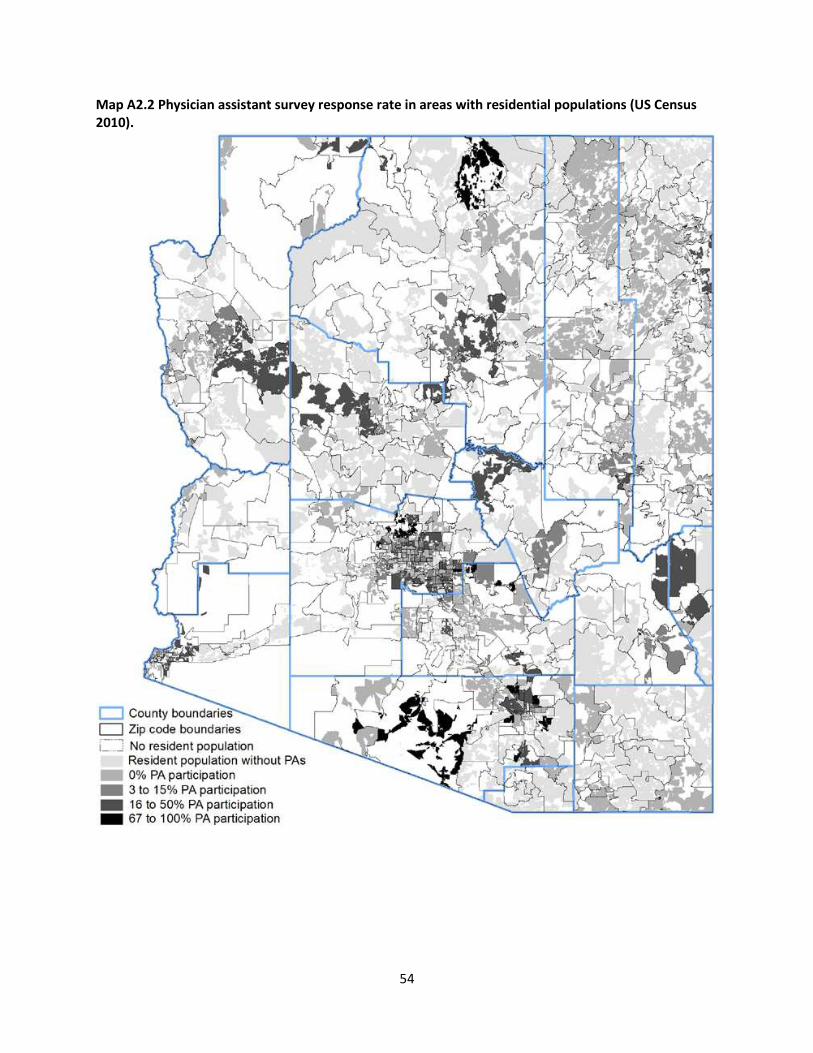
54
Map A2.2 Physician assistant survey response rate in areas with residential populations (US Census 2010).

55
Table A2.2 Physician assistant response summary on practice type, hours of work, and payment
source.
Primary Work Setting
% (n)
Overall Urban
Large rural
town
Small rural
town
Isolated small
rural town
Practice Type
Primary Care 63.6 (124) 60.1
(101)
92.3 (12) 72.7 (8) 100 (3)
Specialty 26.7 (52) 29.2 (49) 7.7 (1) 18.2 (2) 0 (0)
Total hours/week spent at facility
Less than 5 hours 0.5 (1) 0.6 (1)
5-10 hours 2.6 (5) 2.4 (4 ) 7.7 (1)
10-15 hours 6.2 (12) 7.1 (12)
15-20 hours 3.1 (6) 3.0 (5) 7.7 (1)
20-25 hours 2.6 (5) 1.8 (3) 7.7 (1) 9.1 (1)
25-30 hours 2.6 (5) 3.0 (5)
30-35 hours 11.3 (22) 12.5 (21) 9.1 (1)
35-40 hours 26.2 (51) 25.6 (43) 30.8 (4) 18.2 (2) 66.7 (2)
More than 40 hours 38.5 (75) 36.3 (61) 46.2 (6) 63.6 (7) 33.3 (1)
No Response 6.7 (13) 7.7 (13)
Patient Primary Source of Payment
Mean % (SD)
Medicare 34.0
(23.8)
34.9
(24.6)
30.5 (13.6) 35 (25.4) 20
Tricare/VA/IHS 13.8
(24.6)
13.2
(23.2)
15.7 (31.8) 7 (5.1) 100
Self-Pay 9.6 (12.6) 9.9 (13.4) 9.1 (5.1) 5.2 (2.9) 15
Other 42.9
(41.5)
37.1
(40.6)
58.8 (48.0) 74.5 (36.1)

56
Table A2.3 Physician assistant response summary on influences for selecting practice location.
Influence on decision to
accept current primary
position Mean (Median)
Overall
Urban Large rural
town
Small rural
town
Isolated small
rural town
1=Not influential 2=Least influential 3=Somewhat influential 4=Most influential 5=Extremely influential
Location 3.8 (4) 3.8 (4) 3 (3) 3.9 (4) 3.3 (3)
Salary 3.9 (4) 4.0 (4) 3.6 (4) 3.4 (4) 3 (3)
Benefits 3.3 (3) 3.3 (3) 3.5 (4) 3 (3) 4 (4)
Job Description 4.1 (4) 4.1 (4) 3.8 (4) 3.5 (4) 4.7 (5)
Other 3.2 (4) 3.1 (4) 3 (3.5) 3.4 (4) -
Table A2.4 Physician assistant response summary on future work plans.
In how many years do you
plan to do the following?
% (n)
Overall Urban Large rural
town
Small rural
town
Isolated small
rural town
Retire
<1 year 1.0 (2) 0.6 (1) 0 (0) 0 (0) 0 (0)
1-2 years 3.6 (7) 3.6 (6) 7.7 (1) 0 (0) 0 (0)
3-5 years 7.7 (15) 5.4 (9) 23.1 (3) 18.2 (2) 33.3 (1)
6-10 years 11.8 (23) 10.1 (17) 30.8 (4) 18.2 (2) 0 (0)
>10 years 36.4 (71) 38.1 (64) 23.1 (3) 9.1 (1) 33.3 (1)
No plans/Do not know 30.8 (60) 32.1 (54) 15.4 (2) 27.3 (3) 33.3 (1)
No response 8.7 (17) 10.1 (17) 0 (0) 27.3 (3) 0 (0)
Significantly Reduce Patient
Hours
<1 year 4.6 (9) 5.4 (9) 0 (0) 0 (0) 0 (0)
1-2 years 5.6 (11) 6.0 (10) 7.7 (1) 0 (0) 0 (0)

57
In how many years do you
plan to do the following?
% (n)
Overall Urban Large rural
town
Small rural
town
Isolated small
rural town
3-5 years 11.3 (22) 8.9 (15) 38.5 (5) 18.2 (2) 0 (0)
6-10 years 10.3 (20) 9.5 (16) 2 (15.4) 2 (18.2) 0 (0)
>10 years 17.4 (34) 17.9 (30) 7.7 (1) 18.2 (2) 33.3 (1)
No plans/Do not know 38.5 (75) 38.1 (64) 30.8 (4) 45.5 (5) 66.7 (2)
No response 12.3 (24) 14.3 (24) 0 (0) 0(0) 0 (0)
Move practice to another
geographical location in AZ
<1 year 4.6 (9) 3.0 (5) 15.4 (2) 18.2 (2) 0 (0)
1-2 years 2.1 (4) 1.8 (3) 0 (0) 9.1 (1) 0 (0)
3-5 years 3.1 (6) 3.0 (5) 7.7 (1) 0 (0) 0 (0)
6-10 years 1.0 (2) 1.2 (2) 0 (0) 0 (0) 0 (0)
>10 years 1.5 (3) 1.8 (3) 0 (0) 0 (0) 0 (0)
No plans/Do not know 73.3 (143) 73.2 (123) 69.2 (9) 72.7 (8) 100.0 (3)
Move practice location
outside AZ
<1 year 3.1 (6) 1.8 (3) 7.7 (1) 18.2 (2) 0 (0)
1-2 years 1.5 (3) 1.2 (2) 7.7 (1) 0 (0) 0 (0)
3-5 years 3.6 (7) 3.6 (6) 7.7 (1) 0 (0) 0 (0)
6-10 years 2.1 (4) 2.4 (4) 0 (0) 0 (0) 0 (0)
>10 years 3.1 (6) 3.6 (6) 0 (0) 0 (0) 0 (0)
No plans/Do not know 72.8 (142) 71.4 (120) 76.9 (10) 81.8 (9) 100.0 (3)
No response 13.9 (27) 16.1 (27) 0 (0) 0 (0) 0 (0)

58
In how many years do you
plan to do the following?
% (n)
Overall Urban Large rural
town
Small rural
town
Isolated small
rural town
Close Practice
<1 year 0 (0) 0 (0) 0 (0) 0 (0) 0 (0)
1-2 years 0 (0) 0 (0) 0 (0) 0 (0) 0 (0)
3-5 years 0.5 (1) 0.6 (1) 0 (0) 0 (0) 0 (0)
6-10 years 1.0 (2) 0 (0) 15.4 (2) 0 (0) 0 (0)
>10 years 0.5 (1) 0.6 (1) 0 (0) 0 (0) 0 (0)
No plans/Do not know 79.0 (154) 78.0 (131) 69.2 (9) 100.0 (11) 100.0 (3)
No response 19.0 (37) 20.8 (35) 15.4 (2) 0 (0) 0 (0)
Table A2.5 Physician assistant response summary on factors influencing future work plans.
If you plan on retiring, significantly reducing patient hours, moving your practice or closing your practice rank from 1 to 6 in order of importance, with 1 being the most important and 6 being least important, the factors that led to this decision. Factors that led to decision Overall
Mean(Median)
Urban Large rural
town
Small rural
town
Isolated small
rural town
1=Most Important 6=Least Important
Age 2.6 (1) 2.6 (1) 2.1 (2) 2.1 (1) 2.5 (2.5)
Lack of job satisfaction 3.4 (3) 3.3 (3) 4.1 (4.5) 2.6 (2) No responses
Speed/rate of reimbursement 4.0 (4) 4.2 (4) 4 (4.5) 2.6 (2) 4
Health 4.0 (4) 3.8 (4) 4.4 (5) 4.6 (5) 5
Increasing
administrative/regulatory
burden
3.2 (3) 3.2 (3) 2.8 (3) 3.9 (4) 4 (4)
Practice 3.6 (4) 3.5 (3) 3.3 (4) 5 (5) 3 (3)
Other 3.5 (4) 3.4 (4) 4.3 (6) 3 (3) 6 (6)

59
Table A2.6 Physician assistant response summary on Medicare/Medicaid acceptance and practice
ownership.
Practice Questions Overall
%
Urban Large rural
town
Small rural
town
Isolated small
rural town
Currently accepting
Medicare/Medicaid patients
Both Medicare/Medicaid 58.0 54.2 76.9 81.8 100.0
Medicaid Only 4.1 4.8 0 0 0
Medicare Only 13.9 15.5 0 9.1 0
Neither 13.3 13.1 23.1 9.1 0
No response 10.7 12.5 0 0 0
If no, why not?
Reimbursement rates too low 9.7 10.7 0 9.0 0
Practice is at maximum
capacity
2.0 2.3 0 0 0
No new members available 0.5 0.6 0 0 0
Other 12.3 11.9 23.0 9.0 0
Currently practice on your
own
Full Ownership 0.5 0.6 0.0 0.0 0.0
Part Ownership 4.6 3.5 7.6 18.1 0.0
No Ownership 85.1 84.5 92.3 81.8 100.0
No response 9.7 11.3 0.0 0.0 0.0

60
A2.2 Nurse Practitioner licensure and survey data
Table A2.7 Respondent characteristics of nurse practitioner survey.
Characteristic Overall Urban Large rural
town
Small rural
town
Isolated small
rural town
Licensed NPs 346 306 20 14 6
Licensed obtained in AZ 205 182 12 9 2
Age in years Mean(SD) 50.5
(11.1)
50.2 (11.2) 53 (11.8) 49.9 (8.2) 58 (8.1)
Female 89.9% 88.6% 100% 100% 100%
Ethnicity n (%)
Alaskan Native/Native American 1 (0.3) 1 (0.3)
Asian or Pacific Islander 8 (2.4) 8 (2.8)
Black/African American (non-
Hispanic)
4 (1.22) 4 (1.4)
Hispanic/Latino 15 (4.6) 13 (4.5) 1 (5.0) 1 (7.1)
White (non-Hispanic) 298 (90.9) 263 (90.4) 19 (95.0) 13 (92.9) 3 (100)
Other 2 (0.6) 2 (0.7)

61
Map A2.3 Population coverage by nurse practitioners in areas with residential populations (US Census 2010).

62
Map A2.4 Nurse practitioner survey response rate in areas with residential populations (US Census 2010).

63
Table A2.8 Nurse practitioner response summary on practice type, hours of work, and payment
source.
Primary Work Setting Overall Urban
Large rural
town
Small rural
town
Isolated small
rural town
Practice Type
Primary Care 59.8% 57.5% 75.0% 92.9% 50.0%
Specialty 26.6% 29.1% 25.0% 7.1%
Total hours/week spent at
facility n (%)
Less than 5 hours 4 (1.2) 3 (1.0) 1 (7.1)
5-10 hours 25 (7.2) 23 (7.5) 2 (10.0)
10-15 hours 12 (3.5) 11 (3.6) 1 (7.1)
15-20 hours 11 (3.2) 11 (3.6)
20-25 hours 17 (4.9) 15 (4.9) 2 (10.0)
25-30 hours 20 (5.8) 18 (5.9) 1 (5.0) 1 (16.7)
30-35 hours 27 (7.8) 23 (7.5) 2 (10.0) 1 (7.1) 1 (16.7)
35-40 hours 83 (24.0) 73 (23.9) 3 (15.0) 5 (35.7) 2 (33.3)
More than 40 hours 100 (28.9) 88 (28.8) 7 (35.0) 5 (35.7)
No Response 47 (13.6) 41 (13.4) 3 (15.0) 1 (7.1) 2 (33.3)
Patient Primary Source of
Payment
Mean % (SD)
Medicare 33.1 (27.3) 33.1 (28.3) 30.0 (21.0) 34.4 (16.4) 50 (35.3)
Tricare/VA/IHS 15.5 (25.7) 16.5 (27.0) 8.9 (6.6) 6.5 (3.1) 5
Self-Pay 11.9 (16.7) 12.3 (17.4) 11.0 (14.8) 8.4 (6.3) -
Other 43.4 (40.9) 42.4 (40.4) 0 (0) 51 (69.2) 60 (56.5)

64
Table A2.9 Nurse practitioner response summary on influences for selecting practice location.
Influence on decision to
accept current primary
position
Overall
Mean(Media
n)
Urban Large rural
town
Small rural
town
Isolated small
rural town
1=Not influential 2=Least influential 3=Somewhat influential 4=Most influential 5=Extremely influential
Location 3.6 (4) 3.5 (3) 3.9 (4) 3.9 (4) 3.8 (4)
Salary 3.8 (4) 3.8 (4) 3.5 (3) 4.4 (5) 3.5 (3)
Benefits 3.5 (3) 3.5 (4) 3.2 (3) 3.1 (3) 4 (4)
Job Description 4.1 (4) 4.1 (4) 3.8 (4) 4 (4.5) 4 (4)
Other 3.1 (4)
Table A2.10 Nurse practitioner response summary on future work plans.
In how many years do you
plan to do the following?
% (n)
Overall Urban Large rural
town
Small rural
town
Isolated small
rural town
Retire
<1 year 2.3 (8) 2.0 (6) 10.0 (2) 0 (0) 0 (0)
1-2 years 1.5 (5) 1.6 (5) 0 (0) 0 (0) 0 (0)
3-5 years 7.8 (27) 8.2 (25) 5.0 (1) 0 (0) 16.7 (1)
6-10 years 13.6 (47) 14.1 (43) 10.0 (2) 14.3 (2) 0 (0)
>10 years 39.6 (137) 39.9 (122) 30.0 (6) 50.0 (7) 33.3 (2)
No plans/Do not know 23.7 (82) 22.9 (70) 30.0 (6) 35.7 (5) 16.7 (1)
No response 11.6 (40) 11.4 (35) 15.0 (3) 0 (0) 33.3 (2)
Significantly Reduce Patient
Hours
<1 year 3.5 (12) 3.3 (10) 10.0 (2) 0 (0) 0 (0)
1-2 years 4.3 (15) 4.3 (13) 5.0 (1) 0 (0) 16.7 (1)
3-5 years 12.7 (44 ) 13.1 (40) 5.0 (1) 21.4 (3) 0 (0)
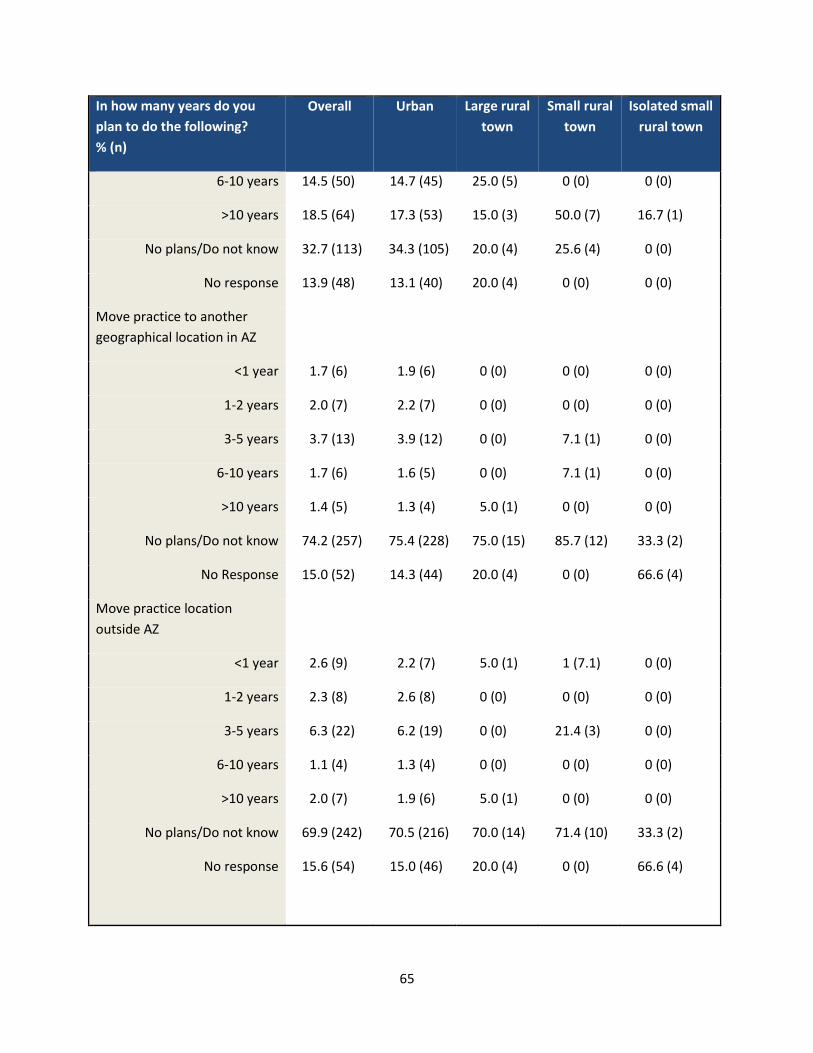
65
In how many years do you
plan to do the following?
% (n)
Overall Urban Large rural
town
Small rural
town
Isolated small
rural town
6-10 years 14.5 (50) 14.7 (45) 25.0 (5) 0 (0) 0 (0)
>10 years 18.5 (64) 17.3 (53) 15.0 (3) 50.0 (7) 16.7 (1)
No plans/Do not know 32.7 (113) 34.3 (105) 20.0 (4) 25.6 (4) 0 (0)
No response 13.9 (48) 13.1 (40) 20.0 (4) 0 (0) 0 (0)
Move practice to another
geographical location in AZ
<1 year 1.7 (6) 1.9 (6) 0 (0) 0 (0) 0 (0)
1-2 years 2.0 (7) 2.2 (7) 0 (0) 0 (0) 0 (0)
3-5 years 3.7 (13) 3.9 (12) 0 (0) 7.1 (1) 0 (0)
6-10 years 1.7 (6) 1.6 (5) 0 (0) 7.1 (1) 0 (0)
>10 years 1.4 (5) 1.3 (4) 5.0 (1) 0 (0) 0 (0)
No plans/Do not know 74.2 (257) 75.4 (228) 75.0 (15) 85.7 (12) 33.3 (2)
No Response 15.0 (52) 14.3 (44) 20.0 (4) 0 (0) 66.6 (4)
Move practice location
outside AZ
<1 year 2.6 (9) 2.2 (7) 5.0 (1) 1 (7.1) 0 (0)
1-2 years 2.3 (8) 2.6 (8) 0 (0) 0 (0) 0 (0)
3-5 years 6.3 (22) 6.2 (19) 0 (0) 21.4 (3) 0 (0)
6-10 years 1.1 (4) 1.3 (4) 0 (0) 0 (0) 0 (0)
>10 years 2.0 (7) 1.9 (6) 5.0 (1) 0 (0) 0 (0)
No plans/Do not know 69.9 (242) 70.5 (216) 70.0 (14) 71.4 (10) 33.3 (2)
No response 15.6 (54) 15.0 (46) 20.0 (4) 0 (0) 66.6 (4)
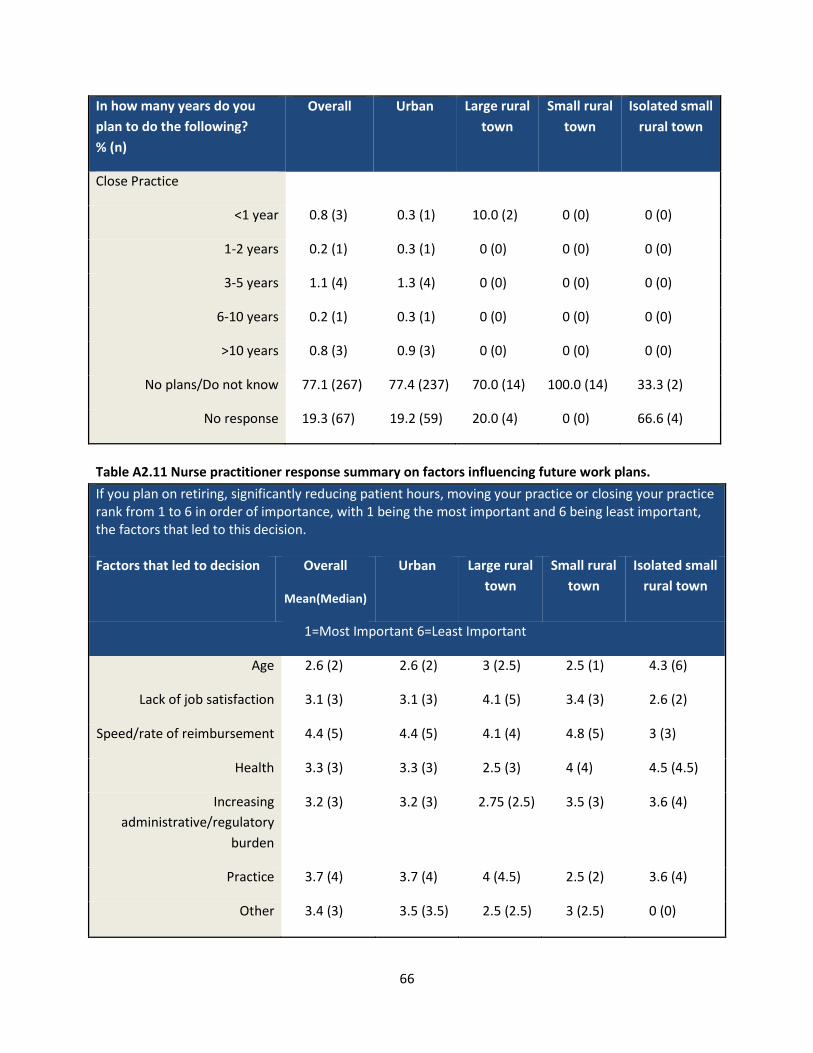
66
In how many years do you
plan to do the following?
% (n)
Overall Urban Large rural
town
Small rural
town
Isolated small
rural town
Close Practice
<1 year 0.8 (3) 0.3 (1) 10.0 (2) 0 (0) 0 (0)
1-2 years 0.2 (1) 0.3 (1) 0 (0) 0 (0) 0 (0)
3-5 years 1.1 (4) 1.3 (4) 0 (0) 0 (0) 0 (0)
6-10 years 0.2 (1) 0.3 (1) 0 (0) 0 (0) 0 (0)
>10 years 0.8 (3) 0.9 (3) 0 (0) 0 (0) 0 (0)
No plans/Do not know 77.1 (267) 77.4 (237) 70.0 (14) 100.0 (14) 33.3 (2)
No response 19.3 (67) 19.2 (59) 20.0 (4) 0 (0) 66.6 (4)
Table A2.11 Nurse practitioner response summary on factors influencing future work plans.
If you plan on retiring, significantly reducing patient hours, moving your practice or closing your practice rank from 1 to 6 in order of importance, with 1 being the most important and 6 being least important, the factors that led to this decision. Factors that led to decision Overall
Mean(Median)
Urban Large rural
town
Small rural
town
Isolated small
rural town
1=Most Important 6=Least Important
Age 2.6 (2) 2.6 (2) 3 (2.5) 2.5 (1) 4.3 (6)
Lack of job satisfaction 3.1 (3) 3.1 (3) 4.1 (5) 3.4 (3) 2.6 (2)
Speed/rate of reimbursement 4.4 (5) 4.4 (5) 4.1 (4) 4.8 (5) 3 (3)
Health 3.3 (3) 3.3 (3) 2.5 (3) 4 (4) 4.5 (4.5)
Increasing
administrative/regulatory
burden
3.2 (3) 3.2 (3) 2.75 (2.5) 3.5 (3) 3.6 (4)
Practice 3.7 (4) 3.7 (4) 4 (4.5) 2.5 (2) 3.6 (4)
Other 3.4 (3) 3.5 (3.5) 2.5 (2.5) 3 (2.5) 0 (0)

67
Table A2.12 Nurse practitioner response summary on Medicare/Medicaid acceptance and practice
ownership.
Practice Questions Overall
%
Urban Large rural
town
Small rural
town
Isolated small
rural town
Currently accepting
Medicare/Medicaid patients
Both Medicare/Medicaid 53.7 51.9 70.0 71.4 50.0
Medicaid Only 6.6 6.8 5.0 7.1 0
Medicare Only 10.9 11.4 5.0 14.2 0
Neither 15.6 16.9 5.0 0 16.6
No response 13.0 12.7 15.0 7.1 33.3
If no, why not?
Reimbursement rates too low 4.3 4.2 5.0 7.1 0
Practice is at maximum
capacity
2.0 2.2 0 0 0
No new members available 0 0 0 0 0
Other 18.7 11.9 23.0 9.0 0
Currently practice on your
own
Full ownership 4.3 3.5 15.0 7.1 0
Part ownership 1.4 1.3 0 7.1 0
No ownership 79.4 81.0 70.0 78.5 33.3
No response 14.7 14.0 15.0 7.1 66.6

68
A2.3 Certified Nurse Midwife data
Table A2.13 Respondent characteristics of certified nurse midwife survey.
Characteristic Overall
n=42
Urban Large rural
town
Small rural
town
Isolated small
rural town
Licensed CNMs (active) 28 (27) 36 3 3 0
Licensed obtained in AZ 30
(71.4%)
26 2 2 0
Employed as CNM 29
(70.7%)
Age in years Mean (SD) 52.9
(11.4)
52.8 (11.2) 57.6 (17.0) 47 (11.3) -
Female 100%
Ethnicity n (%)
Alaskan Native/Native American 1 (2.3) 1 (2.7)
Asian or Pacific Islander 0 (0) 0 (0)
Black/African American (non-
Hispanic)
0 (0) 0 (0)
Hispanic/Latino 0 (0) 0 (0)
White (non-Hispanic) 40 (95.2) 35 (97.2) 3 (100.0) 2 (100.0)
Other 0 (0) 0 (0)

69
Map A2.5 Population coverage by certified nurse midwives in areas with residential populations (US Census 2010).

70
Map A2.6 Certified nurse midwife survey response rate in areas with residential populations (US Census 2010).

71
Table A2.14 Certified nurse midwife response summary on practice type, hours of work, and payment
source.
Primary Work Setting
% (n)
Overall Urban
Large rural
town
Small
rural
town
Isolated
small rural
town
Practice Type
Primary Care 54.7 (23) 55.5 (20) 66.6 (2) 33.3 (1) -
Specialty 11.9 (5) 11.1 (4) 0 (0) 33.3 (1) -
Total hours/week spent at
facility
Less than 5 hours 0 (0) 0 (0) 0 (0) 0 (0) -
5-10 hours 2.3 (1) 2.7 (1) 0 (0) 0 (0) -
10-15 hours 0 (0) 0 (0) 0 (0) 0 (0) -
15-20 hours 4.7 (2) 5.5 (2) 0 (0) 0 (0) -
20-25 hours 0 (0) 0 (0) 0 (0) 0 (0) -
25-30 hours 11.9 (5) 11.1 (4) 0 (0) 33.3 (1) -
30-35 hours 2.3 (1) 2.7 (1) 0 (0) 0 (0) -
35-40 hours 19.0 (8) 16.6 (6) 66.6 (2) 0 (0) -
More than 40 hours 23.8 (10) 25.0 (9) 0 (0) 33.3 (1) -
No Response 35.7 (15) 36.1 (13) 33.3 (1) 0 (0) -
Patient Primary Source of
Payment
Mean % (SD)
Medicare 16.2 (25.1) 14.5 (25.0) 26.5 (33.2) 0 (0) -
Tricare/VA/IHS 13.2 (22.1) 13.8 (22.7) 3 0 (0) -
Self-Pay 14.4 (22) 13.1 (22.1) 25 (32.5) 20 -
Other 48.7 (18.8) 48.7 (48.8) 0 (0) 0 (0) -

72
Table A2.15 Certified nurse midwife response summary on influences for selecting practice location.
Influence on decision to
accept current primary
position
Overall
Mean
(Median)
Urban Large rural
town
Small rural
town
Isolated small
rural town
1=Not influential 2=Least influential 3=Somewhat influential 4=Most influential 5=Extremely influential
Location 4.2 (4.5) 4.2 (5) 4.5 (4.5) 3.5 (3.5) -
Salary 3.5 (3) 3.6 (3) 4 (4) 2 (2) -
Benefits 3.1 (3) 3.3 (3) 2 (2) 2 (2) -
Job Description 3.8 (4) 4.0 (4) 2.5 (2.5) 2.5 (2.5) -
Other 2.8 (4) 2.3 (2) 4 (4) 4 (4) -
Table A2.16 Certified nurse midwife response summary on future work plans.
In how many years do you
plan to do the following?
% (n)
Overall Urban Large rural
town
Small rural
town
Isolated small
rural town
Retire
<1 year 2.3 (1) 2.7 (1) 0 (0) 0 (0) -
1-2 years 11.9 (5) 11.1 (4) 33.3 (1) 0 (0) -
3-5 years 4.76 (2) 5.5 (2) 0 (0) 0 (0) -
6-10 years 4.76 (2) 5.5 (2) 0 (0) 0 (0) -
>10 years 16.6 (7) 19.4 (7) 0 (0) 0 (0) -
No plans/Do not know 26.1 (11) 22.2 (8) 33.3 (1) 66.6 (2) -
No response 33.3 (14) 33.3 (12) 33.3 (1) 33.3 (1) -
Significantly Reduce Patient
Hours
<1 year 0 (0) 0 (0) 0 (0) 0 (0) -
1-2 years 4.7 (2 ) 2.7 (1) 1 (33.3) 0 (0) -
3-5 years 0 (0) 0 (0) 0 (0) 0 (0) -

73
In how many years do you
plan to do the following?
% (n)
Overall Urban Large rural
town
Small rural
town
Isolated small
rural town
6-10 years 7.1 (3) 8.3 (3) 0 (0) 0 (0) -
>10 years 11.9 (5) 13.8 (5) 0 (0) 0 (0) -
No plans/Do not know 38.1 (16) 36.1 (13) 33.3 (1) 66.6 (2) -
No response 38.1 (16) 38.8 (14) 33.3 (1) 33.3 (1) -
Move practice to another
geographical location in AZ
<1 year 0 (0) 0 (0) 0 (0) 0 (0) -
1-2 years 1 (2.3) 0 (0) 0 (0) 33.3 (1) -
3-5 years 0 (0) 0 (0) 0 (0) 0 (0) -
6-10 years 0 (0) 0 (0) 0 (0) 0 (0) -
>10 years 1 (2.3) 1 (2.7) 0 (0) 0 (0) -
No plans/Do not know 24 (57.1) 21 (58.3) 2 (66.6) 33.3 (1) -
No response 16 (38.1) 14 (38.8) 33.3 (1) 33.3 (1) -
Move practice location outside
AZ
<1 year 2.3 (1) 2.7 (1) 0 (0) 0 (0) -
1-2 years 2.3 (1) 0 (0) 0 (0) 33.3 (1) -
3-5 years 0 (0) 0 (0) 0 (0) 0 (0) -
6-10 years 0 (0) 0 (0) 0 (0) 0 (0) -
>10 years 2.3 (1) 2.7 (1) 0 (0) 0 (0) -
No plans/Do not know 54.7 (23) 55.5 (20) 66.6 (2) 33.3 (1) -
No response 38.1 (16) 38.8 (14) 33.3 (1) 33.3 (1) -

74
In how many years do you
plan to do the following?
% (n)
Overall Urban Large rural
town
Small rural
town
Isolated small
rural town
Close Practice
<1 year 0 (0) 0 (0) 0 (0) 0 (0) -
1-2 years 0 (0) 0 (0) 0 (0) 0 (0) -
3-5 years 0 (0) 0 (0) 0 (0) 0 (0) -
6-10 years 0 (0) 0 (0) 0 (0) 0 (0) -
>10 years 0 (0) 0 (0) 0 (0) 0 (0) -
No plans/Do not know 61.9 (26) 61.1 (22) 66.6 (2) 66.6 (2) -
No response 38.1 (16) 38.8 (14) 33.3 (1) 33.3 (1) -
Table A2.17 Certified nurse midwife response summary on factors influencing future work plans.
If you plan on retiring, significantly reducing patient hours, moving your practice or closing your practice rank from 1 to 6 in order of importance, with 1 being the most important and 6 being least important, the factors that led to this decision. Factors that led to decision Overall
Mean(Media
n)
Urban Large rural
town
Small rural
town
Isolated small
rural town
1=Most Important 6=Least Important
Age 2.0 (1) 1.7 (1) 2 6 -
Lack of job satisfaction 3.3 (3) 3.5 (3.5) 3 3 (3) -
Speed/rate of reimbursement 5.2 (5.5) 5.5 (6) - 2 -
Health 3.3 (3.5) 3.1 (3) 5 4 -
Increasing
administrative/regulatory
burden
3.1 (3) 3.2 (3) 4 1 -
Practice 3.5 (4) 4 (4) 1 3 -
Other 3.6 (4) 2.5 (2.5) 6 - -
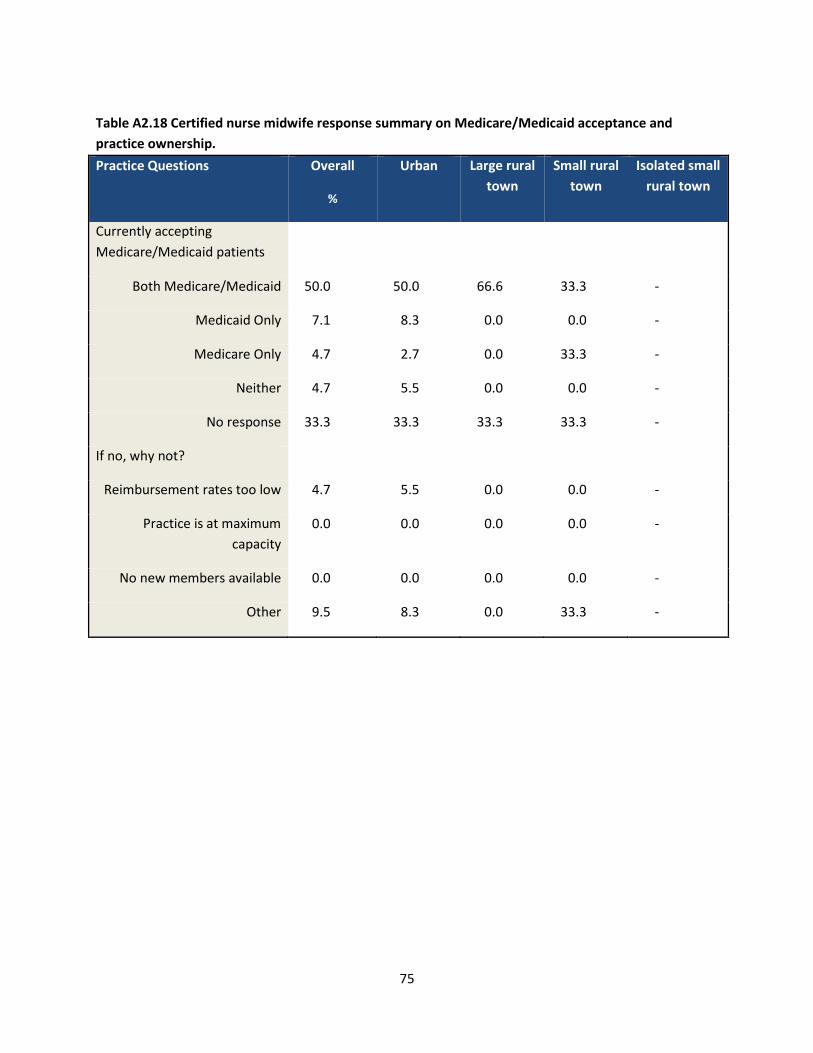
75
Table A2.18 Certified nurse midwife response summary on Medicare/Medicaid acceptance and
practice ownership.
Practice Questions Overall
%
Urban Large rural
town
Small rural
town
Isolated small
rural town
Currently accepting
Medicare/Medicaid patients
Both Medicare/Medicaid 50.0 50.0 66.6 33.3 -
Medicaid Only 7.1 8.3 0.0 0.0 -
Medicare Only 4.7 2.7 0.0 33.3 -
Neither 4.7 5.5 0.0 0.0 -
No response 33.3 33.3 33.3 33.3 -
If no, why not?
Reimbursement rates too low 4.7 5.5 0.0 0.0 -
Practice is at maximum
capacity
0.0 0.0 0.0 0.0 -
No new members available 0.0 0.0 0.0 0.0 -
Other 9.5 8.3 0.0 33.3 -


