5 Year Plan and Strategic Options
Submission to Monitor
31 December 2013
1
The Rotherham NHS Foundation Trust
DRAFT
TRFT – Strategic Direction
Page No.
1. Executive Summary 3 - 6
2. Strategic Direction – principles 7
3. Approach Taken 8 - 10
4. Clinical Sustainability 11
5. Financial Plan 12 - 22
6. Transformation Programme 23 - 28
7. Strategic Options 29 - 32
8. Conclusion 33
9. Potential Areas of Collaboration 34 - 35
10. Key Risks 36 - 37
11. Summary of Actions Over Next 3 Months 38 - 40
2 DRAFT
1.0 Executive Summary - Background
3
• The Trust is required to achieve financial (as well as clinical and operational)
sustainability.
• However, the Trust has not achieved a surplus position over the last 3 years and has
remained in deficit. Historically the provision of significant non-recurrent funding support
from the commissioners has masked the extent of the underlying deficit. The financial
difficulties were exacerbated in June 2012 by the introduction of the Electronic Patient
Record (EPR), resulting in significant operational difficulties which negatively impacted
on the ability to record clinical activity data and therefore to accurately reclaim income
from commissioners, resulting in significant reputational damage. These issues have
largely been resolved.
• However in October 2012, the Trust was found in breach of its Terms of Authorisation by
Monitor and in November 2012, commissioned Bolt Partners to formulate savings plans
(FY13/14 and FY14/15), and identify potential strategic options to achieve long term
financial sustainability.
• This work was financially driven. However, whilst the Trust is clinically sustainable at this
time, like other similarly sized trusts, there will be increasing future pressures on services
in terms of demand, clinical quality including patient expectations, professional, and
regulatory requirements.
• Clinical sustainability will need to be kept under review, to ensure strategies are delivered
where needed to secure long term resilience and continuity of high quality service
provision, affordably, to meet the needs of the population.
DRAFT
1.1 Executive Summary - Timeline
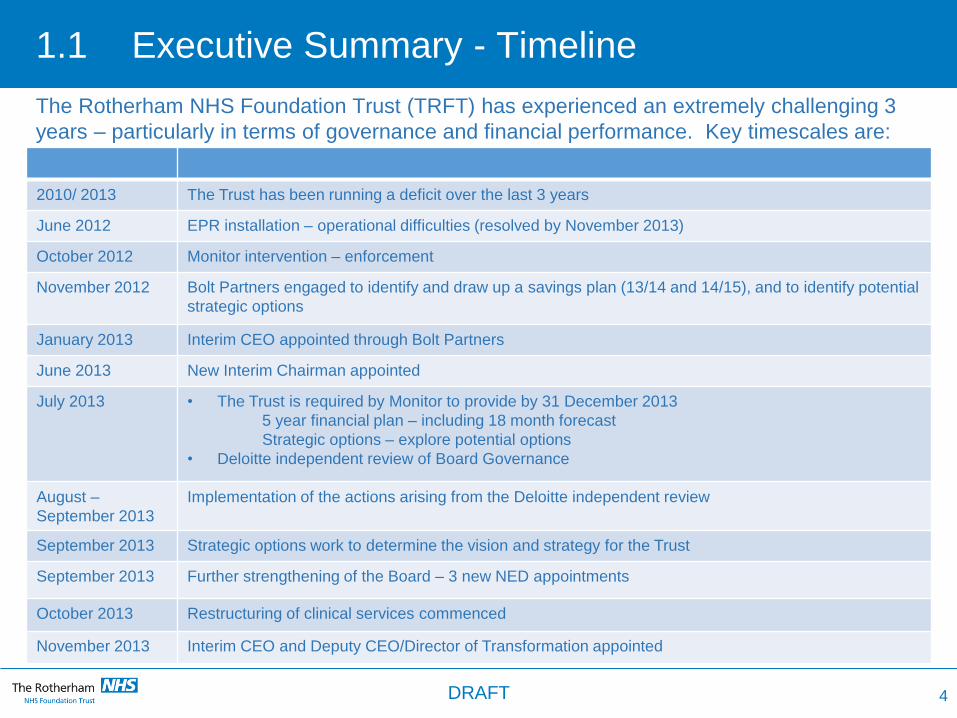
The Rotherham NHS Foundation Trust (TRFT) has experienced an extremely challenging 3
years – particularly in terms of governance and financial performance. Key timescales are:
4
2010/ 2013 The Trust has been running a deficit over the last 3 years
June 2012 EPR installation – operational difficulties (resolved by November 2013)
October 2012 Monitor intervention – enforcement
November 2012 Bolt Partners engaged to identify and draw up a savings plan (13/14 and 14/15), and to identify potential
strategic options
January 2013 Interim CEO appointed through Bolt Partners
June 2013 New Interim Chairman appointed
July 2013 • The Trust is required by Monitor to provide by 31 December 2013
5 year financial plan – including 18 month forecast
Strategic options – explore potential options
• Deloitte independent review of Board Governance
August –
September 2013
Implementation of the actions arising from the Deloitte independent review
September 2013 Strategic options work to determine the vision and strategy for the Trust
September 2013 Further strengthening of the Board – 3 new NED appointments
October 2013 Restructuring of clinical services commenced
November 2013 Interim CEO and Deputy CEO/Director of Transformation appointed
DRAFT
1.2 Executive Summary
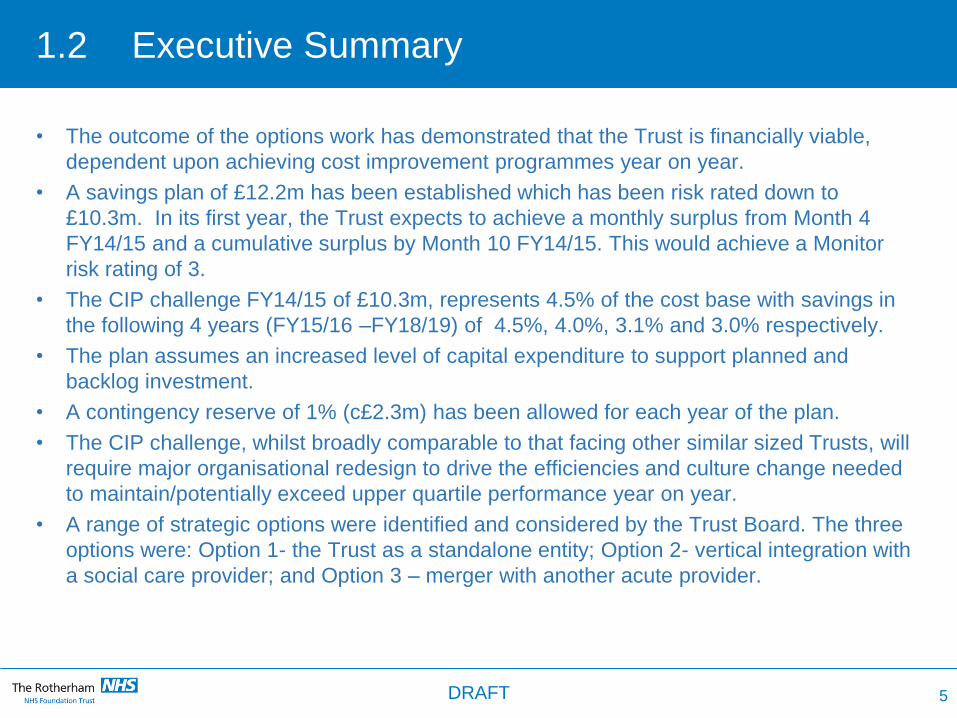
• The outcome of the options work has demonstrated that the Trust is financially viable,
dependent upon achieving cost improvement programmes year on year.
• A savings plan of £12.2m has been established which has been risk rated down to
£10.3m. In its first year, the Trust expects to achieve a monthly surplus from Month 4
FY14/15 and a cumulative surplus by Month 10 FY14/15. This would achieve a Monitor
risk rating of 3.
• The CIP challenge FY14/15 of £10.3m, represents 4.5% of the cost base with savings in
the following 4 years (FY15/16 –FY18/19) of 4.5%, 4.0%, 3.1% and 3.0% respectively.
• The plan assumes an increased level of capital expenditure to support planned and
backlog investment.
• A contingency reserve of 1% (c£2.3m) has been allowed for each year of the plan.
• The CIP challenge, whilst broadly comparable to that facing other similar sized Trusts, will
require major organisational redesign to drive the efficiencies and culture change needed
to maintain/potentially exceed upper quartile performance year on year.
• A range of strategic options were identified and considered by the Trust Board. The three
options were: Option 1- the Trust as a standalone entity; Option 2- vertical integration with
a social care provider; and Option 3 – merger with another acute provider.
5 DRAFT
1.3 Executive Summary
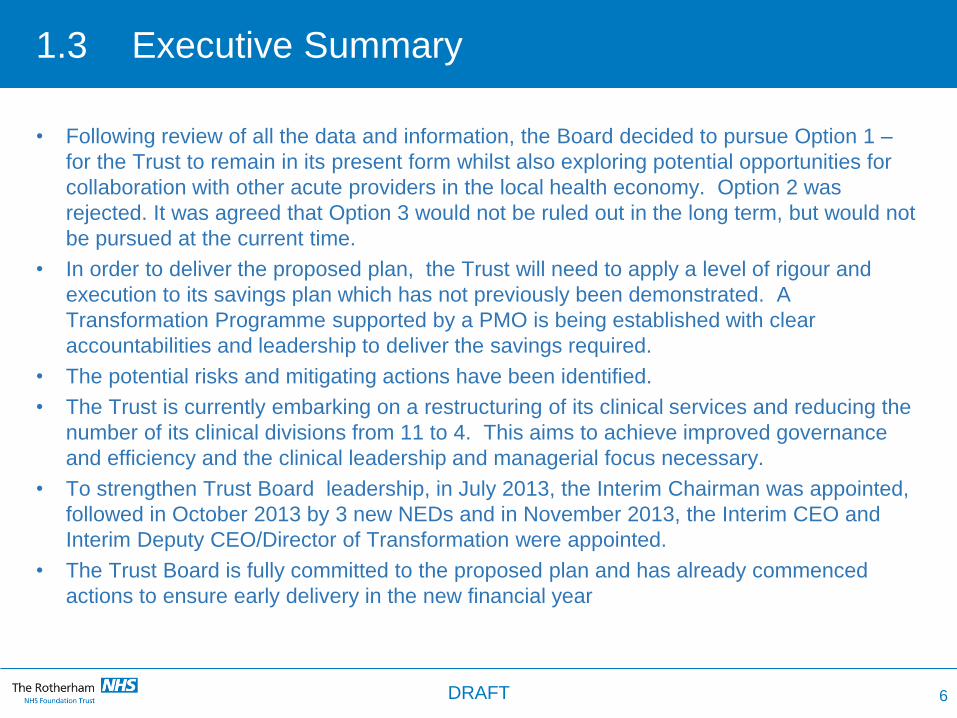
• Following review of all the data and information, the Board decided to pursue Option 1 –
for the Trust to remain in its present form whilst also exploring potential opportunities for
collaboration with other acute providers in the local health economy. Option 2 was
rejected. It was agreed that Option 3 would not be ruled out in the long term, but would not
be pursued at the current time.
• In order to deliver the proposed plan, the Trust will need to apply a level of rigour and
execution to its savings plan which has not previously been demonstrated. A
Transformation Programme supported by a PMO is being established with clear
accountabilities and leadership to deliver the savings required.
• The potential risks and mitigating actions have been identified.
• The Trust is currently embarking on a restructuring of its clinical services and reducing the
number of its clinical divisions from 11 to 4. This aims to achieve improved governance
and efficiency and the clinical leadership and managerial focus necessary.
• To strengthen Trust Board leadership, in July 2013, the Interim Chairman was appointed,
followed in October 2013 by 3 new NEDs and in November 2013, the Interim CEO and
Interim Deputy CEO/Director of Transformation were appointed.
• The Trust Board is fully committed to the proposed plan and has already commenced
actions to ensure early delivery in the new financial year
6 DRAFT
2.0 Strategic Direction - Principles
The following set of principles underpin the plan:
• The need to ensure the continued delivery of high quality acute and community services to
the population of Rotherham and patients served by the Trust.
• The requirement to achieve clinical and financial sustainability.
• To ensure patients are at the heart of what we do, providing them with excellent clinical
outcomes and a first class experience.
• Achievement of current and future quality accreditation standards.
• Continual development of services that meet the changing healthcare needs of the patients
we serve.
• Partnership working across the local health economy to ensure wider sustainability of
healthcare provision.
• Secure arrangements for access to all specialist services.
• A realistic level of CAPEX investment over period of the plan.
7 DRAFT
3.0 Approach Taken
• The options work was overseen by the Trust Board, led by the Chairman and Interim CEO
supported by Bolt Partners, reporting to the CEO.
• At the outset, a 2 day strategic event took place in 2013 that included all key stakeholders,
i.e. commissioners, social services, Trust staff (clinical and managerial), Trust Board,
Governors and patient representation, to identify what the key strategic options should be
for the organisation.
• This resulted in the identification of potential options which were then fully explored with
stakeholders in the development of the plan.
• The clinical challenges currently facing the organisation were considered including: A&E;
maternity and paediatrics; our priority to deliver right care, right time, right place; and scale
of services, in order to assess current viability.
• The options work was also approached from the position that the Trust is currently clinically
sustainable and in particular assumed: on-going provision of a 24 hour A&E service,
supported by appropriate emergency care provision and a comprehensive and safe
maternity service; retention of acute and community services and improved integration.
• The options work was financially driven and focused internally on clinical engagement.
Whilst wider health economy clinical reference groups were not convened, Trust clinicians,
in addition to non-clinical staff, were able to regularly contribute views through Trust-wide
engagement events, the medical staffing committee and staff side.
8 DRAFT
3.1 Approach Taken
• Potential financial advantages of merger were considered at a high level only and
predicated on economies of scale at Trust Board, middle manager and back office levels.
• Data used was obtained from publically available sources such as annual accounts, CQC
and Dr Foster, which provided information on the Trust and organisations in the wider
health economy. These included:
• Strategic needs assessment of population profiles
• Geographical locations and travelling distances for the Trust catchment population
• Size, number and type of specialities and workforce profiles
• Income, expenditure and financial metrics
• Potential partner organisations were approached to secure input and views on the plan in
addition to their potential appetite to work collaboratively in different formats as per Options
1,2, and 3.
• Legal advice was taken to inform the nature of discussions to ensure no prejudice to any
future actions, particularly regarding any potential merger.
• The potential future impact of changes such as 7 days working and changes in clinical and
regulatory requirements was not factored into the assessment at this stage.
9 DRAFT
3.2 Approach Taken
This plan has been developed following engagement of key internal and external
stakeholders, including:
• On-going involvement of main commissioner in plan development to ensure
commissioner supported income levels and to reflect shared priorities including
commissioner and Trust-led initiatives.
• Regular Trust-wide engagement events led by the Chairman and CEO including
Governors, clinical and non-clinical staff and colleagues representing our main
commissioner.
• Discussions with working together partners/neighbouring Trusts on specific work
streams and potential options.
• On-going involvement of Medical Staff Committee and local staff side representatives.
• Discussions/briefings of local MPs by the Trust.
• External stakeholder briefings on work to develop strategic options, with the opportunity
to contribute views, e.g. with Rotherham Metropolitan Borough Council and social
services.
Feedback received from stakeholders was shared with the Trust Board by the Chairman,
CEO and Bolt Partners and taken into account as part of the decision making process.
10 DRAFT
4.0 Clinical Sustainability
• The outcome of the work undertaken by Bolt Partners identified the Trust as currently clinically viable.
• However, following investigation, whilst no concerns were identified regarding the quality of care, some specialties were found to be potentially suboptimal due to their relative low workload and size. Therefore, further work is needed to assess viability in more depth at specialty level in order to identify strategies to increase resilience in service delivery in the longer term. The impact of future clinical, regulatory and other national pressures such as 7 day working have not yet been taken into account. This is likely to demand increased levels of collaboration with other providers.
• Clinically led, systematic speciality based reviews will commence in early 2014, supported by information on service size, reference costs and clinical outcomes. This is essential to ensure financial and clinical sustainability and does not preclude potential disinvestment in some service lines where it is found that they have a continuous negative value.
• Like other similarly-sized Trusts, clinical viability and sustainability will need to be kept under constant review, to reflect potential changes in future requirements, such as royal college guidelines, accreditation requirements, 7 day working, changes in clinical practice, medical and technological advancement, patient demand and expectations.
• All cost improvement schemes will be subject to mandatory quality impact assessments, which will be signed off by the divisional clinical leads, the Chief Nurse and Medical Director. These will be robustly monitored through the newly formed project management office and quality governance committees.
11 DRAFT
5.0 Financial - Overview
• A 5 year financial plan has been developed.
• The forecast outturn for FY13/14 (as at month 8) is (£3.3m) and the FY14/15 underlying
deficit (after adjustments for non-recurrent items) is (£4.7m).
• After inflationary and other cost pressures, this would require achievement of a savings
target of £9.6m to break even in FY14/15.
• This plan achieves a surplus each year. This is dependent upon achieving CIP of £10.3m
(risk adjusted from £12.2m) in FY14/15, which represents 4.5% of the cost base and
savings in the following 4 years (FY15/16 –FY18/19) of 4.5%, 4.0%, 3.1% and 3.0%
respectively.
• In FY 14/15, the plan achieves in-month surplus by month 4 and cumulative surplus by
month 10
• Key planning assumptions are included in this section.
• The plan achieves a continuity of service risk rating of at least 3 throughout the plan period.
• The Trust has a reasonable cash position throughout the plan period. Whilst this does
include £5m FTFF which underpins the CAPEX position, the cash position is resilient and
commensurate with the surplus I&E position.
• The level of CAPEX provided allows for routine and backlog maintenance and this is
consistent with the level of depreciation in the I&E.
12 DRAFT
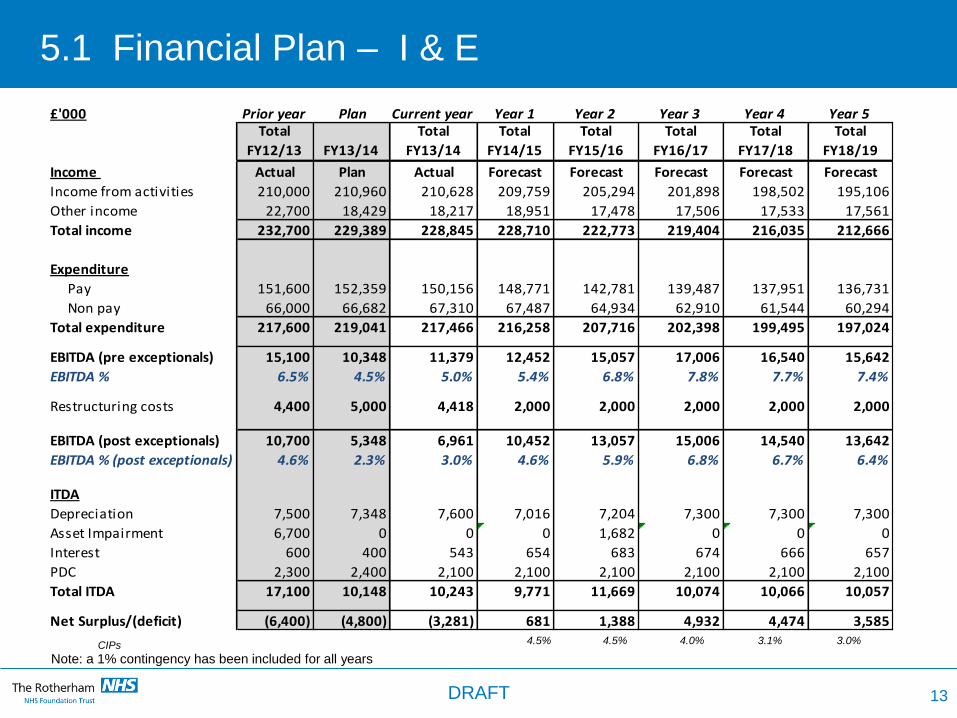
5.1 Financial Plan – I & E
CIPs 4.5% 4.5% 4.0% 3.1% 3.0%
13
£'000 Prior year Plan Current year Year 1 Year 2 Year 3 Year 4 Year 5Total
FY12/13 FY13/14
Total
FY13/14
Total
FY14/15
Total
FY15/16
Total
FY16/17
Total
FY17/18
Total
FY18/19
Income Actual Plan Actual Forecast Forecast Forecast Forecast Forecast
Income from activities 210,000 210,960 210,628 209,759 205,294 201,898 198,502 195,106
Other income 22,700 18,429 18,217 18,951 17,478 17,506 17,533 17,561
Total income 232,700 229,389 228,845 228,710 222,773 219,404 216,035 212,666
Expenditure
Pay 151,600 152,359 150,156 148,771 142,781 139,487 137,951 136,731
Non pay 66,000 66,682 67,310 67,487 64,934 62,910 61,544 60,294
Total expenditure 217,600 219,041 217,466 216,258 207,716 202,398 199,495 197,024
EBITDA (pre exceptionals) 15,100 10,348 11,379 12,452 15,057 17,006 16,540 15,642
EBITDA % 6.5% 4.5% 5.0% 5.4% 6.8% 7.8% 7.7% 7.4%
Restructuring costs 4,400 5,000 4,418 2,000 2,000 2,000 2,000 2,000
EBITDA (post exceptionals) 10,700 5,348 6,961 10,452 13,057 15,006 14,540 13,642
EBITDA % (post exceptionals) 4.6% 2.3% 3.0% 4.6% 5.9% 6.8% 6.7% 6.4%
ITDA
Depreciation 7,500 7,348 7,600 7,016 7,204 7,300 7,300 7,300
Asset Impairment 6,700 0 0 0 1,682 0 0 0
Interest 600 400 543 654 683 674 666 657
PDC 2,300 2,400 2,100 2,100 2,100 2,100 2,100 2,100
Total ITDA 17,100 10,148 10,243 9,771 11,669 10,074 10,066 10,057
Net Surplus/(deficit) (6,400) (4,800) (3,281) 681 1,388 4,932 4,474 3,585
Note: a 1% contingency has been included for all years
DRAFT
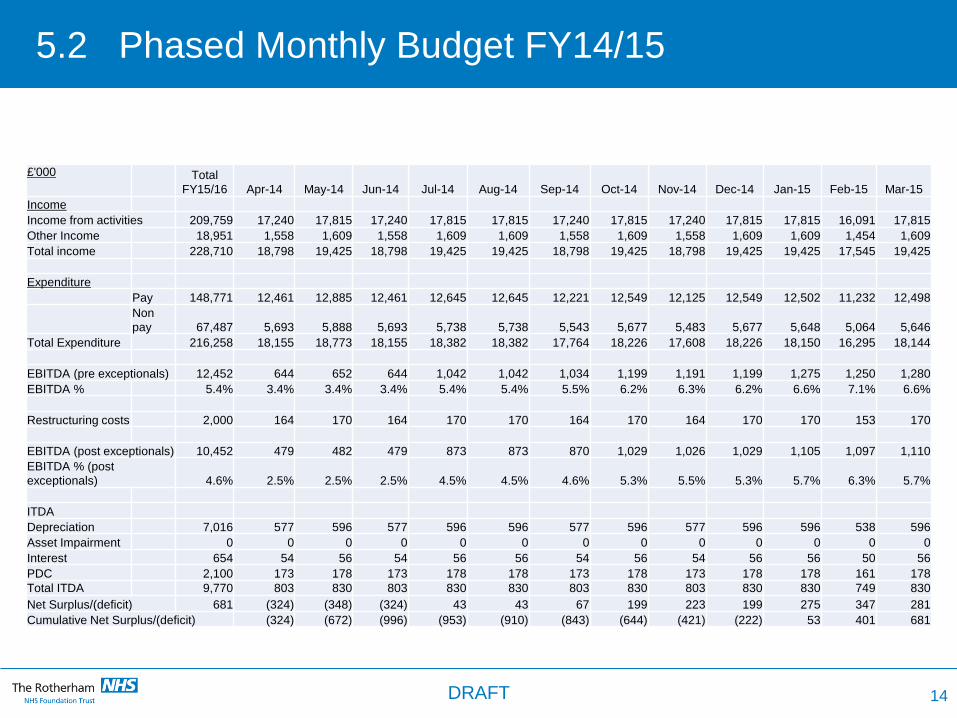
5.2 Phased Monthly Budget FY14/15
14
£'000 Total
FY15/16 Apr-14 May-14 Jun-14 Jul-14 Aug-14 Sep-14 Oct-14 Nov-14 Dec-14 Jan-15 Feb-15 Mar-15
Income
Income from activities 209,759 17,240 17,815 17,240 17,815 17,815 17,240 17,815 17,240 17,815 17,815 16,091 17,815
Other Income 18,951 1,558 1,609 1,558 1,609 1,609 1,558 1,609 1,558 1,609 1,609 1,454 1,609
Total income 228,710 18,798 19,425 18,798 19,425 19,425 18,798 19,425 18,798 19,425 19,425 17,545 19,425
Expenditure
Pay 148,771 12,461 12,885 12,461 12,645 12,645 12,221 12,549 12,125 12,549 12,502 11,232 12,498
Non
pay 67,487 5,693 5,888 5,693 5,738 5,738 5,543 5,677 5,483 5,677 5,648 5,064 5,646
Total Expenditure 216,258 18,155 18,773 18,155 18,382 18,382 17,764 18,226 17,608 18,226 18,150 16,295 18,144
EBITDA (pre exceptionals) 12,452 644 652 644 1,042 1,042 1,034 1,199 1,191 1,199 1,275 1,250 1,280
EBITDA % 5.4% 3.4% 3.4% 3.4% 5.4% 5.4% 5.5% 6.2% 6.3% 6.2% 6.6% 7.1% 6.6%
Restructuring costs 2,000 164 170 164 170 170 164 170 164 170 170 153 170
EBITDA (post exceptionals) 10,452 479 482 479 873 873 870 1,029 1,026 1,029 1,105 1,097 1,110
EBITDA % (post
exceptionals) 4.6% 2.5% 2.5% 2.5% 4.5% 4.5% 4.6% 5.3% 5.5% 5.3% 5.7% 6.3% 5.7%
ITDA
Depreciation 7,016 577 596 577 596 596 577 596 577 596 596 538 596
Asset Impairment 0 0 0 0 0 0 0 0 0 0 0 0 0
Interest 654 54 56 54 56 56 54 56 54 56 56 50 56
PDC 2,100 173 178 173 178 178 173 178 173 178 178 161 178 Total ITDA 9,770 803 830 803 830 830 803 830 803 830 830 749 830
Net Surplus/(deficit) 681 (324) (348) (324) 43 43 67 199 223 199 275 347 281
Cumulative Net Surplus/(deficit) (324) (672) (996) (953) (910) (843) (644) (421) (222) 53 401 681
DRAFT
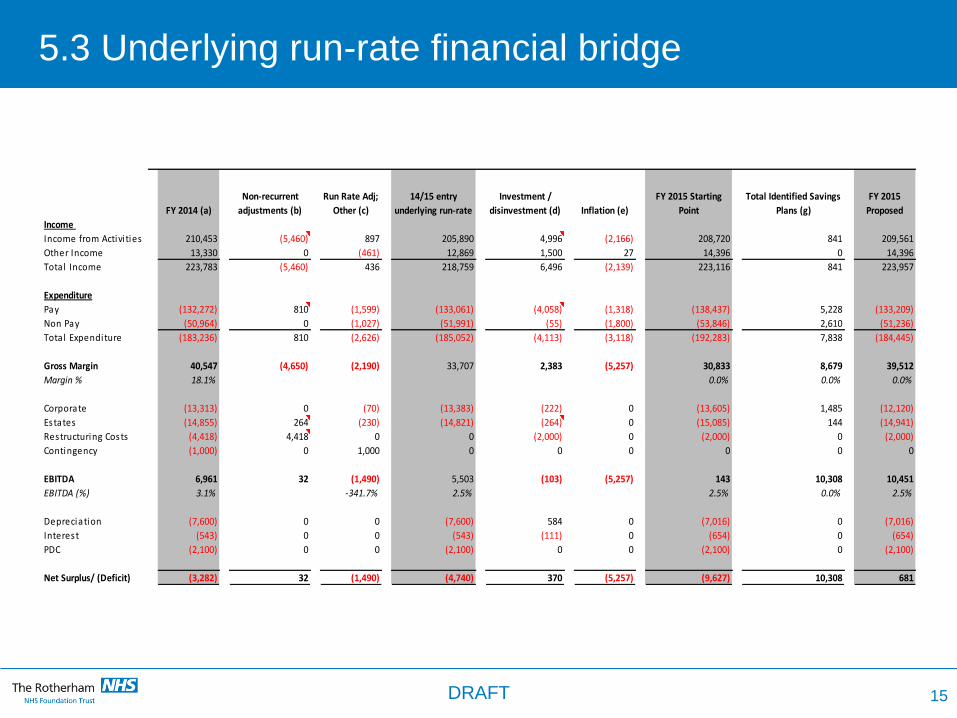
5.3 Underlying run-rate financial bridge
FY 2014 (a)
Non-recurrent
adjustments (b)
Run Rate Adj;
Other (c)
14/15 entry
underlying run-rate
Investment /
disinvestment (d) Inflation (e)
FY 2015 Starting
Point
Total Identified Savings
Plans (g)
FY 2015
Proposed
Income
Income from Activi ties 210,453 (5,460) 897 205,890 4,996 (2,166) 208,720 841 209,561
Other Income 13,330 0 (461) 12,869 1,500 27 14,396 0 14,396
Total Income 223,783 (5,460) 436 218,759 6,496 (2,139) 223,116 841 223,957
Expenditure
Pay (132,272) 810 (1,599) (133,061) (4,058) (1,318) (138,437) 5,228 (133,209)
Non Pay (50,964) 0 (1,027) (51,991) (55) (1,800) (53,846) 2,610 (51,236)
Total Expenditure (183,236) 810 (2,626) (185,052) (4,113) (3,118) (192,283) 7,838 (184,445)
Gross Margin 40,547 (4,650) (2,190) 33,707 2,383 (5,257) 30,833 8,679 39,512
Margin % 18.1% 0.0% 0.0% 0.0%
Corporate (13,313) 0 (70) (13,383) (222) 0 (13,605) 1,485 (12,120)
Estates (14,855) 264 (230) (14,821) (264) 0 (15,085) 144 (14,941)
Restructuring Costs (4,418) 4,418 0 0 (2,000) 0 (2,000) 0 (2,000)
Contingency (1,000) 0 1,000 0 0 0 0 0 0
EBITDA 6,961 32 (1,490) 5,503 (103) (5,257) 143 10,308 10,451
EBITDA (%) 3.1% -341.7% 2.5% 2.5% 0.0% 2.5%
Depreciation (7,600) 0 0 (7,600) 584 0 (7,016) 0 (7,016)
Interest (543) 0 0 (543) (111) 0 (654) 0 (654)
PDC (2,100) 0 0 (2,100) 0 0 (2,100) 0 (2,100)
Net Surplus/ (Deficit) (3,282) 32 (1,490) (4,740) 370 (5,257) (9,627) 10,308 681
15 DRAFT
(12,000)
(10,000)
(8,000)
(6,000)
(4,000)
(2,000)
-
2,000
(3,282)
(5,460) 5,492
(1,490) 370
(3,118) (9,627)
681
(4,740)
(2,139)
10,308
16
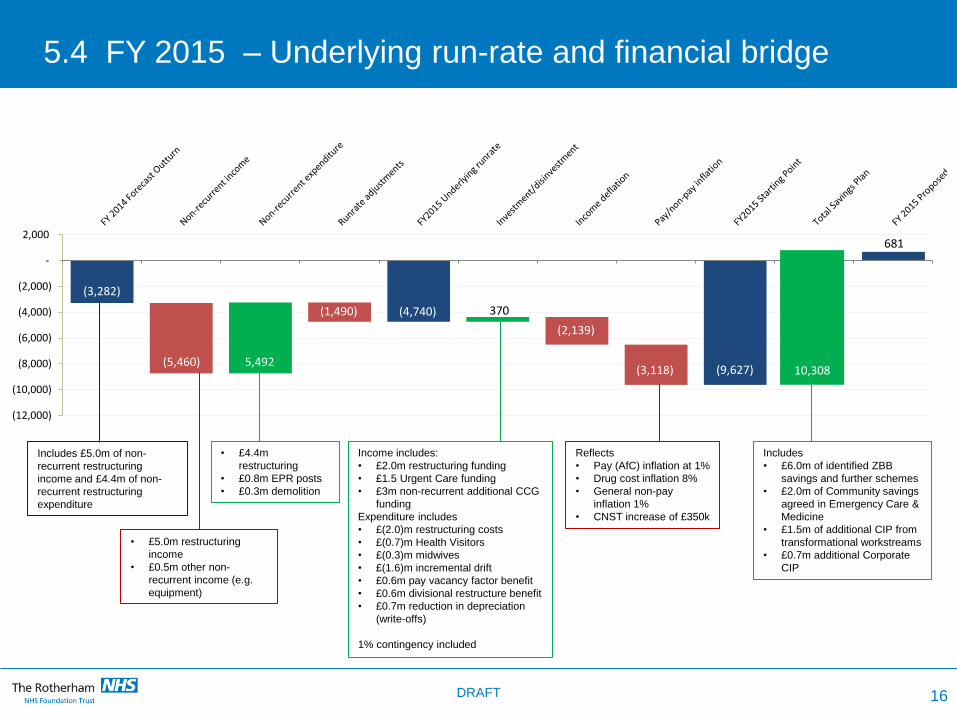
5.4 FY 2015 – Underlying run-rate and financial bridge
Includes £5.0m of non-
recurrent restructuring
income and £4.4m of non-
recurrent restructuring
expenditure
• £5.0m restructuring
income
• £0.5m other non-
recurrent income (e.g.
equipment)
• £4.4m
restructuring
• £0.8m EPR posts
• £0.3m demolition
Income includes:
• £2.0m restructuring funding
• £1.5 Urgent Care funding
• £3m non-recurrent additional CCG
funding
Expenditure includes
• £(2.0)m restructuring costs
• £(0.7)m Health Visitors
• £(0.3)m midwives
• £(1.6)m incremental drift
• £0.6m pay vacancy factor benefit
• £0.6m divisional restructure benefit
• £0.7m reduction in depreciation
(write-offs)
1% contingency included
Reflects
• Pay (AfC) inflation at 1%
• Drug cost inflation 8%
• General non-pay
inflation 1%
• CNST increase of £350k
Includes
• £6.0m of identified ZBB
savings and further schemes
• £2.0m of Community savings
agreed in Emergency Care &
Medicine
• £1.5m of additional CIP from
transformational workstreams
• £0.7m additional Corporate
CIP
DRAFT
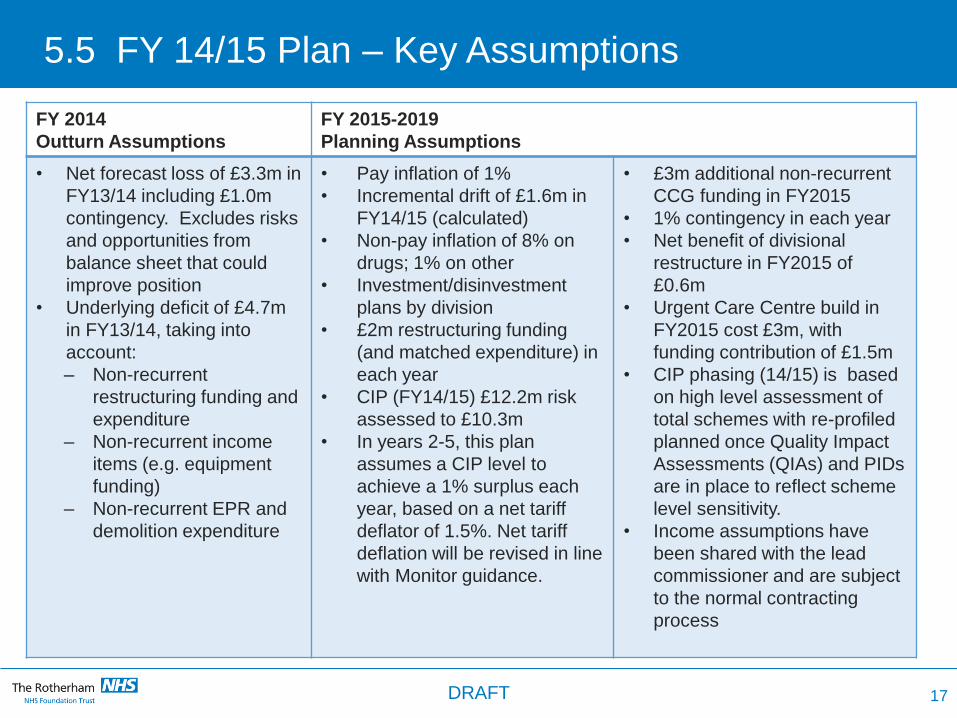
5.5 FY 14/15 Plan – Key Assumptions
FY 2014
Outturn Assumptions
FY 2015-2019
Planning Assumptions
• Net forecast loss of £3.3m in
FY13/14 including £1.0m
contingency. Excludes risks
and opportunities from
balance sheet that could
improve position
• Underlying deficit of £4.7m
in FY13/14, taking into
account:
– Non-recurrent
restructuring funding and
expenditure
– Non-recurrent income
items (e.g. equipment
funding)
– Non-recurrent EPR and
demolition expenditure
• Pay inflation of 1%
• Incremental drift of £1.6m in
FY14/15 (calculated)
• Non-pay inflation of 8% on
drugs; 1% on other
• Investment/disinvestment
plans by division
• £2m restructuring funding
(and matched expenditure) in
each year
• CIP (FY14/15) £12.2m risk
assessed to £10.3m
• In years 2-5, this plan
assumes a CIP level to
achieve a 1% surplus each
year, based on a net tariff
deflator of 1.5%. Net tariff
deflation will be revised in line
with Monitor guidance.
• £3m additional non-recurrent
CCG funding in FY2015
• 1% contingency in each year
• Net benefit of divisional
restructure in FY2015 of
£0.6m
• Urgent Care Centre build in
FY2015 cost £3m, with
funding contribution of £1.5m
• CIP phasing (14/15) is based
on high level assessment of
total schemes with re-profiled
planned once Quality Impact
Assessments (QIAs) and PIDs
are in place to reflect scheme
level sensitivity.
• Income assumptions have
been shared with the lead
commissioner and are subject
to the normal contracting
process
17 DRAFT
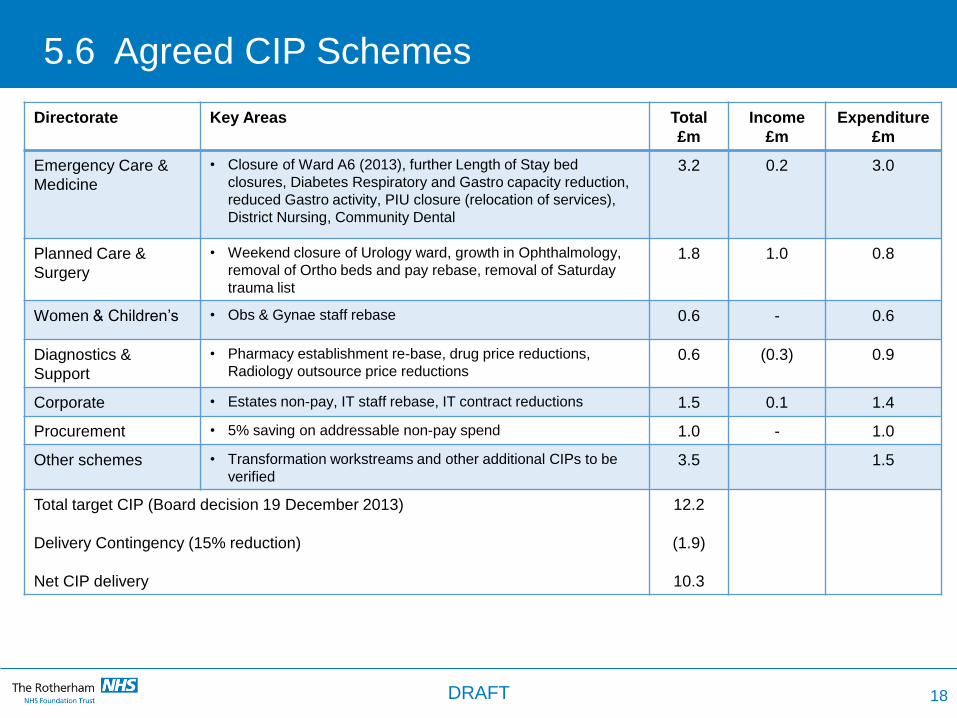
5.6 Agreed CIP Schemes
18
Directorate Key Areas Total
£m
Income
£m
Expenditure
£m
Emergency Care &
Medicine
• Closure of Ward A6 (2013), further Length of Stay bed
closures, Diabetes Respiratory and Gastro capacity reduction,
reduced Gastro activity, PIU closure (relocation of services),
District Nursing, Community Dental
3.2 0.2 3.0
Planned Care &
Surgery
• Weekend closure of Urology ward, growth in Ophthalmology,
removal of Ortho beds and pay rebase, removal of Saturday
trauma list
1.8 1.0 0.8
Women & Children’s • Obs & Gynae staff rebase 0.6 - 0.6
Diagnostics &
Support
• Pharmacy establishment re-base, drug price reductions,
Radiology outsource price reductions 0.6 (0.3) 0.9
Corporate • Estates non-pay, IT staff rebase, IT contract reductions 1.5 0.1 1.4
Procurement • 5% saving on addressable non-pay spend 1.0 - 1.0
Other schemes • Transformation workstreams and other additional CIPs to be
verified 3.5 1.5
Total target CIP (Board decision 19 December 2013)
Delivery Contingency (15% reduction)
Net CIP delivery
12.2
(1.9)
10.3
DRAFT
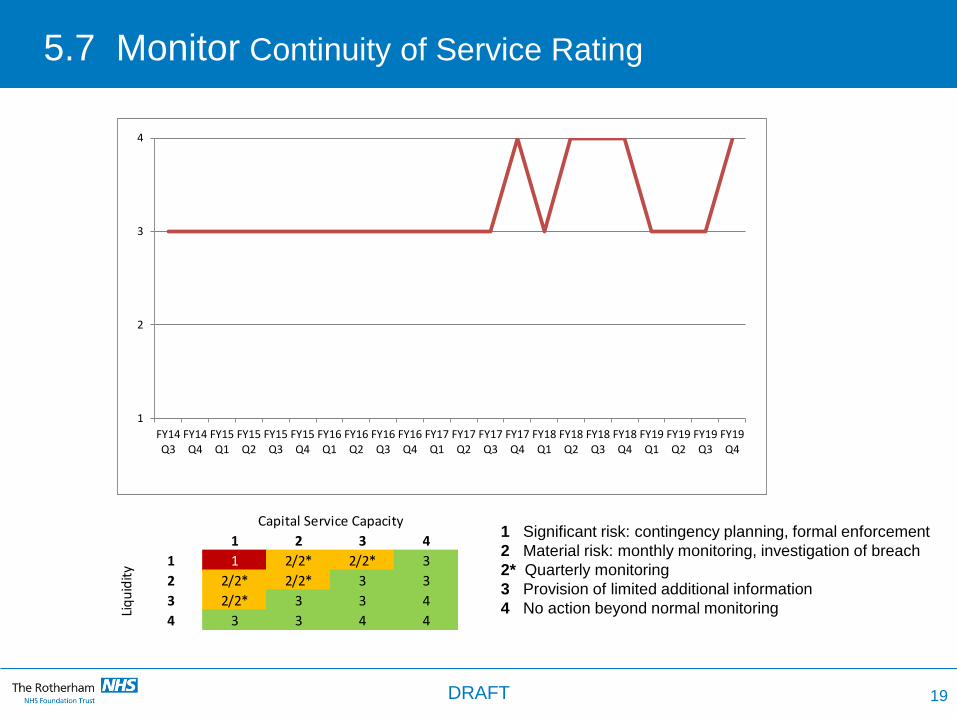
5.7 Monitor Continuity of Service Rating
1 2 3 4
1 1 2/2* 2/2* 3
2 2/2* 2/2* 3 3
3 2/2* 3 3 4
4 3 3 4 4
Liq
uid
ity
Capital Service Capacity1 Significant risk: contingency planning, formal enforcement
2 Material risk: monthly monitoring, investigation of breach
2* Quarterly monitoring
3 Provision of limited additional information
4 No action beyond normal monitoring
1
2
3
4
FY14Q3
FY14Q4
FY15Q1
FY15Q2
FY15Q3
FY15Q4
FY16Q1
FY16Q2
FY16Q3
FY16Q4
FY17Q1
FY17Q2
FY17Q3
FY17Q4
FY18Q1
FY18Q2
FY18Q3
FY18Q4
FY19Q1
FY19Q2
FY19Q3
FY19Q4
19 DRAFT
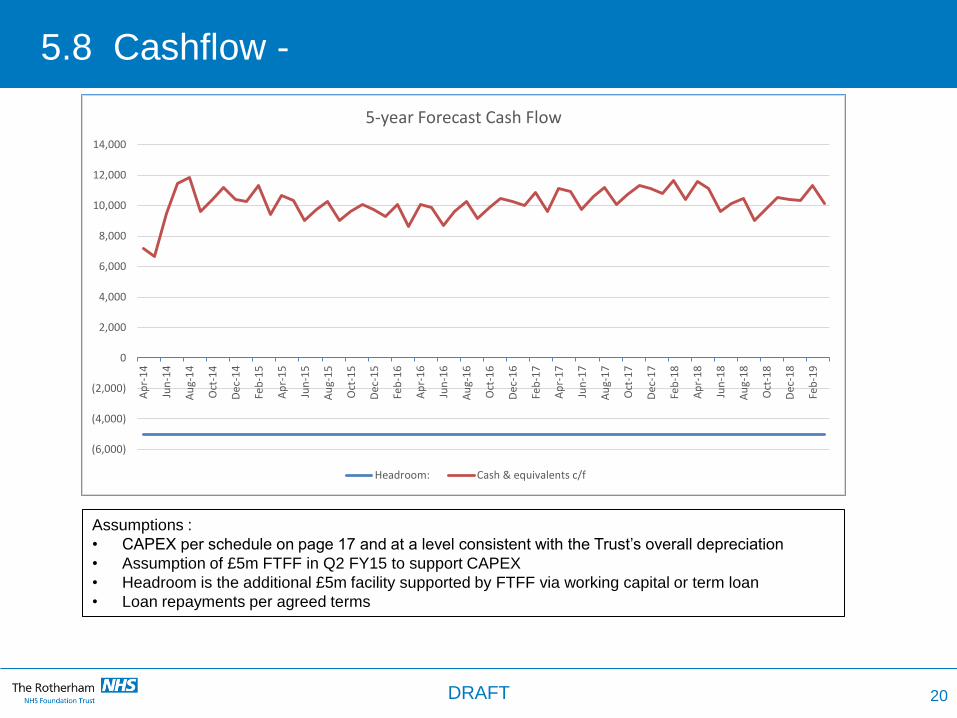
5.8 Cashflow -
(6,000)
(4,000)
(2,000)
0
2,000
4,000
6,000
8,000
10,000
12,000
14,000A
pr-
14
Jun
-14
Au
g-1
4
Oct
-14
Dec
-14
Feb
-15
Ap
r-1
5
Jun
-15
Au
g-1
5
Oct
-15
Dec
-15
Feb
-16
Ap
r-1
6
Jun
-16
Au
g-1
6
Oct
-16
Dec
-16
Feb
-17
Ap
r-1
7
Jun
-17
Au
g-1
7
Oct
-17
Dec
-17
Feb
-18
Ap
r-1
8
Jun
-18
Au
g-1
8
Oct
-18
Dec
-18
Feb
-19
5-year Forecast Cash Flow
Headroom: Cash & equivalents c/f
20
Assumptions :
• CAPEX per schedule on page 17 and at a level consistent with the Trust’s overall depreciation
• Assumption of £5m FTFF in Q2 FY15 to support CAPEX
• Headroom is the additional £5m facility supported by FTFF via working capital or term loan
• Loan repayments per agreed terms
DRAFT
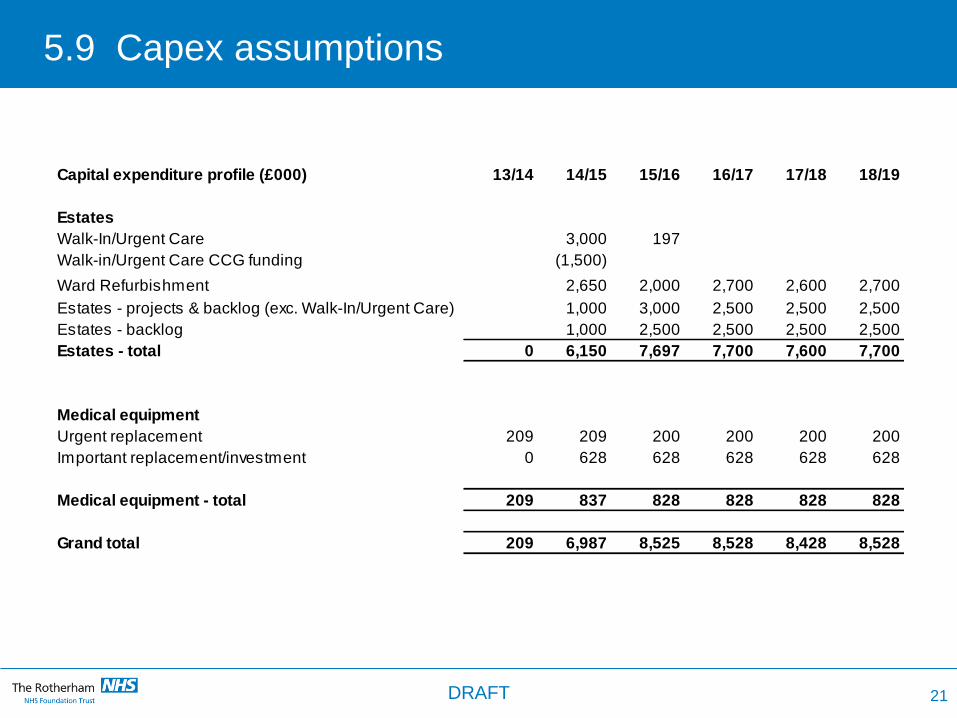
5.9 Capex assumptions
Capital expenditure profile (£000) 13/14 14/15 15/16 16/17 17/18 18/19
Estates
Walk-In/Urgent Care 3,000 197
Walk-in/Urgent Care CCG funding (1,500)
Ward Refurbishment 2,650 2,000 2,700 2,600 2,700
Estates - projects & backlog (exc. Walk-In/Urgent Care) 1,000 3,000 2,500 2,500 2,500
Estates - backlog 1,000 2,500 2,500 2,500 2,500
Estates - total 0 6,150 7,697 7,700 7,600 7,700
Medical equipment
Urgent replacement 209 209 200 200 200 200
Important replacement/investment 0 628 628 628 628 628
Medical equipment - total 209 837 828 828 828 828
Grand total 209 6,987 8,525 8,528 8,428 8,528
21 DRAFT
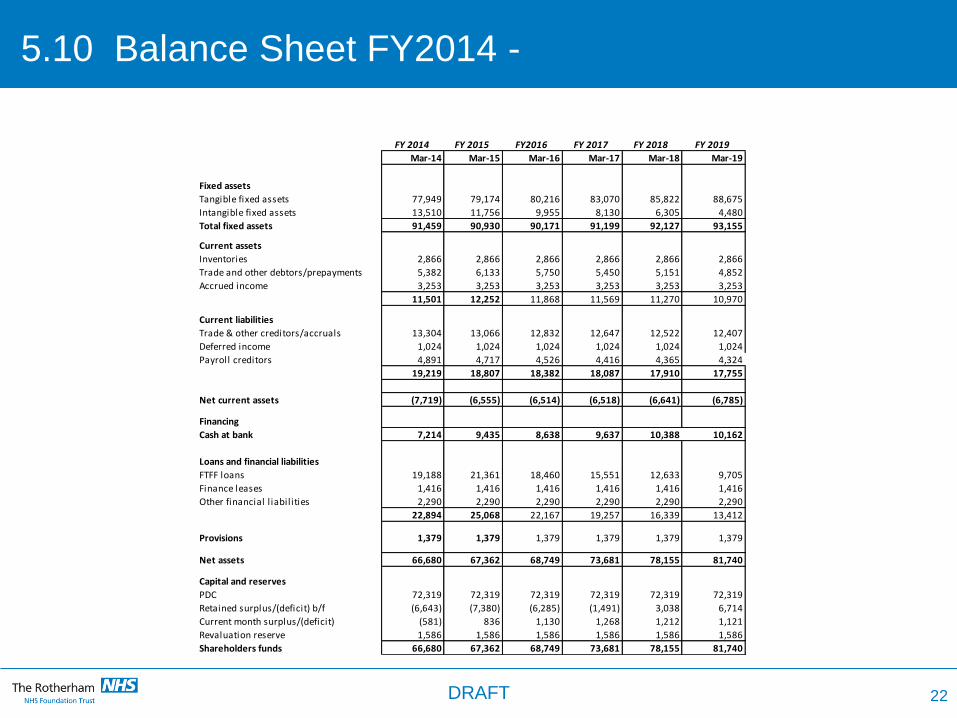
5.10 Balance Sheet FY2014 -
Mar-14 Mar-15 Mar-16 Mar-17 Mar-18 Mar-19
Fixed assets
Tangible fixed assets 77,949 79,174 80,216 83,070 85,822 88,675
Intangible fixed assets 13,510 11,756 9,955 8,130 6,305 4,480
Total fixed assets 91,459 90,930 90,171 91,199 92,127 93,155
Current assets
Inventories 2,866 2,866 2,866 2,866 2,866 2,866
Trade and other debtors/prepayments 5,382 6,133 5,750 5,450 5,151 4,852
Accrued income 3,253 3,253 3,253 3,253 3,253 3,253
11,501 12,252 11,868 11,569 11,270 10,970
Current liabilities
Trade & other creditors/accruals 13,304 13,066 12,832 12,647 12,522 12,407
Deferred income 1,024 1,024 1,024 1,024 1,024 1,024
Payroll creditors 4,891 4,717 4,526 4,416 4,365 4,324
19,219 18,807 18,382 18,087 17,910 17,755
Net current assets (7,719) (6,555) (6,514) (6,518) (6,641) (6,785)
Financing
Cash at bank 7,214 9,435 8,638 9,637 10,388 10,162
Loans and financial liabilities
FTFF loans 19,188 21,361 18,460 15,551 12,633 9,705
Finance leases 1,416 1,416 1,416 1,416 1,416 1,416
Other financial l iabilities 2,290 2,290 2,290 2,290 2,290 2,290
22,894 25,068 22,167 19,257 16,339 13,412
Provisions 1,379 1,379 1,379 1,379 1,379 1,379
Net assets 66,680 67,362 68,749 73,681 78,155 81,740
Capital and reserves
PDC 72,319 72,319 72,319 72,319 72,319 72,319
Retained surplus/(deficit) b/f (6,643) (7,380) (6,285) (1,491) 3,038 6,714
Current month surplus/(deficit) (581) 836 1,130 1,268 1,212 1,121
Revaluation reserve 1,586 1,586 1,586 1,586 1,586 1,586
Shareholders funds 66,680 67,362 68,749 73,681 78,155 81,740
FY 2019FY 2014 FY 2015 FY2016 FY 2017 FY 2018
22 DRAFT
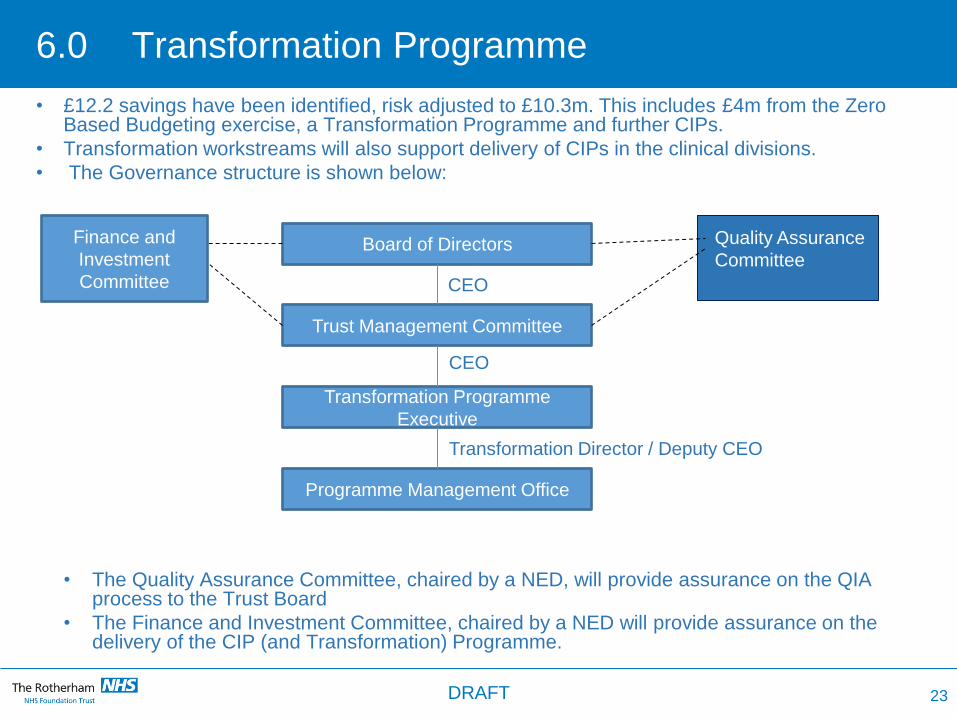
6.0 Transformation Programme
• £12.2 savings have been identified, risk adjusted to £10.3m. This includes £4m from the Zero Based Budgeting exercise, a Transformation Programme and further CIPs.
• Transformation workstreams will also support delivery of CIPs in the clinical divisions.
• The Governance structure is shown below:
• The Quality Assurance Committee, chaired by a NED, will provide assurance on the QIA process to the Trust Board
• The Finance and Investment Committee, chaired by a NED will provide assurance on the delivery of the CIP (and Transformation) Programme.
Board of Directors
Trust Management Committee
Transformation Programme
Executive
Programme Management Office
CEO
CEO
Transformation Director / Deputy CEO
23
Quality Assurance
Committee
Finance and
Investment
Committee
DRAFT
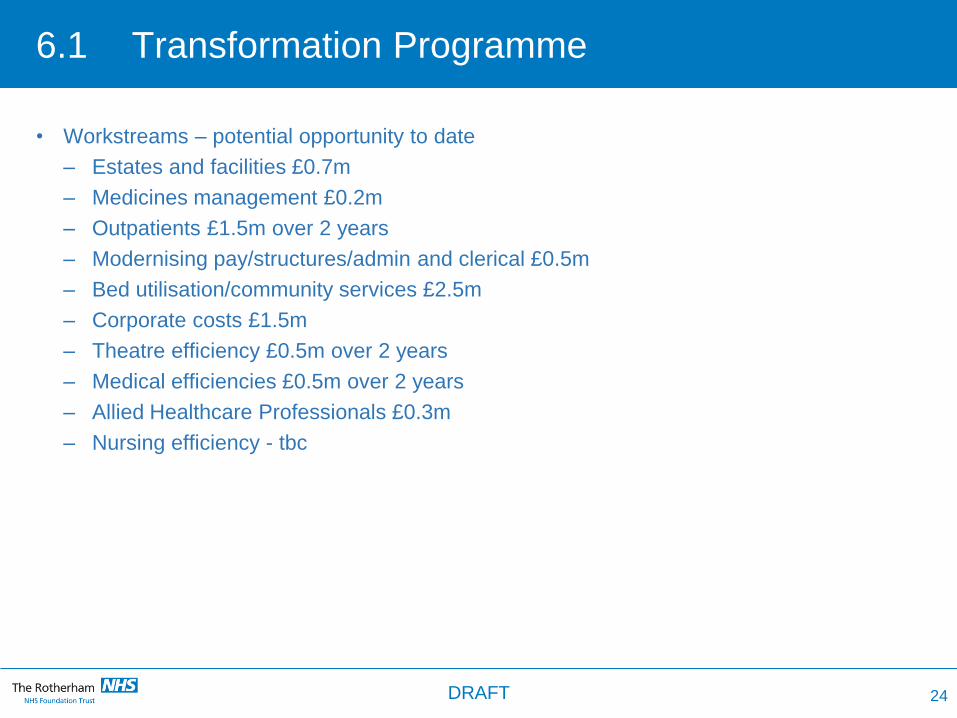
6.1 Transformation Programme
• Workstreams – potential opportunity to date
– Estates and facilities £0.7m
– Medicines management £0.2m
– Outpatients £1.5m over 2 years
– Modernising pay/structures/admin and clerical £0.5m
– Bed utilisation/community services £2.5m
– Corporate costs £1.5m
– Theatre efficiency £0.5m over 2 years
– Medical efficiencies £0.5m over 2 years
– Allied Healthcare Professionals £0.3m
– Nursing efficiency - tbc
24 DRAFT
6.2 Transformation programme
• Drive improved financial performance/efficiencies through clinical engagement, focusing
on:
– Service line management
– Best practice tariffs
– Pathway design
• Key areas of cost control to be strengthened:
– Agency, locums
– Premium and variable pay spend
– Headcount
• All programmes will be subject to Quality Impact Assessments, signed off by the Medical
Director and Chief Nurse.
• An outline 12 month transformation programme is provided below.
25 DRAFT
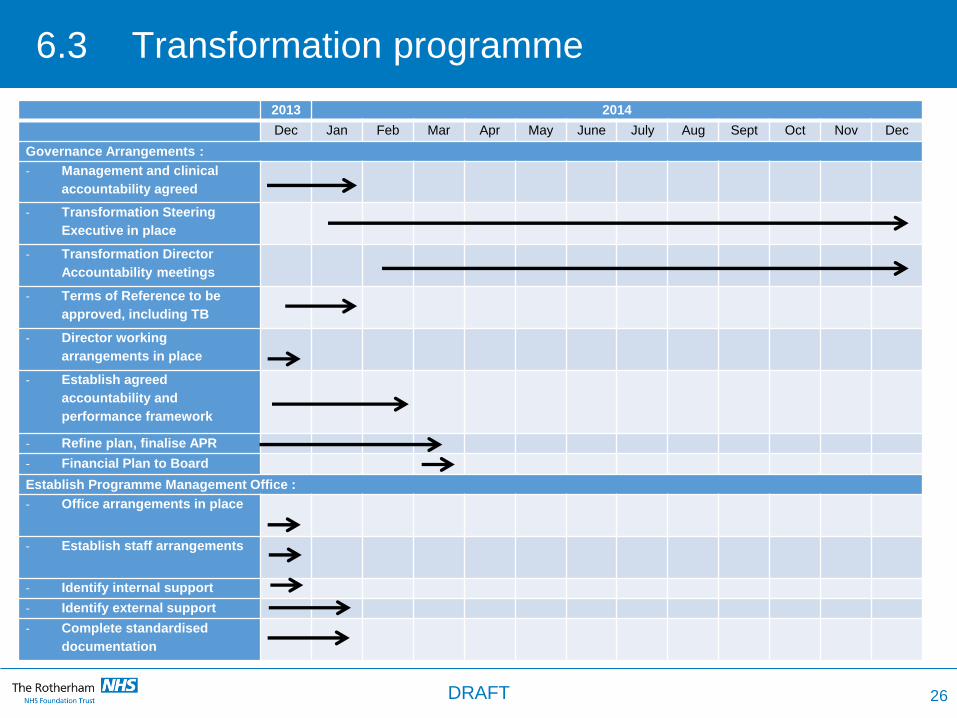
6.3 Transformation programme
26
2013 2014
Dec Jan Feb Mar Apr May June July Aug Sept Oct Nov Dec
Governance Arrangements :
- Management and clinical
accountability agreed
- Transformation Steering
Executive in place
- Transformation Director
Accountability meetings
- Terms of Reference to be
approved, including TB
- Director working
arrangements in place
- Establish agreed
accountability and
performance framework
- Refine plan, finalise APR
- Financial Plan to Board
Establish Programme Management Office :
- Office arrangements in place
- Establish staff arrangements
- Identify internal support
- Identify external support
- Complete standardised
documentation
DRAFT
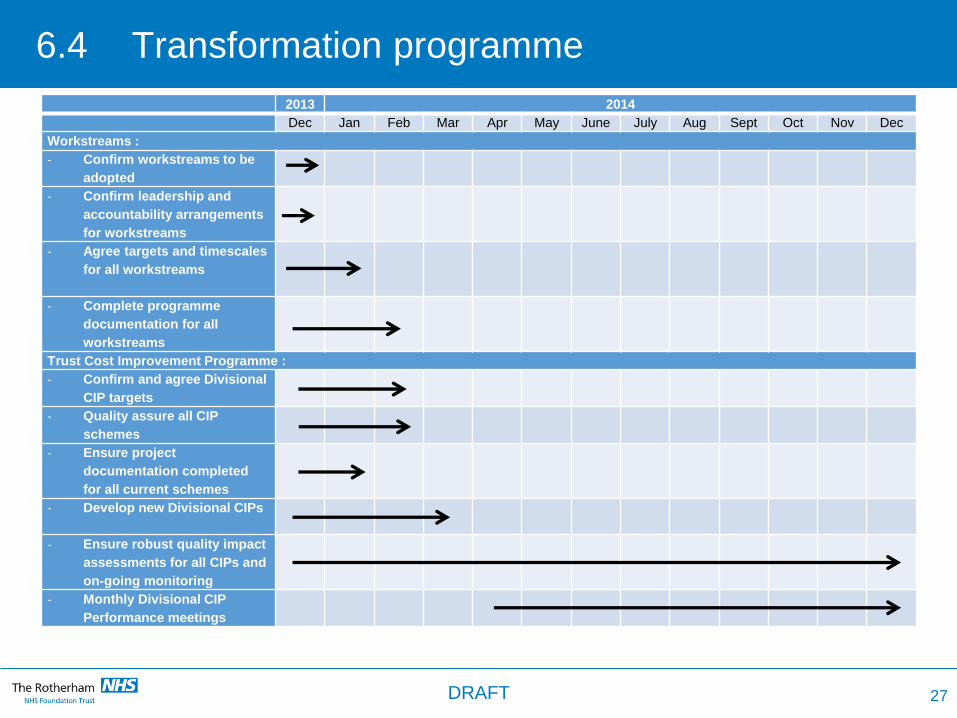
6.4 Transformation programme
2013 2014
Dec Jan Feb Mar Apr May June July Aug Sept Oct Nov Dec
Workstreams :
- Confirm workstreams to be
adopted
- Confirm leadership and
accountability arrangements
for workstreams
- Agree targets and timescales
for all workstreams
- Complete programme
documentation for all
workstreams
Trust Cost Improvement Programme :
- Confirm and agree Divisional
CIP targets
- Quality assure all CIP
schemes
- Ensure project
documentation completed
for all current schemes
- Develop new Divisional CIPs
- Ensure robust quality impact
assessments for all CIPs and
on-going monitoring
- Monthly Divisional CIP
Performance meetings
27 DRAFT
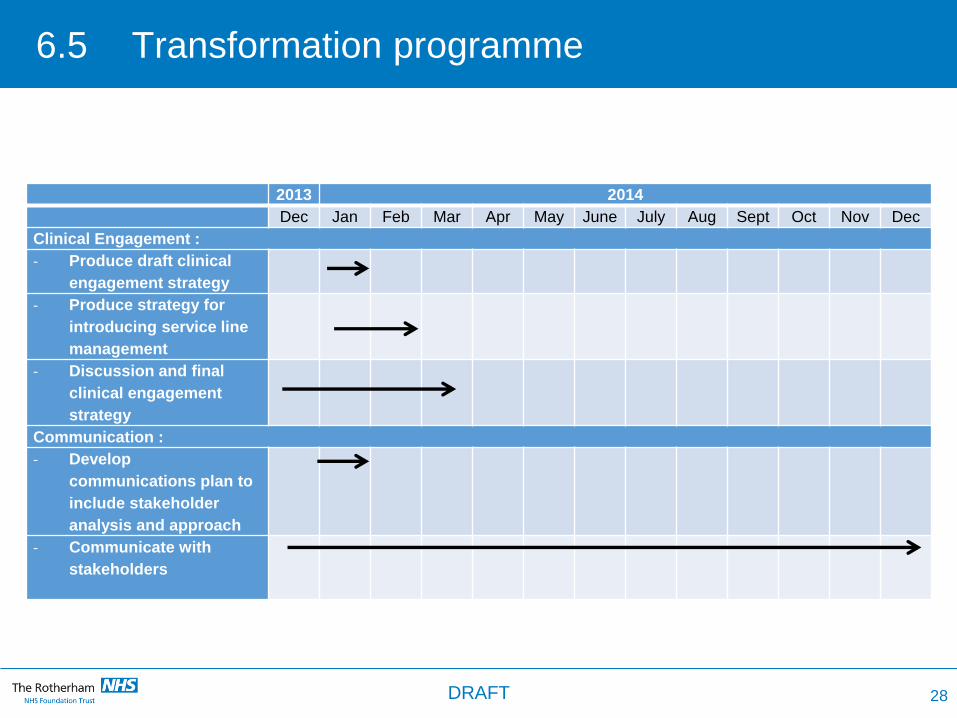
6.5 Transformation programme
2013 2014
Dec Jan Feb Mar Apr May June July Aug Sept Oct Nov Dec
Clinical Engagement :
- Produce draft clinical
engagement strategy
- Produce strategy for
introducing service line
management
- Discussion and final
clinical engagement
strategy
Communication :
- Develop
communications plan to
include stakeholder
analysis and approach
- Communicate with
stakeholders
28 DRAFT
7.0 Strategic Options
Options were identified and then explored to determine the strategic direction of the Trust.
The options considered were as follows:
• Option 1 – The Trust as a standalone entity - This option sought to assess the feasibility
of the Trust remaining in its current form, as a standalone entity, i.e. The Rotherham
NHS Foundation Trust, the implication of this option being that it did not consider formal
merger or acquisition by another organisation, but did include the potential for
collaboration with other healthcare organisations
• Option 2 – Vertical integration with a social care provider – This option considered
potential benefits and the feasibility of formally integrating with a social care
organisation. For clarity, this did not rule out the opportunity for closer working between
health and social care.
• Option 3 – Merger with another acute provider – This option explored the willingness of
potential partners to merge with the Trust.
Key issues for each of the options are summarised below.
29 DRAFT
7.1 Option 1
Option 1 – The Trust as a standalone entity
• Option 1 is dependent on achieving significant levels of CIP particularly in the first year
(FY14/15)
• The importance of driving improved internal efficiencies year on year is paramount
• The opportunity to properly integrate community and acute services is significant and must
be progressed
• There is overwhelming support from the lead commissioner to retain locally–run services
for the population of Rotherham, led and managed by TRFT
• The Trust’s cash position must be kept under close scrutiny and there must be rigorous
performance management frameworks in place.
• There is a significant number of potential opportunities that would be realised through
closer working and collaboration with other providers without recourse to merger. These
are discussed in more detail in section 9.
30 DRAFT
7.2 Option 22 Option 2
Option 2 - Vertical Integration with a social care provider
• There was no interest from potential social care partners to formally integrate with the
Trust
• The Trust has a poor track record in vertical integration, with an outstanding objective to
effectively integrate community services.
• Nevertheless it is still important to integrate further with social care through closer
working with Rotherham Metropolitan Borough Council and other social care providers
31 DRAFT
7.3 Option 3
Option 3 – Merger with another acute provider
• Neighbouring acute providers include:
- Sheffield Teaching Hospitals
- Sheffield Children’s Hospital
- Barnsley
- Doncaster and Bassetlaw
- Mid Yorks and Chesterfield - greater distance but still potential partners
• Clinical and patient benefits but would need to be confirmed through clinically-led
discussions
• Significant potential challenges, not commissioner preferred option
• Could provide efficiencies through back office and support function rationalisation
• Timescale for merger is a number of years – so option 1 still needed in addition to option 3
• Investment for investigating the options before any deal
32 DRAFT
8.0 Conclusion
The Board has agreed to pursue Option 1.
With a focused programme of transformation and efficiency the Trust is financially viable.
However, there are significant risks associated with this option and increasingly national
pressures such as 7 day working will create additional challenges for the Trust. As a result,
the Trust Board has decided to pursue this option of retaining the Trust in its present form
whilst also exploring potential opportunities for collaboration with other providers in the local
health economy. This is important to achieve further efficiencies and improve the quality of
services provided to patients.
Key risks and mitigating factors are summarised in section 10.0.
33 DRAFT
9.0 Potential Areas of Collaboration
• Working together (provider and commissioner workstreams)
• TRFT taking a more proactive role in both Commissioner-led and Provider-led
workstreams;
- commissioner-led : Cardiology & Stroke, Paediatrics & Neonates, Smaller
Specialities, Out of Hospital Care
- provider-led : Sharing Information, Consistency of Care, Smaller Specialities,
Specialised Services, Locums and Procurement
• Maternity services –
• Part of the Yorkshire clinical network for maternity and paediatric services led by
Leeds
• Explore collaborative links with neighbouring Trusts
• We recognise more work is required to take the service forward in a collaborative
way
• Forms of collaboration with other providers
- Clinical and non-clinical (e.g. including corporate functions)
- Clinical network models
- Hub and spoke arrangements
- Federated service model
- Alternative service provision/service line disinvestment
34 DRAFT
9.1 Potential Areas of Collaboration
• Undertake a joint review with the Lead Commissioner to:
– Assess and implement benefits of integration across the acute, community and
social care
– Identify potential quality improvements and cost efficiencies e.g. reducing hospital
length of stay
– Identify best practice models
– Include GPs, consultants and other healthcare professionals
– Include district nursing and its relationship with GP practices
– Specialist nursing across both community and acute sectors.
• Undertake a joint review with a specialist tertiary provider on the provision of specialised
and non-specialised paediatric services in Rotherham
– Clinically led, include reviewing models of care
– Commissioner supported - top priority (working together partnership)
35 DRAFT
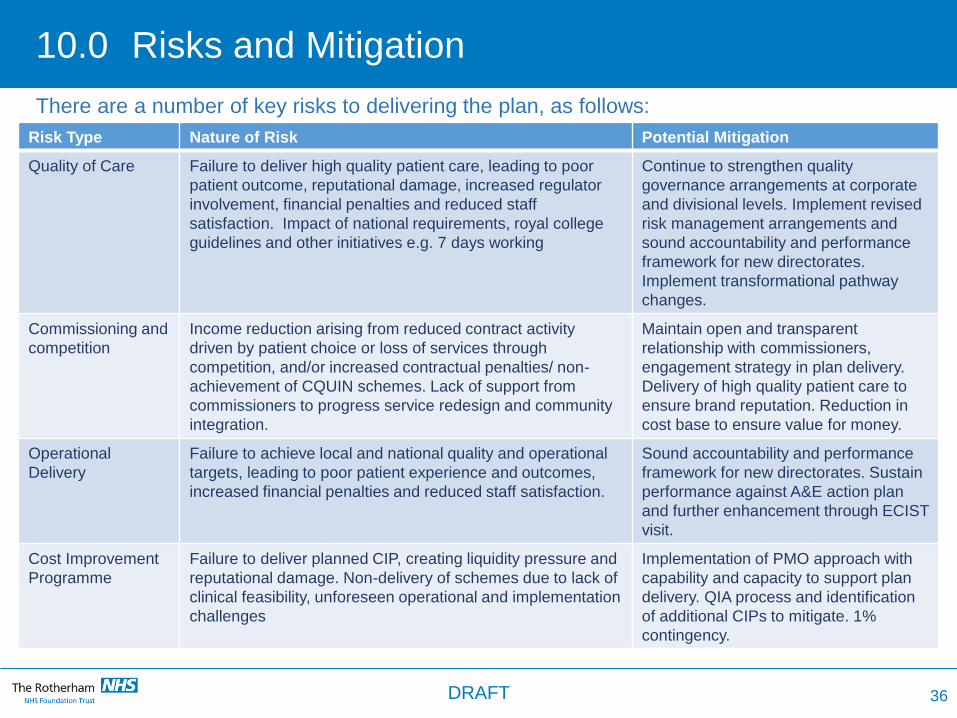
10.0 Risks and Mitigation
Risk Type Nature of Risk Potential Mitigation
Quality of Care Failure to deliver high quality patient care, leading to poor
patient outcome, reputational damage, increased regulator
involvement, financial penalties and reduced staff
satisfaction. Impact of national requirements, royal college
guidelines and other initiatives e.g. 7 days working
Continue to strengthen quality
governance arrangements at corporate
and divisional levels. Implement revised
risk management arrangements and
sound accountability and performance
framework for new directorates.
Implement transformational pathway
changes.
Commissioning and
competition
Income reduction arising from reduced contract activity
driven by patient choice or loss of services through
competition, and/or increased contractual penalties/ non-
achievement of CQUIN schemes. Lack of support from
commissioners to progress service redesign and community
integration.
Maintain open and transparent
relationship with commissioners,
engagement strategy in plan delivery.
Delivery of high quality patient care to
ensure brand reputation. Reduction in
cost base to ensure value for money.
Operational
Delivery
Failure to achieve local and national quality and operational
targets, leading to poor patient experience and outcomes,
increased financial penalties and reduced staff satisfaction.
Sound accountability and performance
framework for new directorates. Sustain
performance against A&E action plan
and further enhancement through ECIST
visit.
Cost Improvement
Programme
Failure to deliver planned CIP, creating liquidity pressure and
reputational damage. Non-delivery of schemes due to lack of
clinical feasibility, unforeseen operational and implementation
challenges
Implementation of PMO approach with
capability and capacity to support plan
delivery. QIA process and identification
of additional CIPs to mitigate. 1%
contingency.
36
There are a number of key risks to delivering the plan, as follows:
DRAFT
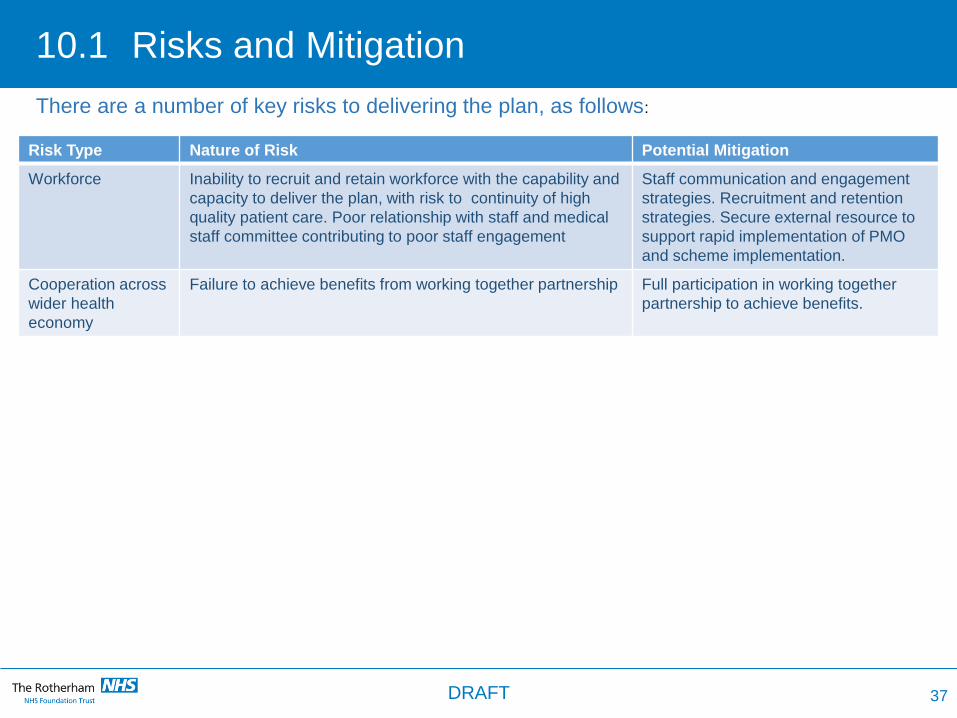
10.1 Risks and Mitigation
Risk Type Nature of Risk Potential Mitigation
Workforce Inability to recruit and retain workforce with the capability and
capacity to deliver the plan, with risk to continuity of high
quality patient care. Poor relationship with staff and medical
staff committee contributing to poor staff engagement
Staff communication and engagement
strategies. Recruitment and retention
strategies. Secure external resource to
support rapid implementation of PMO
and scheme implementation.
Cooperation across
wider health
economy
Failure to achieve benefits from working together partnership Full participation in working together
partnership to achieve benefits.
37
There are a number of key risks to delivering the plan, as follows:
DRAFT
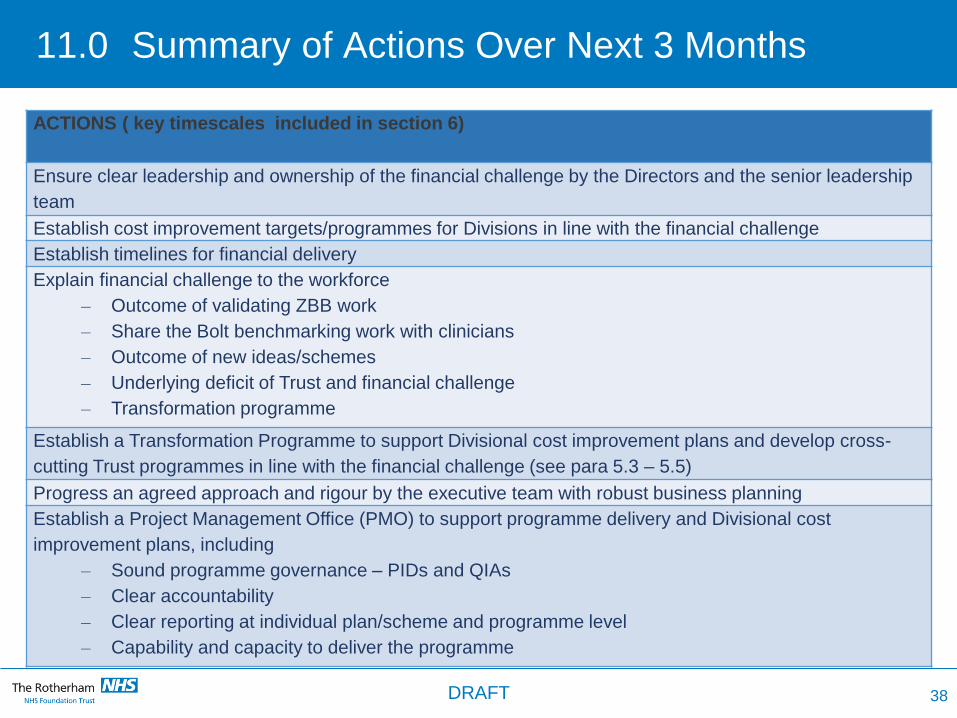
11.0 Summary of Actions Over Next 3 Months
38
ACTIONS ( key timescales included in section 6)
Ensure clear leadership and ownership of the financial challenge by the Directors and the senior leadership
team
Establish cost improvement targets/programmes for Divisions in line with the financial challenge
Establish timelines for financial delivery
Explain financial challenge to the workforce
– Outcome of validating ZBB work
– Share the Bolt benchmarking work with clinicians
– Outcome of new ideas/schemes
– Underlying deficit of Trust and financial challenge
– Transformation programme
Establish a Transformation Programme to support Divisional cost improvement plans and develop cross-
cutting Trust programmes in line with the financial challenge (see para 5.3 – 5.5)
Progress an agreed approach and rigour by the executive team with robust business planning
Establish a Project Management Office (PMO) to support programme delivery and Divisional cost
improvement plans, including
– Sound programme governance – PIDs and QIAs
– Clear accountability
– Clear reporting at individual plan/scheme and programme level
– Capability and capacity to deliver the programme
DRAFT
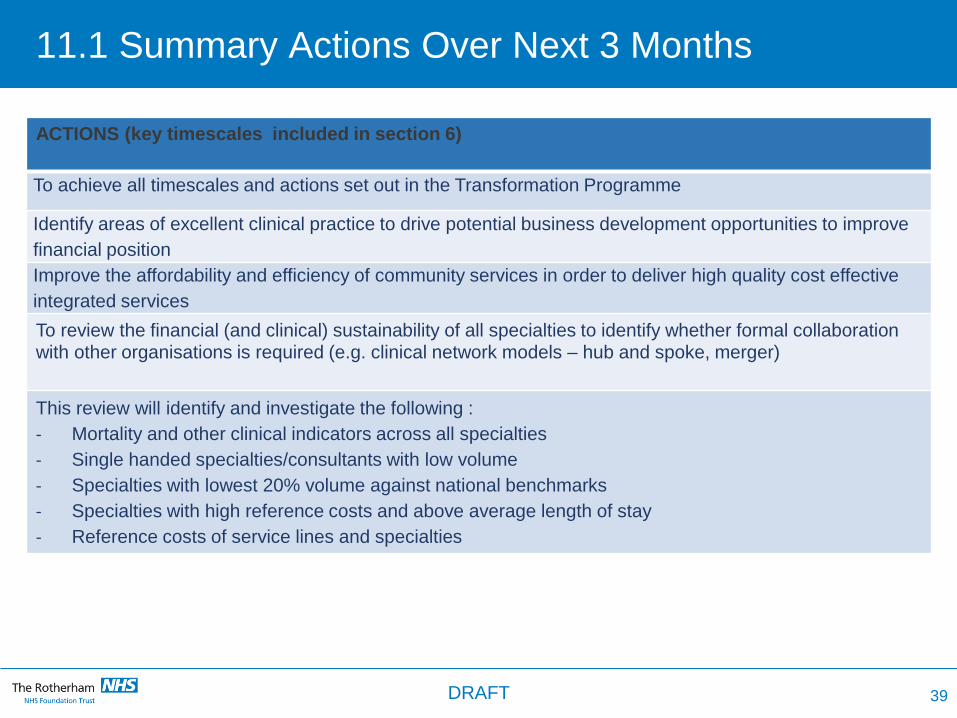
11.1 Summary Actions Over Next 3 Months
ACTIONS (key timescales included in section 6)
To achieve all timescales and actions set out in the Transformation Programme
Identify areas of excellent clinical practice to drive potential business development opportunities to improve
financial position
Improve the affordability and efficiency of community services in order to deliver high quality cost effective
integrated services
To review the financial (and clinical) sustainability of all specialties to identify whether formal collaboration with other organisations is required (e.g. clinical network models – hub and spoke, merger)
This review will identify and investigate the following :
- Mortality and other clinical indicators across all specialties
- Single handed specialties/consultants with low volume
- Specialties with lowest 20% volume against national benchmarks
- Specialties with high reference costs and above average length of stay
- Reference costs of service lines and specialties
39 DRAFT
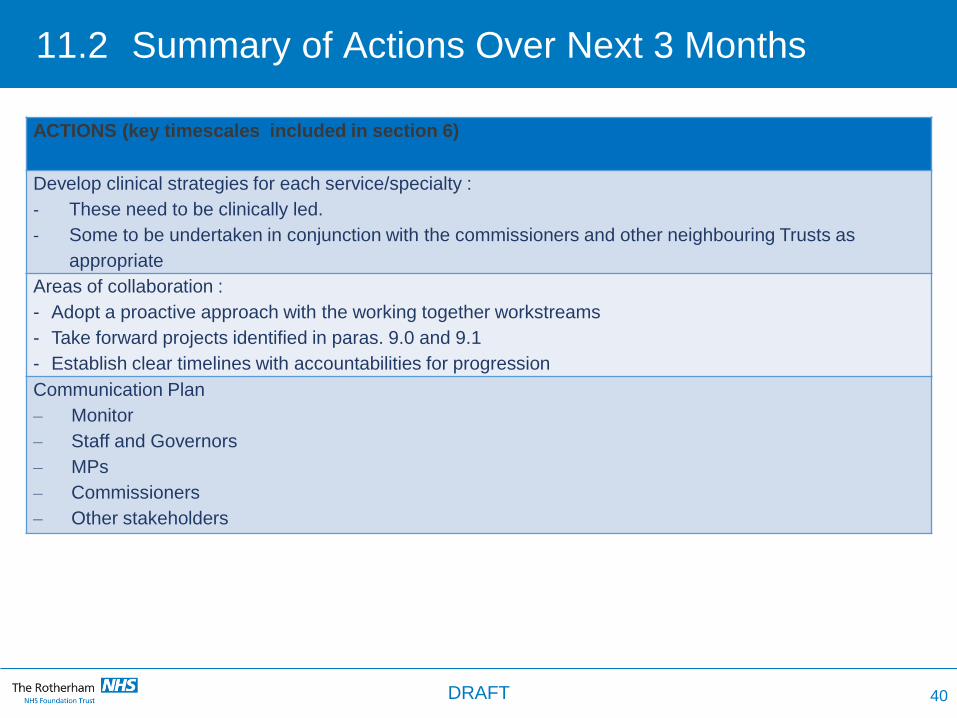
11.2 Summary of Actions Over Next 3 Months
ACTIONS (key timescales included in section 6)
Develop clinical strategies for each service/specialty :
- These need to be clinically led.
- Some to be undertaken in conjunction with the commissioners and other neighbouring Trusts as
appropriate
Areas of collaboration :
- Adopt a proactive approach with the working together workstreams
- Take forward projects identified in paras. 9.0 and 9.1
- Establish clear timelines with accountabilities for progression
Communication Plan
– Monitor
– Staff and Governors
– MPs
– Commissioners
– Other stakeholders
40 DRAFT


