
Executive summary
In March 2018, the European Commission proposed a
Digital Services Tax (DST) as a new tax on revenues re-
sulting from certain digital business activities. Specifi-
cally, a 3% tax on: (i) Online advertising revenues, (ii)
Seller/buyer fees to transact via online intermediar-
ies/marketplaces and (iii) Revenues from the sale of
user data. We have reviewed the evidence base and an-
alytical logic of the proposal.1 We find that:
1. The rationale for introducing DST does not reflect
the evidence that digital firms pay average corpo-
rate tax rates
2. The Impact Assessment (IA) for the DST does not
fully consider the substantial distortions and costs
to EU consumers and firms from this new tax
3. Actual revenues from the proposal are likely to be
significantly lower than suggested
1 The study was commissioned by the Computer & Communica-
tions Industry Association (CCIA).
Lack of economic justification for the DST
The IA mainly relies on three arguments for the digital
tax which we find contrasting with empirical evidence
and solid economic reasoning:
Digital companies are not undertaxed: The IA refers to
simulations showing a lower theoretical tax rate for dig-
ital companies than average firms (effective rate). The
calculation is largely driven by digital companies having
higher-than-average shares of R&D expenditure, which
would equally apply to other industries, such as phar-
maceuticals. However, in R&D intensive sectors, firms
rely much more on equity financing, which tends to in-
crease the actual effective tax rate - a factor missing in
the simulations that the IA refers to. Indeed, recent in-
dustry data finds effective tax rates for digitalised com-
panies at a par with traditional companies in the EU.
There is no loss of tax base: The IA stresses that the EU
is losing economic activity, and thus tax base, because
traditional distribution channels with physical assets
and staff are making way for innovative distribution
THE PROPOSED EU DIGITAL SERVICES TAX:
Effects on welfare, growth and revenues
Authors:
Helge Sigurd Næss-Schmidt
Martin H. Thelle
Dr Bruno Basalisco
Dr Palle Sørensen
Bjarke Modvig Lumby September 2018
The proposed EU digital services tax:
Effects on welfare, growth and revenues
2
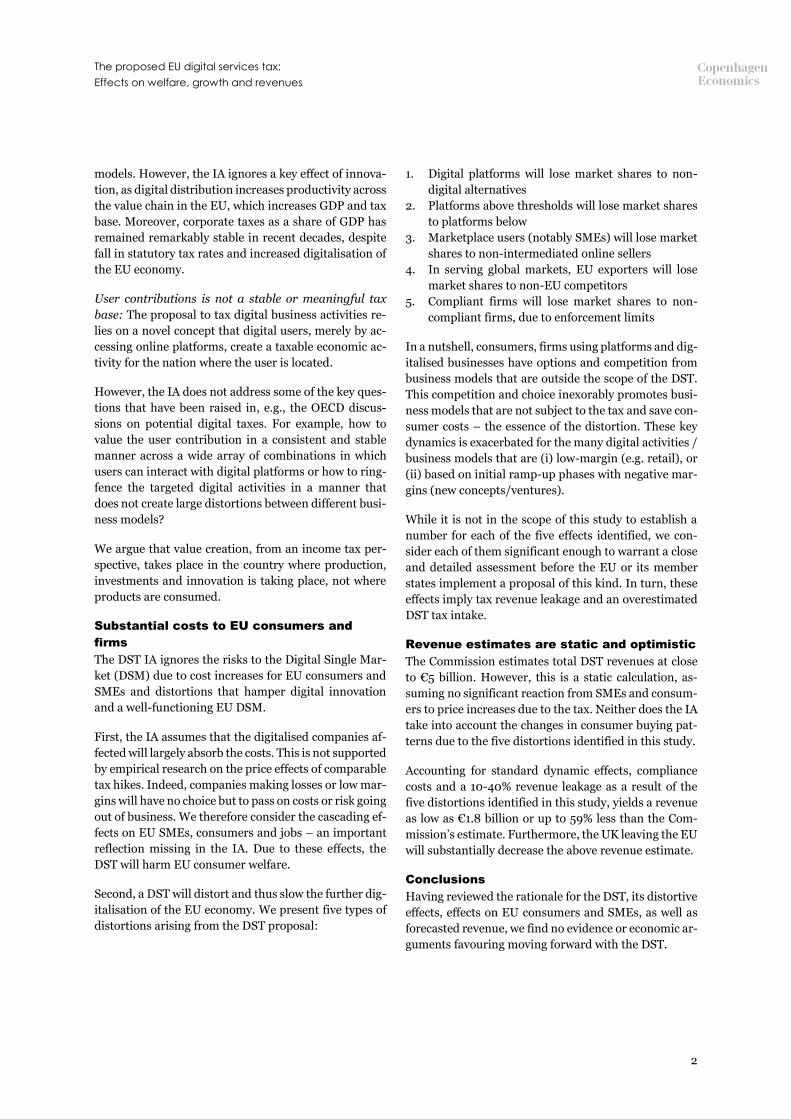
models. However, the IA ignores a key effect of innova-
tion, as digital distribution increases productivity across
the value chain in the EU, which increases GDP and tax
base. Moreover, corporate taxes as a share of GDP has
remained remarkably stable in recent decades, despite
fall in statutory tax rates and increased digitalisation of
the EU economy.
User contributions is not a stable or meaningful tax
base: The proposal to tax digital business activities re-
lies on a novel concept that digital users, merely by ac-
cessing online platforms, create a taxable economic ac-
tivity for the nation where the user is located.
However, the IA does not address some of the key ques-
tions that have been raised in, e.g., the OECD discus-
sions on potential digital taxes. For example, how to
value the user contribution in a consistent and stable
manner across a wide array of combinations in which
users can interact with digital platforms or how to ring-
fence the targeted digital activities in a manner that
does not create large distortions between different busi-
ness models?
We argue that value creation, from an income tax per-
spective, takes place in the country where production,
investments and innovation is taking place, not where
products are consumed.
Substantial costs to EU consumers and
firms
The DST IA ignores the risks to the Digital Single Mar-
ket (DSM) due to cost increases for EU consumers and
SMEs and distortions that hamper digital innovation
and a well-functioning EU DSM.
First, the IA assumes that the digitalised companies af-
fected will largely absorb the costs. This is not supported
by empirical research on the price effects of comparable
tax hikes. Indeed, companies making losses or low mar-
gins will have no choice but to pass on costs or risk going
out of business. We therefore consider the cascading ef-
fects on EU SMEs, consumers and jobs – an important
reflection missing in the IA. Due to these effects, the
DST will harm EU consumer welfare.
Second, a DST will distort and thus slow the further dig-
italisation of the EU economy. We present five types of
distortions arising from the DST proposal:
1. Digital platforms will lose market shares to non-
digital alternatives
2. Platforms above thresholds will lose market shares
to platforms below
3. Marketplace users (notably SMEs) will lose market
shares to non-intermediated online sellers
4. In serving global markets, EU exporters will lose
market shares to non-EU competitors
5. Compliant firms will lose market shares to non-
compliant firms, due to enforcement limits
In a nutshell, consumers, firms using platforms and dig-
italised businesses have options and competition from
business models that are outside the scope of the DST.
This competition and choice inexorably promotes busi-
ness models that are not subject to the tax and save con-
sumer costs – the essence of the distortion. These key
dynamics is exacerbated for the many digital activities /
business models that are (i) low-margin (e.g. retail), or
(ii) based on initial ramp-up phases with negative mar-
gins (new concepts/ventures).
While it is not in the scope of this study to establish a
number for each of the five effects identified, we con-
sider each of them significant enough to warrant a close
and detailed assessment before the EU or its member
states implement a proposal of this kind. In turn, these
effects imply tax revenue leakage and an overestimated
DST tax intake.
Revenue estimates are static and optimistic
The Commission estimates total DST revenues at close
to €5 billion. However, this is a static calculation, as-
suming no significant reaction from SMEs and consum-
ers to price increases due to the tax. Neither does the IA
take into account the changes in consumer buying pat-
terns due to the five distortions identified in this study.
Accounting for standard dynamic effects, compliance
costs and a 10-40% revenue leakage as a result of the
five distortions identified in this study, yields a revenue
as low as €1.8 billion or up to 59% less than the Com-
mission’s estimate. Furthermore, the UK leaving the EU
will substantially decrease the above revenue estimate.
Conclusions
Having reviewed the rationale for the DST, its distortive
effects, effects on EU consumers and SMEs, as well as
forecasted revenue, we find no evidence or economic ar-
guments favouring moving forward with the DST.

The proposed EU digital services tax:
Effects on welfare, growth and revenues
3
In particular, we find that the DST might undermine EU
efforts to support the development of the digital econ-
omy notably through the EU DSM strategy. The digital
business activities singled out in the DST proposal are
at the heart of the digital transformation and unlocking
of productivity across sectors of the EU economy. EU
firms and consumers continue to gain from digital solu-
tions.
It is thus counterintuitive that the EU should impose a
tax that affects the entire value chain benefiting from
digital activities, notably European firms and consum-
ers, and put at risk Europe’s digital transformation.

The proposed EU digital services tax:
Effects on welfare, growth and revenues
4
NO JUSTIFICATION FOR A DIGITAL
SERVICE TAX
As motivation for the proposal, the Commission puts
forward three main arguments and underlying claims
inter alia that:2
• Fairness and level playing field: Digital companies
providing these services pay significantly less in
taxes than traditional firms
• Loss of tax revenues: The increasing importance of
internet based services leads to reduced tax base
• EU users play a key role in increasing the value of
platforms: Users of platforms are playing a large
part in creating the value, and this value creation
should be taxed in the users’ country of residence
In this section, we conclude that:
• The key arguments are not supported by empirical
evidence or consistent with standard economic rea-
soning underpinning tax policy
• DST conflicts with international efforts for reform
of corporate taxation, notable at the OECD level
Digital companies pay average
corporate tax rates
The actual effective tax rate for a given industry in a
given country will depend on two key factors. First, nat-
urally the tax system: What is the corporate tax rate,
how does the tax system treat different kinds of invest-
ments and what is the tax treatment of different kinds
of financing (retained earnings, new equity and debt)?
Second, the industry: What does it invest in, what is the
gross return on investment before return to debt and
shareholders and how are investments financed?
In particular, two key structural factors will determine
whether digital companies – in practice – pay more or
less in average taxes than companies in other industries.
1. Degree of debt bias in global tax systems. Debt bias
is the result of widely diffused tax policies. It means that
debt-financed investments require a lower gross return
2 Note that the Commission's own regulatory scrutiny board has
also criticised of the Commission's proposals, as it: "Does not
show the urgency for the EU to act, before global progress is
achieved at the OECD/G20 level" and "insufficient" analysis of
impact and proportionality, see European Commission,
than equity-financed investments. Any company can
deduct interests from gross earnings before calculating
its corporate tax base while no deductions apply to re-
turns paid to its shareholders. Basically, the higher the
corporate tax rate, the higher the debt bias.
Numerous international studies have documented the
large debt bias in tax systems across the globe. A 2017
study from the US CBO, compared effective tax rates
across the G-20 countries. It found that equity-based in-
vestments were taxed by orders of magnitude higher
than debt financed investment in all G-20 countries for
all types of investments, cf. Figure 1.3 In fact, the mar-
ginal effective tax rate on a debt financed investment
can be negative because of generous depreciation rules.
Similar conclusions are drawn in a study for all EU
member states.4
Figure 1 Equity is taxed at higher effective tax
rates than debt in G20 Countries, 2012
Source: CBO (2017) International Comparisons of Corporate
Income Tax Rates, page 24.
The debt bias is relevant because R&D intensive indus-
tries such as digital companies tend to rely much more
on equity than other industries. The equity share is
above 90% for software-based firms against for example
SEC(2018) 162 final. Similar concerns were voiced in ECIPE (2018)
Five Questions about the Digital Services Tax to Pierre Moscovici
3 See CBO (2017) International Comparisons of Corporate In-
come Tax Rates, page 23-24.
4 See e.g. ZEW (2016) Effective tax levels using the Devereux/Grif-
fith methodology.
-80%
-60%
-40%
-20%
0%
20%
40%
AR
BR IN JP
DE
MX ID US
CN FR
GB
AU
SA
ZA
RU TR KR
CA IT
Equity-Financed EquipmentDebt-Financed Equipment
The proposed EU digital services tax:
Effects on welfare, growth and revenues
5
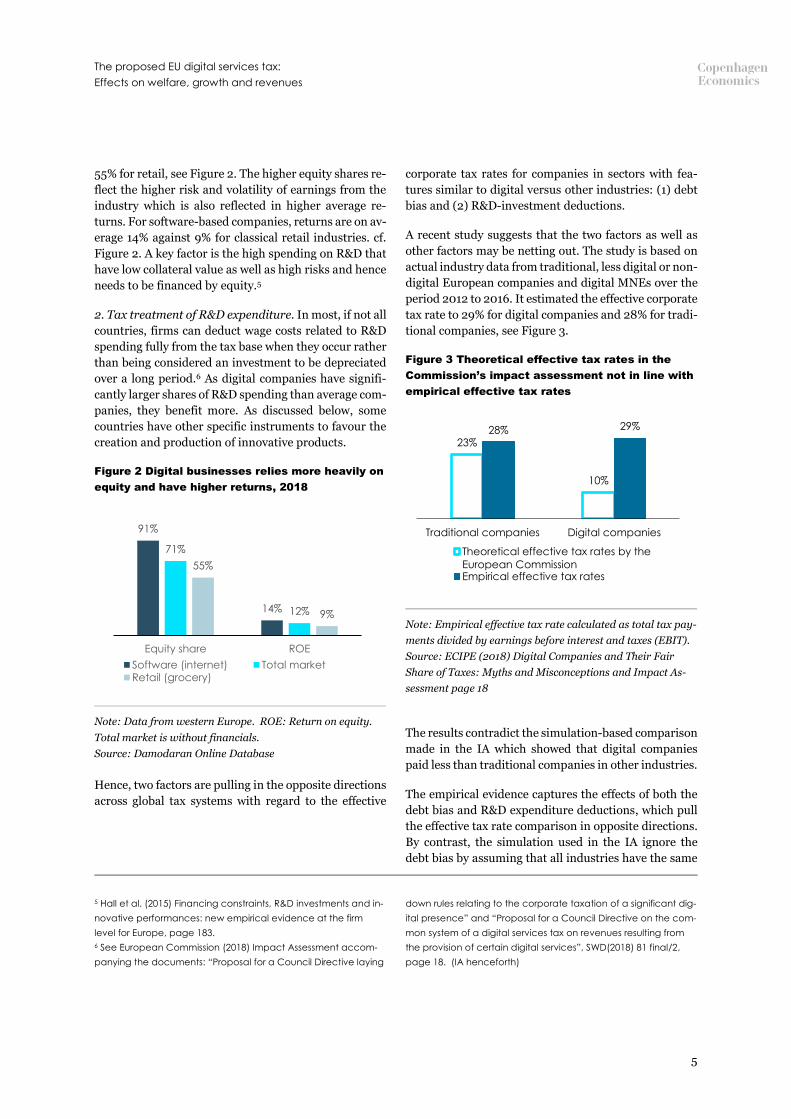
55% for retail, see Figure 2. The higher equity shares re-
flect the higher risk and volatility of earnings from the
industry which is also reflected in higher average re-
turns. For software-based companies, returns are on av-
erage 14% against 9% for classical retail industries. cf.
Figure 2. A key factor is the high spending on R&D that
have low collateral value as well as high risks and hence
needs to be financed by equity.5
2. Tax treatment of R&D expenditure. In most, if not all
countries, firms can deduct wage costs related to R&D
spending fully from the tax base when they occur rather
than being considered an investment to be depreciated
over a long period.6 As digital companies have signifi-
cantly larger shares of R&D spending than average com-
panies, they benefit more. As discussed below, some
countries have other specific instruments to favour the
creation and production of innovative products.
Figure 2 Digital businesses relies more heavily on
equity and have higher returns, 2018
Note: Data from western Europe. ROE: Return on equity.
Total market is without financials.
Source: Damodaran Online Database
Hence, two factors are pulling in the opposite directions
across global tax systems with regard to the effective
5 Hall et al. (2015) Financing constraints, R&D investments and in-
novative performances: new empirical evidence at the firm
level for Europe, page 183.
6 See European Commission (2018) Impact Assessment accom-
panying the documents: “Proposal for a Council Directive laying
corporate tax rates for companies in sectors with fea-
tures similar to digital versus other industries: (1) debt
bias and (2) R&D-investment deductions.
A recent study suggests that the two factors as well as
other factors may be netting out. The study is based on
actual industry data from traditional, less digital or non-
digital European companies and digital MNEs over the
period 2012 to 2016. It estimated the effective corporate
tax rate to 29% for digital companies and 28% for tradi-
tional companies, see Figure 3.
Figure 3 Theoretical effective tax rates in the
Commission’s impact assessment not in line with
empirical effective tax rates
Note: Empirical effective tax rate calculated as total tax pay-
ments divided by earnings before interest and taxes (EBIT).
Source: ECIPE (2018) Digital Companies and Their Fair
Share of Taxes: Myths and Misconceptions and Impact As-
sessment page 18
The results contradict the simulation-based comparison
made in the IA which showed that digital companies
paid less than traditional companies in other industries.
The empirical evidence captures the effects of both the
debt bias and R&D expenditure deductions, which pull
the effective tax rate comparison in opposite directions.
By contrast, the simulation used in the IA ignore the
debt bias by assuming that all industries have the same
down rules relating to the corporate taxation of a significant dig-
ital presence” and “Proposal for a Council Directive on the com-
mon system of a digital services tax on revenues resulting from
the provision of certain digital services”, SWD(2018) 81 final/2,
page 18. (IA henceforth)
91%
14%
71%
12%
55%
9%
Equity share ROE
Software (internet) Total marketRetail (grocery)
23%
10%
28% 29%
Traditional companies Digital companies
Theoretical effective tax rates by the
European CommissionEmpirical effective tax rates

The proposed EU digital services tax:
Effects on welfare, growth and revenues
6
share of equity financing (and same rates of return). As
Figure 2 shows, that assumption is far from reality.7
Hence, the figures referred to in the IA underestimate
the effective tax rates for industries with above average
shares of equity financing such as digital (or e.g.
pharma) companies.8 In other words, the simulations in
the DST IA merely show that R&D tax deductions re-
duce effective tax rates for R&D-intensive sectors. How-
ever, the DST proposal is not aimed at changing R&D
tax policy; those simulations are thus not supportive ev-
idence for the DST.
7 The underlying PwC & ZEW (2017) Digital Tax Index, assumes
that financing shares for all industries equals 55% for retained
earnings, 10% for new equity and 35% for debt. Moreover, for the
same reasons the study was not meant to provide a source for
comparing effective corporate taxes across industries but to
compare the same industries across countries, notably the digi-
tal industry. This aim was also highlighted by the authors behind
A comparison between the German and French tax sys-
tems illustrates the importance of these opposing fac-
tors. Our comparison is based on the same method used
in the IA, i.e. a theoretical calculation based on stylised
tax parameters. However, we include the importance of
differences in debt ratios and rates of returns for differ-
ent industries.
In Germany, a digital company faces a higher effective
tax rate of 25% against 21% for a traditional company cf.
figure 4. In the absence of accelerated R&D depreciation
allowances it would have been 30%.
the report, who have also underlined that the report cannot be
used to compare effective rates of taxation across industries.
8 The IA on page 18 explicitly acknowledges that it is the favour-
able treatment of R&D expenditure that is the background for
the below average tax rates for digital companies to a certain
extent.
Figure 4 Theoretical effective average tax rates for digital and traditional businesses in Germany and
France in 2017
Effective average tax rate, Germany
Statutory CIT rate 30%
Effective average tax rate, France
Statutory CIT rate 34%
Source: Copenhagen Economics based on the Griffith / Devereux methodology, PwC & ZEW (2017) and OECD database
Traditional
firm
Digital
firm no IP
box, no
strong
R&D in-
centive
IP box R&D in-
centive Digital
firm Traditional
firm
Digital
firm no IP
box, no
strong
R&D in-
centive
IP box R&D in-
centive
Digital
firm
8% 9%

The proposed EU digital services tax:
Effects on welfare, growth and revenues
7
In France, the digital company pays only 18% in effec-
tive average tax rate against 35% for a traditional firm.
The drivers are the use of IP-boxes in the French tax sys-
tem9 – which are not used in Germany – and strong
R&D tax incentives. In the absence of these two instru-
ments, digital companies in France would face an effec-
tive rate of 43%.
In conclusion, the theoretical effective tax rates used
in the Commission’s IA are contradicted by empirical
evidence. The methodology used in the IA will underes-
timate effective corporate taxes for digital companies.
Moreover, the use of very strong R&D incentives and IP-
boxes are only applied in some EU-countries. For Ger-
many, our calculation shows that digital companies face
a higher effective rate than traditional companies be-
cause the debt bias in the tax system dominates the ben-
efits from R&D tax benefits.
This implies that the DST risks creating over-taxa-
tion/double taxation of the digitalising economy even if
the DST was to be made fully deductible as a cost in the
corporate income tax base.
Average corporate tax rates and welfare
While there is no solid evidence that digital companies
in practice pay below-average corporate tax rates, a full
discussion about potential under-taxation should in-
clude a wider consideration of economic efficiency.
A well-designed corporate tax system should aim to
align private and social objectives, i.e. private investors
should have incentives to pursue the level and structure
of investments that maximises total welfare for society.
As a consequence, a number of studies and interna-
tional bodies have recommended a favourable treat-
ment of investments in R&D.10 Such benefits, open to all
firms having R&D related expenditure, could
strengthen innovation in industries where market fail-
9 An IP-box allow a lower tax rate for income from revenues re-
lated to exploitation of intellectual property rights.
10 See e.g. CPB Netherlands Bureau for Economic Policy Analysis
et al. (2015) A study on R&D tax incentives: Final report, page 95-
96
11 Institute for Fiscal Studies (2011) Tax by design, page 32-33
12 See Gordon (2016) The Rise and fall of American Growth. Gor-
don was included in the 2016 Bloomberg list of the nation's most
influential thinkers
ures such as spill-over effects from private R&D expend-
itures justify preferential tax treatment.11 ICT and
pharma industries are typical large beneficiaries of such
instruments.
The point is that comparisons of average effective tax
rates across industries cannot be used without qualifi-
cations to evaluate economic efficiency. The question is
whether any difference is intended and results from tax
policies designed to improve welfare by accounting for
positive externalities, for example wider socio-eco-
nomic benefits of private R&D activity. This could then
be one basis of a tax policy aiming to align private re-
turns from R&D spending with the full social returns.
Digitisation is increasing, not reducing,
the EU corporate tax base
Productivity from innovations and new technologies
has been the driver of economic growth for centuries.
From 1870 to 1970, economic growth was powered by
electricity, urban sanitation, chemicals/pharmaceuti-
cals, the internal combustion engine and modern com-
munication.12
In the 1990s and early 2000s it was the personal com-
puter and ICT investment driving much of the economic
growth.13
Today, we are in the middle of a digital transformation,
with 40 per cent of the world population now connected
to networks, up from 4 per cent in 1995. The transfor-
mation is at a relatively early stage with a range of new
technologies still to come. Economists are still grappling
how best to understand and fully measure how the dig-
itisation of our economies is translating into productiv-
ity growth.14
While we are yet to fully measure the productivity im-
pact of the ongoing digitisation, there are certainly fur-
13 See for example Jorgenson (2001) Information Technology
and the U.S. Economy or with a European perspective and van
Ark, Inklaar and McGuckin (2003) The Contribution of ICT Pro-
ducing and Using Industries to Productivity Growth: A Compari-
son of Canada, Europe and the United States, page 56-63.
14 See for example the OECD material for the 2017 ministerial
meeting in Paris. “Going Digital: Making the transformation work
for growth and well-being”.
The proposed EU digital services tax:
Effects on welfare, growth and revenues
8
ther productivity gains to be expected. Higher produc-
tivity growth will lead to higher long-term GDP, and this
will over time increase the tax base.
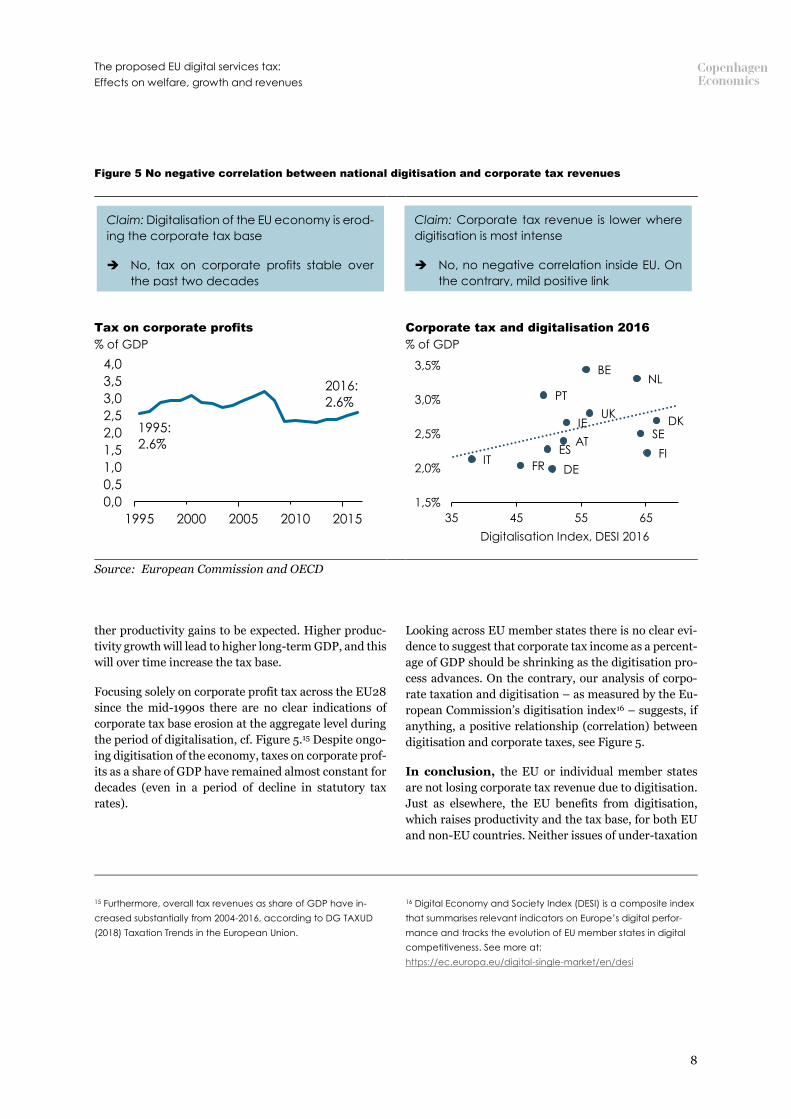
Focusing solely on corporate profit tax across the EU28
since the mid-1990s there are no clear indications of
corporate tax base erosion at the aggregate level during
the period of digitalisation, cf. Figure 5.15 Despite ongo-
ing digitisation of the economy, taxes on corporate prof-
its as a share of GDP have remained almost constant for
decades (even in a period of decline in statutory tax
rates).
15 Furthermore, overall tax revenues as share of GDP have in-
creased substantially from 2004-2016, according to DG TAXUD
(2018) Taxation Trends in the European Union.
Looking across EU member states there is no clear evi-
dence to suggest that corporate tax income as a percent-
age of GDP should be shrinking as the digitisation pro-
cess advances. On the contrary, our analysis of corpo-
rate taxation and digitisation – as measured by the Eu-
ropean Commission’s digitisation index16 – suggests, if
anything, a positive relationship (correlation) between
digitisation and corporate taxes, see Figure 5.
In conclusion, the EU or individual member states
are not losing corporate tax revenue due to digitisation.
Just as elsewhere, the EU benefits from digitisation,
which raises productivity and the tax base, for both EU
and non-EU countries. Neither issues of under-taxation
16 Digital Economy and Society Index (DESI) is a composite index
that summarises relevant indicators on Europe’s digital perfor-
mance and tracks the evolution of EU member states in digital
competitiveness. See more at:
https://ec.europa.eu/digital-single-market/en/desi
Figure 5 No negative correlation between national digitisation and corporate tax revenues
Tax on corporate profits
% of GDP
Corporate tax and digitalisation 2016
% of GDP
Source: European Commission and OECD
0,0
0,5
1,0
1,5
2,0
2,5
3,0
3,5
4,0
1995 2000 2005 2010 2015
1995:
2.6%
2016:
2.6%
DK
FI
SE
NL
UK
BE
IE
AT
DE
ES
PT
FRIT
1,5%
2,0%
2,5%
3,0%
3,5%
35 45 55 65
Digitalisation Index, DESI 2016
Claim: Digitalisation of the EU economy is erod-
ing the corporate tax base
No, tax on corporate profits stable over
the past two decades
Claim: Corporate tax revenue is lower where
digitisation is most intense
No, no negative correlation inside EU. On
the contrary, mild positive link

The proposed EU digital services tax:
Effects on welfare, growth and revenues
9
nor loss of tax revenues suggest a need for a special new
tax on digital services.
User contributions as a new tax base?
But what about the idea that value is created by consum-
ers in EU and this user contribution should be taxed in
the residence country of the user?
It starts from the premise that consumers create value
to the platforms when using them. Digital firms collect
a wealth of data that can be used to, e.g., attain more
targeted marketing efforts than traditional marketing.
In its recent interim report on “Tax challenges arising
from digitalisation”, the OECD describes a wide range
of types of user value creation across business models
and industries.17
The idea of defining user contributions to digital plat-
forms as a tax base is controversial also among EU
member states. We note at least three key arguments
against using user contributions as a tax base:
How to measure the value: Consumers’ interactions
with online platforms varies from simple purchases of
products to substantive contributions in the form of re-
views, detailed data contributions, e.g. in the form of
personal information etc. However, there will never be
a simple, stable relationship between the time and effort
a user is spending on any given platform and the use he
or she provides to the platform owner in terms of in-
creasing its value.
Ring-fencing the digital economy is difficult: Con-
sumer data has been used in the advertising industry for
many decades. Supermarkets use loyalty cards and
scanner data to increase sales. Advertising firms use so-
phisticated user data to improve the effectiveness of ads
whether online or offline on TV, radio, print. The smart
use of marketing data collected from users is not new
and remains a central part of running an advertisement
business or any consumer-facing business.18
17 See OECD (2018) Tax challenges arising from digitalization – in-
terim report, from page 34 and onwards.
18 E.g. OECD (2015) Addressing the Tax Challenges of the Digital
Economy, Action 1 - Final Report, noted: “[… The report] notes
that because the digital economy is increasingly becoming the
economy itself, it would not be feasible to ring-fence the digital
economy from the rest of the economy for tax purposes”.
Thus there is no specific logic to a supplementary tax fo-
cused on a specific set of digital solutions because they
are (like other online or offline activities) using data
from users.19 Indeed, traditionally value creation hap-
pens at the place of innovation and production and not
at the place of consumption.20 The same argument
would also suggest that traditional media firms, adver-
tising firms, supermarkets and many more should be
levied a special user tax per reader or per purchase be-
cause they collect data from users to improve business
performance. Yet this is not what the Commission pro-
poses.
Reverse causation: The ability to attract users is pri-
marily dependent on the quality of the service i.e. the
ability of providers to offer digital services that are val-
ued by users.21 That is irrespective of whether the plat-
form is provided free of charge, based on subscription-
based media (whether digital pay-walls or traditional
print media) or online marketplaces that allow firms to
sell products for a fee. Obviously, all these firms track
consumer behaviour to improve performance of the dig-
ital service they provide. But all well-run commercial
firms have a keen focus on consumer preferences e.g.
using surveys to assess satisfaction with performance.
Thus, all industries aim to reduce costs and attract more
users irrespective of remuneration models. Firms are
primarily successful in attracting many users by offering
a high level of service based on large investments in in-
frastructure and development of products. In this re-
spect digital services are no different from production of
cars or computer games. In all these cases, the products
create value to society only when being used but that
does not lead us to suggest that driving a car or playing
a game should be seen a taxable income generating ac-
tivity to be compared with the efforts of the company
providing the product or the service.
The upshot is that the corporate tax base should be
linked to the place where innovation and investments in
19 See e.g. Devereux and Vella (2017) Implications of digitalisa-
tion for international corporate tax reform and OECD (2018) Tax
challenges arising from digitalization – interim report, page 178.
20 Consumption is taxed by its own set of taxes e.g. VAT.
21 See Nylén and Holmström (2015) Digital innovation strategy: A
framework for diagnosing and improving digital product and ser-
vice innovation, page 58.

The proposed EU digital services tax:
Effects on welfare, growth and revenues
10
platforms for users are being created not where they are
consumed.
In conclusion, there is no consensus internationally
among governments or experts about the idea of defin-
ing users contributing data to certain selected digital
services as a new taxable activity. Moreover, measuring
the value of the user contribution risks being based on
arbitrary and distortive criteria.
Counterproductive in the context of
global tax policy efforts (OECD, US)
The proposal for a DST should be seen in the context of
recent advances in international corporate taxation,
most noticeably the efforts made by the OECD in the so-
called Base Erosion and Profit Shifting (BEPS) actions,
the US tax reform and the EU Anti-Tax Avoidance Di-
rective (ATAD). These policies will arguably limit the
historical scope of artificial profit shifting, better align-
ing the Corporate Income Tax (CIT) payments of com-
panies with the location of value creation. However, the
actual impact is yet to be analysed in detail.
Beyond the already implemented policies, the DST
seems to be in direct conflict with the efforts made in
BEPS action 1, addressing the tax challenges of the dig-
itised economy. Recently, the OECD interim report
pointed out that there is no consensus regarding the
merits of interim measures such as the DST. The report
also points out the many downsides of these measures,
e.g. increased cost of capital, reducing incentive to in-
vest with a resulting negative effect on growth, potential
over-taxation, and a likelihood that the cost of admin-
istration will far exceed the amount of revenue raised.22
An EU DST may risk making an international consensus
based solution less likely.
While the US tax reform adopted in 2017 is not directly
linked to proposals for taxing the digital sector, we find
that some of the arguments for advancing the DST
would be mitigated by the US tax reform. This is because
for many decades, US companies have had incentives to
place retained earnings in low tax jurisdictions, due to a
combination of:
22 See OECD (2018) tax challenges arising from digitalisation, in-
terim report, page 178-179.
23 See e.g. ZEW (2018) Analysis of US Corporate Tax Reform Pro-
posals and their Effects for Europe and Germany, which provide
• High formal US corporate tax rate
• Weak Controlled Foreign Corporation (CFC) rules
• No US taxation of foreign profits until repatriated to
the US
Depending on the tax compliance design by each MNE,
this could lead to “low” final taxation of corporate in-
come, as retained earnings, in principle, might never be
formally repatriated.
The new US reform, based on a much lower statutory
rate, the introduction of CFC-like elements and US tax-
ation on foreign profits on an accrual (not repatriation)
basis will all logically put a brake on these incentives.23
Finally, the IA suggests that a digital tax can mitigate the
risks of losing tax base in a world where global trade is
increasingly being driven by products and services
based on intangible assets sold by firms with global
scale.24 In the absence of strong enforcement of the
OECD based transfer pricing principles, firms will have
an incentive to set internal prices in cross-border trans-
actions so that taxable income is reported in low tax
countries.
However, the proposal has not factored in the impact of
the recent BEPS initiative which updated the transfer
pricing rules, as well as other international tax rules, to
deal with tax avoidance.
DST WILL SLOW DOWN THE
DIGITISATION OF THE EU
ECONOMY
The European Digital Single Market (DSM) is intended
to ensure Europe’s position as a world leader in the dig-
itised economy and to help European companies across
all sectors to grow globally.25 The Digital Single Market
initiative is addressing fragmentation and barriers that
do not exist in the physical Single Market. Bringing
an overview of the effects of the US tax reform adopted in De-
cember 2017.
24 See IA page 13-14.
25 See European Commission (2015) A Digital Single Market Strat-
egy for Europe, COM(2015) 192.
The proposed EU digital services tax:
Effects on welfare, growth and revenues
11
down these barriers within Europe is estimated to add
an additional €415 billion to the European GDP.26
Furthermore, the Commission sees online platforms as
drivers of innovation and growth in the digitised econ-
omy as they “play an important role in the development
of the online world and create new market opportuni-
ties, notably for SMEs.” 27
Our conclusions are that the DST would work counter
to the development of the DSM and reduce growth and
welfare in the EU. We base our conclusions on two key
effects:
• General distorting effects of the DST
• Distortions arising from the specific design of
the proposed DST
General distorting effects of the DST
Indirect taxes should, according to economic theory, be
aimed at minimising distortions to consumer and pro-
ducer choice. Hence, the overwhelming recommenda-
tion from state-of-the-art literature is to go for a rate
structure that does not change the relative prices of
goods and services consumed by firms and producers. A
single rate VAT system is a good example. The most
valid exemption from this principle is when activities
create positive or negative externalities.28
As a consequence, it seems clear that a DST will reduce
welfare. We have not seen any studies suggesting that
digital services are “overconsumed” in general or lead-
ing to negative externalities, neither that digital compa-
nies are undertaxed, prompting a need for a “correc-
tive/equalisation” tax on certain digital services. The
26 See European Commission (2015) A Digital Single Market Strat-
egy for Europe – Analysis and Evidence, SWD(2015) 100.
27 See European Commission (2017) Mid-Term Review on the im-
plementation of the Digital Single Market Strategy A Connected
Digital Single Market for All, SWD/2017/155, (Mid-Term review,
henceforth), page 7.
28 See e.g. the very comprehensive Mirrlees review in Institute for
Fiscal Studies (2010) Dimensions of Tax Design and Institute for Fis-
cal Studies (2011) Tax by design. The principle are also under-
lined in two major studies for DG TAXUD (2007) Study on reduced
VAT applied to goods and services in the Member States of the
European Union and DG TAXUD (2010) A retrospective evalua-
tion of elements of the EU VAT system and in Aslam and Shah
(2017) Taxation and the Peer-to-Peer Economy, see page 19.
DST also suffers from being a tax on revenue and not
value added. This implies that the tax distorts competi-
tion and hinders the free movement of goods and ser-
vices.29
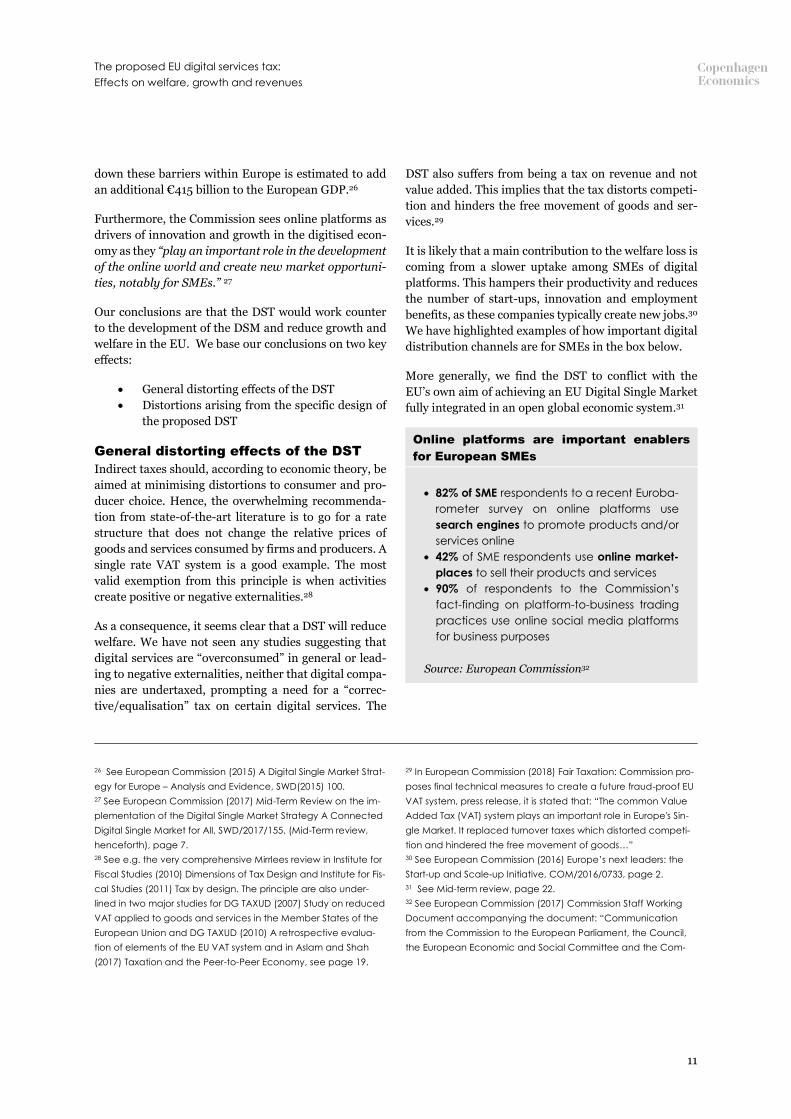
It is likely that a main contribution to the welfare loss is
coming from a slower uptake among SMEs of digital
platforms. This hampers their productivity and reduces
the number of start-ups, innovation and employment
benefits, as these companies typically create new jobs.30
We have highlighted examples of how important digital
distribution channels are for SMEs in the box below.
More generally, we find the DST to conflict with the
EU’s own aim of achieving an EU Digital Single Market
fully integrated in an open global economic system.31
Online platforms are important enablers
for European SMEs
• 82% of SME respondents to a recent Euroba-
rometer survey on online platforms use
search engines to promote products and/or
services online
• 42% of SME respondents use online market-
places to sell their products and services
• 90% of respondents to the Commission’s
fact-finding on platform-to-business trading
practices use online social media platforms
for business purposes
Source: European Commission32
29 In European Commission (2018) Fair Taxation: Commission pro-
poses final technical measures to create a future fraud-proof EU
VAT system, press release, it is stated that: “The common Value
Added Tax (VAT) system plays an important role in Europe's Sin-
gle Market. It replaced turnover taxes which distorted competi-
tion and hindered the free movement of goods…”
30 See European Commission (2016) Europe’s next leaders: the
Start-up and Scale-up Initiative, COM/2016/0733, page 2.
31 See Mid-term review, page 22.
32 See European Commission (2017) Commission Staff Working
Document accompanying the document: “Communication
from the Commission to the European Parliament, the Council,
the European Economic and Social Committee and the Com-
The proposed EU digital services tax:
Effects on welfare, growth and revenues
12
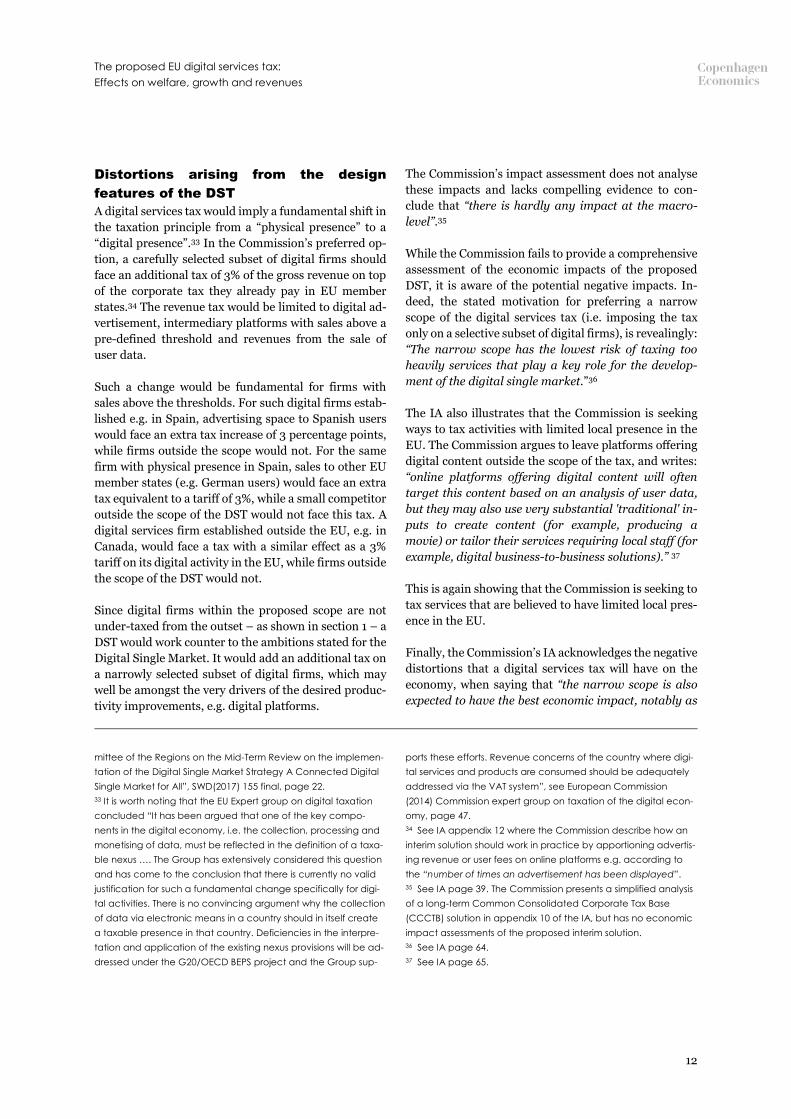
Distortions arising from the design
features of the DST
A digital services tax would imply a fundamental shift in
the taxation principle from a “physical presence” to a
“digital presence”.33 In the Commission’s preferred op-
tion, a carefully selected subset of digital firms should
face an additional tax of 3% of the gross revenue on top
of the corporate tax they already pay in EU member
states.34 The revenue tax would be limited to digital ad-
vertisement, intermediary platforms with sales above a
pre-defined threshold and revenues from the sale of
user data.
Such a change would be fundamental for firms with
sales above the thresholds. For such digital firms estab-
lished e.g. in Spain, advertising space to Spanish users
would face an extra tax increase of 3 percentage points,
while firms outside the scope would not. For the same
firm with physical presence in Spain, sales to other EU
member states (e.g. German users) would face an extra
tax equivalent to a tariff of 3%, while a small competitor
outside the scope of the DST would not face this tax. A
digital services firm established outside the EU, e.g. in
Canada, would face a tax with a similar effect as a 3%
tariff on its digital activity in the EU, while firms outside
the scope of the DST would not.
Since digital firms within the proposed scope are not
under-taxed from the outset – as shown in section 1 – a
DST would work counter to the ambitions stated for the
Digital Single Market. It would add an additional tax on
a narrowly selected subset of digital firms, which may
well be amongst the very drivers of the desired produc-
tivity improvements, e.g. digital platforms.
mittee of the Regions on the Mid-Term Review on the implemen-
tation of the Digital Single Market Strategy A Connected Digital
Single Market for All”, SWD(2017) 155 final, page 22.
33 It is worth noting that the EU Expert group on digital taxation
concluded “It has been argued that one of the key compo-
nents in the digital economy, i.e. the collection, processing and
monetising of data, must be reflected in the definition of a taxa-
ble nexus …. The Group has extensively considered this question
and has come to the conclusion that there is currently no valid
justification for such a fundamental change specifically for digi-
tal activities. There is no convincing argument why the collection
of data via electronic means in a country should in itself create
a taxable presence in that country. Deficiencies in the interpre-
tation and application of the existing nexus provisions will be ad-
dressed under the G20/OECD BEPS project and the Group sup-
The Commission’s impact assessment does not analyse
these impacts and lacks compelling evidence to con-
clude that “there is hardly any impact at the macro-
level”.35
While the Commission fails to provide a comprehensive
assessment of the economic impacts of the proposed
DST, it is aware of the potential negative impacts. In-
deed, the stated motivation for preferring a narrow
scope of the digital services tax (i.e. imposing the tax
only on a selective subset of digital firms), is revealingly:
“The narrow scope has the lowest risk of taxing too
heavily services that play a key role for the develop-
ment of the digital single market.”36
The IA also illustrates that the Commission is seeking
ways to tax activities with limited local presence in the
EU. The Commission argues to leave platforms offering
digital content outside the scope of the tax, and writes:
“online platforms offering digital content will often
target this content based on an analysis of user data,
but they may also use very substantial 'traditional' in-
puts to create content (for example, producing a
movie) or tailor their services requiring local staff (for
example, digital business-to-business solutions).” 37
This is again showing that the Commission is seeking to
tax services that are believed to have limited local pres-
ence in the EU.
Finally, the Commission’s IA acknowledges the negative
distortions that a digital services tax will have on the
economy, when saying that “the narrow scope is also
expected to have the best economic impact, notably as
ports these efforts. Revenue concerns of the country where digi-
tal services and products are consumed should be adequately
addressed via the VAT system”, see European Commission
(2014) Commission expert group on taxation of the digital econ-
omy, page 47.
34 See IA appendix 12 where the Commission describe how an
interim solution should work in practice by apportioning advertis-
ing revenue or user fees on online platforms e.g. according to
the “number of times an advertisement has been displayed”.
35 See IA page 39. The Commission presents a simplified analysis
of a long-term Common Consolidated Corporate Tax Base
(CCCTB) solution in appendix 10 of the IA, but has no economic
impact assessments of the proposed interim solution.
36 See IA page 64.
37 See IA page 65.

The proposed EU digital services tax:
Effects on welfare, growth and revenues
13
it minimises additional distortions, while still having
broadly the same revenue potential as the mixed
scope.” 38 Here the Commission reveals its definition of
“best economic impact” as the option which creates the
least negative impact (distortions) while still yielding a
high tax revenue. As will be shown in section 3, the tax
revenue estimates are likely to be much lower than
claimed.
Not only would the general idea of a digital service tax
run counter to the Commission’s own analysis of the
benefits and drivers of the Digital Single Market, but the
DST proposal will also add a number of further compli-
cations and specific distortions from the DST:
Distortion 1: Digital vs non-digital service
Distortion 2: Above vs below threshold
Distortion 3: Third-party vs own sales
Distortion 4: EU exporters vs non-EU competitors
Distortion 5: Compliant vs non-compliant
See figure 6 for an overview.
Distortion 1: Digital vs non-digital service
As mentioned, the specific EU proposal for a digital ser-
vices tax takes a narrow and selective approach to defin-
ing “digital presence” and hence defines some firms as
“digital” and thereby taxable, while others are not. How-
ever, because the digital economy is increasingly be-
coming the economy itself, such ring-fencing for tax
purposes, as proposed by the Commission, seem unfea-
sible and arbitrary.39
Furthermore, a distortion is created between large firms
with sales above the thresholds using one specific digital
business model (e.g. online platform) and large firms
with sales above the thresholds using another business
model for approaching the same market, e.g. more tra-
ditional media company seeking to convince advertisers
to place ads on their site.
In this case, two firms would be competing for the same
business (e.g. advertising revenue) using two different
approaches (one within scope and the other outside
scope), and one would face a 3% additional tax and the
other none. This will introduce a distortion and will
other things being equal, unduly reduce the speed of the
38 See IA page 65.
digital growth of the company using one specific digital
approach.
This distortion could also lead to less digital consump-
tion, as consumers chose “physical” alternatives that are
not DST liable, e.g. CD’s instead of streaming.
Distortion 2: Above vs below threshold
Another additional distortion would occur between dig-
ital firms with the same business models, but where one
firm has revenue above the threshold whereas another
firm would be below. This could be two competing plat-
forms both with more than €750 million in global reve-
nue, but one having above €50 million in EU digital rev-
enue, and the other having less than €50 million in EU
digital revenue.
In this case, the firm with most activity in the EU would
face a 3% tax on all sales in the EU, while the otherwise
similar firm with less activity in the EU would not be
facing any additional taxes. This clearly creates an ad-
verse incentive and will be signalling to global firms that
they will be penalised if they grow successful in the EU
(i.e. grow above the threshold of €50 million). It is also
worth noting that businesses that grow to this threshold
will have negative pressure put on their valuations given
the additional tax and compliance burdens associated
with reaching the threshold.
For home grown EU digital firms, this will also give a
perverse incentive not to grow beyond the threshold and
unduly put disadvantage on digital companies aiming to
grow their business predominantly in Europe.
39 OECD (2015) Addressing the Tax Challenges of the Digital
Economy, Action 1 - Final Report

The proposed EU digital services tax:
Effects on welfare, growth and revenues
14
Figure 6 Five distortions created by the digital services tax
Source: Copenhagen Economics

The proposed EU digital services tax:
Effects on welfare, growth and revenues
15
All in all, the proposed “narrow scope” with such thresh-
olds would – in our view – create a number of unin-
tended and negative impacts that run directly counter to
the aims of the digital single market. It will reduce the
incentive to invest and build innovative EU firms within
the areas covered by the DST. This is further unfortu-
nate, as this is an area that is otherwise incentivised with
EU funding for R&D.40
Distortion 3: Third-party vs own sales
The EU proposal would also impact mixed business
models, i.e. firms that are both selling own products via
a website and making the platform available for third-
party sellers. In this case, the sales of own products via
the website would be out of the scope of the DST (they
would not qualify as taxable revenues), while sales by
third parties would be covered by the DST.
This will distort the competition between own products
and sales of third party products, and it will play to the
disadvantage of third-party sellers, which are often
SMEs.41 This could generate an insourcing bias for the
platforms as they would have a counterproductive in-
centive to insource some of the products currently sold
by third-party sellers.42
Distortion 4: EU exporter vs non-EU
competitors
The fourth distortion relates to EU exporters vs non-EU
competitors. Here, a distortion is created between an
EU exporter using online platforms to export goods and
services to non-EU buyers compared to a non-EU user
selling similar goods and services to the same non-EU
buyers and using the same online platform. In this case,
the EU firm would face the additional costs passed
through by the online platform to the users as a result of
the DST, while the non-EU firm would not face any ad-
ditional tax. This clearly creates a competitive distor-
tion.
40 Over the next three years, Horizon 2020 plans for an additional
EUR 300 million for activities related to digital innovation hubs,
which is essential to support local startups and innovation.
EUR 300 million has been specifically planned for the develop-
ment of next generation of digital industrial platforms, in particu-
lar through new reference architecture models leading to smart
factories and services.
41 See Copenhagen Economics (2016) Economic effects of
online marketplace bans.
This distortion will also hit SMEs disproportionately, as
online market places facilitate exports by even the
smallest retailers. The online market places and digital
advertising reduce trade costs for SMEs and at the same
time provide them with a global presence and reach pre-
viously reserved to large (multinational) retailers.43
This enables SME retailers to benefit in the same way
from internationalisation (larger market, larger cus-
tomer pool, less dependent on domestic economy) as
larger exporting retailers. However, the introduction of
the DST would put EU exporters at a competitive disad-
vantage potentially disrupting SMEs from reaping the
full benefits of online market places.
Distortion 5: Compliant vs non-compliant
To the extent that the DST cannot be enforced against
non-compliant businesses it will add a further distor-
tion. Ultimately, non-compliant companies would po-
tentially gain a competitive advantage that pushes prof-
its and market shares towards these companies.
Despite this concern the DST proposal and the accom-
panying IA contain no assessment of the magnitude of
this risk nor any enforcement mechanisms to ensure
compliance. This is especially relevant for non-EU busi-
nesses which do not have physical presence in the EU
and may therefore be more difficult to enforce against
as e.g. auditing is challenging.
Furthermore, experience from VAT suggests that non-
compliance issues are indeed substantial and can ex-
pose member states to unacceptable and damaging lev-
els of VAT fraud.44 This suggests that non-compliance
issues will also be relevant with respect to the DST.
Hence adding a distortion.
All in all, these distortions would – individually and
combined – have a range of negative economic impacts
on the speed of digital development in the EU and none
42 Furthermore, this appears to conflict with the European Com-
mission's platform to business proposal which seeks to safeguard
a level playing field between platforms and the SMEs using
them, see European Commission (2018) Proposal for a Regula-
tion on promoting fairness and transparency for business users of
online intermediation services, COM(2018) 238 final.
43 See WTO (2016) World Trade Report 2016. Levelling the trading
field for SMEs, page 54.
44 See European Commission (2017) Fact Sheet - Questions and
Answers on VAT reform in the EU.

The proposed EU digital services tax:
Effects on welfare, growth and revenues
16
of these impacts have been properly addressed in the
Commission’s IA.
In our view, both the general idea of a DST, and indeed
the specific EU proposal would have several negative
impacts on the European economy, and, in our assess-
ment, impact the uptake of the newest digital technolo-
gies and this will slow down digital transition and lead
to slower productivity growth. Slower productivity
growth will lead to slower GDP growth in the EU if a
DST is implemented in any of its current proposed
forms (see also Figure 7).
REVENUE ESTIMATES TOO
OPTIMISTIC
The proposal contains an estimate of total revenues in
the order of €4.7 billion. However, this estimate is based
on a static calculation, assuming no significant reaction
from consumers to higher prices and not accounting for
the impact on other sources of tax revenue. Neither does
it take into account the effects on consumer behaviour
from the introduction of the five distortions outlined
above.
In this section, we find that the revenue estimate in the
Commission’s IA is too optimistic. First, we account for
standard dynamics effects and estimate the revenue im-
pact and, secondly, we have identified other sources of
revenue leakage that will reduce the revenue even fur-
ther.
Standard dynamic effects can reduce
revenues
We have estimated the potential net tax revenue ac-
counting for four effects:
1) Decrease in corporate tax base
2) Lower demand for digital services
3) Lower demand for other goods and services
45 See European Commission (2018) Proposal for a COUNCIL DI-
RECTIVE on the common system of a digital services tax on reve-
nues resulting from the provision of certain digital services,
COM(2018) 148 final, page 20.
46 Given the fact that there is little evidence of under taxation of
the digitalised economy, the DST, even if deductible as a cost,
will result in over taxation.
47 The commission references a pass through of only 33-50%
based on two studies on VAT, see European Commission (2012) –
Economic Study on Publications on all Physical Means of Support
4) Compliance costs for national tax authorities
1) Decrease in corporate tax base
The Commission expects member states to make the
DST deductible as a cost in the corporate tax base to al-
leviate double taxation issues.45 Accounting for the de-
ductibility of the DST will lower the revenue impact by
up to €1.1 billion. Even if some companies do not yield
a profit today, most member states allow for losses to be
carried forward.
However, if member states do not make the DST de-
ductible as a cost in the corporate tax base, the tax will
be even more distortionary and result in further double
taxation issues.46 Ultimately having an even larger neg-
ative impact on the EU economy.
2) Lower demand for digital services
A new tax on digital services will be passed through to
customers to some degree, as found in section 2.47
Higher prices implies less consumption of digital ser-
vices by companies and households. This will reduce the
revenue of the companies liable for the DST and thereby
reduce the revenue from the tax. We find that lower de-
mand can reduce the revenue from DST directly by be-
tween €0.1-0.2 billion with a 33% and 100% pass-
through rate of the cost increase respectively.48
3) Lower demand for other goods and
services
Higher prices for digital services also have a negative
impact on all other sectors using digital services as an
input. Based on an input/output model we have calcu-
lated the impact on tax revenue more broadly as a con-
sequence of a price increase in digital services. €0.1-0.3
billion from declines in VAT, corporate income tax, div-
idend tax and wage tax revenues.49
and Electronic Publications in the context of VAT, p. 98 and
Benedek et al. (2015) Estimating VAT Pass Through, p.16. The DST
is not comparable to VAT, as argued above, and generally
economy theory suggests a pass through up to 100% in the long
run, see DG TAXUD (2007) Study on reduced VAT applied to
goods and services in the Member States of the European Union.
48 We have used a demand elasticity of -1.5 as referenced in the
IA, page 102.
49 The calculation is based on an assumed income elasticity of -1
and export elasticity of -5.

The proposed EU digital services tax:
Effects on welfare, growth and revenues
17
Figure 7 Distortions, effects and implications of the proposed EU DST
Source: Copenhagen Economics
The proposed EU digital services tax:
Effects on welfare, growth and revenues
18
4) Compliance costs for national tax
authorities
The compliance costs for national tax authorities rises
as a result of having to set up a new system (one-stop-
shop) to handle the new tax and distribute it to other
member states combined with new audit mechanisms to
ensure compliance.
A study shows that the annual costs for having a (mini)
One-Stop-Shop (OSS) amounts to between €56-84 mil-
lion for the whole EU.50 In addition, each tax authority
will have implementation costs, which amounts to
€280-420 million.51 These costs are, however, likely un-
derestimated due to the DST being a more complex tax
to handle and audit (e.g. checking that all users/clicks
are real can be an almost insurmountable task).52
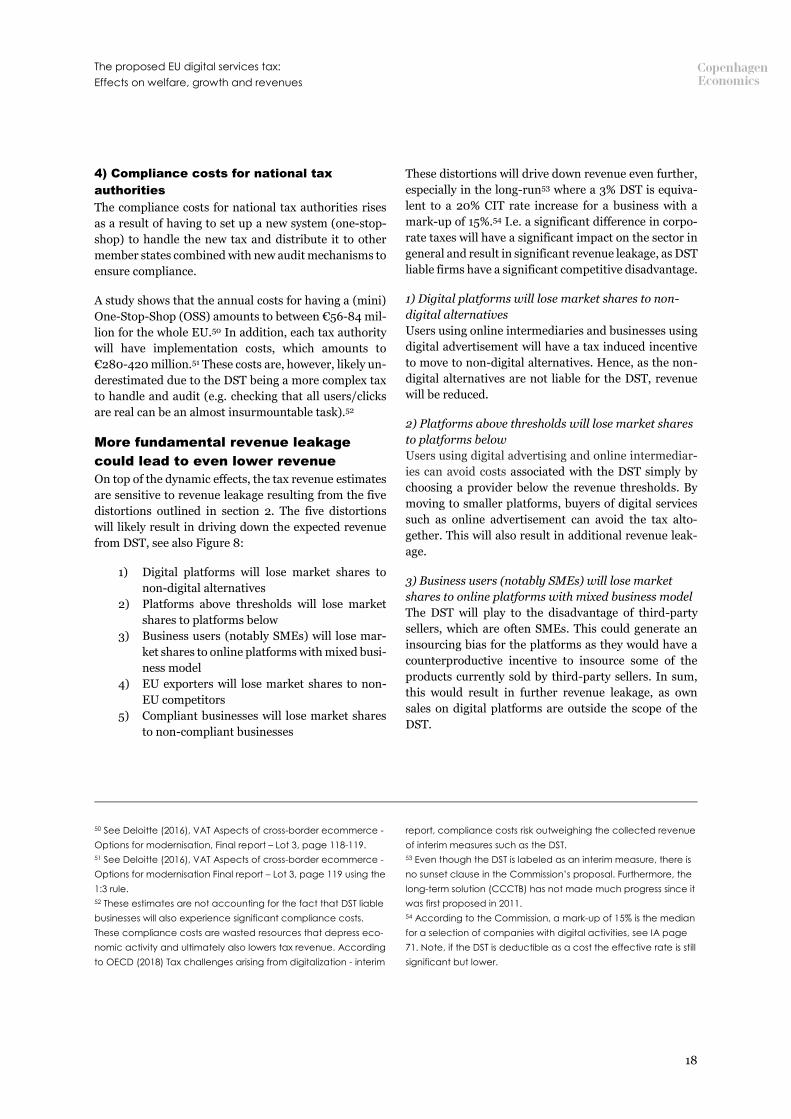
More fundamental revenue leakage
could lead to even lower revenue
On top of the dynamic effects, the tax revenue estimates
are sensitive to revenue leakage resulting from the five
distortions outlined in section 2. The five distortions
will likely result in driving down the expected revenue
from DST, see also Figure 8:
1) Digital platforms will lose market shares to
non-digital alternatives
2) Platforms above thresholds will lose market
shares to platforms below
3) Business users (notably SMEs) will lose mar-
ket shares to online platforms with mixed busi-
ness model
4) EU exporters will lose market shares to non-
EU competitors
5) Compliant businesses will lose market shares
to non-compliant businesses
50 See Deloitte (2016), VAT Aspects of cross-border ecommerce -
Options for modernisation, Final report – Lot 3, page 118-119.
51 See Deloitte (2016), VAT Aspects of cross-border ecommerce -
Options for modernisation Final report – Lot 3, page 119 using the
1:3 rule.
52 These estimates are not accounting for the fact that DST liable
businesses will also experience significant compliance costs.
These compliance costs are wasted resources that depress eco-
nomic activity and ultimately also lowers tax revenue. According
to OECD (2018) Tax challenges arising from digitalization - interim
These distortions will drive down revenue even further,
especially in the long-run53 where a 3% DST is equiva-
lent to a 20% CIT rate increase for a business with a
mark-up of 15%.54 I.e. a significant difference in corpo-
rate taxes will have a significant impact on the sector in
general and result in significant revenue leakage, as DST
liable firms have a significant competitive disadvantage.
1) Digital platforms will lose market shares to non-
digital alternatives
Users using online intermediaries and businesses using
digital advertisement will have a tax induced incentive
to move to non-digital alternatives. Hence, as the non-
digital alternatives are not liable for the DST, revenue
will be reduced.
2) Platforms above thresholds will lose market shares
to platforms below
Users using digital advertising and online intermediar-
ies can avoid costs associated with the DST simply by
choosing a provider below the revenue thresholds. By
moving to smaller platforms, buyers of digital services
such as online advertisement can avoid the tax alto-
gether. This will also result in additional revenue leak-
age.
3) Business users (notably SMEs) will lose market
shares to online platforms with mixed business model
The DST will play to the disadvantage of third-party
sellers, which are often SMEs. This could generate an
insourcing bias for the platforms as they would have a
counterproductive incentive to insource some of the
products currently sold by third-party sellers. In sum,
this would result in further revenue leakage, as own
sales on digital platforms are outside the scope of the
DST.
report, compliance costs risk outweighing the collected revenue
of interim measures such as the DST.
53 Even though the DST is labeled as an interim measure, there is
no sunset clause in the Commission’s proposal. Furthermore, the
long-term solution (CCCTB) has not made much progress since it
was first proposed in 2011.
54 According to the Commission, a mark-up of 15% is the median
for a selection of companies with digital activities, see IA page
71. Note, if the DST is deductible as a cost the effective rate is still
significant but lower.

The proposed EU digital services tax:
Effects on welfare, growth and revenues
19
4) EU exporters will lose market shares to non-EU
competitors
Another source of leakage is that EU exporters selling
goods and services to non-EU buyers via online inter-
mediaries will lose market shares to non-EU competi-
tors. Ultimately resulting in additional revenue leakage.
Since the proposed DST would only apply to transac-
tions where at least one of the users is located in the EU,
this would give a competitive advantage for non-EU
competitors when selling to non-EU users.
5) Compliant businesses will lose market shares to
non-compliant businesses
Experience from VAT compliance suggests that non-
compliance issues are indeed relevant. This creates an-
other source of revenue leakage, as non-compliant can
exploit the un-level playing field to gain market shares.
All in all, these five distortions will cause additional rev-
enue leakage resulting in even lower revenue for mem-
ber states.
Figure 8 Distortions will result in lower revenue from the digital services tax (Illustration)
Source: Copenhagen Economics

The proposed EU digital services tax:
Effects on welfare, growth and revenues
20
Overall the revenue is likely significantly
lower than estimated by the Commission
The Commission estimate of €4.7 billion is too optimis-
tic. Accounting first of all for standard dynamic effects
and compliance costs suggest a revenue of approxi-
mately €3.1-3.4 billion, see Figure 9. Furthermore, ac-
counting for both dynamic effects, compliance costs and
a revenue leakage of 20% suggest a revenue of only
€2.5-2.7 billion. If the revenue leakage reaches 40%, the
revenue will be as little as €1.8-2.0 billion. That is 59%
lower than the Commission estimate.
While no study including the IA has analysed the extent
to which distortions will result in revenue leakage, our
assessment is that the combined effects of multiple dis-
tortions are likely to be considerable, especially in the
long run. The basic logic is that a 3% revenue tax creates
a significant wedge in effective tax rates for business
within vs outside the scope of the DST. Furthermore, the
DST can have detrimental effects on business models
55 A recent study, Hufbauer and Lu (2018) The European Union’s
Proposed Digital Services Tax: A De Facto Tariff, suggests that the
operating with low margins and having an extended pe-
riod of losses to reach critical user mass and generate
profits. This suggests high rather than low revenue leak-
age.
We would also highlight that these outcomes are not ac-
counting for any retaliation measures that non-EU
countries will potentially introduce as a response to the
EU DST. Such measures would further depress the rev-
enue from the DST.55
In addition, when the UK leaves the EU
revenue is even lower
On top of the dynamic effects and revenue leakage,
when the UK leaves the EU, the Commission estimates
that the revenue will drop by approximately 30% or
about EUR 1 bn. This is driven by a disproportionately
large share of revenue from digital services coming from
the UK.
European DST is “De Facto Discrimination” and that retaliation is
not unlikely, see page 8 and 10.
Figure 9 EU tax revenue from introducing Digital Services Tax significantly lower than estimated
Source: Copenhagen Economics based on the Commission’s IA and own calculations
3.1
2.5
1.8
3.4
2.7
2.0
3,4
2,6
1,9
EC (2018) 0%revenue leakage
20%revenue leakage
40%revenue leakage
EUR billion DST revenue -29% -44% -59%
100% cost pass-through
33% cost pass-through50% cost pass-through

The proposed EU digital services tax:
Effects on welfare, growth and revenues
21
CONCLUSIONS
The European Commission as well as several member
states have either proposed or already implemented
new instruments to tax economic activities linked to
digital platforms.
We find that there is an urgent need to review the ra-
tionale for these policies. On closer examination, the ar-
guments put forward as justifications are not supported
by robust data or tax policy analysis. This is certainly the
case with respect to the claimed under-taxation of digi-
tal companies and stated risks of losing steadily more
tax base as digital business models grow in importance.
Moreover, we also find that the potential adverse effects
have not been examined in any depth. We find it more
than likely that digital taxes will slow the digitalisation
of the European economy, with SMEs being dispropor-
tionately hit. The proposed design of the instruments
targeting a subset of activities and only firms with turn-
overs above thresholds will also lead to potentially sig-
nificant distortions.
We have also noted that there is limited consensus ei-
ther within the EU or in the wider international commu-
nity on the rationale and need for putting new specific
instruments in place to tax certain digital activities.
As a consequence, we find no merits for using the DST
as a basis for EU discussions on taxation of digital ser-
vices and we suggest that the EU focuses on the negoti-
ations taking place at the OECD level.
The proposed EU digital services tax:
Effects on welfare, growth and revenues
22
LITERATURE
• Aslam and Shah (2017) Taxation and the Peer-to-Peer Econ-
omy
• Benedek et al. (2015) Estimating VAT Pass Through
• CBO (2017) International Comparisons of Corporate Income
Tax Rates
• Copenhagen Economics (2016) Economic effects of online
marketplace bans
• CPB Netherlands Bureau for Economic Policy Analysis et al.
(2015) A study on R&D tax incentives: Final report
• Damodaran Online, Accessed 13th June 2018
• Deloitte (2016) VAT Aspects of cross-border ecommerce -
Options for modernisation
• Devereux and Vella (2017) Implications of digitalisation for
international corporate tax reform
• DG TAXUD (2007) Study on reduced VAT applied to goods
and services in the Member States of the European Union
• DG TAXUD (2010) A retrospective evaluation of elements of
the EU VAT system
• DG TAXUD (2018) Taxation Trends in the European Union
• ECIPE (2018) Digital Companies and Their Fair Share of
Taxes: Myths and Misconceptions
• ECIPE (2018) Five Questions about the Digital Services Tax
to Pierre Moscovici
• European Commission (2012) Economic Study on Publica-
tions on all Physical Means of Support and Electronic Publi-
cations in the context of VAT
• European Commission (2014) Commission expert group on
taxation of the digital economy
• European Commission (2015) A Digital Single Market Strat-
egy for Europe - Analysis and Evidence, SWD(2015) 100
• European Commission (2015) A Digital Single Market Strat-
egy for Europe, COM(2015) 192
• European Commission (2016) Europe’s next leaders: the
Start-up and Scale-up Initiative, COM(2016) 733
• European Commission (2017) Fact Sheet - Questions and
Answers on VAT reform in the EU
• European Commission (2017) Mid-Term Review on the im-
plementation of the Digital Single Market Strategy A Con-
nected Digital Single Market for All, SWD/2017/155
• European Commission (2017) Commission Staff Working
Document accompanying the document: “Communication
from the Commission to the European Parliament, the
Council, the European Economic and Social Committee and
the Committee of the Regions on the Mid-Term Review on
the implementation of the Digital Single Market Strategy A
Connected Digital Single Market for All”, SWD(2017) 155 fi-
nal, page 22.
• European Commission (2018) Proposal for a Regulation on
promoting fairness and transparency for business users of
online intermediation services, COM(2018) 238 final.
• European Commission (2018) Impact Assessment accompa-
nying the documents: “Proposal for a Council Directive lay-
ing down rules relating to the corporate taxation of a signif-
icant digital presence” and “Proposal for a Council Directive
on the common system of a digital services tax on revenues
resulting from the provision of certain digital services”,
SWD(2018) 81 final/2
• European Commission (2018) Fair Taxation: Commission
proposes final technical measures to create a future fraud-
proof EU VAT system
• European Commission (2018) Regulatory scrutiny board
opinion, SEC(2018) 162 final
• European Commission (2018) Proposal for a COUNCIL DI-
RECTIVE on the common system of a digital services tax on
revenues resulting from the provision of certain digital ser-
vices, COM(2018) 148 final
• Gordon (2016) The Rise and Fall of American Growth
• Hall et al. (2015) Financing constraints, R&D investments
and innovative performances: new empirical evidence at the
firm level for Europe
• Hufbauer and Lu (2018) The European Union’s Proposed
Digital Services Tax: A De Facto Tariff
• Institute for Fiscal Studies (2010) Dimensions of Tax De-
sign, The Mirrlees Review
• Institute for Fiscal Studies (2011) Tax by design, The
Mirrlees Review
• Jorgenson (2001) Information Technology and the U.S.
Economy
• Nylén and Holmström (2015) Digital innovation strategy: A
framework for diagnosing and improving digital product
and service innovation
• OECD (2015) Addressing the Tax Challenges of the Digital
Econ-omy, Action 1 - Final Report
• OECD (2018) Tax challenges arising from digitalization - in-
terim report
• PwC & ZEW (2017) Digital Tax Index
• van Ark, Inklaar and McGuckin (2003) The Contribution of
ICT Producing and Using Industries to Productivity Growth:
A Comparison of Canada, Europe and the United States
• WTO (2016) World Trade Report 2016 Levelling the trading
field for SMEs
• ZEW (2016) Effective tax levels using the Devereux/Griffith
methodology
• ZEW (2018) Analysis of US Corporate Tax Reform Proposals
and their Effects for Europe and Germany

The proposed EU digital services tax:
Effects on welfare, growth and revenues
23
Contact for this study:
Partner, Helge Sigurd Næss-Schmidt
About Copenhagen Economics
Copenhagen Economics is the leading economic consultancy in the Nordic region. Our econ-
omists provide advice and analyses in the fields of competition, regulation, international trade
and impact assessment.
We solve complex problems for clients in the areas of
We provide hard facts and clear stories, enabling our clients and their stakeholders to make
superior decisions based on sound analysis.
We advise companies, authorities and policy makers when market meets regulation and con-
flicts arise. We help our private sector clients handle conflict cases and guide them on How to
prosper through regulatory management. We help our public sector clients evaluate and de-
vise new regulation.
Founded in 2000, the firm is based in offices in Brussels, Copenhagen, Stockholm and Helsinki
• Is partner-owned
• counts more than 80 employees, mostly with Ph.D. or M.Sc. in Economics
• includes Economists from various nationalities / languages: Danish, Dutch, English, Finn-
ish, French, German, Hungarian, Italian, Lithuanian, Norwegian, Portuguese, Spanish,
Swedish
• and operates across the world.
Global Competition Review (CGR) lists Copenhagen Economics as one of the top 20
economic consultancies in the world.
www.copenhageneconomics.com


