British Journal of Clinical Psychology (2004) 43 245ndash265
2004 The British Psychological Society
The Positive and Negative Affect Schedule(PANAS) Construct validity measurementproperties and normative data in a largenon-clinical sample
John R Crawford and Julie D HenryDepartment of Psychology Kingrsquos College University of Aberdeen UK
Objectives To evaluate the reliability and validity of the PANAS (Watson Clark ampTellegen 1988b) and provide normative data
Design Cross-sectional and correlational
Method The PANAS was administered to a non-clinical sample broadlyrepresentative of the general adult UK population (N = 1003) Competing modelsof the latent structure of the PANAS were evaluated using confirmatory factor analysisRegression and correlational analysis were used to determine the influence ofdemographic variables on PANAS scores as well as the relationship between thePANAS with measures of depression and anxiety (the HADS and the DASS)
Results The best-fitting model (robust comparative fit index = 94) of the latentstructure of the PANAS consisted of two correlated factors corresponding to the PAand NA scales and permitted correlated error between items drawn from the samemood subcategories (Zevon amp Tellegen 1982) Demographic variables had only verymodest influences on PANAS scores and the PANAS exhibited measurementinvariance across demographic subgroups The reliability of the PANAS was highand the pattern of relationships between the PANAS and the DASS and HADS wereconsistent with tripartite theory
Conclusion The PANAS is a reliable and valid measure of the constructs it wasintended to assess although the hypothesis of complete independence between PA andNA must be rejected The utility of this measure is enhanced by the provision of large-scale normative data
The Positive and Negative Affect Schedule (PANAS) is a 20-item self-report measure ofpositive and negative affect developed by Watson Clark and Tellegen (1988b) NA and
wwwbpsorguk
Correspondence should be addressed to Professor John R Crawford Department of Psychology Kingrsquos College University ofAberdeen Aberdeen AB24 3HN UK (e-mail jcrawfordabdnacuk)
245
PA reflect dispositional dimensions with high-NA epitomized by subjective distress and
unpleasurable engagement and low NA by the absence of these feelings By contrast
PA represents the extent to which an individual experiences pleasurable engagementwith the environment Thus emotions such as enthusiasm and alertness are indicative
of high PA whilst lethargy and sadness characterize low PA (Watson amp Clark 1984) It
has however been argued that the labels positive affect and negative affect are
misleading Watson Wiese Vaidya and Tellegen (1999) point out that PA and NA are
predominantly defined by the activation of positively and negatively valenced affects
respectively (ie the lower ends of each dimension are typified by its absence) Thus to
emphasize the activated nature of each of these constructs it has been argued that
positive affect and negative affect should be renamed positive activation and negativeactivation respectively In the present work these labels are to be regarded as
interchangeable
The PANAS is claimed to provide independent measures of PA and NA Since its
development the measure has been employed in research for diverse purposes Its
popularity may be attributed to its brevity and perhaps more important its close
association with an influential conceptualization of anxiety and depression the
tripartite model (Clark amp Watson 1991b)
Although anxiety and depression are phenomenologically distinct it has proven verydifficult to distinguish between these constructs by empirical means either through the
use of cliniciansrsquo ratings or particularly through the use of self-report measures (Clark
amp Watson 1991a) It has been suggested that this is because most existing self-report
scales for anxiety and depression predominantly measure the common factor of
negative affectivity (Watson amp Clark 1984) There is a great deal of evidence in support
of this position (Cole 1987 Feldman 1993) The tripartite model however posits that
in addition to the common factor of negative affectivity there are specific components
to anxiety and depression that allow them to be differentiated In the case of anxietythe specific component is physiological hyperarousal and in the case of depression it is
low PA (low PA is similar to the psychiatric concept of anhedonia)
Watson et al (1995b) directly tested the predictions of the tripartite model Three
student one adult and one patient sample were administered the Mood and Anxiety
Symptom Questionnaire (MASQ Watson amp Clark 1991) The MASQ consists of three
lsquogeneralrsquo depression and anxiety scales as well as two specific scales one of which
measures anxious arousal the other anhedonic depression Across samples the pattern
of correlations consistently revealed that the specific measures possessed superiordiscriminant validity in comparison with the general depression and anxiety measures
Moreover this was achieved without compromising convergent validity Using the
same five samples Watson et al (1995a) conducted an exploratory factor analysis (EFA)
of the MASQ A three-factor solution corresponding to general distress anhedonic
depression and somatic anxiety could be extracted for all five groups Thus both
studies provide preliminary support for the validity of the tripartite model
In addition the PANAS has been shown to be effective at differentiating between
depression and anxiety in clinical samples Dyck Jolly and Kramer (1994) conductedan EFA of self-report measures of anxiety depression NA and PA in a psychiatric
sample (N = 162) that identified two correlated factors (r = 732) corresponding to
NA and PA Regression analyses were used to test whether these factors predicted self-
reported anxiety and depression in independent clinical measures The NA factor and
not the PA factor significantly contributed to predicting anxiety but both factors
significantly predicted depression Analogously Jolly Dyck Kramer and Wherry
246 John R Crawford and Julie D Henry
(1994) administered a diverse range of clinical measures to 159 psychiatric out-patients
Partial correlations revealed that when NA was controlled depression but not anxiety
was related to PA scores However with PA controlled both depression and anxietyexplained a substantial amount of the variance in NA scores Both these studies support
tripartite theory as they found PA to be specifically related to depression and not
anxiety but NA to be highly related to both
If the use of the PANAS in research and potentially in clinical practice is to be
optimal then it is necessary to delineate its underlying structure Watson et al (1988b)
conducted an EFA with varimax rotation that revealed that the first two factors
accounted for a very high proportion of the common variance with all items loading
cleanly on their designated factor However confirmatory factor analysis (CFA)provides an alternative to EFA and is associated with a number of advantages In
particular in CFA the fit of competing models can be compared quantitatively
To date two studies involving the 20-item PANAS have employed CFA Crocker
(1997) reported that although globally Watson et alrsquos (1988b) oblique two-factor
model represented a good fit to data derived from a youth sporting group (N = 671) a
degree of misspecification remained Crocker (1997) suggested that this was because
the items comprising the scale were derived from various content areas (Zevon amp
Tellegen 1982) and therefore permitting correlated error would improve the modelrsquosfit However no study to date has tested a model parameterized according to these
specifications Moreover Mehrabian (1998) found that a complex hierarchical structure
represented a superior though still inadequate fit in comparison to Watson et alrsquos
(1988b) hypothesized two-factor structure However this model was derived on a
purely a posteriori basis and thus may have arisen as a consequence of an idiosyncratic
sample or may simply have reflected the fact that the complex model was less
restricted Again no study to date has attempted to determine which of these
possibilities is correctThe most controversial characteristic of the PANAS is the purported independence
of its subscales It has been argued that it is counter-intuitive to regard happiness and
sadness as unrelated constructs (Costa amp McCrae 1980) and indeed all measures of PA
and NA developed prior to the PANAS have proven at least moderately negatively
correlated Watson et al (1988b) argue that this is attributable to inadequacies in the
instruments themselves and not the notion of independence Watson et al (1988b)
have reported low to moderate correlations between the PA and NA scales ranging
from 712 to 723 with other studies reporting similar results (Chen Dai Spector ampJex 1997 Joiner amp Blalock 1995 Mehrabian 1998) Moreover using CFA two nearly
orthogonal dimensions of PA and NA were reported for a 10-item short form of the
PANAS (r = 710 Mackinnon et al 1999)
However Green Goldman and Salovey (1993) argue that random measurement
error and acquiescence attenuates negative correlations and thus that two dimensions
such as PA and NA may appear to be relatively independent when in fact they are
opposite poles of the same dimension Moreover van Schuur and Kiers (1994) argue
that an artifact of factor analysis when analysing bipolar concepts is the identification oftwo factors as the two halves of the same dimension are treated as independent Thus
alternative models that reflect bipolarity may account for the nearly independent
dimensions found in factor analysis Indeed Russell and Carroll (1999) maintain that
bipolarity represents the most parsimonious fit to models of PA and NA and that
previous research has erroneously assumed that a necessary consequence of bipolarity
is an invariant latent correlation between the two constructs In fact the correlation
247Evaluation of PANAS
changes as a function of time-frame response format and as exemplified by the PANAS
the items comprising the instrument
Russell and Carrollrsquos (1999) semantic analysis of affect terms delineates twodimensions corresponding to pleasantness and activation The relationship between PA
and NA is argued to be dependent upon which item clusters are chosen as whilst some
are semantically opposite others are independent Inspection of the items comprising
the PANAS suggests that relatively independent subscales have been attained through
omitting affective terms which represent low activation ie focusing on a restricted
range of affect Whilst the NA items represent the cluster lsquohighly unpleasanthigh
activationrsquo the PA items represent the cluster lsquohighly pleasanthigh activationrsquo these
two clusters are 908 apart on Russell and Carrollrsquos (1999) model This raises questionsregarding the construct validity of the PANAS scales as if selection of items was
explicitly guided by a quest for orthogonality the items may not adequately represent
their putative constructs This possibility is supported by the fact that Watson and Clark
(1984) state that fear is lsquoentirely unrelated to NArsquo (p 469) yet Watson et al (1988b)
include both lsquoscaredrsquo and lsquoafraidrsquo in the NA scale
However although questions have been raised regarding whether it is appropriate to
regard the constructs of PA and NA as relatively independent there is a great deal of
evidence that they are distinct (see Watson et al 1999) In particular Watson et al
(1999) argue that the dimensions of PA and NA represent the subjective components of
the more general biobehavioural systems of approach and withdrawal or the
behavioural inhibition system (BIS) and behavioural engagement system (BES)
respectively It is suggested that since the purpose of the BIS is to inhibit behaviour
that may lead to undesirable consequences the negative emotional states that
characterize the NA dimension help to promote vigilant apprehensiveness Relatedly
the purpose of the BES system is to ensure that essential resources are obtained and
thus the positive emotional states associated with PA can be regarded as motivatinggoal-directed behaviours Watson et al (1999) argue that whilst these adaptive systems
are separate they are not entirely independent of one another thus accounting for the
moderate correlations reported between the constructs of PA and NA
Tellegen Watson and Clark (1999) suggest that an overarching bipolar happiness-
versus unhappiness dimension underlies the negative correlation between NA and PA
Tellegen et al (1999) found using exploratory hierarchical factor analysis that the
structure of affect consists of a three-level hierarchy in which the most general
dimension of happinessndashsadness forms a largely bipolar structure at the second levelPA and NA are relatively independent and at the lowest level there are more
circumscribed discrete emotions Whereas when using CFA the latent correlation
between happinessndashsadness with high (r = 791) the correlation between PA and NA
was substantially smaller (r = 743) In the exploratory analyses it was also found that
PA and NA were only moderately correlated (r = 731)
As stated previously the PANAS has been extensively employed and this is reflected
in the fact that shortened elongated and childrenrsquos versions have been developed It is
therefore surprising that there have been relatively few studies of other aspects of theinstrumentrsquos psychometric properties Watson et al (1988b) administered the PANAS
with time-frames ranging from lsquoright nowrsquo to lsquoduring the last yearrsquo to a large
predominantly student sample The reliability of the PA scale ranged from 86 to 90
the NA scale from 84 to 87 values similar to those obtained from independent
research involving clinical and non-clinical populations (Jolly et al 1994 Mehrabian
1998 Roesch 1998) However the non-clinical studies that have typically been
248 John R Crawford and Julie D Henry
conducted either employed purely student samples (Roesch 1998) or participants not
broadly representative of the general population (Mehrabian 1998 Watson et al
1988b) The nature of these samples means that the generalizability of their results tothe normal population is uncertain (Gotlib 1984 Nezu Nezu amp Nezu 1986)
Normative data are also very limited a literature search conducted by the present
authors failed to uncover general adult population norms for the English-language
version derived from a large sample Moreover despite the fact that three studies
involving clinical populations have utilized the lsquopast weekrsquo time format (Dyck et al
1994 Jolly et al 1994 Kuiper McKee Kazarian amp Olinger 2000) no study conducted
in the general population has done so Relatedly the influence of demographic
characteristics on PANAS scores has also gone largely uninvestigatedThe aims of the present study were (1) to evaluate competing models of the latent
structure of the PANAS using confirmatory factor analysis Details of the parameteriza-
tion of the models (and the theoretical methodological and empirical considerations
that guided their selection) are presented in the Methods section The second aim (2)
was to test whether the relationships of PA and NA with measures of depression and
anxiety support tripartite theory Thus (2a) it was hypothesized that the correlation
between PA and depression would be significantly higher than the correlation between
PA and anxiety In addition (2b) it was hypothesized that PA would explain asignificantly greater proportion of the variance unique to depression than would NA
Finally we aimed to (3) estimate the reliability of the PANAS (4) investigate the
influence of demographic variables on PANAS scores and (5) provide normative data
for the PANAS
Method
ParticipantsComplete PANAS data were collected from 1003 members of the general adult
population (females = 537 males = 466) Participants were recruited from a wide
variety of sources including commercial and public service organizations community
centres and recreational clubs The mean age of the sample was 429 years (SD = 157)
with a range of 18ndash91 years The mean number of years of education was 137
(SD = 34)Each participantrsquos occupation was coded using the Office of Population Censuses
and Surveys (1990) classification of occupations Retired participants participants who
were currently unemployed and those describing themselves as househusbands
housewives were coded by their previous occupations Those who had never worked
were coded as 5 (ie unskilled)
The percentage of participants in the occupational categories of professional (1)
intermediate (2) skilled (3) semi-skilled (4) and unskilled (5) was 12 42 30 6 and 10
respectively The corresponding percentage for each category in the general adultpopulation census is 7 32 42 14 and 5 respectively Thus whilst there is a broad
range of occupational backgrounds in the present sample there is a slight over-
representation of professional occupations and a slight under-representation of skilled
and semi-skilled occupations The percentage of participants in each of four age bands
(18ndash29 30ndash44 45ndash59 60+) was 23 33 28 and 16 The corresponding percentage for
each age band in the general adult population census is 27 25 22 and 26 respectively
249Evaluation of PANAS
Again it can be seen that there is a broad spread although there is a relative under-
representation of individuals in the oldest age group
MaterialsEach potential participant received an introductory letter a PANAS form and a form for
recording demographic variables In addition the majority of participants also received
and completed self-report measures of depression and anxiety the Depression Anxiety
and Stress Scales (DASS N = 740) and the Hospital Anxiety and Depression Scale
(HADS N = 989) Neither of these subgroups differed significantly from the overall
sample with respect to age or gender Participants sealed the completed forms inenvelopes that were either collected by the researcher or returned by mail The refusal
rate was approximately 19
The Positive and Negative Affect Schedule (PANAS)
The PANAS (Watson et al 1988b) consists of two 10-item mood scales and was
developed to provide brief measures of PA and NA The items were derived from a
principal components analysis of Zevon and Tellegenrsquos (1982) mood checklist it was
argued that this checklist broadly tapped the affective lexicon Respondents are askedto rate the extent to which they have experienced each particular emotion within a
specified time period with reference to a 5-point scale The scale point are 1 lsquovery
slightly or not at allrsquo 2 lsquoa littlersquo 3 lsquomoderatelyrsquo 4 lsquoquite a bitrsquo and 5 lsquovery muchrsquo A
number of different time-frames have been used with the PANAS but in the current
study the time-frame adopted was lsquoduring the past weekrsquo
The Depression Anxiety and Stress Scales (DASS)
The DASS (Lovibond amp Lovibond 1995) consists of three 14-item self-report scales thatmeasure depression anxiety and stress The DASS was developed to quantify these
disorders in both normal and clinical populations Items are rated on a 4-point scale
using a time-frame of lsquoover the past weekrsquo
The Hospital Anxiety and Depression Scale (HADS)
The HADS was developed by Zigmond and Snaith (1983) to provide a brief means of
identifying and measuring severity of depression and anxiety in non-psychiatric clinical
environments It consists of 14 items seven of which measure depression and theother seven anxiety The items comprising the depression scale are predominantly
based on the anhedonic state so should be particularly related to PA
Statistical analysisBasic statistical analyses were conducted using SPSS Version 8 Confidence limits on
Cronbachrsquos a were derived from Feldtrsquos (1965) formula CFA (robust maximum
likelihood) was performed on the variancendashcovariance matrix of the PANAS items usingEQS for Windows Version 54 (Bentler 1995) The fit of CFA models was assessed using
the Satorra-Bentler scaled w2 statistic (S-Bw2) the robust comparative fit index (RCFI)
the standardized root mean squared residual (SRMR) and the root mean squared error of
approximation (RMSEA Steiger 2000) Hu and Bentler (1998 1999) demonstrated
using Monte Carlo analyses that the combination of the SRMR and RMSEA minimizes
the rejection of well fitting models yet possesses optimal sensitivity to model
250 John R Crawford and Julie D Henry
misspecification For the SRMR a cut-off value close to 08 or below is recommended
whilst for the RMSEA a cut-off of lt 06 is recommended (Hu amp Bentler 1999)
It is possible to directly test whether more constrained models have significantlypoorer fit than less constrained models this feature of CFA is one of its major
advantages over EFA In the present case there is a slight complication because the
Satorra-Bentler w2 statistic (S-Bw2) is used as an index of fit rather than the standard w2
statistic (the Satorra-Bentler statistic is recommended when the raw data are skewed)
The difference between S-Bw2 for nested models is typically not distributed as w2
(Satorra 2000) However Satorra and Bentler (2001) recently developed a scaled-
difference w2 test statistic that can be used to compare S-Bw2 from nested models This
statistic is used in the present study1
Parameterization of competing models of the PANAS
The first model (Model 1a) to be evaluated was a single-factor model this model
expressed the hypothesis that the variance in the PANAS can be partitioned into onegeneral factor plus error variance associated with each individual item (error variance
here refers to the combination of true variance in the item that is independent of the
factor plus random error) It is standard practice to test the fit of a one-factor model
because it is the most parsimonious of all possible models However in the case of the
PANAS this model can also be seen as an expression of an intuitive hypothesis that the
PANAS items measure opposite ends of a single dimension rather than two independent
dimensions ie the model captures the view that being lsquoexcitedrsquo or lsquoenthusiasticrsquo is
incompatible with being lsquohostilersquo or lsquoupsetrsquoA further model was tested (Model 1b) in which again all items were presumed to
load upon only one general factor However PANAS items were drawn from Zevon and
Tellegenrsquos (1982) mood checklist in which items are grouped into various categories
based on content In Model 1b items from the same content categories were permitted
to covary These content categories are presented in brackets after the items they
represent for PA attentive interested and alert (attentive) enthusiastic excited and
inspired (excited) proud and determined (proud) and strong and active (strong) and
for NA distressed upset (distressed) hostile irritable (angry) scared afraid (fearful)ashamed guilty (guilty) and nervous jittery (jittery)
Models 2andash2e expressed variants on the hypothesis that the PANAS measures two
factors NA and PA Model 2a represented the test authorsrsquo original conception of the
dimensionality of the PANAS in that the ten PA items were indicators of a PA factor and
the ten NA items were indicators of a NA factor These two factors were constrained to
be orthogonal reflecting the original hypothesis (Watson amp Clark 1997) that lsquovariations
in positive and negative mood are largely independent of one anotherrsquo (p270) Model
2b was identical to 2a except that the factors were allowed to correlate This modelreflects prior empirical evidence that NA and PA are moderately negatively correlated
but posit that the overlap is not complete Models 2c and 2d were identical to 2a and
2b respectively except that correlated error was permitted in accordance with the
content categories from Zevon and Tellegenrsquos (1982) mood checklist For Model 2e
Model 2d was re-tested but with lsquoexcitedrsquo permitted to cross-load upon NA as well as
PA as Mackinnon et al (1999) found that making this adjustment led to a significant
improvement in fit
1 A computer program for PCs (sbdiffexe) that carries out this test is available It can be downloaded from the following webpage httpwwwabdnacuk~psy086deptsbdiffhtm
251Evaluation of PANAS
Model 3a represented the hierarchical model reported by Mehrabian (1998) NA was
conceptualized as a second-order factor consisting of two distinct first-order factors
afraid and upset The former comprised six items (scared nervous afraid guiltyashamed jittery) and the latter comprised four (distressed irritable hostile upset)
Technical difficulties were encountered when attempting to fit this model (empirical
under-identification) that prevented a direct test of the hierarchical model However
nested factor models were constructed which although not mathematically equivalent
can be interpreted analogously Instead of specifying higher order factors first-order
factors were constructed which possessed varying degrees of generality Thus although
all ten indicators of subjective distress loaded on a general NA factor six also loaded on
a more specific lsquoafraidrsquo factor and the remaining four on a specific lsquoupsetrsquo factor Twonested models were tested in each of which the two specific factors upset and afraid
were allowed to interrelate The models were identical except that Model 3a did not
permit the NA and PA factors to correlate whereas Model 3b did
Results
Testing competing confirmatory factor analytic models of the PANASThe fit statistics for the CFA models are presented in Table 1 It can be seen that the
general factor model (Model 1a) had very poor fit the modelrsquos w2 SRMR and RMSEA arelarge and the RCFI low Allowing correlated error between items derived from the same
content categories in Zevon and Tellegenrsquos (1982) mood checklist resulted in an
improvement but Model 1b also had extremely poor fit
Model 2a expressed the original hypothesis that the PANAS measures two
independent factors PA and NA The fit of this model is also very poor Similar results
Table 1 Fit indices for CFA models of the PANAS (best fitting model in bold)
Model S-Bw2 w2 df RCFI SRMR RMSEA
1a Single factor 26128 41027 170 055 160 1521b Single factor correlatederrors (CE) permitted
12983 18632 157 079 140 104
2a Positive affect (PA) and negativeeffect (NA) as independent factors
11321 15899 170 082 103 091
2b PA and NA as correlated factors 10899 15310 169 083 066 0902c PA and NA as independent factorsCE permitted
5560 7542 157 093 096 062
2d PA and NA as correlated factorsCE permitted
5083 6898 156 094 052 058
2e PA and NA as correlated factors CEpermitted lsquoexcitedrsquo cross-loading
4919 6702 155 094 050 058
3a Mehrabianrsquos nested factors NA andPA as independent factors
7381 9862 159 089 097 072
3b Mehrabianrsquos nested factors NA andPA as correlated factors
6853 9321 158 090 052 070
Note The Satorra-Bentler scaled w2 statistic (S-Bw2) was used to evaluate model fit However thenormal w2 is also required when testing for a difference between the S-Bw2 statistic obtained fromnested models hence we present both statistics in this Table
252 John R Crawford and Julie D Henry
were obtained for Model 2b in which PA and NA were permitted to correlate Models
2c and 2d were counterparts of Models 2a and 2b respectively and differed only in that
the models were parameterized to allow for the association (ie correlated error)predicted by Zevon and Tellegenrsquos (1982) mood checklist
Model permitting these correlated errors possessed markedly superior fit compared
with their more constrained counterparts As noted inferential statistics can be applied
in order to compare nested models Models 2a and 2b are nested within 2c and 2d
respectively in that they differ only by the imposition of the constraint that correlated
errors are not permitted The results from w2 difference tests used to compare these
nested models are presented in Table 2
It can be seen that the models allowing correlated error had a significantly better fit
(p lt 001) than their more constrained counterparts The fit of the correlated factors
models (Models 2b and 2d) are also significantly better than their independent factor
counterparts (Models 2a and 2c respectively) Thus the dimensions of PA and NA are
contrary to the test authorrsquos intentions at least moderately interdependent (r = 730p lt 001) It should be noted that the correlation between the NA and PA factors is
higher than the correlation of 724 (p lt 001) between the NA and PA scales This is
because the NA and PA factors in the CFA models are estimated without error whereas
the correlation between the scales is attenuated by measurement error and the unique
variance associated with each item
Although it may initially appear that the general factor models are very different from
the correlated factors models they are also nested within these models Models 2b and
2d can be rendered equivalent to their single-factor model counterparts simply byconstraining the correlation between factors to unity (ie r = 10) The w2 difference
tests comparing Model 1a with 2b and 1b with 2d were both highly significant thereby
demonstrating that it is untenable to view the PANAS as measuring only a single
dimension
Model 2d was associated with the optimal fit The RCFI of 94 falls just short of Hu
and Bentlerrsquos (1999) criterion whilst the RMSEA (058) and SRMR (052) indicate a
good fit Moreover Model 2d had a w2 value that although statistically significant was
relatively small (When dealing with large sample sizes and a moderate number of itemsByrne (1994) has pointed out that it is unusual to obtain non-significant w2 values for
CFA models of self-report data)
Model 2e was identical to Model 2d but additionally permitted lsquoexcitedrsquo to cross-load
upon NA As in Mackinnon et alrsquos (1999) study this loading was not large (the loadings
were 24 and 14 respectively) and thus this cross-loading was not retained in the
optimal model Moreover it is important to note that this cross-correlation could not
Table 2 Results of testing for differences between nested CFA models of the PANAS
Comparison D statistics
More constrained Less constrained D S-Bw2 df p
Model 1a Model 1b 6994 13 lt001Model 2a Model 2b 437 1 lt001Model 2c Model 2d 510 1 lt001Model 2a Model 2c 4214 13 lt001Model 2b Model 2d 4256 13 lt001
253Evaluation of PANAS
account for the correlation between PA and NA in Model 2e the correlation between
these factors was the same as in Model 2d (730)
A schematic representation of the standardized solution for Model 2d is presented asFig 1 By convention latent factors are represented by large ovals or circles errors as
smaller ovals or circles (as they are also latent variables) and manifest (ie observed)
variables as rectangles or squares Single-headed arrows connecting the variables
represent a causal path double-headed arrows represent covariance or correlation
between variables but do not imply causality
It should be noted that there are some authorities on structural equation modelling
that consider permitting correlated error terms for subgroups of items from the same
measurement instrument to be inappropriate However we considered that for the
PANAS these correlated errors were appropriate because (a) they were specified a
priori on the basis of theory and prior empirical findings (b) with 20 items there are
180 potential correlated errors yet we only permit 13 thus the model is far from being
Figure 1 Graphical representation of the correlated two-factor model of the PANAS (Model 2d) the
factor loadings are standardized loadings
254 John R Crawford and Julie D Henry
fully saturated and (c) it can be seen that the correlations between items especially on
the NA scale are moderate in magnitude (see Fig 1) Thus we have chosen to retain
these correlated errors Moreover when we randomly split the sample into two forboth subgroups Model 2d was associated with the optimal fit The associated RCFIs
SRMR and RMSEA ranged from 932 to 937 053 to 060 and 059 to 063 respectively
It is also important to note that the introduction of correlated residuals did not
substantially alter the values of factor loadings or the correlation between NA and PA
Mehrabianrsquos (1998) three-factor model in both its independent factors (Model 3a)
and correlated factors form (Model 3b) had a lower RCFI and a higher w2 and RMSEA
than Model 2d did The problems with these models were particularly apparent when
the item loadings were examined In Model 3b for example 12 of the factor loadingswere below 5 all but one of which concerned items derived from the NA scale
Moreover 6 of the 10 items loaded higher on the NA dimension than the relevant
second-order factor
Influence of demographic variables on PANAS scores and measurement invarianceIndependent samples t-tests revealed that females obtained significantly higher scores
than males on the NA scale (t (1001) = 402 p lt 001) but that males obtainedsignificantly higher scores than females on the PA scale (t (1001) = 300 p = 003)
To examine the influence of the remaining demographic variables on the PA scale
three hierarchical regression analyses were performed for each of the demographic
predictor variables (age years of education and occupational code) In each of these
the demographic variable (eg age) was entered into the regression model with
subsequent entry of polynomial functions of the relevant predictor variable (eg age2
followed by age3) These analyses were then repeated for the NA scale For all three
demographic variables on both PANAS scales polynomial functions did notsignificantly increase the variance predicted Therefore there is no evidence of non-
linear components in the relationships between demographic variables and PANAS
scores and these relationships can validly be expressed as correlation coefficients The
correlations between demographic variables and PANAS scores are presented in Table
3 The pointndashbiserial correlation between gender and PANAS scores are also presented
in this table as an index of effect size (males were coded as 0 females as 1 therefore a
positive correlation represents higher scores in females)
It is possible that interactions between the demographic variables would explain
variance in PANAS scores To investigate this hierarchical regression was performed in
which the four demographic variables were entered as a first block followed by the six
Table 3 Correlations between demographic variables and PANAS scores
PANAS Scale
Demographic variable PA NA
Age 05 715Occupational code 711 705Years of education 09 08Gender 709 13
Significant at the 01 level (two-tailed)
255Evaluation of PANAS
variables that coded their two-way interactions (to code interactions the variables are
multiplied by each other) The change in R2 was not significant when these latter
variables were added (F = 190 p = 008 for PA F = 064 p = 070 for NA)The above analyses were conducted on the observed variables (ie PA and NA total
scores) It is also important to examine whether instruments possess measurement and
factorial invariance across demographic subgroupings (Byrne 1989 Hoyle amp Smith
1994) This was tested by performing median splits to form three sets of two subgroups
namely younger participants (lt43 years N = 507) versus older (43 years N = 507)
low (lt14 years N = 507) versus high (14 years N = 489) years of education and
female (N = 537) versus male (N = 466) Simultaneous (ie multi-group) confirmatory
factor analyses were then performed to test whether releasing equality constraints onparameters across subgroups led to a significant improvement in model fit (the standard
maximum likelihood method was used for these analyses as the robust method for
multi-group CFA has not yet been implemented in EQS)
Preliminary analyses revealed that the optimal model (Model 2d) had the best fit in
each of the three sets of two subgroups Byrne (1989) notes that testing for equivalence
of error covariances is considered to be overly stringent and therefore analysis was
restricted to testing whether the factor loadings were equivalent across groups (ie
testing for measurement invariance) followed by testing for factorial invariance (ietesting whether the covariance between PA and NA was equivalent across groups) The
results of testing for measurement invariance revealed that the PANAS possessed full
measurement invariance across the two age groups but that for education the loading
for item 5 (lsquostrongrsquo) on the PA factor was not invariant ie releasing the equality
constraint on this loading improved model fit (w2 = 506 p = 024 nor was item 13
(lsquoashamedrsquo) invariant across gender (a2 = 465 p = 031)
These results suggest that the PANAS possesses what Byrne (1989 1994) has termed
partial measurement invariance However only one equality constraint in each of thesetwo analyses was significant and if a Bonferroni correction were applied to the p values
for these items (to control for the fact that three separate multi-group analyses had been
run) neither would remain significant Therefore to all intents and purposes the
PANAS can be regarded as possessing measurement invariance
To test for factorial invariance the models were re-run with the removal of the
equality constraints on item 5 in the age analysis and item 13 in the gender analysis
Imposing equality constraints on the covariance between PA and NA did not lead to a
significant deterioration in model fit for the age or education analyses However thisequality constraint did lead to a deterioration in fit for gender (w2 = 595 p = 015) this
result would still be significant after a Bonferroni correction although only marginally
The covariance between PA and NA was significantly greater for males than for females
(r between PA and NA = 731 for males and 724 for females)
Summary statistics and normative data for the PANASThe means medians SDs and ranges for the PA and NA scales are presented in Table 4for the total sample and for males and females and females separately
A Kolmogorov-Smirnov test confirmed the impression from visual inspection of the
distribution of scores that the NA scale was not normally distributed (because of high
positive skew) Z = 5196 p lt 001) The PA scale also had a slight positive skew the
Kolmogorov-Smirnov test just failed to attain significance at the 5 level (Z = 172
p = 05) Given the positive skew particularly for the NA scale use of the raw score
256 John R Crawford and Julie D Henry
means and SDs from a normative sample cannot be used to estimate the rarity of an
individualrsquos score Therefore Table 5 was constructed for conversion of raw scores on
the PA and NA scales to percentiles
Reliabilities of the PANASThe reliabilities (internal consistencies) of the PANAS PA and NA scales were estimated
using Crobachrsquos a Cronbachrsquos a was 89 (95 CI = 88ndash90) for the PA scale and 85
(95 CI = 84ndash87) for the NA scale
Relationship with measures of anxiety and depressionThe correlations of the PA and NA scales with each of the anxiety and depression scalesare presented in Table 6 and reveal that as predicted PA is more strongly negatively
related to depression than to anxiety for both the DASS and the HADS
However all correlations in Table 6 are highly significant (p lt 01) primarily as a
consequence of the large sample size conferring high statistical power Therefore
Williamsrsquo (1959) test was used to enable quantitative comparisons between
correlations This revealed that for both measures the correlation between PA and
depression was significantly higher than that between PA and anxiety (DASS t
(986) = 7523 p lt 001 HADS t (737) = 7667 p lt 001)Two hierarchical regression analyses were also performed to examine the extent to
which depression variance in the DASS could be explained by PA and NA In order to
examine the ability of the measures to explain variance unique to depression shared
variance was partialled out by entering DASS anxiety scores as the first predictors in the
regression models This was then followed by entry of either PA (Model A) or NA
(Model B) The results are presented in Table 7 and indicate that both PA and NA were
significant predictors of variance unique to depression However PA accounted for
nearly twice as much unique variance as NA (83 compared with 47) Steigerrsquos(1980) test revealed that the proportion explained by PA was significantly greater than
that explained by NA (z = 220 p = 028) This procedure was then repeated for the
HADS the results of which are also presented in Table 7 (Model C corresponds to entry
of PA Model D to entry of NA) Again both PA and NA were significant predictors of
variance unique to depression However the difference in proportion of variance
accounted for was even more substantial than for the DASS PA accounted for 147
Table 4 Summary statistics for the PANAS for the total sample and males and females separately
Median Mean SD Range
Total Sample (N = 1003)PA 32 3131 765 10ndash50NA 14 1600 590 10ndash42
Females (N = 537)PA 31 3062 789 10ndash50NA 15 1668 637 10ndash42
Males (N = 466)PA 32 3206 731 10ndash48NA 14 1520 523 10ndash42
257Evaluation of PANAS
Table 5 Raw scores on the PANAS converted to percentiles
Raw score PA percentile NA percentile
10 1 1211 1 1812 1 2813 1 3814 2 4715 2 5516 3 6317 3 6918 5 7419 7 7820 8 8121 10 8422 13 8623 15 8824 18 9025 21 9126 24 9227 28 9328 32 9429 36 9530 41 9631 46 9732 52 9733 57 9834 62 9835 67 9936 72 gt9937 77 gt9938 81 gt9939 85 gt9940 88 gt9941 90 gt9942 92 gt9943 94 gt9944 95 gt9945 97 gt9946 98 gt9947 99 gt9948 gt99 gt9949 gt99 gt9950 gt99 gt99
Note In most clinical contexts the concern will be whether NA scores are unusually high (ie thepercentile is towards the top end of the scale) and whether PA scores are unusually low (ie thepercentile is towards the lower end of the scale)
258 John R Crawford and Julie D Henry
NA only 24 This difference was highly significant (z = 626 p lt 001) using Steigerrsquos
(1980) test
Discussion
Competing models of the structure of the PANASThe use of CFA to test competing models of the latent structure of the PANAS yielded
results that help resolve some of the inconsistencies in the previous EFA and CFA
literature From the fit statistics in Table 1 it is clear that the hypothesis that the PANAS
measures a single factor (Models 1a and 1b) is untenable Model 2a an orthogonal two-
factor model represented a poor though significantly better fit than either of the twoforegoing models This model encapsulated the test authorsrsquo original hypothesis that
the PANAS measures two independent factors PA and NA However allowing PA and
NA to covary (Model 2b) significantly improved the fit of the model revealing that PA
and NA as measured by the PANAS are at least moderately interdependent
Model 2c was identical to Model 2a but additionally permitted correlated error in
accordance with Zevon and Tellegenrsquos (1982) mood checklist This was associated with
Table 6 Correlations between PA and NA with depression anxiety and stress
Measure DASS depression HADS depression DASS anxiety HADS anxiety DASS stress
PA 748 752 730 731 731NA 60 44 60 65 67
Note All correlations significant at the 01 level (two-tailed)
Table 7 Hierarchical multiple regressions to examine the extent to which variance in depression
scores can be explained by PA and NA
Criterion Predictor R R2 change p value for R2 change
Model A(DASS depression)Step 1 DASS anxiety 706 499 lt001Step 2 PA 763 083 lt001
Model B(DASS depression)Step 1 DASS anxiety 706 499 lt001Step 2 NA 739 047 lt001
Model C(HADS depression)Step 1 HADS anxiety 500 250 lt001Step 2 PA 630 147 lt001
Model D(HADS depression)Step 1 HADS anxiety 500 250 lt001Step 2 NA 523 024 lt001
259Evaluation of PANAS
a significantly better fit than Model 2a However Model 2d which specified correlated
NA and PA factors and allowed correlated error represented the optimal fit and a
significantly better fit than Model 2c (p lt 001) Two versions of Mehrabianrsquos (1998)model were tested one in which PA and NA were restricted to orthogonality (Model
3a) and one in which they were permitted to correlate (Model 3b) Both solutions were
poorer fits than Model 2d with respect to the RCFI RMSEA and w2 Moreover the
pattern of factor loadings suggested that the hierarchical structures specified were
inappropriate
The conclusion from the CFA modelling is therefore that the PANAS NA and PA
scales index two distinct but moderately negatively correlated factors Opinions are
liable to vary with regard to the extent to which the presence of a negative correlationbetween the PA and NA factors compromises the validity of the PANAS scale andor the
validity of the constructs it was designed to assess Watson et al (1988b) have argued
that the failure to find independent factors of PA and NA in previous research should be
attributed to the inadequacies of the instruments employed rather than because the
underlying theoretical constructs are not orthogonal Great care was taken in the
selection of items for the PANAS in an attempt to devise a scale that would measure
these putatively independent constructs As the present results demonstrate that PA
and NA are negatively correlated even when using an instrument specifically developedto yield independent scales this seriously questions whether these constructs are in
fact independent
However the present results do indicate that PA and NA are relatively independent
and this is consistent with the results of EFA and CFA analyses that found PA and NA to
be largely independent dimensions (Tellegen et al 1999) In the present study the
percentage of shared variance between the PA and NA latent factors is only 90 (ie
7302) the percentage of shared variance between the observed scales (58) is even
more modest Some may even regard the relatively modest amount of shared variationbetween these factors as partly vindicating Watson et alrsquos (1988b) position given that
intuition would suggest that these factors should be highly negatively correlated (Costa
amp McCrae 1980) Feeling lsquoenthusiasticrsquo and lsquoinspiredrsquo for instance should be
incompatible with simultaneously feeling lsquoupsetrsquo or lsquodistressedrsquo
Finally as noted previously Tellegen et al (1999) found a structure that is very
consistent with the one identified in the present article but additionally included a
third-order dimension of happiness-versus-unhappiness We did not incorporate this
general factor in our own structure because none of the items found to load highly onthe positive and negative poles of the third-order happiness-versus-unhappiness
dimension (at ease happy and joyful for happy blameworthy discouraged sad
and downhearted for unhappy) are included in the standard version of the PANAs we
employed However future research should attempt to assess whether these same
markers of this construct emerge across different samples
Influence of demographic variablesThe results of hierarchical regression analyses demonstrated that significant non-linear
components were absent in the relationships between demographic variables and the
PANAS (and also that interactions between the demographic variables did not account
for variance in PANAS scores) Moreover although six out of the eight linear
relationships were significant the effect sizes were very modest The variance
explained ranged from 020 (age and PA) to 225 (age and NA) Thus for practical
260 John R Crawford and Julie D Henry
purposes the influence of gender occupation education and age on PANAS scores can
be ignored the significant effects result from the high statistical power conferred by a
large sample size This simplifies clinical use of the PANAS scores as these variables(and their interactions) do not need to be taken into consideration when interpreting
an individualrsquos scores
Normative dataTo date the PANAS has been used primarily as a research took in group studies
However the instrument has the potential to be useful in clinical work with individuals
Prior to obtaining the present normative data interpretation of the PANAS in theindividual case relied on use of the means and SDs from a predominantly student
sample (Watson et al 1988b) The current study usefully complements this by
providing estimates of the degree of rarity of a given PANAS score in the general adult
population However although the present sample was large and broadly representa-
tive of the general adult population in terms of basic demographic characteristics it was
not obtained by random sampling (eg from the electoral roll or a related method) and
may therefore be subject to unforseen biases
In the present study the lsquopast weekrsquo time-frame was adopted because it is the onemost commonly used in clinical populations To our knowledge normative data derived
from non-clinical populations have not previously been provided for this time-frame
However Watson et al (1988b) reported mean scores for the closest available
comparison (lsquopast few daysrsquo) in their US student sample the PA mean was 333
(SD = 72) the NA mean 174 (SD = 62) This is broadly consistent with the results in
the present sample in which the mean for PA was 313 (SD = 77) and the mean for NA
was 160 (SD = 59)
The tabulation method in Table 5 was adopted to permit conversion of raw scores topercentiles for both PANAS scales using the same table Thus for example if a patientrsquo
raw score on the NA scale was 30 then Table 5 reveals that this corresponds to the 96th
percentile ie a score as high as this is estimated to be rare in the general adult
population A raw score of 17 on the PA scale corresponds to the 3rd percentile ie a
score as low as this is also rare in the general adult population
According to tripartite theory (eg Clark amp Watson 1991b) patients diagnosed as
either anxious or depressed will all experience high NA It is argued that what
differentiates depression from anxiety is the additional presence of low PA (ie loss ofinterest and loss of the ability to experience pleasure) The normative data presented
here should assist the clinician in interpreting the PANAS by providing estimates of the
degree of rarity or abnormality of a clientrsquos NA and PA scores
We suggest that the PANAS can be used as a supplement to measures of anxiety and
depression to examine the extent to which they provide convergent evidence For
example if a client obtains a high anxiety score but low to moderate depression score
the PANAS scores can be examined to see whether the patient scores high on NA (eg
95th percentile) combined with a PA score in the normal range or above (eg 20thpercentile) When a patient scores highly on both anxiety and depression then the
PANAS can be examined to determine whether this is accompanied by indications of
abnormally high NA (eg 95th percentile) and abnormally low PA (eg 5th
percentile)
The comparison of anxiety and depression scores with the PANAS may be best
achieved by using the Depression Anxiety and Stress Scales (DASS Lovibond amp
261Evaluation of PANAS
Lovibond 1995) Hospital Anxiety and Depression Scale (HADS Snaith amp Zigmond
1994 Zigmond amp Snaith 1983) or the Symptoms of Anxiety and Depression scale (sAD
Bedford amp Foulds 1978) Normative data are now available for all three scales in a formthat is equivalent to that presented here for the PANAS (Crawford amp Henry 2003
Crawford Henry Crombie amp Taylor 2001 Henry Crawford Bedford Crombie amp
Taylor 2002) that is they consist of percentile tables derived from large samples of the
general adult population It is therefore possible for a clinician to directly compare the
rarity of a patientrsquos PANAS scores with the rarity of their scores on these anxiety and
depression scales Such a comparison is likely to be more useful than comparing the
PANAS to categorical or dichotomous indices (such as whether or not a patient is above
a particular cut-off score for identifying caseness) derived from these or other anxietyand depression scales
ReliabilitiesThe reliabilities of the PANAS scales as measured by Cronbachrsquos a were 89 for PA and
85 for NA The narrowness of the confidence limits associated with these coefficients
indicate that they can be regarded as providing very accurate estimates of the internal
consistency of the PANAS in the general adult population Thus both PA and NA scalescan be viewed as possessing adequate reliability
Relationships with measures of anxiety and depressionCorrelational analyses were conducted in order to test the prediction of tripartite theory
that PA is more strongly related to depression than to anxiety (Watson Clark amp Carey
1988a) The results were supportive revealing that although all correlations were
significant for both the DASS and the HADS the correlation between PA and depressionwas significantly higher than that between PA and anxiety Regression analyses were
then conducted to examine how much variance unique to depression was explained
by NA and PA respectively For both the DASS and the HADS although PA and NA each
explained a significant proportion of variance unique to depression PA explained
significantly more These results are therefore broadly consistent with the tripartite
model indicating that PA is a significantly better predictor of variance unique to
depression than is NA Moreover the difference in the proportion of variance
accounted for was substantially larger for the HADS than the DASS This latter finding isprobably attributable to the greater emphasis that the HADS places upon the state of
anhedonia as tripartite theory regards PA and anhedonia as highly (negatively) related
(Clark amp Watson 1991a)
Conclusions and future research
To conclude the PANAS has been shown to possess adequate psychometric propertiesin a large sample drawn from the general adult population The results from CFA
modelling largely support the construct validity of the PANAS scales and the reliabilities
of both scales were adequate The norms presented are to our knowledge the only UK
norms currently available
Although the inconsistencies in the previous literature on the factor structure of the
PANAS could in part be attributed to differences in the methodology employed it may
262 John R Crawford and Julie D Henry
also be that the structure of the PANAS is not invariant across different populations
Hoyle and Smith (1994) and others (Byrne 1989) have observed that in psychology we
have often neglected the question of whether our instruments are factorially invariantInstead we have commonly simply assumed that they are measuring the same
constructs across different populations If for a particular instrument this assumption
is incorrect than comparing the scores of groups or individuals is lsquoa classic example of
comparing apples and orangesrsquo (Hoyle amp Smith 1994 p 433)
The present results suggest that the PANAS may not possess factorial invariance
across gender However we do not consider that this poses a serious threat to the
validity or utility of the PANAS given that (1) the PANAS exhibited measurement
invariance across gender (2) the test on the equivalence of the factor covariancesshowed them to be only marginally significant after a Bonferroni correction and (3) the
magnitude of the difference in covariancescorrelations between PA and NA was
modest However it would be very valuable to examine whether the PANAS possesses
measurement and factorial invariance across cultures and more importantly across
healthy and clinical populations
References
Bedford A amp Foulds G (1978) Delusionsndashsymptomsndashstates States of anxiety and depression
Windsor NFER-Nelson
Bentler P M (1995) EQS structural equations program manual Encino CA Multivariate
Software
Byrne B M (1989) Multigroup comparisons and the assumption of equivalent construct validity
across groups Methodological and substantive issues Multivariate Behavioural Research
24 503ndash523
Byrne B M (1994) Structural equation modeling with EQS and EQSWindows Thousand
Oaks CA Sage
Chen P Y Dai T Spector P E amp Jex S M (1997) Relation between negative affectivity and
positive affectivity Effects of judged desirability of scale items and respondentsrsquo social
desirability Journal of Personality Assessment 69 183ndash198
Clark L A amp Watson D (1991a) Theoretical and empirical issues in differentiating depression
from anxiety In J Becker amp A Kleinman (Eds) Psychosocial aspects of depression (pp 39ndash
65) Hillsdale NJ Erlbaum
Clark L A amp Watson D (1991b) Tripartite model of anxiety and depression Psychometric
evidence and taxonomic implications Journal of Abnormal Psychology 100 316ndash336
Cole D A (1987) Utility of confirmatory factor analysis in test validation research Journal of
Consulting and Clinical Psychology 55 584ndash594
Costa P T J amp McCrae R R (1980) Influence of extraversion and neuroticism on subjective
well-being Happy and unhappy people Journal of Personality and Social Psychology 38
688ndash678
Crawford J R amp Henry J D (2003) The Depression Anxiety Stress Scales (DASS) Normative
data and latent structure in a large non-clinical sample British Journal of Clinical Psychology
42 111ndash131
Crawford J R Henry J D Crombie C amp Taylor E P (2001) Normative data for the HADS
from a large non-clinical sample British Journal of Clinical Psychology 40 429ndash434
Crocker P R E (1997) A confirmatory factor analysis of the Positive and Negative Affect
Schedule (PANAS) with a youth sport sample Journal of Sport and Exercise Psychology 19
91ndash97
Dyck M J Jolly J B amp Kramer T (1994) An evaluation of positive affectivity negative
263Evaluation of PANAS
affectivity and hyperarousal as markers for assessing between syndrome relationships
Personality and Individual Differences 17 637ndash646
Feldman L A (1993) Distinguishing depression and anxiety in self-report Evidence from
confirmatory factor analysis on nonclinical and clinical samples Journal of Consulting and
Clinical Psychology 61 631ndash638
Feldt L S (1965) The approximate sampling distribution of Kuder-Richardson reliability
coefficient twenty Psychometrika 30 357ndash370
Gotlib I H (1984) Depression and general psychopathology in university students Journal of
Abnormal Psychology 93 19ndash30
Green D P Goldman S L amp Salovey P (1993) Measurement error masks bipolarity in affect
ratings Journal of Personality and Social Psychology 64 1029ndash1041
Henry J D Crawford J R Bedford A Crombie C amp Taylor E P (2002) The Personal
Disturbance Scale (sAD) Normative data and latent structure in a large non-clinical sample
Personality and Individual Differences 33 1343ndash1360
Hoyle R H amp Smith G T (1994) Formulating clinical research hypotheses as structural
equation models A conceptual overview Journal of Consulting and Clinical Psychology 62
429ndash440
Hu L amp Bentler P M (1998) Fit indices in covariance structure modeling Sensitivity to
underparmaterized model misspecification Psychological Methods 3 424ndash425
Hu L amp Bentler P M (1999) Cutoff criteria for fit indexes in covariance structure analysis
Conventional criteria versus new alternatives Structural Equation Modeling 6 1ndash55
Joiner T E J amp Blalock J A (1995) Gender differences in depression The role of anxiety and
generalized negative affect Sex Roles 33 91ndash108
Jolly J B Dyck M J Kramer T A amp Wherry J N (1994) Integration of positive and negative
affectivity and cognitive content specificity Improved discrimination of anxious and
depressive symptoms Journal of Abnormal Psychology 103 544ndash552
Kuiper N A McKee M Kazarian S S amp Olinger J L (2000) Social perceptions in psychiatric
inpatients Relation to positive and negative affect levels Personality and Individual
Differences 29 479ndash493
Lovibond S H amp Lovibond P F (1995) Manual for the Depression Anxiety Stress Scales
Sydney Psychology Foundation
Mackinnon A Jorm A F Christensen H Korten A E Jacomb P A amp Rodgers B (1999) A
short form of the Positive and Negative Affect Schedule Evaluation of factorial validity and
invariance across demographic variables in a community sample Personality and Individual
Differences 27 405ndash416
Mehrabian A (1998) Comparison of the PAD and PANAS as models for describing emotions and
for differentiating anxiety from depression Journal of Psychopathology and Behavioural
Assessment 19 331ndash357
Nezu A M Nezu C M amp Nezu V A (1986) Depression general distress and causal
attributions among university students Journal of Abnormal Psychology 95 184ndash186
Office of Population Censuses and Surveys (1990) Classification of occupations (1st ed Vol 2)
London Her Majestyrsquos Stationery Office
Roesch S C (1998) The factorial validity of trait positive affect scores Confirmatory factor
analyses of unidimensional and multidimensional models Educational and Psychological
Measurement 58 451ndash466
Russell J A amp Carroll J M (1999) On the bipolarity of positive and negative affect
Psychological Bulletin 125 3ndash30
Satorra A (2000) Scaled and adjusted restricted tests in multi-sample analysis of moment
structures In D D H Heijmans D S G Pollock amp A Satorra (Eds) Innovations in
multivariate statistical analysis (pp 233ndash247) Dordrecht Kluwer Academic
Satorra A amp Bentler P M (2001) A scaled difference chi-square test statistic for moment
structure analysis Psychometrika 66 507ndash514
264 John R Crawford and Julie D Henry
Snaith R P amp Zigmond A S (1994) HADS Hospital Anxiety and Depression Scale Windsor
NFER Nelson
Steiger J H (1980) Tests for comparing elements of a correlation matrix Psychological Bulletin
87 245ndash251
Steiger J H (2000) Point estimation hypothesis testing and interval estimation using the
RMSEA Some comments and a reply to Hayduk and Glaser Structural Equation Modeling 7
149ndash162
Tellegen A Watson D amp Clark L A (1999) On the dimensional and hierarchical structure of
affect Psychological Science 10 297ndash303
van Schuur W H amp Kiers H A L (1994) Why factor analysis often is the incorrect model for
analyzing bipolar concepts and what model to use instead Applied Psychological
Measurement 18 97ndash110
Watson D amp Clark L A (1984) Negative affectivity The disposition to experience aversive
emotional states Psychological Bulletin 96 465ndash490
Watson D amp Clark L A (1991) The Mood and Anxiety Symptom Questionnaire Iowa City
University of Iowa
Watson D amp Clark L A (1997) The measurement and mismeasurement of mood Recurrent
and emergent issues Journal of Personality Assessment 86 267ndash296
Watson D Clark L A amp Carey G (1988a) Positive and negative affectivity and their relation to
anxiety and depressive disorders Journal of Abnormal Psychology 97 346ndash353
Watson D Clark L A amp Tellegen A (1988b) Development and validation of brief measures of
positive and negative affect The PANAS Scales Journal of Personality and Social Psychology
47 1063ndash1070
Watson D Clark L A Weber K Assenheimer J S Strauss M E amp McCormick R A (1995a)
Testing a tripartite model II Exploring the symptom structure of anxiety and depression in
student adult and patient samples Journal of Abnormal Psychology 104 15ndash25
Watson D Weber K Assenheimer J S Clark L A Strauss M E amp McCormick R A (1995b)
Testing a tripartite model I Evaluating the convergent and discriminant validity of anxiety and
depression symptom scales Journal of Abnormal Psychology 104 3ndash14
Watson D Wiese D Vaidya J amp Tellegen A (1999) The two general activation systems of
affect Structural findings evolutionary considerations and psychobiological evidence Journal
of Personality and Social Psychology 76 820ndash838
Williams E J (1959) The comparison of regression variables Journal of the Royal Statistical
Society Series B 21 396ndash399
Zevon M A amp Tellegen A (1982) The structure of mood change An idiographicnomothetic
analysis Journal of Personality and Social Psychology 43 111ndash122
Zigmond A S amp Snaith R P (1983) The Hospital Anxiety and Depression Scale Acta
Psychiatrica Scandinavica 67 361ndash370
Received 30 April 2002 revised version received 10 March 2003
265Evaluation of PANAS
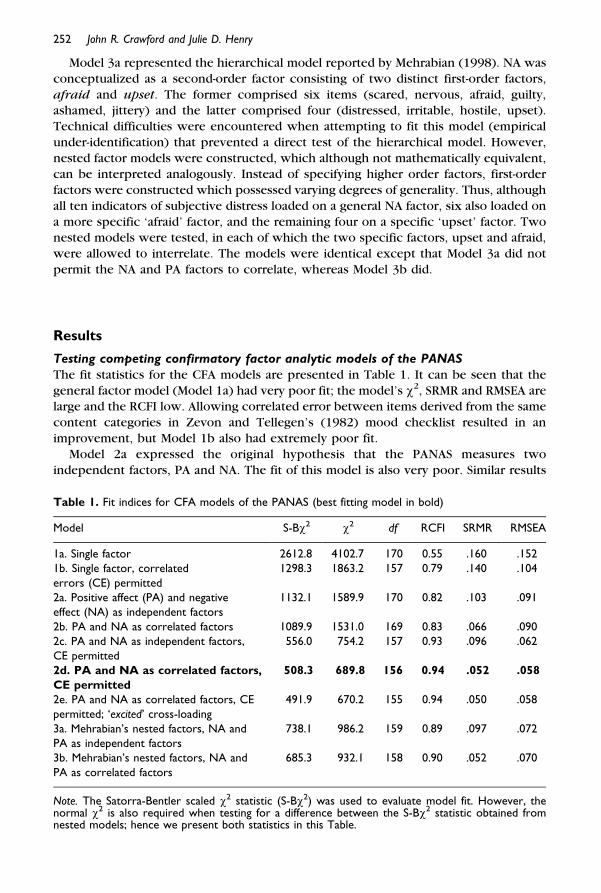
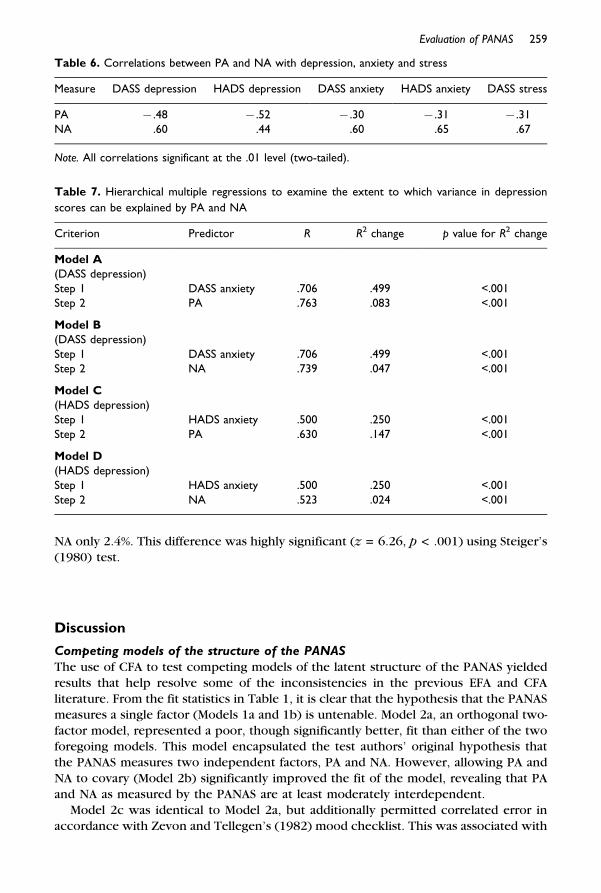
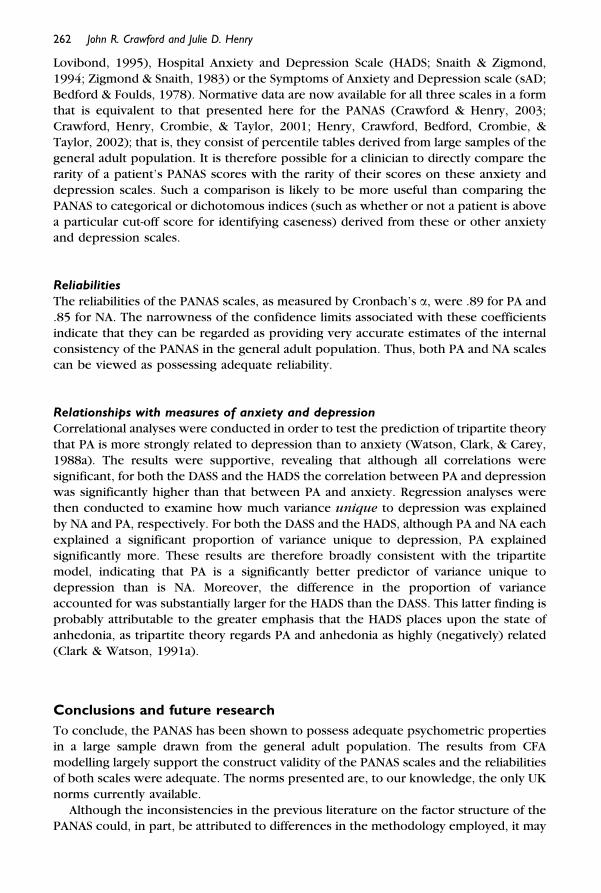


