
The Opioid Epidemic and Medicaid’s Role in Treatment: A Look at Changes Over Time

Figure 2
• The US is facing an unprecedented opioid epidemic, which has resulted in increases health care services utilization and a surge in overdose deaths.
• Medicaid plays an important role in addressing the epidemic, covering 3 in 10 people with opioid addiction in 2015.
• However, the proposed changes to Medicaid as proposed in Better Care Reconciliation Act could set back states’ efforts to address the epidemic.

Figure 3
SOURCE: Center for Behavioral Health Statistics and Quality, Substance Abuse and Mental Health Services Administration, Results from the 2005 National Survey on Drug Use and Health. Center for Behavioral Health Statistics and Quality, Substance Abuse and Mental Health Services Administration, Results from the 2010 National Survey on Drug Use and Health: Summary of National Findings. Center for Behavioral Health Statistics and Quality, Substance Abuse and Mental Health Services AdministrationResults from the 2015 National Survey on Drug Use and Health: Detailed Tables
From 2005 to 2015, the number of people with heroin and prescription opioid addiction increased substantially.
227k
1.5M
359k
1.9M
591k
2M
Heroin Prescription Opioid
2005 2010 2015
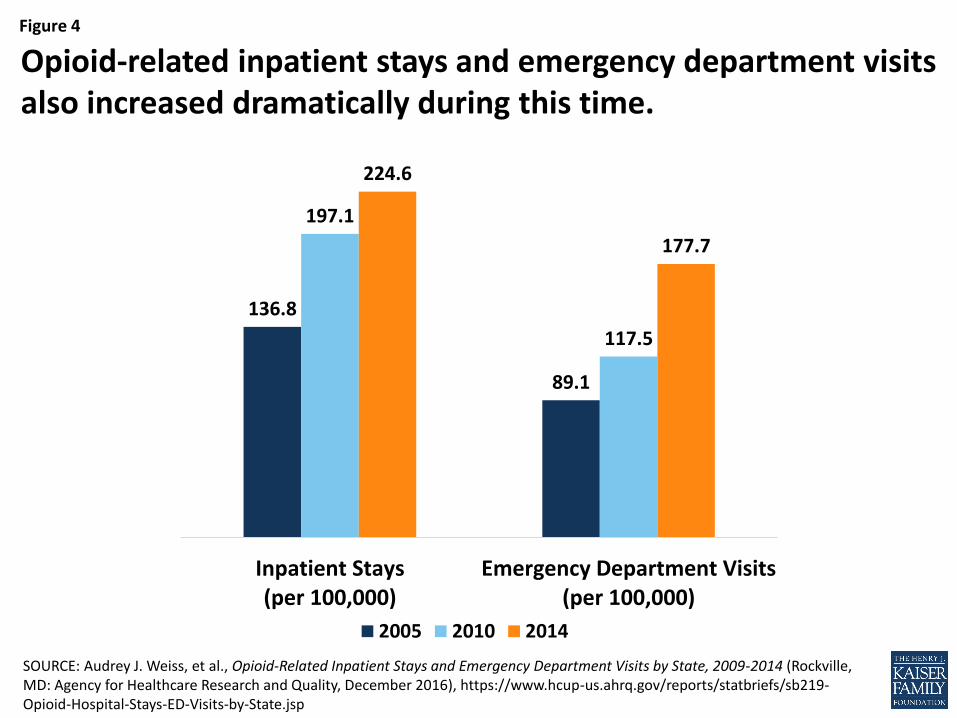
Figure 4
SOURCE: Audrey J. Weiss, et al., Opioid-Related Inpatient Stays and Emergency Department Visits by State, 2009-2014 (Rockville, MD: Agency for Healthcare Research and Quality, December 2016), https://www.hcup-us.ahrq.gov/reports/statbriefs/sb219-Opioid-Hospital-Stays-ED-Visits-by-State.jsp
Opioid-related inpatient stays and emergency department visits also increased dramatically during this time.
136.8
89.1
197.1
117.5
224.6
177.7
Inpatient Stays(per 100,000)
Emergency Department Visits(per 100,000)
2005 2010 2014

Figure 5
SOURCE: Kaiser Family Foundation analysis of Centers for Disease Control and Prevention (CDC), National Center for Health Statistics. Multiple Cause of Death 1999-2015 on CDC WONDER Online Database
In 2005, about half of states had an opioid overdose death rate less than 5.0/100,000, and the states with the highest death rates were in the southwest.
WY
WI
WV
WA
VA
VT
UT
TX
TN
SD
SC
RI
PA
OR
OK
OH
ND
NC
NY
NM
NJ
NH
NVNE
MT
MO
MS
MN
MI
MA
MD
ME
LA
KYKS
IA
INIL
ID
HI
GA
FL
DC
DE
CT
COCA
ARAZ
AK
AL
5.1-10.0
1.0-5.0
10.1-15.0
Deaths per 100,000

Figure 6
By 2010, the majority of states had death rates exceeding 5.0/100,000, and the death rate in two states exceeded 15.0/100,000.
WY
WI
WV
WA
VA
VT
UT
TX
TN
SD
SC
RI
PA
OR
OK
OH
ND
NC
NY
NM
NJ
NH
NVNE
MT
MO
MS
MN
MI
MA
MD
ME
LA
KYKS
IA
INIL
ID
HI
GA
FL
DC
DE
CT
COCA
ARAZ
AK
AL
15.1+
SOURCE: Kaiser Family Foundation analysis of Centers for Disease Control and Prevention (CDC), National Center for Health Statistics. Multiple Cause of Death 1999-2015 on CDC WONDER Online Database
5.1-10.0
1.0-5.0
10.1-15.0
Deaths per 100,000

Figure 7
In 2015, nearly a quarter of states had death rates exceeding 15.0/100,000, most of which were in Appalachia and New England.
WY
WI
WV
WA
VA
VT
UT
TX
TN
SD
SC
RI
PA
OR
OK
OH
ND
NC
NY
NM
NJ
NH
NVNE
MT
MO
MS
MN
MI
MA
MD
ME
LA
KYKS
IA
INIL
ID
HI
GA
FL
DC
DE
CT
COCA
ARAZ
AK
AL
SOURCE: Kaiser Family Foundation analysis of Centers for Disease Control and Prevention (CDC), National Center for Health Statistics. Multiple Cause of Death 1999-2015 on CDC WONDER Online Database
15.1+
5.1-10.0
1.0-5.0
10.1-15.0
Deaths per 100,000

Figure 8
Between 2005 and 2015, the increases in the opioid overdose death rate were particularly prominent in CT, DE, MS, NH, NY, OH, and WV.
WY
WI
WV
WA
VA
VT
UT
TX
TN
SD
SC
RI
PA
OR
OK
OH
ND
NC
NY
NM
NJ
NH
NVNE
MT
MO
MS
MN
MI
MA
MD
ME
LA
KYKS
IA
INIL
ID
HI
GA
FL
DC
DE
CT
COCA
ARAZ
AK
AL50-149%
<50%
150-249%
≥250%
Percent Increase in Death Rate
SOURCE: Kaiser Family Foundation analysis of Centers for Disease Control and Prevention (CDC), National Center for Health Statistics. Multiple Cause of Death 1999-2015 on CDC WONDER Online Database

Figure 9
Medicaid covered 3 in 10 nonelderly adults with opioid addiction in 2015, nearly double the share covered in 2005. This increase was largely due to the ACA’s Medicaid expansion.
SOURCE: Kaiser Family Foundation Analysis of 2015 National Survey on Drug Use and Health
17%23%
30%
42%37%
40%
8% 8%
10%
33% 32%20%
2005(1.4 million)
2010(1.9 million)
2015(2.3 million)
Uninsured
Other
Private
Medicaid

Figure 10
Medicaid coverage of nonelderly adults receiving outpatient treatment for opioid addiction grew from 27% in 2005 to 39% in 2015.
27% 31%39%
34% 28%
36%6% 12%
10%34% 30%
15%
2005(191,000)
2010(380,000)
2015(581,000)
Uninsured
Other
Private
Medicaid
SOURCE: Kaiser Family Foundation Analysis of 2015 National Survey on Drug Use and Health

Figure 11
The share of nonelderly adults receiving inpatient treatment for opioid addiction who were covered by Medicaid doubled from 2005 to 2015.
26% 31%
52%
23%21%
20%
4%
18%
14%48%
30%
14%
2005(146,000)
2010(274,000)
2015(299,000)
Uninsured
Other
Private
Medicaid
SOURCE: Kaiser Family Foundation Analysis of 2015 National Survey on Drug Use and Health

Figure 12
• The BCRA includes 3 big changes to Medicaid that could impact states’ ability to address the opioid epidemic:
– The enhanced federal financing for the Medicaid expansion population will be phased out.
– Medicaid will be converted to a per capita cap allotment, limiting available funds to states.
– Medicaid expansion plans will no longer be required to cover addiction treatment services, limiting enrollees’ access to care.
• Although the BCRA allots $44.7 billion in grants over 9 years to provide addiction treatment, Medicaid spending on treatment is much higher.
• Medicaid also facilitates access to other medical and behavioral health preventative and treatment services not covered by these grants.


