The Operational Use of QuikSCAT Ocean Surface Vector Winds at theNational Hurricane Center
MICHAEL J. BRENNAN
NOAA/NWS/NCEP/National Hurricane Center, Miami, Florida
CHRISTOPHER C. HENNON
Department of Atmospheric Sciences, University of North Carolina at Asheville, Asheville, North Carolina
RICHARD D. KNABB
NOAA/NWS/NCEP/National Hurricane Center, Miami, Florida
(Manuscript received 18 July 2008, in final form 25 November 2008)
ABSTRACT
The utility and shortcomings of near-real-time ocean surface vector wind retrievals from the NASA Quick
Scatterometer (QuikSCAT) in operational forecast and analysis activities at the National Hurricane Center
(NHC) are described. The use of QuikSCAT data in tropical cyclone (TC) analysis and forecasting for center
location/identification, intensity (maximum sustained wind) estimation, and analysis of outer wind radii
is presented, along with shortcomings of the data due to the effects of rain contamination and wind direc-
tion uncertainties. Automated QuikSCAT solutions in TCs often fail to show a closed circulation, and those
that do are often biased to the southwest of the NHC best-track position. QuikSCAT winds show the
greatest skill in TC intensity estimation in moderate to strong tropical storms. In tropical depressions, a
positive bias in QuikSCAT winds is seen due to enhanced backscatter by rain, while in major hurricanes
rain attenuation, resolution, and signal saturation result in a large negative bias in QuikSCAT intensity
estimates.
QuikSCAT wind data help overcome the large surface data void in the analysis and forecast area of NHC’s
Tropical Analysis and Forecast Branch (TAFB). These data have resulted in improved analyses of surface
features, better definition of high wind areas, and improved forecasts of high-wind events. The development
of a climatology of gap wind events in the Gulf of Tehuantepec has been possible due to QuikSCAT wind
data in a largely data-void region.
The shortcomings of ocean surface vector winds from QuikSCAT in the operational environment at NHC
are described, along with requirements for future ocean surface vector wind missions. These include im-
provements in the timeliness and quality of the data, increasing the wind speed range over which the data are
reliable, and decreasing the impact of rain to allow for accurate retrievals in all-weather conditions.
1. Introduction
The mission of the National Hurricane Center (NHC)
is to save lives, mitigate property loss, and improve
economic efficiency by issuing the best watches, warn-
ings, forecasts, and analyses of hazardous tropical
weather, and by increasing the understanding of these
hazards. One of the most significant challenges in ac-
complishing this mission is the scarcity of data over
the oceans that make up large portions of the NHC’s
areas of responsibility (Fig. 1), which for tropical cy-
clones (TCs) include the North Atlantic basin (includ-
ing the Gulf of Mexico and Caribbean Sea) and the
eastern North Pacific basin (east of 1408W). In addition,
NHC has responsibility for marine analyses, forecasts,
and warnings in the portions of the tropical North At-
lantic and eastern Pacific Oceans. Remotely sensed
ocean surface vector wind (OSVW) data from the Sea-
Winds scatterometer on board the National Aeronautics
and Space Administration (NASA) Quick Scatterometer
Corresponding author address: Dr. Michael J. Brennan, National
Hurricane Center, 11691 SW 17th St., Miami, FL 33165.
E-mail: [email protected]
VOLUME 24 W E A T H E R A N D F O R E C A S T I N G JUNE 2009
DOI: 10.1175/2008WAF2222188.1
� 2009 American Meteorological Society 621

(QuikSCAT) satellite, a near-polar-orbiting research
satellite launched in June 1999, have helped fill some of
these data gaps. QuikSCAT wind retrievals have become
an important tool for analysis and forecasting at NHC
since becoming available in near–real time in 2000. These
retrievals are utilized frequently by NHC’s Hurricane
Specialists Unit in the analysis and forecasting of TCs,
and are also used by NHC’s Tropical Analysis and
Forecast Branch (TAFB) in the issuance of marine
forecasts and warnings, as well as in surface analyses.
The utility of QuikSCAT winds in the analysis and
forecasting of extratropical cyclones and marine weather
in the mid- and high latitudes at the Ocean Prediction
Center (OPC) is documented by Von Ahn et al. (2006),
while Chelton et al. (2006) and Atlas et al. (2001) de-
scribe the utility of scatterometer winds in general ma-
rine forecasting applications. Our purpose is to expand
on those works by highlighting the strengths and
weaknesses of QuikSCAT wind data as applicable to
the operational forecasting mission at NHC, with an
emphasis on TC applications. Section 2 provides a brief
description of the QuikSCAT instrument, data avail-
ability, and the general characteristics of the data. Sec-
tions 3 and 4 describe the application, evaluation, and
benefits of QuikSCAT data in NHC analyses, forecasts,
and warnings. Examples of QuikSCAT’s utility for TCs
are presented in section 3, while section 4 focuses on
utilization by TAFB. Section 5 identifies some important
limitations of QuikSCAT for operational use at NHC.
Section 6 examines other current and potential sources of
satellite OSVW data and lists National Oceanic and
Atmospheric Administration/National Weather Service
(NOAA/NWS) requirements for future satellite retrievals
of these data. A summary is provided in section 7.
2. QuikSCAT overview
Hoffman and Leidner (2005) provide a description of
the QuikSCAT platform that includes details beyond
the brief summary provided here. SeaWinds on board
QuikSCAT is an active microwave pencil-beam scanning
radar (scatterometer), operating at 13.4 GHz (Ku band),
that estimates 10-m wind speed and direction by mea-
suring the return of backscatter due to centimeter-scale
capillary waves on the ocean surface and assuming a
neutral stability profile to adjust the wind to the stan-
dard 10-m height. QuikSCAT nominally provides sur-
face wind retrievals with a unique vector every 25 km,
although postprocessing techniques have resulted in
12.5-km retrievals being available in near–real time since
2003. In addition, techniques for even finer-resolution
retrievals are under development (e.g., Long 2006).
QuikSCAT provides retrievals in swaths that are 1800 km
wide, resulting in coverage of about 90% of the global
oceans each day, although the overall coverage is least
in the deep tropics, where gaps between adjacent swaths
approach 1000 km. Reliable retrievals of wind speeds up
to about 90 kt (46.3 m s21) [equivalent to category 2 on
the Saffir–Simpson hurricane scale (e.g., Simpson 1974)]
can be produced in rain-free areas (e.g., Fernandez et al.
2006), but this is not possible in most TCs. The retrievals
are impacted by moderate to heavy rain, but winds of
tropical storm force can sometimes be estimated from
QuikSCAT in rainy conditions with careful forecaster
interpretation.
The QuikSCAT data available at NHC are processed
at NOAA’s National Environmental Satellite, Data, and
Information Service (NESDIS) using the near-real-time
(NRT) retrieval process described by Hoffman and
FIG. 1. Map showing NHC’s area of responsibility for TCs (outlined by thick black line), marine
forecasts (outlined by dashed black line), and surface analysis (shaded area).
622 W E A T H E R A N D F O R E C A S T I N G VOLUME 24

Leidner (2005). These data are displayable at the NOAA/
NWS/National Centers for Environmental Prediction
(NCEP) Advanced Weather Interactive Processing Sys-
tem (N-AWIPS) workstations used by forecasters at
NHC. This capability is critical in allowing forecasters
to overlay and carefully analyze QuikSCAT retrievals
with other data types (e.g., geostationary satellite imag-
ery, conventional surface observations, numerical weather
prediction model output fields, etc.).
The design of the QuikSCAT instrument results in up
to four possible wind solutions, or ‘‘ambiguities,’’ in
each wind vector cell (WVC) over which the retrieval
is performed. An ambiguity removal filter chooses a
solution (hereafter the ‘‘automated’’ solution) from
among the ambiguities in each WVC (Hoffman and
Leidner 2005). The ambiguity removal filter utilized in
the NESDIS NRT retrievals is initialized with a 6–9-h
forecast 10-m wind field from the NCEP Global Fore-
cast System (GFS) model. Both the automated solutions
and the ambiguities are displayable in N-AWIPS at
NHC, which is important since the ambiguities are often
manually analyzed by a forecaster to properly interpret
the QuikSCAT retrievals, especially in TCs.
3. Operational benefits of QuikSCAT for TCanalyses and forecasts
QuikSCAT data are heavily used at NHC for TC
analysis, especially when aircraft reconnaissance data
are not available, which is usually the case for systems in
the eastern half of the Atlantic basin and anywhere in
the eastern North Pacific basin. The frequent use of
QuikSCAT by hurricane specialists at NHC underscores
the tremendous operational need for remotely sensed
surface wind data in the TC environment. Applications
of QuikSCAT in operational TC analysis and forecasting
include center identification, center location, intensity
estimation, and wind radii analysis; examples of each of
these applications are provided below. At the end of this
section, we summarize our estimates of how often NHC
forecasters use QuikSCAT for each of these applications.
a. Center location and identification
Tropical cyclone center locations derived from the
automated QuikSCAT wind solutions are often unreli-
able, showing large positional errors or the absence of a
closed circulation altogether. Therefore, forecasters at
NHC perform a manual analysis of all the possible wind
solutions (i.e., an ‘‘ambiguity analysis’’) in an attempt to
locate the surface circulation or determine if one exists.
This manual procedure is essentially a streamline
analysis that is performed by examining all of the pos-
sible ambiguities, working inward toward a suspected
center and attempting to choose ambiguities that cor-
respond to a closed cyclonic circulation.1 The starting
point for the analysis is chosen, if possible, in a region
where either the wind direction is known from other
observations, or at points in the QuikSCAT swath that
show only two or three potential wind directions (i.e.,
two- or three-way ambiguities), implying less uncer-
tainty in the wind direction.
Real-time ambiguity analysis at NHC is often used in
tropical depressions and tropical storms, where the
surface circulation is often not well defined and may not
be easily identified in visible or infrared satellite imag-
ery. This is a critical issue, because identifying the
presence of a closed surface circulation is a requirement
for initiating advisories on a TC. Also, accurately spec-
ifying the initial location of the circulation center is vital
to determining the organization and intensity of the cy-
clone [i.e., the location of the center relative to the deep
convection, to which Dvorak satellite intensity estimates
(Dvorak 1975) are very sensitive], and the forward mo-
tion of the cyclone, which greatly influences the short-
term official track forecast and is used to initialize model
track guidance. In addition, the manual analysis is nec-
essary for properly obtaining a TC intensity estimate
from QuikSCAT, because the wind speeds vary slightly
among each of the ambiguities at each WVC.
The utility of the manual ambiguity analysis for deter-
mining if a circulation center exists has been manifested in
specific operational decisions. One such example occurred
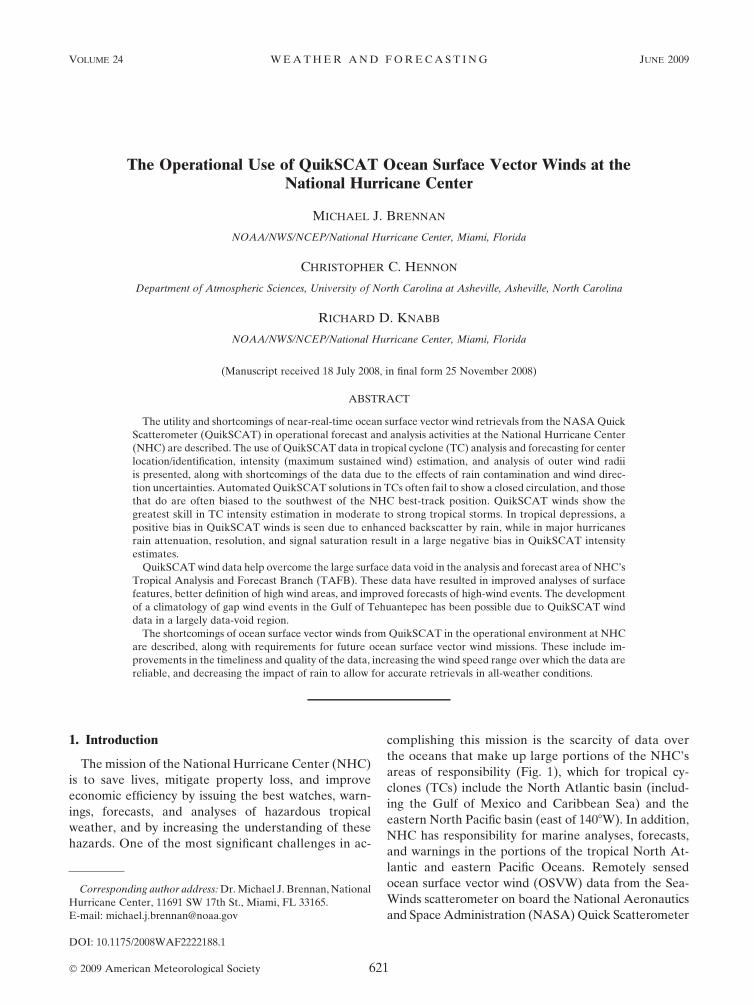
in a pass at 1035 UTC 25 August 2008 in the Caribbean Sea
over what was classified as Tropical Depression 7 shortly
thereafter. The automated QuikSCAT solution showed
the signature of an open wave at the surface, with the
flow curving from the southeast to the northeast roughly
along 688W (Fig. 2a). However, manual analysis of the
ambiguities showed that a closed surface circulation
existed in the vicinity of 14.68N, 68.78W (Fig. 2b); this
was a critical piece of information used in initiating
advisories on Tropical Depression 7 (which later be-
came Hurricane Gustav) at 1500 UTC that day (Pasch
and Roberts 2008). The presence of a circulation is also
supported by 37-GHz color composite imagery from the
U.S. Navy’s WindSat radiometer at around 1055 UTC
that day (Fig. 2c). Based in part on evidence from
QuikSCAT, advisories were initiated on the depression,
and associated tropical storm watches and warnings were
issued about 3 h prior to the arrival of aircraft recon-
naissance into the system.
1 The plotting convention of the ambiguities is toward the di-
rection the wind is blowing, opposite of the standard meteoro-
logical convention.
JUNE 2009 B R E N N A N E T A L . 623
This use of manual ambiguity analysis has been ben-
eficial in many other cases as well. For example, manual
analysis of a QuikSCAT pass early on 3 August 2004
(not shown) suggested that a closed circulation had
formed in association with a tropical wave about 450 mi
east of the Windward Islands. Based on these data,
NHC initiated advisories on a tropical depression (which
eventually became Tropical Storm Bonnie) a little sooner
than would otherwise have been the case, since aircraft
had not yet investigated the system (Avila 2004). In
another case, QuikSCAT ambiguities at 1300 UTC
11 November 2006 over Tropical Depression 20-E in the
eastern Pacific (not shown) revealed that the circulation
might no longer be closed, and that the system was
probably not producing winds of tropical storm force
(Knabb 2006). Without the QuikSCAT data, NHC would
likely have incorrectly upgraded the disorganized de-
pression to a tropical storm based on Dvorak intensity
estimates, which would have been unfortunate, espe-
cially since the cyclone dissipated later that same day.
Other examples of center locations determined by man-
ual ambiguity analysis are provided by Edson (2004).
b. Intensity
QuikSCAT wind retrievals can provide valuable in-
formation on the intensity of tropical depressions
FIG. 2. (a) Automated QuikSCAT solution in a pass over what was later classified as Tropical Depression 7 (and later Hurricane
Gustav) at 1035 UTC 25 Aug 2008 with 1015 UTC Geostationary Operational Environmental Satellite-12 (GOES-12) infrared satellite
imagery. (b) Manual analysis of QuikSCAT ambiguities (red streamline) suggests that a closed surface circulation exists near 14.68N,
68.78W that is not apparent in the automated solution. Advisories on the depression were initialized in part because of the circulation
identified in this QuikSCAT pass. (c) WindSat 37-GHz color composite imagery at 1055 UTC 25 Aug 2008 showing a circulation evident
slightly to the west of that indicated in the QuikSCAT ambiguity analysis. [Images courtesy of the U.S. Navy’s Fleet Numerical Me-
teorology and Oceanography Center (FNMOC).]
624 W E A T H E R A N D F O R E C A S T I N G VOLUME 24

[maximum 1-min 10-m wind less than 34 kt (17.5 m s21)]
and especially tropical storms [maximum wind of 34–63
kt (17.5–32.4 m s21)], but not on the intensity of most
hurricanes [maximum wind of 64 kt (32.9 m s21) or
greater]. Even in tropical storms, however, interpreta-
tion of the data can be quite complicated, due to the
impact of rain on the QuikSCAT retrieved wind speed
(see section 5a for further discussion of this issue). An
additional complication is the variability in retrieved
wind speeds among the ambiguities at each WVC, which
often ranges between 5 (2.6 m s21) and 10 kt (5.1 m s21).
This section provides some examples of how QuikSCAT
can be used for intensity estimation, in part by compar-
ing QuikSCAT with other datasets (particularly aircraft
reconnaissance).
Automated solutions (12.5-km resolution) from a
QuikSCAT pass at 1113 UTC 13 September 2005 over
Tropical Storm Ophelia (Beven and Cobb 2006) show a
maximum wind speed of 54 kt (27.8 m s21) about 60 n mi
northeast of the 1200 UTC best-track (Jarvinen et al.
1984) position of the cyclone (Fig. 3). The maximum
flight-level wind measured by aircraft, after reduction
from 700 mb to the surface by the standard 0.9 factor (e.g.,
Franklin et al. 2003), was 59 kt (30.4 m s21) at around 1300
UTC, located 65 n mi northeast of the center, only 10 n mi
from the QuikSCAT maximum (Fig. 4). This relatively
close agreement between QuikSCAT and the aircraft
data exemplifies that QuikSCAT retrievals in tropical
storms, despite the presence of rain, can still provide
useful information on intensity, which is especially useful
for systems not sampled by aircraft. As will be shown later
in section 5, however, interpretation of QuikSCAT data
in these situations is often not straightforward.
QuikSCAT can occasionally provide intensity infor-
mation for some hurricanes, particularly those under-
going extratropical transition (ET; e.g., Jones et al.
2003), when rainfall rates near the TC core begin to
decrease, reducing the contamination effects of rain
from the wind retrievals. For example, as Hurricane
Helene (2006) was undergoing ET, a QuikSCAT pass
over the cyclone at 0916 UTC 23 September indicated
that maximum winds had increased to 80 kt (41.2 m s21)
and were located within a convection-free area in the
southwestern quadrant of the cyclone (Fig. 5). These
QuikSCAT data prompted NHC to issue a ‘‘special’’
advisory on Helene that updated the current and fore-
cast intensities of the cyclone (important to mariners
trying to avoid hazardous conditions in the path of
Helene). Without QuikSCAT data, it is unlikely that
this secondary peak in Helene’s intensity (Brown 2006)
would have been observed. It is important to emphasize,
however, that this Helene case was unusual for a system
still designated as a TC, and that QuikSCAT cannot
measure the maximum winds in most hurricanes, for
reasons described in more detail later in section 5.
c. Wind radii
The 1800-km-wide swath of retrieved winds from
QuikSCAT can be useful in determining the radial ex-
tent of 34-kt (17.5 m s21) and occasionally 50-kt (25.7
m s21) winds, for which NHC provides analyses and 3-day
forecasts in each full advisory package.2 Wind radii in-
formation from QuikSCAT is particularly valuable for
TCs not sampled by aircraft reconnaissance. Accurate
wind radii analyses and forecasts are a critical factor in
determining the size and timing of tropical storm and
hurricane watch and warning areas, and they provide
guidance to mariners seeking to avoid hazardous wind
conditions associated with a TC.
Figure 6a shows a QuikSCAT pass that captured the
entire circulation of Hurricane Katrina (2005) around
1200 UTC on 28 August 2005. A gridded isotach field
generated from the 25-km QuikSCAT wind retrievals
(Fig. 6b) shows a well-defined 34-kt wind radius around
the cyclone that agrees closely with several ship and
buoy observations located in this region and with air-
craft reconnaissance data from that day (not shown).
This level of agreement between QuikSCAT and sur-
face and reconnaissance observations in a heavily sam-
pled cyclone such as Katrina gives NHC forecasters a
relatively high level of confidence in QuikSCAT ob-
servations of outer wind radii in hurricanes where no
other data are available.
d. Frequency of use
In an attempt to quantify the utility of QuikSCAT in
operational TC analysis and forecasting at NHC, we
counted how often QuikSCAT data were mentioned in
NHC’s TC discussion (TCD) products. One TCD is
issued for each active TC with every routine 6-hourly
forecast package, and for occasional ‘‘special’’ advi-
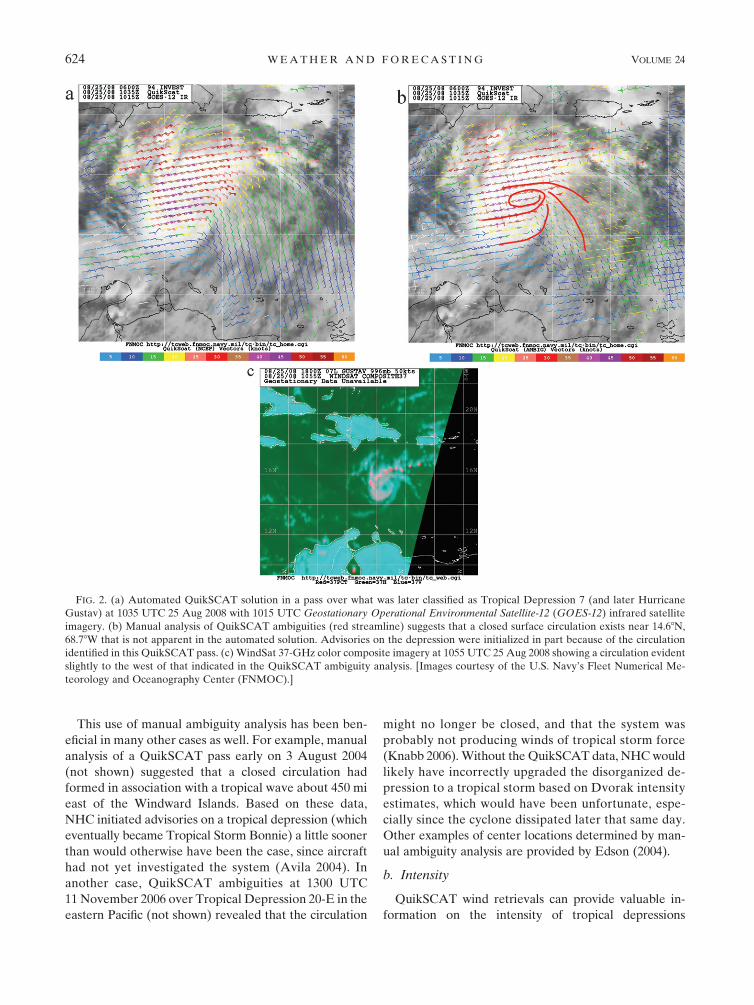
sories. TCDs from 2000 to 2007 were examined for any
mention of QuikSCAT, and during this period the
percentage of Atlantic TCDs in which QuikSCAT was
mentioned steadily increased to 22% in 2006, but with a
slight decrease to near 18% in 2007 (Fig. 7). Some of the
higher numbers from 2005 and 2006 might be due to
the fact that more cyclones formed farther east in the
Atlantic basin in those seasons, outside the range of
aircraft reconnaissance, increasing the need for the
QuikSCAT information. The mention of QuikSCAT in
eastern North Pacific TCDs remained between 15% and
2 NHC defines a wind radius as the maximum extent of the
stated wind speed in each quadrant of the TC. Such winds do not
necessarily extend out that far everywhere in the quadrant.
JUNE 2009 B R E N N A N E T A L . 625

19% from 2001 through 2006 and increased to near 27%
in 2007. The effective use of QuikSCAT in TCDs is
greater than the percentages would indicate in both
basins, since at most two QuikSCAT passes are avail-
able per day over a given TC. This means that only two
of the four routine daily forecast cycles (and their ac-
companying TCDs) could have new QuikSCAT data to
consider. In addition, in some cases QuikSCAT could
have been used in the analysis and forecast process and
not mentioned in the TCD, but those uses cannot be
quantified. If one considers only the one-half of all TCDs
for which new QuikSCAT data could have been available,
the ‘‘effective’’ frequency of references to QuikSCAT in
those TCDs at NHC is now 40%–50% in both basins.
The specific applications of QuikSCAT, based on
mentions in the TCDs, were sorted by the three anal-
ysis parameters discussed in the previous sections: in-
tensity (maximum sustained surface wind), center fixing/
identification, and wind radii. Each TCD in which
QuikSCAT was mentioned was placed into one or more
of the three categories, since some TCDs mentioned that
QuikSCAT was used for analyzing two or all three of the
parameters. During the 5-yr period from 2003 to 2007 in
both basins, QuikSCAT was mentioned most often
when describing its use in making some judgment about
the current intensity of the TC (62%), and less fre-
quently for center fixing/identification (21%) and wind
radii analysis (17%). There was some variability in the
mention of QuikSCAT across seasons and basins, likely
due to year-to-year variations in the locations and in-
tensities of TCs. For example, the use of QuikSCAT
data for wind radii analysis has been mentioned more
often in TCDs for major hurricanes than for cyclones of
weaker intensities. During 2003, however, no major
hurricanes occurred in the eastern North Pacific basin
(Beven et al. 2005), and that year QuikSCAT’s use in
wind radii analysis was mentioned only 4% of the time
in eastern North Pacific TCDs. Interestingly, during the
5-yr period, the use of QuikSCAT for intensity analysis
was mentioned in the Atlantic basin (64% of TCD
mentions) more often than in the eastern North Pacific
(55%), despite the presence of more frequent aircraft
reconnaissance in the Atlantic. All 33 of the TCD
mentions of QuikSCAT for intensity estimation during
the 2007 in the Atlantic basin were for tropical de-
pressions and tropical storms, highlighting the defi-
ciency of QuikSCAT for hurricane intensity estimation.
4. Operational benefits for marine analysisand forecasting in the tropics
NHC’s TAFB disseminates surface analyses and
marine forecasts and warnings for an area of responsi-
bility of approximately 12 million (n mi)2 that includes
FIG. 3. Isotachs (kt) from 12.5-km QuikSCAT winds valid at 1113 UTC 13 Sep 2005 and
GOES-12 image valid at 1115 UTC. Tropical storm symbol indicates the approximate 1200
UTC 13 Sep NHC best-track position of Ophelia.
626 W E A T H E R A N D F O R E C A S T I N G VOLUME 24

FIG. 5. Automated 12.5-km QuikSCAT solution in a pass over Hurricane Helene at 0916 UTC
23 Sep 2006 and GOES-12 infrared image from 1015 UTC.
FIG. 4. Peak flight-level winds multiplied by a scaling factor of 0.9 from U.S. Air Force Reserve aircraft recon-
naissance (kt, large numerals) and time of observation (UTC, small numerals) from 1030 through 1350 UTC 13 Sep
2005 in Tropical Storm Ophelia. The maximum scaled flight-level wind of 59 kt was found near 32.88N, 77.18W. The
tropical storm symbol indicates the approximate 1200 UTC NHC best-track position of Tropical Storm Ophelia.
JUNE 2009 B R E N N A N E T A L . 627

FIG. 6. (a) QuikSCAT winds (barbs, kt) from 1127 UTC 28 Aug 2005 over Hurricane Katrina with 1145 UTC
GOES-12 infrared image and (b) isotachs (color contours, kt) from 25-km QuikSCAT winds at 1127 UTC 28 Aug
2005 over Hurricane Katrina with 1200 UTC ship and buoy wind observations (kt). Black wind barbs in (a) are
flagged for possible rain contamination.
628 W E A T H E R A N D F O R E C A S T I N G VOLUME 24
the Atlantic Ocean from the equator to 318N west of
358W, and the eastern Pacific Ocean from 208S to 308N
east of 1408W (Fig. 1). Away from areas of rain con-
tamination, QuikSCAT wind data have had a very
positive impact on the analysis of synoptic surface fea-
tures such as fronts, troughs, high and low pressure
centers, and tropical waves, since the locations and
characteristics of such features are vital to marine
weather forecasts and warnings in the tropics.
The relatively wide range of retrievable wind speeds
from QuikSCAT allows forecasters to frequently detect
winds of gale force [34–47 kt (17.5–24.2 m s21)] and
storm force [48–63 kt (24.7–32.4 m s21)] for the issuance
of marine forecasts and warnings. Widespread convec-
tion in the tropics, however, leads to frequent overes-
timation by QuikSCAT of wind speeds that are actually
less than gale force, requiring careful forecaster inter-
pretation of the data. Rain contamination also compli-
cates the interpretation of QuikSCAT wind direction
retrievals in areas of the most interesting and potentially
dangerous weather associated with convectively active
tropical waves, fronts, or cyclones. Rain contamination
issues are discussed in more detail below in section 5a.
a. Gulf of Tehuantepec gap wind events
QuikSCAT winds have greatly improved the moni-
toring and forecasting of gap wind events, particularly
those that occur during the cold season (October–
March) in the Gulf of Tehuantepec, an area adjacent
to the Pacific coast of southeastern Mexico. The struc-
tural characteristics of these events are described by
Steenburgh et al. (1998), who examined a case in which
winds were estimated to have reached about 50 kt (25.7
m s21). Prior to the availability of QuikSCAT data in
1999, TAFB forecasters had to rely on occasional ship
observations in an attempt to observe the intensity of
these wind events and to issue and verify gale or storm
warnings in this region (Cobb et al. 2003). Based on
QuikSCAT data from the cold seasons of 1999–2000
through 2006–07, 143 wind events reaching at least gale
force have been documented in the Gulf of Tehuante-
pec, with 44 of those events reaching storm-force magni-
tude (Brennan et al. 2007). On average, 12.4 gale-force
events (winds reaching gale but not storm force) occur
per cold season in the Gulf of Tehuantepec, with an
average of 5.5 storm-force events per season. Even
hurricane-force Tehuantepec events are occasionally
detected by 12.5-km QuikSCAT retrievals, including
hurricane-force events occurring in mid-November 2007
and early January 2008.
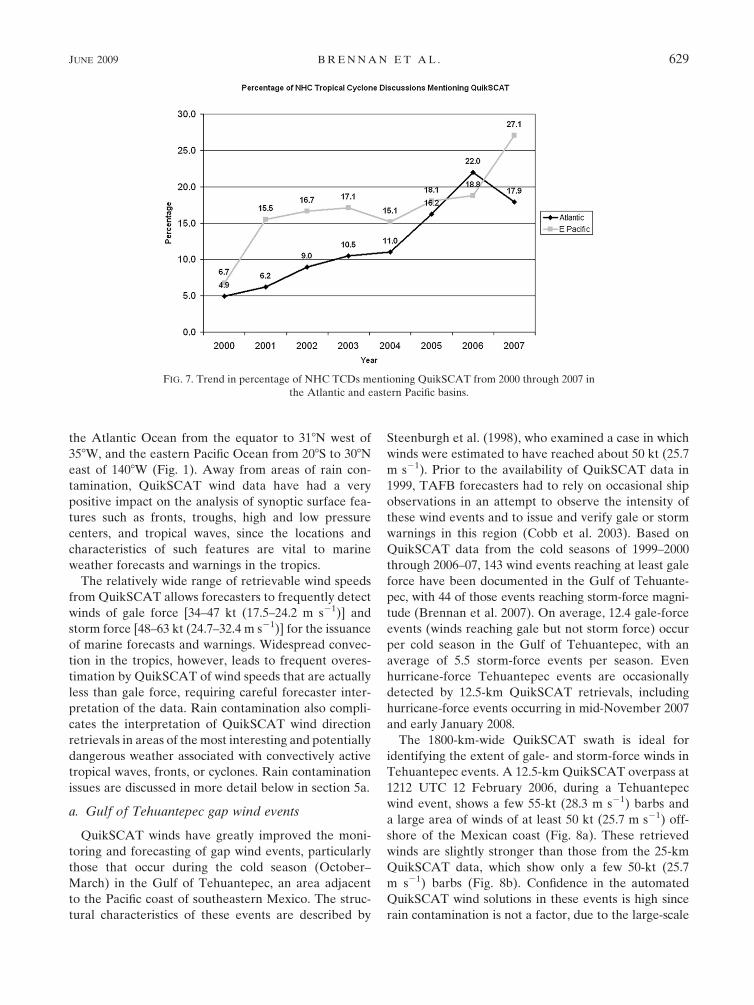
The 1800-km-wide QuikSCAT swath is ideal for
identifying the extent of gale- and storm-force winds in
Tehuantepec events. A 12.5-km QuikSCAT overpass at
1212 UTC 12 February 2006, during a Tehuantepec
wind event, shows a few 55-kt (28.3 m s21) barbs and
a large area of winds of at least 50 kt (25.7 m s21) off-
shore of the Mexican coast (Fig. 8a). These retrieved
winds are slightly stronger than those from the 25-km
QuikSCAT data, which show only a few 50-kt (25.7
m s21) barbs (Fig. 8b). Confidence in the automated
QuikSCAT wind solutions in these events is high since
rain contamination is not a factor, due to the large-scale
FIG. 7. Trend in percentage of NHC TCDs mentioning QuikSCAT from 2000 through 2007 in
the Atlantic and eastern Pacific basins.
JUNE 2009 B R E N N A N E T A L . 629

subsidence caused by cold-air advection. Elsewhere in the
TAFB areas of responsibility, QuikSCAT has been useful
in identifying small-scale high-wind events in other passes,
straits, gaps, and in climatologically favored areas such as
along the Caribbean coast of Colombia (not shown).
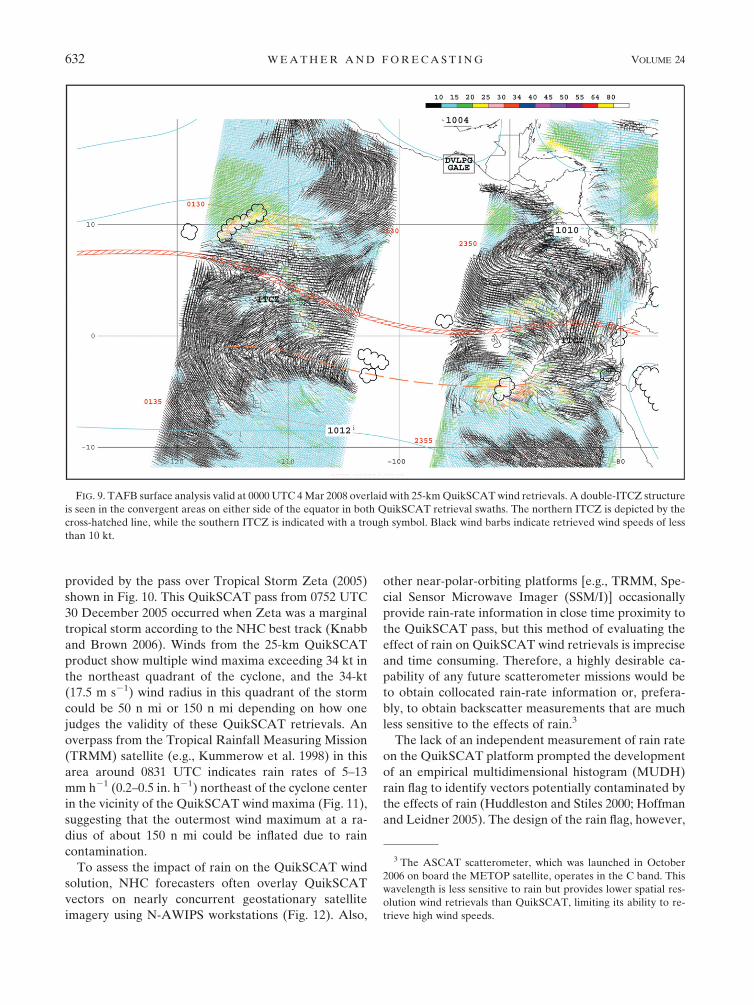
b. Intertropical convergence zone
In an effort led by TAFB, the position of the inter-
tropical convergence zone (ITCZ) was introduced into
the NWS unified surface analysis (e.g., Berg et al. 2007)
in 2004. This change was motivated by the utility of
QuikSCAT in identifying the trade wind confluence
over large areas that is not always revealed by convec-
tion. QuikSCAT even clearly depicts the broad double-
ITCZ structures (Fig. 9) often observed over the eastern
Pacific during boreal spring (e.g., Zheng et al. 1997;
Lietzke et al. 2001).
5. Limitations of QuikSCAT in NHC operations
The major limitations of QuikSCAT from the NHC
operational perspective include the following:
1) the inability to resolve the maximum winds in the
inner core of most hurricanes due to insufficient re-
trieval resolution, instrument signal saturation (which
limits the maximum retrievable wind speed, even in
rain-free conditions), and attenuation by rain;
2) positive and negative biases in retrieved wind speeds,
caused by rain contamination, that are difficult to
distinguish and quantify without other collocated
wind data;
3) the lack of collocated rain rate data to determine the
influence of rain on the retrieved wind solution;
4) ambiguity removal errors that make automated
QuikSCAT-derived TC center locations unreliable,
which make the determination of whether a circu-
lation center exists in incipient systems difficult, and
that require the forecaster to manually analyze the
ambiguities;
5) the low frequency of passes over any given region or
weather system (at most two passes per day with a
single satellite) and the largest gaps between swaths
in the tropics; and
6) the time lag between the satellite overpass and data
receipt at NHC.
Some specifics about these limitations are discussed in
the remainder of this section.
a. Rain effects on QuikSCAT wind retrievals
1) OVERVIEW
The Ku-band frequency of QuikSCAT is sensitive to
the effects of rain contamination that can limit the utility
of QuikSCAT data, particularly in TCs where strong
winds are often found in regions of deep convection and
high rainfall rates. The effects of rain on QuikSCAT
retrievals (e.g., Chelton and Freilich 2005; Chelton et al.
2006) can increase or decrease the amount of backscatter
returned to the satellite via the following mechanisms:
1) creating additional backscatter from reflection of the
satellite’s emitted beam off of the raindrops them-
selves (i.e., ‘‘volume backscatter’’), and/or from
roughening the sea surface due to the impact of the
raindrops, contributing to a higher retrieved wind
speed; and/or
2) attenuation of the wind-produced backscatter signal
from the ocean surface by raindrops, contributing to
a lower retrieved wind speed.
The sign of the bias due to rain in the QuikSCAT
wind speed solution varies with both the actual wind
speed and the rain rate. The impact of rain on the re-
trieved wind speed is directly proportional to the rain
rate, but it is inversely proportional to the true wind
speed near the ocean surface, since rain degrades the
retrieval more severely at low wind speeds (Portabella
and Stoffelen 2001; Weissman et al. 2002; Hoffman et al.
2004; Chelton et al. 2006). For example, when rain rates
increased to more than 1 mm h21, Weissman et al.
(2002) found a positive bias in QuikSCAT wind speeds
compared to buoy observations, especially in weak wind
speed conditions where rain becomes the primary
scattering mechanism. At wind speeds less than about
10 m s21, volume backscatter from rain and increased
ocean surface roughness result in a positive retrieved
wind speed bias due to rain; when wind speeds exceed
about 15 m s21, attenuation of the ocean surface back-
scatter due to rain results in a negative bias in the
retrieved wind speed (Stiles and Yueh 2002). Edson
et al. (2002) and Edson (2004) found similar biases in
QuikSCAT passes over TCs, where rain tends to increase
the retrieved QuikSCAT wind speed when the actual
winds are less than 15–20 m s21 (30–40 kt), while rain
tends to decrease the retrieved wind speeds when the
actual winds are stronger than 15–20 m s21. Since this
change in retrieval bias occurs near the threshold of
tropical storm intensity, it is often challenging to make
operational decisions based on QuikSCAT regarding
whether or not a TC has become a tropical storm, and/or
how far winds of tropical storm force extend from the
circulation center.
2) OPERATIONAL INTERPRETATION OF
RAIN IMPACTS
An example of the challenges involved with inter-
preting the effects of rain on QuikSCAT wind speeds is
630 W E A T H E R A N D F O R E C A S T I N G VOLUME 24
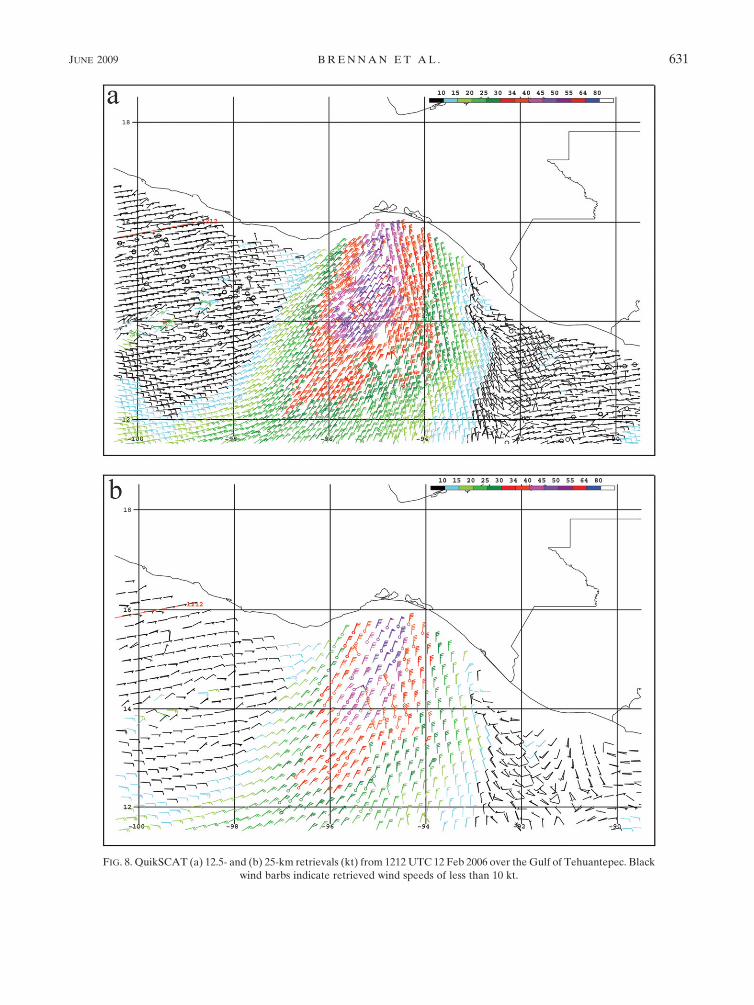
FIG. 8. QuikSCAT (a) 12.5- and (b) 25-km retrievals (kt) from 1212 UTC 12 Feb 2006 over the Gulf of Tehuantepec. Black
wind barbs indicate retrieved wind speeds of less than 10 kt.
JUNE 2009 B R E N N A N E T A L . 631
provided by the pass over Tropical Storm Zeta (2005)
shown in Fig. 10. This QuikSCAT pass from 0752 UTC
30 December 2005 occurred when Zeta was a marginal
tropical storm according to the NHC best track (Knabb
and Brown 2006). Winds from the 25-km QuikSCAT
product show multiple wind maxima exceeding 34 kt in
the northeast quadrant of the cyclone, and the 34-kt
(17.5 m s21) wind radius in this quadrant of the storm
could be 50 n mi or 150 n mi depending on how one
judges the validity of these QuikSCAT retrievals. An
overpass from the Tropical Rainfall Measuring Mission
(TRMM) satellite (e.g., Kummerow et al. 1998) in this
area around 0831 UTC indicates rain rates of 5–13
mm h21 (0.2–0.5 in. h21) northeast of the cyclone center
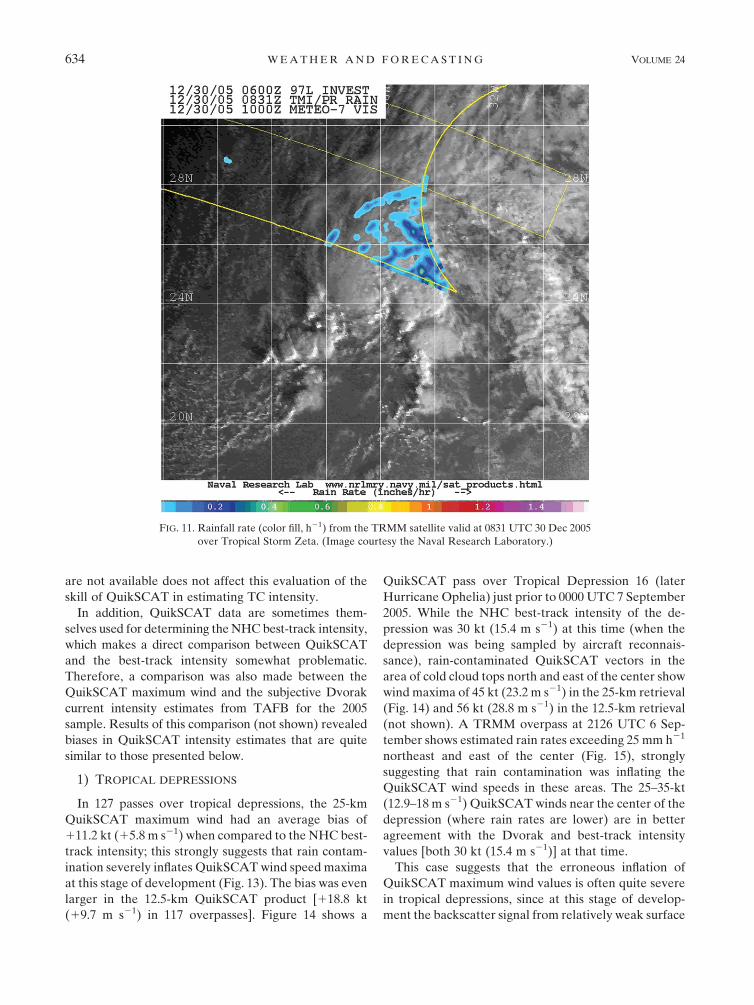
in the vicinity of the QuikSCAT wind maxima (Fig. 11),
suggesting that the outermost wind maximum at a ra-
dius of about 150 n mi could be inflated due to rain
contamination.
To assess the impact of rain on the QuikSCAT wind
solution, NHC forecasters often overlay QuikSCAT
vectors on nearly concurrent geostationary satellite
imagery using N-AWIPS workstations (Fig. 12). Also,
other near-polar-orbiting platforms [e.g., TRMM, Spe-
cial Sensor Microwave Imager (SSM/I)] occasionally
provide rain-rate information in close time proximity to
the QuikSCAT pass, but this method of evaluating the
effect of rain on QuikSCAT wind retrievals is imprecise
and time consuming. Therefore, a highly desirable ca-
pability of any future scatterometer missions would be
to obtain collocated rain-rate information or, prefera-
bly, to obtain backscatter measurements that are much
less sensitive to the effects of rain.3
The lack of an independent measurement of rain rate
on the QuikSCAT platform prompted the development
of an empirical multidimensional histogram (MUDH)
rain flag to identify vectors potentially contaminated by
the effects of rain (Huddleston and Stiles 2000; Hoffman
and Leidner 2005). The design of the rain flag, however,
FIG. 9. TAFB surface analysis valid at 0000 UTC 4 Mar 2008 overlaid with 25-km QuikSCAT wind retrievals. A double-ITCZ structure
is seen in the convergent areas on either side of the equator in both QuikSCAT retrieval swaths. The northern ITCZ is depicted by the
cross-hatched line, while the southern ITCZ is indicated with a trough symbol. Black wind barbs indicate retrieved wind speeds of less
than 10 kt.
3 The ASCAT scatterometer, which was launched in October
2006 on board the METOP satellite, operates in the C band. This
wavelength is less sensitive to rain but provides lower spatial res-
olution wind retrievals than QuikSCAT, limiting its ability to re-
trieve high wind speeds.
632 W E A T H E R A N D F O R E C A S T I N G VOLUME 24

can result in light rain rates escaping detection and
the overflagging of wind vectors in regions where no
rain is present if wind speeds exceed about 10 m s21
(Hoffman et al. 2004; Milliff et al. 2004; Chelton et al.
2006). These issues force operational forecasters to
subjectively assess the impact of rain on the retrieved
QuikSCAT wind speeds, which can be very difficult in
an operational setting, especially without collocated
rain-rate information. Even if the rain rate was known,
the reliability of the QuikSCAT wind speeds would still
be uncertain since determining the effect of rain re-
quires some a priori knowledge of the true near-surface
wind speed.
b. Skill of QuikSCAT wind retrievals for TCintensity analysis
To quantify the skill of QuikSCAT in TC intensity
estimation, error statistics were computed comparing
the QuikSCAT maximum wind speed estimate (derived
from the automated solution, not from an ambiguity
analysis) to the NHC best-track intensity for all avail-
able QuikSCAT passes over TCs in the Atlantic basin
during 2005 and the Atlantic and eastern North Pacific
basins during 2006 and 2007 (475 and 428 retrievals
at 25 and 12.5 km, respectively, were examined). Max-
imum wind speeds were extracted from 0.258 (0.1258)
gridded isotach fields generated from the 25-km
(12.5 km) retrievals. Figure 13 shows the average bias of
the QuikSCAT maximum wind speed compared with
the NHC best-track intensities for tropical depressions,
tropical storms, and hurricanes binned by category us-
ing the Saffir–Simpson hurricane scale.
While NHC best-track intensity estimates are more
uncertain when aircraft reconnaissance data are un-
available, identical bias calculations were performed on
subsamples of 69 and 64 QuikSCAT passes at 25 and
12.5 km, respectively, from 2005 where aircraft recon-
naissance data were available within 3 h of the QuikSCAT
pass time. These results (not shown) are nearly identical
to those of the larger sample presented below, and
suggest that any additional uncertainty in the NHC best-
track intensity data when aircraft reconnaissance data
FIG. 10. The 25-km wind retrieval from the QuikSCAT pass over Tropical Storm Zeta at 0752 UTC 30 Dec 2005 with GOES-12
imagery from 0815 UTC. The tropical storm symbol indicates the 0600 UTC NHC best-track position of Zeta. Black wind barbs are
flagged for possible rain contamination.
JUNE 2009 B R E N N A N E T A L . 633
are not available does not affect this evaluation of the
skill of QuikSCAT in estimating TC intensity.
In addition, QuikSCAT data are sometimes them-
selves used for determining the NHC best-track intensity,
which makes a direct comparison between QuikSCAT
and the best-track intensity somewhat problematic.
Therefore, a comparison was also made between the
QuikSCAT maximum wind and the subjective Dvorak
current intensity estimates from TAFB for the 2005
sample. Results of this comparison (not shown) revealed
biases in QuikSCAT intensity estimates that are quite
similar to those presented below.
1) TROPICAL DEPRESSIONS
In 127 passes over tropical depressions, the 25-km
QuikSCAT maximum wind had an average bias of
111.2 kt (15.8 m s21) when compared to the NHC best-
track intensity; this strongly suggests that rain contam-
ination severely inflates QuikSCAT wind speed maxima
at this stage of development (Fig. 13). The bias was even
larger in the 12.5-km QuikSCAT product [118.8 kt
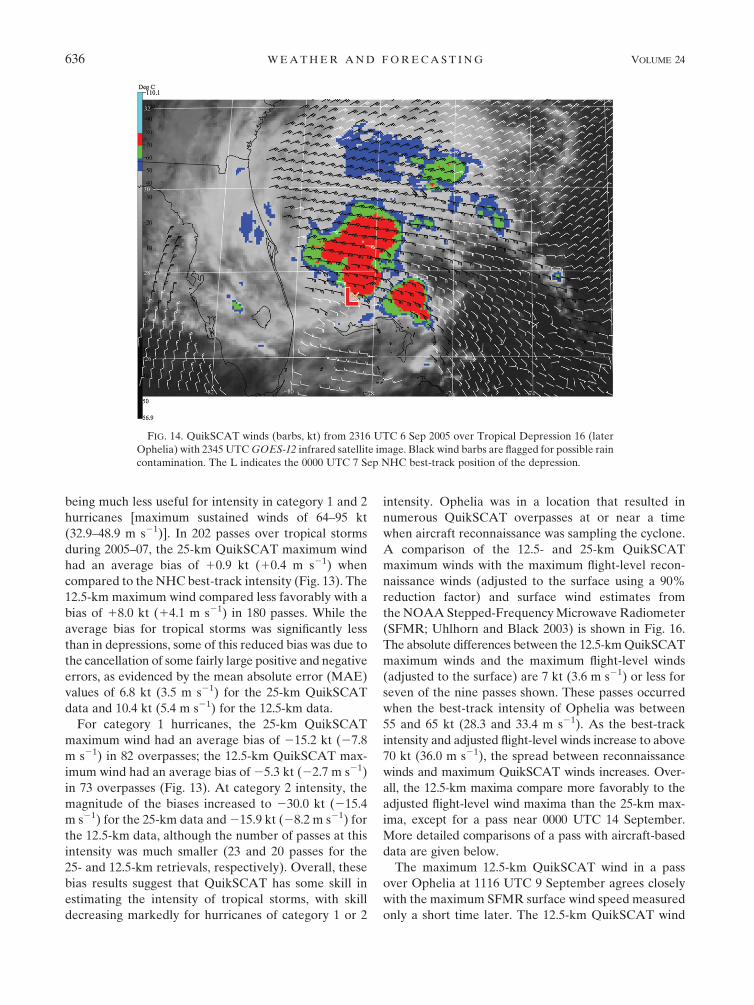
(19.7 m s21) in 117 overpasses]. Figure 14 shows a
QuikSCAT pass over Tropical Depression 16 (later
Hurricane Ophelia) just prior to 0000 UTC 7 September
2005. While the NHC best-track intensity of the de-
pression was 30 kt (15.4 m s21) at this time (when the
depression was being sampled by aircraft reconnais-
sance), rain-contaminated QuikSCAT vectors in the
area of cold cloud tops north and east of the center show
wind maxima of 45 kt (23.2 m s21) in the 25-km retrieval
(Fig. 14) and 56 kt (28.8 m s21) in the 12.5-km retrieval
(not shown). A TRMM overpass at 2126 UTC 6 Sep-
tember shows estimated rain rates exceeding 25 mm h21
northeast and east of the center (Fig. 15), strongly
suggesting that rain contamination was inflating the
QuikSCAT wind speeds in these areas. The 25–35-kt
(12.9–18 m s21) QuikSCAT winds near the center of the
depression (where rain rates are lower) are in better
agreement with the Dvorak and best-track intensity
values [both 30 kt (15.4 m s21)] at that time.
This case suggests that the erroneous inflation of
QuikSCAT maximum wind values is often quite severe
in tropical depressions, since at this stage of develop-
ment the backscatter signal from relatively weak surface
FIG. 11. Rainfall rate (color fill, h21) from the TRMM satellite valid at 0831 UTC 30 Dec 2005
over Tropical Storm Zeta. (Image courtesy the Naval Research Laboratory.)
634 W E A T H E R A N D F O R E C A S T I N G VOLUME 24

wind speeds can be overwhelmed by the effects of rain.
Interpretation of these higher retrieved winds is not
straightforward, however, since in areas of convection,
stronger surface winds would normally be expected due
to enhanced vertical momentum transport.
2) TROPICAL STORMS AND CATEGORY
1–2 HURRICANES
QuikSCAT winds have frequently shown utility for
estimating intensity in tropical storms, with the data
FIG. 13. Bar graph showing average bias (kt) of the QuikSCAT maximum wind compared to
the nearest 6-h NHC best-track intensity in passes over 2005–06 Atlantic and 2006 eastern
Pacific basin tropical cyclones sorted by NHC best-track classification [tropical depression
(TD); tropical storm (TS); and Saffir–Simpson hurricane scale category, H1–H5).
FIG. 12. Overlay of 25-km QuikSCAT wind barbs (kt) and GOES-12 infrared satellite im-
agery on an N-AWIPS workstation showing Hurricane Gordon at 1015 UTC 14 Sep 2006. Wind
barbs with circles at the base are flagged for possible rain contamination.
JUNE 2009 B R E N N A N E T A L . 635
being much less useful for intensity in category 1 and 2
hurricanes [maximum sustained winds of 64–95 kt
(32.9–48.9 m s21)]. In 202 passes over tropical storms
during 2005–07, the 25-km QuikSCAT maximum wind
had an average bias of 10.9 kt (10.4 m s21) when
compared to the NHC best-track intensity (Fig. 13). The
12.5-km maximum wind compared less favorably with a
bias of 18.0 kt (14.1 m s21) in 180 passes. While the
average bias for tropical storms was significantly less
than in depressions, some of this reduced bias was due to
the cancellation of some fairly large positive and negative
errors, as evidenced by the mean absolute error (MAE)
values of 6.8 kt (3.5 m s21) for the 25-km QuikSCAT
data and 10.4 kt (5.4 m s21) for the 12.5-km data.
For category 1 hurricanes, the 25-km QuikSCAT
maximum wind had an average bias of 215.2 kt (27.8
m s21) in 82 overpasses; the 12.5-km QuikSCAT max-
imum wind had an average bias of 25.3 kt (22.7 m s21)
in 73 overpasses (Fig. 13). At category 2 intensity, the
magnitude of the biases increased to 230.0 kt (215.4
m s21) for the 25-km data and 215.9 kt (28.2 m s21) for
the 12.5-km data, although the number of passes at this
intensity was much smaller (23 and 20 passes for the
25- and 12.5-km retrievals, respectively). Overall, these
bias results suggest that QuikSCAT has some skill in
estimating the intensity of tropical storms, with skill
decreasing markedly for hurricanes of category 1 or 2
intensity. Ophelia was in a location that resulted in
numerous QuikSCAT overpasses at or near a time
when aircraft reconnaissance was sampling the cyclone.
A comparison of the 12.5- and 25-km QuikSCAT
maximum winds with the maximum flight-level recon-
naissance winds (adjusted to the surface using a 90%
reduction factor) and surface wind estimates from
the NOAA Stepped-Frequency Microwave Radiometer
(SFMR; Uhlhorn and Black 2003) is shown in Fig. 16.
The absolute differences between the 12.5-km QuikSCAT
maximum winds and the maximum flight-level winds
(adjusted to the surface) are 7 kt (3.6 m s21) or less for
seven of the nine passes shown. These passes occurred
when the best-track intensity of Ophelia was between
55 and 65 kt (28.3 and 33.4 m s21). As the best-track
intensity and adjusted flight-level winds increase to above
70 kt (36.0 m s21), the spread between reconnaissance
winds and maximum QuikSCAT winds increases. Over-
all, the 12.5-km maxima compare more favorably to the
adjusted flight-level wind maxima than the 25-km max-
ima, except for a pass near 0000 UTC 14 September.
More detailed comparisons of a pass with aircraft-based
data are given below.
The maximum 12.5-km QuikSCAT wind in a pass
over Ophelia at 1116 UTC 9 September agrees closely
with the maximum SFMR surface wind speed measured
only a short time later. The 12.5-km QuikSCAT wind
FIG. 14. QuikSCAT winds (barbs, kt) from 2316 UTC 6 Sep 2005 over Tropical Depression 16 (later
Ophelia) with 2345 UTC GOES-12 infrared satellite image. Black wind barbs are flagged for possible rain
contamination. The L indicates the 0000 UTC 7 Sep NHC best-track position of the depression.
636 W E A T H E R A N D F O R E C A S T I N G VOLUME 24

maximum of 56 kt (28.8 m s21) was located 13 n mi SSW
of the 1200 UTC best-track center position of Ophelia
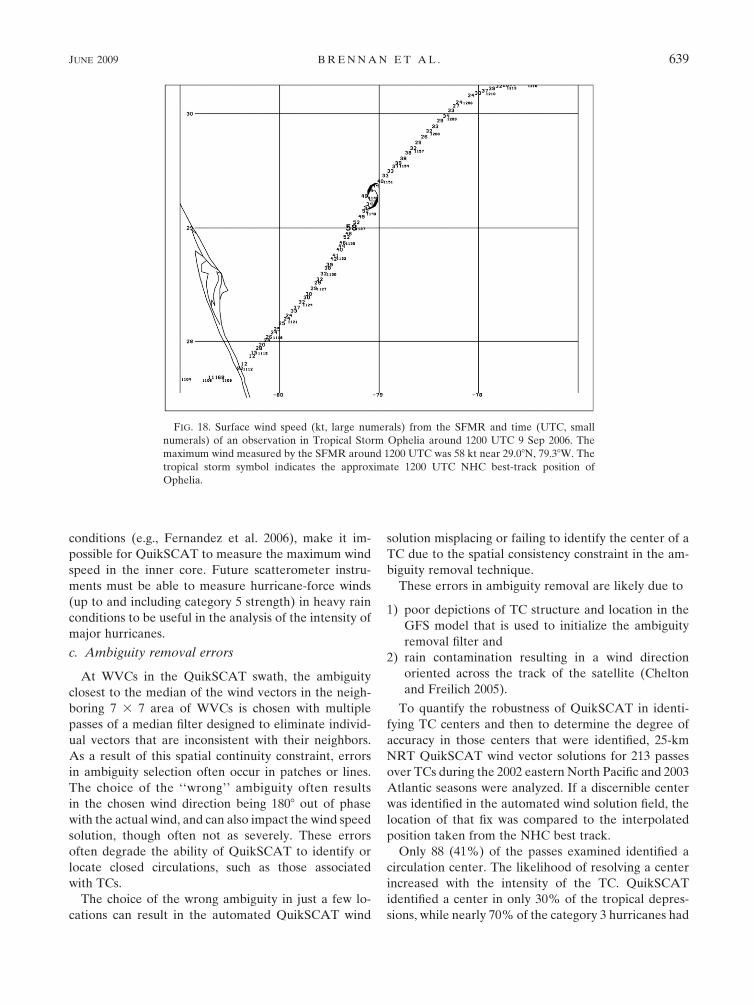
(Fig. 17). The SFMR maximum surface wind of 58 kt
(29.8 m s21) was found 20 n mi SSW of the center at
1137 UTC (Fig. 18), very close to the location of the
QuikSCAT maximum wind. While a TRMM pass at
1522 UTC (Fig. 19) indicates high rain rates in the vi-
cinity of the highest QuikSCAT winds, it is possible that
the surface wind speeds had reached a threshold where
the backscatter returned to the QuikSCAT instrument
due to the wind was no longer being significantly con-
taminated by rain. Overall, these results highlight the
utility of QuikSCAT for intensity estimation in tropical
storms and its increasing limitations once the systems
strengthen into hurricanes.
3) MAJOR HURRICANES
The limitations of QuikSCAT in intensity estimation
are especially evident in major hurricanes [maximum
sustained winds greater than 95 kt (48.9 m s21)]. When
compared to the NHC best-track intensities for major
hurricanes, the 25-km QuikSCAT maximum winds had
average biases of 238.3 (219.7 m s21), 252.3 (226.9
m s21), and 272.6 kt (237.3 m s21) in category 3, 4, and
5 hurricanes, respectively (Fig. 13). Corresponding av-
erage biases for the 12.5-km retrievals were 230.5
(215.7 m s21), 238.2 (219.7 m s21), and 254.6 kt
(228.1 m s21). For example, the 25-km QuikSCAT re-
trieval in a pass over Hurricane Katrina (Fig. 6a) at 1127
UTC 28 August 2005 shows a maximum wind speed of
76 kt (39.1 m s21) in the 25-km data at a time when the
best-track intensity of the storm as inferred from air-
craft reconnaissance data was 145 kt (74.6 m s21). These
bias signals are quite strong, in spite of the relatively
small number of QuikSCAT passes over major hurri-
canes analyzed in this study. For the 25-km QuikSCAT
retrievals, 15, 20, and 5 passes were analyzed for cate-
gory 3, 4, and 5 hurricanes, respectively. For the 12.5-km
retrievals, the corresponding numbers of passes ana-
lyzed were 14, 19, and 5.
It is obvious that in major hurricanes, rain contami-
nation, the horizontal resolution of the data, and satu-
ration of the backscatter signal at wind speeds greater
than about 90 kt (46.3 m s21), even in nonraining
FIG. 15. As in Fig. 11 but valid at 2126 UTC 6 Sep 2005 over Tropical Depression 16 (later
Ophelia). (Image courtesy of the Naval Research Laboratory.)
JUNE 2009 B R E N N A N E T A L . 637

FIG. 16. Comparison of 25- and 12.5-km QuikSCAT maximum winds (light and dark dashed
lines, respectively) to the maximum flight-level winds from aircraft reconnaissance adjusted to
the surface by a reduction factor of 0.9 (solid dark line) as well as the maximum wind from the
SFMR (dark circle) in Ophelia. Light solid line indicates final NHC best-track intensity. Bar
graphs depict the absolute difference between the QuikSCAT and flight-level winds or SFMR.
Dates and times of QuikSCAT passes are indicated along the x axis.
FIG. 17. Infrared GOES-12 imagery from 1145 UTC 9 Sep 2006 and isotachs from 12.5-km
QuikSCAT winds (contours) from 1127 UTC 9 Sep over Tropical Storm Ophelia. Maximum
wind location is indicated by an X and tropical storm symbol shows the approximate 1200 UTC
9 Sep 2006 NHC best-track position of Ophelia.
638 W E A T H E R A N D F O R E C A S T I N G VOLUME 24
conditions (e.g., Fernandez et al. 2006), make it im-
possible for QuikSCAT to measure the maximum wind
speed in the inner core. Future scatterometer instru-
ments must be able to measure hurricane-force winds
(up to and including category 5 strength) in heavy rain
conditions to be useful in the analysis of the intensity of
major hurricanes.
c. Ambiguity removal errors
At WVCs in the QuikSCAT swath, the ambiguity
closest to the median of the wind vectors in the neigh-
boring 7 3 7 area of WVCs is chosen with multiple
passes of a median filter designed to eliminate individ-
ual vectors that are inconsistent with their neighbors.
As a result of this spatial continuity constraint, errors
in ambiguity selection often occur in patches or lines.
The choice of the ‘‘wrong’’ ambiguity often results
in the chosen wind direction being 1808 out of phase
with the actual wind, and can also impact the wind speed
solution, though often not as severely. These errors
often degrade the ability of QuikSCAT to identify or
locate closed circulations, such as those associated
with TCs.
The choice of the wrong ambiguity in just a few lo-
cations can result in the automated QuikSCAT wind
solution misplacing or failing to identify the center of a
TC due to the spatial consistency constraint in the am-
biguity removal technique.
These errors in ambiguity removal are likely due to
1) poor depictions of TC structure and location in the
GFS model that is used to initialize the ambiguity
removal filter and
2) rain contamination resulting in a wind direction
oriented across the track of the satellite (Chelton
and Freilich 2005).
To quantify the robustness of QuikSCAT in identi-
fying TC centers and then to determine the degree of
accuracy in those centers that were identified, 25-km
NRT QuikSCAT wind vector solutions for 213 passes
over TCs during the 2002 eastern North Pacific and 2003
Atlantic seasons were analyzed. If a discernible center
was identified in the automated wind solution field, the
location of that fix was compared to the interpolated
position taken from the NHC best track.
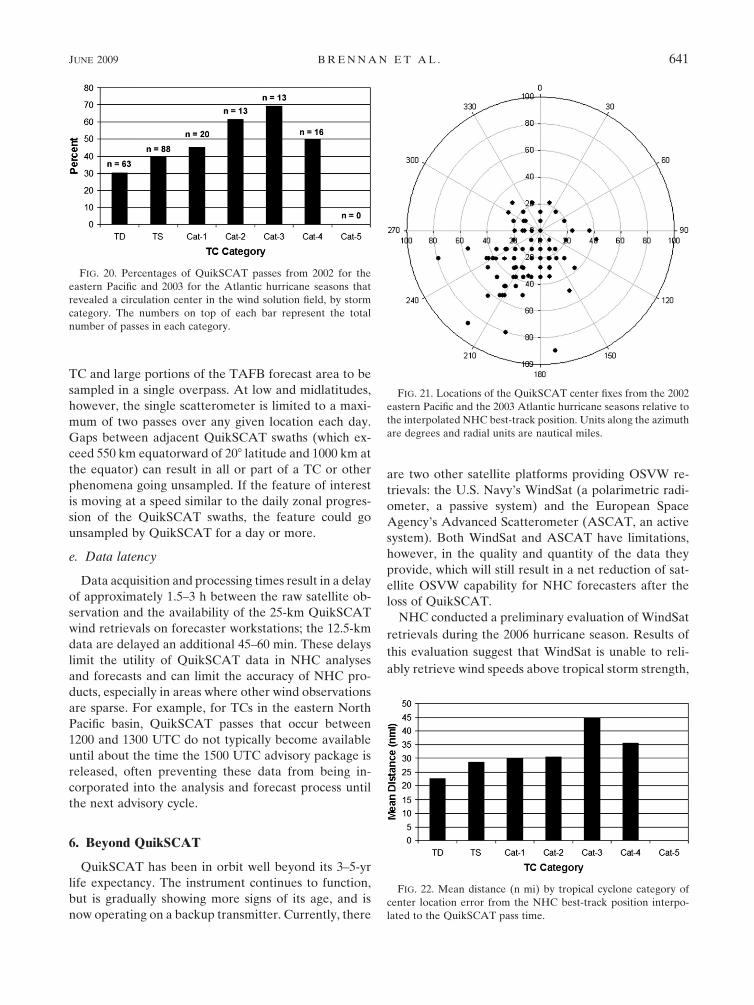
Only 88 (41%) of the passes examined identified a
circulation center. The likelihood of resolving a center
increased with the intensity of the TC. QuikSCAT
identified a center in only 30% of the tropical depres-
sions, while nearly 70% of the category 3 hurricanes had
FIG. 18. Surface wind speed (kt, large numerals) from the SFMR and time (UTC, small
numerals) of an observation in Tropical Storm Ophelia around 1200 UTC 9 Sep 2006. The
maximum wind measured by the SFMR around 1200 UTC was 58 kt near 29.08N, 79.38W. The
tropical storm symbol indicates the approximate 1200 UTC NHC best-track position of
Ophelia.
JUNE 2009 B R E N N A N E T A L . 639

a center in the automated wind solution (Fig. 20). This
result was expected since higher surface winds create
stronger backscatter at the ocean surface, increasing the
chances of a proper ambiguity solution. In addition, the
background GFS forecast wind field used in the ambi-
guity removal processes would be more likely to contain
a closed circulation for a stronger TC. The fact that
QuikSCAT often does not identify a circulation center
in weaker systems is especially unfortunate, as it is in
those cases that an accurate center location is most
needed, since there is no distinct eye.
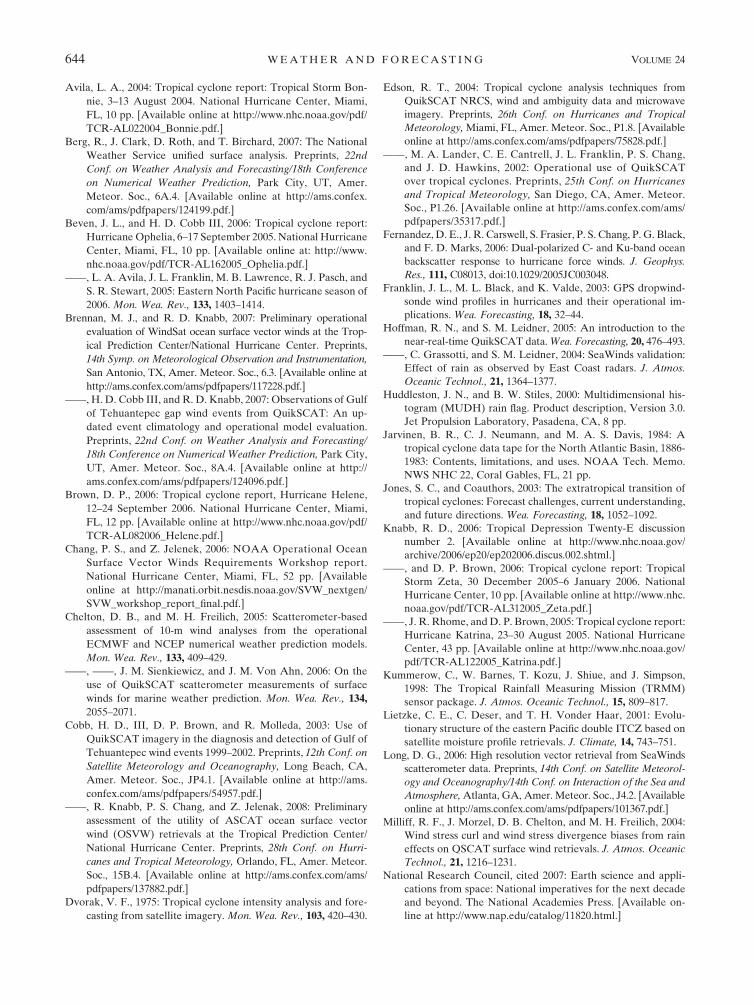
Figure 21 shows the range and azimuth error for all
center fixes that were identified. There is a discernible
directional bias toward the southwest in the automated
QuikSCAT solutions compared to the interpolated
NHC best-track position. It is believed that this bias is
due to deficiencies in the ambiguity selection algorithm
rather than a physical limitation of the scatterometer
itself. As noted above, a QuikSCAT pass directly over
the TC often results in the selection of across-swath
wind barbs (usually wind blowing from the east) near
the TC core due to rain contamination, resulting in
QuikSCAT resolving a center to the southwest of the
true center location (Fig. 2a). Although QuikSCAT
identified centers in only 30% of the tropical depres-
sions, the position errors for those center fixes are
smaller (;23 n mi average) than for any other category
(Fig. 22). In contrast, the average error is nearly twice as
large (45 n mi) in category 3 hurricanes.
Performing a manual ambiguity analysis (section 2a)
requires considerable time, and depending on forecaster
workload, cannot be performed on every QuikSCAT
pass. In addition, subjective interpretation of the ambi-
guities is required by the forecaster, which can still result
in uncertainty in the exact center location. As a result,
even by performing ambiguity analyses, NHC fore-
casters are unable to fully overcome the limitations of
QuikSCAT in TC center identification/fixing. Complete
elimination of ambiguity removal errors would require
a fundamentally different and enhanced type of mea-
surement from a future satellite that does not suffer from
such directional uncertainties near circulation centers.
d. Coverage gaps
The swath of data provided by QuikSCAT is 1800 km
wide, making it possible for the entire circulation of a
FIG. 19. As in Fig. 11 but valid at 1522 UTC 9 Sep 2005 over Tropical Storm Ophelia.
640 W E A T H E R A N D F O R E C A S T I N G VOLUME 24
TC and large portions of the TAFB forecast area to be
sampled in a single overpass. At low and midlatitudes,
however, the single scatterometer is limited to a maxi-
mum of two passes over any given location each day.
Gaps between adjacent QuikSCAT swaths (which ex-
ceed 550 km equatorward of 208 latitude and 1000 km at
the equator) can result in all or part of a TC or other
phenomena going unsampled. If the feature of interest
is moving at a speed similar to the daily zonal progres-
sion of the QuikSCAT swaths, the feature could go
unsampled by QuikSCAT for a day or more.
e. Data latency
Data acquisition and processing times result in a delay
of approximately 1.5–3 h between the raw satellite ob-
servation and the availability of the 25-km QuikSCAT
wind retrievals on forecaster workstations; the 12.5-km
data are delayed an additional 45–60 min. These delays
limit the utility of QuikSCAT data in NHC analyses
and forecasts and can limit the accuracy of NHC pro-
ducts, especially in areas where other wind observations
are sparse. For example, for TCs in the eastern North
Pacific basin, QuikSCAT passes that occur between
1200 and 1300 UTC do not typically become available
until about the time the 1500 UTC advisory package is
released, often preventing these data from being in-
corporated into the analysis and forecast process until
the next advisory cycle.
6. Beyond QuikSCAT
QuikSCAT has been in orbit well beyond its 3–5-yr
life expectancy. The instrument continues to function,
but is gradually showing more signs of its age, and is
now operating on a backup transmitter. Currently, there
are two other satellite platforms providing OSVW re-
trievals: the U.S. Navy’s WindSat (a polarimetric radi-
ometer, a passive system) and the European Space
Agency’s Advanced Scatterometer (ASCAT, an active
system). Both WindSat and ASCAT have limitations,
however, in the quality and quantity of the data they
provide, which will still result in a net reduction of sat-
ellite OSVW capability for NHC forecasters after the
loss of QuikSCAT.
NHC conducted a preliminary evaluation of WindSat
retrievals during the 2006 hurricane season. Results of
this evaluation suggest that WindSat is unable to reli-
ably retrieve wind speeds above tropical storm strength,
FIG. 20. Percentages of QuikSCAT passes from 2002 for the
eastern Pacific and 2003 for the Atlantic hurricane seasons that
revealed a circulation center in the wind solution field, by storm
category. The numbers on top of each bar represent the total
number of passes in each category.
FIG. 21. Locations of the QuikSCAT center fixes from the 2002
eastern Pacific and the 2003 Atlantic hurricane seasons relative to
the interpolated NHC best-track position. Units along the azimuth
are degrees and radial units are nautical miles.
FIG. 22. Mean distance (n mi) by tropical cyclone category of
center location error from the NHC best-track position interpo-
lated to the QuikSCAT pass time.
JUNE 2009 B R E N N A N E T A L . 641

leading to a large negative intensity bias for TCs ex-
ceeding an intensity of about 50 kt (25.7 m s21)
(Brennan and Knabb 2007). This represents a significant
reduction in capability from what has been available
from QuikSCAT (section 5b). The inability of WindSat
to reliably retrieve wind speeds as strong as those from
QuikSCAT is likely due to its lower resolution (50 km
for wind retrievals) and the impact of high cloud liquid
water values typically found in regions of strong winds
in TCs. It is clear to NHC that passive-only mea-
surements of OSVW in TCs are fundamentally less re-
liable than active-only measurements; therefore, WindSat
OSVW retrievals are not utilized by NHC in opera-
tional TC analysis. NHC forecasters do, however, fre-
quently view conventional passive microwave imagery
(primarily 37 GHz) of TCs from WindSat via Web sites
operated by the U.S. Navy.
In 2007, a preliminary evaluation of wind retrievals
from ASCAT, launched by the European Space Agency
in October 2006, was conducted in operations at NHC.
NHC’s TC and marine forecasters are now routinely
viewing ASCAT data on a daily basis in the course of
their operational shifts. The use of a C-band scatter-
ometer on ASCAT results in wind retrievals that are
less sensitive to rain, but ASCAT has less coverage (two
parallel 550-km-wide swaths) and lower resolution (the
highest-resolution ASCAT retrievals available are at
25 km) compared to QuikSCAT. The impacts of
ASCAT on NHC operations are not expected to ever be
as significant as QuikSCAT, because of the substantially
reduced data coverage arising from the narrower swaths
and an increased frequency at which ASCAT fails to
sample weather systems of interest. Using the data that
are available, ASCAT preliminarily appears to reliably
retrieve surface wind speeds of about 25–30 kt (12.9–
15.4 m s21) or less (below tropical storm or gale force)
in all weather conditions in NHC areas of responsibility
(Cobb et al. 2008). ASCAT appears to have a low wind
speed bias, which increases with increasing wind speed
for wind speeds exceeding about 25–30 kt (12.9–15.4
m s21), representing a degradation in capability in trop-
ical storms as compared to QuikSCAT.
WindSat, ASCAT, and even QuikSCAT do not meet
NHC’s operational needs for satellite OSVW. In an
effort to acquire satellite OSVW measurements that
do meet these needs and those of the rest of the NWS
and NOAA, operational NOAA users defined their
requirements for a next-generation OSVW mission
at a workshop held at NHC in June 2006 (Chang and
Jelenek 2006):
1) A greatly reduced or even nonexistent sensitivity to
rain, resulting in the capability to provide reliable
wind speed and direction retrievals regardless of rain
rate (no rain, light rain, or heavy rain).
2) The capability to accurately measure all sustained
wind speeds encountered in TCs, from 0 up to 165 kt
(the greatest maximum sustained wind speed in the
NHC best track database). Compared to QuikSCAT,
this capability would presumably require an increase
in horizontal resolution (to about 1–4 km to be
comparable with geostationary imagery) and an in-
creased sensitivity of the raw measurement to ex-
treme wind speeds.
3) Elimination of the directional ambiguity problem.
This is necessary, particularly for more accurate
position fixing of the center of a TC and/or for de-
termining if a closed circulation center exists at all
(a key factor in determining whether or not tropical
cyclogenesis has occurred).
4) More timely data availability, specifically reducing
the time of data receipt to a few minutes or less
following the time of data collection by the satellite.
5) Increasing the frequency of retrievals over each fixed
location in the NHC areas of responsibility to every
1–3 h by using multiple satellites to provide more
continuous monitoring of systems, especially in the
deep tropics.
Subsequent to the formulation of these requirements,
the National Academy of Sciences released a decadal
survey in January 2007 that recommended NOAA un-
dertake a next-generation ocean vector winds mission
(XOWVM; National Research Council 2007). XOWVM
would take a significant step toward meeting the oper-
ational requirements outlined above and result in a
substantial improvement over the quality of OSVW re-
trievals currently available from QuikSCAT. XOWVM
would greatly enhance the analysis, warning, and fore-
casting of TCs, particularly those not sampled by air-
craft reconnaissance, which includes the majority of
TCs globally. Even in TCs sampled by aircraft [e.g.,
Hurricane Katrina (2005) near landfall], there can still
be considerable uncertainty in the cyclone’s intensity
(Knabb et al. 2005), and a satellite such as XOWVM
would supplement aircraft reconnaissance for the anal-
ysis of cyclone intensity and size. In addition, XOWVM
would improve the analysis, forecasting, and warning of
other intense marine storms such as hurricane-force
extratropical cyclones as well as other marine wind
events.
7. Summary
The availability of QuikSCAT wind retrievals has
demonstrated both the utility and the limitations of
642 W E A T H E R A N D F O R E C A S T I N G VOLUME 24

OSVW in the operational environment at NHC. An
evaluation of these wind data at NHC has shown
promise, especially in terms of providing a spatially
consistent wind field over the tropical oceans, which are
typically void of dense surface observations. QuikSCAT
can provide useful information in the analysis of TCs,
and this is borne out by its frequent mention in NHC
tropical cyclone discussions. There are significant limi-
tations of the data, however, especially in the automated
solution, which make interpretation of the data difficult
and time consuming. For center location/identification
in TCs, the automated solution is often unreliable,
particularly in tropical depressions, whose centers are
often most difficult to identify and locate using con-
ventional satellite data. The shortfalls of the automated
solution often require a time-consuming manual anal-
ysis of the directional ambiguities to identify and/or
locate the center of a TC.
These trends are reinforced in a comparison of the
maximum retrieved wind speeds in QuikSCAT passes
over TCs to the NHC best-track intensity during 2005–
07. A strong positive bias was seen in the QuikSCAT
maximum wind in tropical depressions. In these cases,
the effects of rain contamination often render QuikSCAT
wind maxima of limited use in determining if a TC has
intensified from a depression to a tropical storm. How-
ever, NHC forecasters might have more confidence that
a system has become a tropical storm when QuikSCAT
winds just outside of rain areas approach tropical storm
strength.
A minimum in the bias of QuikSCAT intensity esti-
mates is seen in strong tropical storms. As wind speeds
in a TC increase to hurricane force, however, the utility
of QuikSCAT maximum wind estimates rapidly dimin-
ishes. For major hurricanes, the QuikSCAT maximum
wind has a very large negative bias, as the effects of rain,
resolution limitations, and signal saturation combine to
limit the instrument’s ability to retrieve wind speeds of
major hurricane intensity.
The QuikSCAT-retrieved wind speed is often useful
in analyzing the 34-kt (17.5 m s21) and occasionally
50-kt (25.7 m s21) wind radii in TCs, especially when the
34-kt wind radii extend outside areas of convection. For
tropical storms with areas of 34-kt QuikSCAT winds
embedded within convection, however, the interpreta-
tion of the data for wind radii analysis is less straight-
forward. This problem occurs because the sign of the
wind speed bias due to rain in QuikSCAT retrievals
reverses near the 34-kt wind threshold and interpreta-
tion is hindered by the lack of rain-rate information
from the QuikSCAT platform.
QuikSCAT data have been particularly valuable in
forecasting and analysis in the TAFB areas of respon-
sibility where conventional surface wind information is
sparse. QuikSCAT wind data have improved the anal-
ysis of surface features such as fronts, cyclones, and the
ITCZ, and have resulted in the more accurate identifi-
cation of wind warning areas. This is particularly true in
the case of gap wind events such as those in the Gulf of
Tehuantepec, where a climatology of gale- and storm-
force wind events has been constructed based largely on
QuikSCAT observations, improving forecasts and warn-
ings in these areas.
The limitations of QuikSCAT winds are also evident
in weather forecast and analysis applications in the
tropics, where the strongest winds are typically accom-
panied by rainfall that can degrade the quality of
QuikSCAT wind retrievals. The impact of rain and the
uncertainty introduced by directional ambiguity greatly
complicates the interpretation of these winds by fore-
casters in the time-constrained operational forecast
environment.
Future OSVW research at NHC will include contin-
ued evaluation of OSVW data from the European
ASCAT scatterometer on board the Meteorological
Operational Satellite Programme’s (METOP) satellite
in NHC operations. Also, a joint NOAA–NASA study
is currently under way to evaluate QuikSCAT replace-
ment options, including a next-generation satellite OSVW
mission that could come much closer to meeting NHC’s
operational requirements.
Acknowledgments. Funding to support this research
was provided by the National Ocean Partnership Pro-
gram and by research to operations funding through
NOAA/NESDIS. In addition, the first two authors
conducted portions of this research while participating
in the UCAR Visiting Scientist Program under the di-
rection of the third author at the National Hurricane
Center (NHC). Thanks to Joni David of NHC who
provided assistance in creating Fig. 1. Thanks to Dr.
Chris Landsea, Lt. Cdr. David Roberts, James Franklin,
and Jamie Rhome of NHC for providing comments on
this manuscript. Special appreciation is extended to Dr.
Paul Chang and Dr. Zorana Jelenak (NOAA/NESDIS),
James Franklin and Hugh Cobb (NHC), Joan Von Ahn
and Joseph Sienkiewicz (Ocean Prediction Center), and
Roger Edson (NWS Guam) who provided data, analysis,
and valuable insights for this work. Finally, thanks is ex-
tended to three reviewers who provided many helpful
suggestions to improve this manuscript.
REFERENCES
Atlas, R., and Coauthors, 2001: The effects of marine winds from
scatterometer data on weather analysis and forecasting. Bull.
Amer. Meteor. Soc., 82, 1965–1990.
JUNE 2009 B R E N N A N E T A L . 643
Avila, L. A., 2004: Tropical cyclone report: Tropical Storm Bon-
nie, 3–13 August 2004. National Hurricane Center, Miami,
FL, 10 pp. [Available online at http://www.nhc.noaa.gov/pdf/
TCR-AL022004_Bonnie.pdf.]
Berg, R., J. Clark, D. Roth, and T. Birchard, 2007: The National
Weather Service unified surface analysis. Preprints, 22nd
Conf. on Weather Analysis and Forecasting/18th Conference
on Numerical Weather Prediction, Park City, UT, Amer.
Meteor. Soc., 6A.4. [Available online at http://ams.confex.
com/ams/pdfpapers/124199.pdf.]
Beven, J. L., and H. D. Cobb III, 2006: Tropical cyclone report:
Hurricane Ophelia, 6–17 September 2005. National Hurricane
Center, Miami, FL, 10 pp. [Available online at: http://www.
nhc.noaa.gov/pdf/TCR-AL162005_Ophelia.pdf.]
——, L. A. Avila, J. L. Franklin, M. B. Lawrence, R. J. Pasch, and
S. R. Stewart, 2005: Eastern North Pacific hurricane season of
2006. Mon. Wea. Rev., 133, 1403–1414.
Brennan, M. J., and R. D. Knabb, 2007: Preliminary operational
evaluation of WindSat ocean surface vector winds at the Trop-
ical Prediction Center/National Hurricane Center. Preprints,
14th Symp. on Meteorological Observation and Instrumentation,
San Antonio, TX, Amer. Meteor. Soc., 6.3. [Available online at
http://ams.confex.com/ams/pdfpapers/117228.pdf.]
——, H. D. Cobb III, and R. D. Knabb, 2007: Observations of Gulf
of Tehuantepec gap wind events from QuikSCAT: An up-
dated event climatology and operational model evaluation.
Preprints, 22nd Conf. on Weather Analysis and Forecasting/
18th Conference on Numerical Weather Prediction, Park City,
UT, Amer. Meteor. Soc., 8A.4. [Available online at http://
ams.confex.com/ams/pdfpapers/124096.pdf.]
Brown, D. P., 2006: Tropical cyclone report, Hurricane Helene,
12–24 September 2006. National Hurricane Center, Miami,
FL, 12 pp. [Available online at http://www.nhc.noaa.gov/pdf/
TCR-AL082006_Helene.pdf.]
Chang, P. S., and Z. Jelenek, 2006: NOAA Operational Ocean
Surface Vector Winds Requirements Workshop report.
National Hurricane Center, Miami, FL, 52 pp. [Available
online at http://manati.orbit.nesdis.noaa.gov/SVW_nextgen/
SVW_workshop_report_final.pdf.]
Chelton, D. B., and M. H. Freilich, 2005: Scatterometer-based
assessment of 10-m wind analyses from the operational
ECMWF and NCEP numerical weather prediction models.
Mon. Wea. Rev., 133, 409–429.
——, ——, J. M. Sienkiewicz, and J. M. Von Ahn, 2006: On the
use of QuikSCAT scatterometer measurements of surface
winds for marine weather prediction. Mon. Wea. Rev., 134,
2055–2071.
Cobb, H. D., III, D. P. Brown, and R. Molleda, 2003: Use of
QuikSCAT imagery in the diagnosis and detection of Gulf of
Tehuantepec wind events 1999–2002. Preprints, 12th Conf. on
Satellite Meteorology and Oceanography, Long Beach, CA,
Amer. Meteor. Soc., JP4.1. [Available online at http://ams.
confex.com/ams/pdfpapers/54957.pdf.]
——, R. Knabb, P. S. Chang, and Z. Jelenak, 2008: Preliminary
assessment of the utility of ASCAT ocean surface vector
wind (OSVW) retrievals at the Tropical Prediction Center/
National Hurricane Center. Preprints, 28th Conf. on Hurri-
canes and Tropical Meteorology, Orlando, FL, Amer. Meteor.
Soc., 15B.4. [Available online at http://ams.confex.com/ams/
pdfpapers/137882.pdf.]
Dvorak, V. F., 1975: Tropical cyclone intensity analysis and fore-
casting from satellite imagery. Mon. Wea. Rev., 103, 420–430.
Edson, R. T., 2004: Tropical cyclone analysis techniques from
QuikSCAT NRCS, wind and ambiguity data and microwave
imagery. Preprints, 26th Conf. on Hurricanes and Tropical
Meteorology, Miami, FL, Amer. Meteor. Soc., P1.8. [Available
online at http://ams.confex.com/ams/pdfpapers/75828.pdf.]
——, M. A. Lander, C. E. Cantrell, J. L. Franklin, P. S. Chang,
and J. D. Hawkins, 2002: Operational use of QuikSCAT
over tropical cyclones. Preprints, 25th Conf. on Hurricanes
and Tropical Meteorology, San Diego, CA, Amer. Meteor.
Soc., P1.26. [Available online at http://ams.confex.com/ams/
pdfpapers/35317.pdf.]
Fernandez, D. E., J. R. Carswell, S. Frasier, P. S. Chang, P. G. Black,
and F. D. Marks, 2006: Dual-polarized C- and Ku-band ocean
backscatter response to hurricane force winds. J. Geophys.
Res., 111, C08013, doi:10.1029/2005JC003048.
Franklin, J. L., M. L. Black, and K. Valde, 2003: GPS dropwind-
sonde wind profiles in hurricanes and their operational im-
plications. Wea. Forecasting, 18, 32–44.
Hoffman, R. N., and S. M. Leidner, 2005: An introduction to the
near-real-time QuikSCAT data. Wea. Forecasting, 20, 476–493.
——, C. Grassotti, and S. M. Leidner, 2004: SeaWinds validation:
Effect of rain as observed by East Coast radars. J. Atmos.
Oceanic Technol., 21, 1364–1377.
Huddleston, J. N., and B. W. Stiles, 2000: Multidimensional his-
togram (MUDH) rain flag. Product description, Version 3.0.
Jet Propulsion Laboratory, Pasadena, CA, 8 pp.
Jarvinen, B. R., C. J. Neumann, and M. A. S. Davis, 1984: A
tropical cyclone data tape for the North Atlantic Basin, 1886-
1983: Contents, limitations, and uses. NOAA Tech. Memo.
NWS NHC 22, Coral Gables, FL, 21 pp.
Jones, S. C., and Coauthors, 2003: The extratropical transition of
tropical cyclones: Forecast challenges, current understanding,
and future directions. Wea. Forecasting, 18, 1052–1092.
Knabb, R. D., 2006: Tropical Depression Twenty-E discussion
number 2. [Available online at http://www.nhc.noaa.gov/
archive/2006/ep20/ep202006.discus.002.shtml.]
——, and D. P. Brown, 2006: Tropical cyclone report: Tropical
Storm Zeta, 30 December 2005–6 January 2006. National
Hurricane Center, 10 pp. [Available online at http://www.nhc.
noaa.gov/pdf/TCR-AL312005_Zeta.pdf.]
——, J. R. Rhome, and D. P. Brown, 2005: Tropical cyclone report:
Hurricane Katrina, 23–30 August 2005. National Hurricane
Center, 43 pp. [Available online at http://www.nhc.noaa.gov/
pdf/TCR-AL122005_Katrina.pdf.]
Kummerow, C., W. Barnes, T. Kozu, J. Shiue, and J. Simpson,
1998: The Tropical Rainfall Measuring Mission (TRMM)
sensor package. J. Atmos. Oceanic Technol., 15, 809–817.
Lietzke, C. E., C. Deser, and T. H. Vonder Haar, 2001: Evolu-
tionary structure of the eastern Pacific double ITCZ based on
satellite moisture profile retrievals. J. Climate, 14, 743–751.
Long, D. G., 2006: High resolution vector retrieval from SeaWinds
scatterometer data. Preprints, 14th Conf. on Satellite Meteorol-
ogy and Oceanography/14th Conf. on Interaction of the Sea and
Atmosphere, Atlanta, GA, Amer. Meteor. Soc., J4.2. [Available
online at http://ams.confex.com/ams/pdfpapers/101367.pdf.]
Milliff, R. F., J. Morzel, D. B. Chelton, and M. H. Freilich, 2004:
Wind stress curl and wind stress divergence biases from rain
effects on QSCAT surface wind retrievals. J. Atmos. Oceanic
Technol., 21, 1216–1231.
National Research Council, cited 2007: Earth science and appli-
cations from space: National imperatives for the next decade
and beyond. The National Academies Press. [Available on-
line at http://www.nap.edu/catalog/11820.html.]
644 W E A T H E R A N D F O R E C A S T I N G VOLUME 24
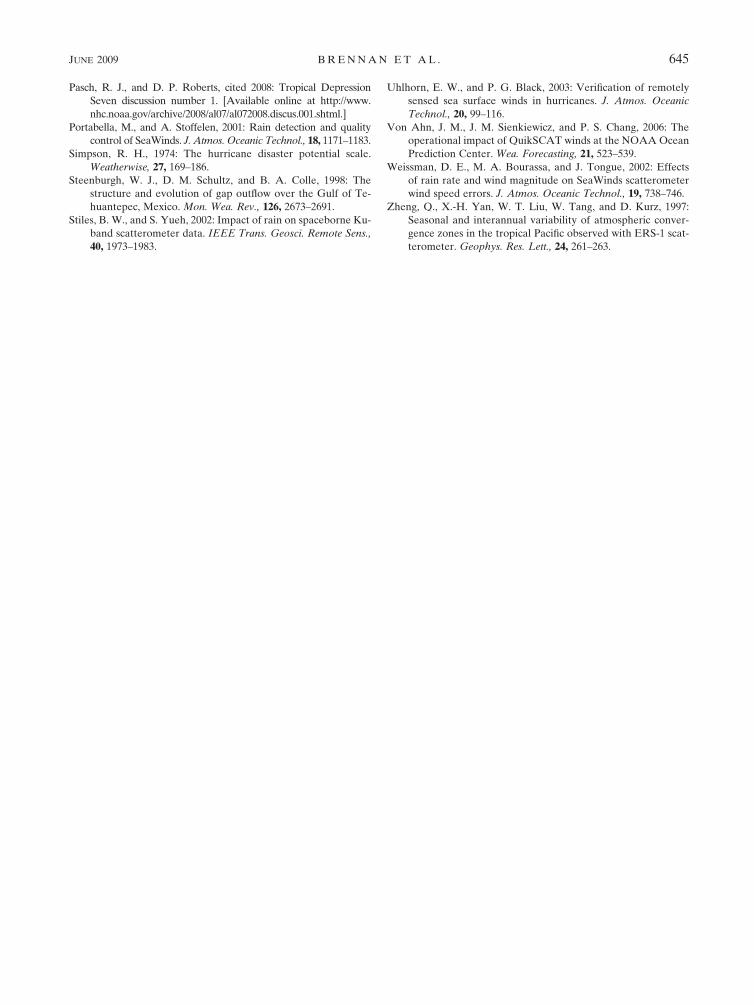
Pasch, R. J., and D. P. Roberts, cited 2008: Tropical Depression
Seven discussion number 1. [Available online at http://www.
nhc.noaa.gov/archive/2008/al07/al072008.discus.001.shtml.]
Portabella, M., and A. Stoffelen, 2001: Rain detection and quality
control of SeaWinds. J. Atmos. Oceanic Technol., 18, 1171–1183.
Simpson, R. H., 1974: The hurricane disaster potential scale.
Weatherwise, 27, 169–186.
Steenburgh, W. J., D. M. Schultz, and B. A. Colle, 1998: The
structure and evolution of gap outflow over the Gulf of Te-
huantepec, Mexico. Mon. Wea. Rev., 126, 2673–2691.
Stiles, B. W., and S. Yueh, 2002: Impact of rain on spaceborne Ku-
band scatterometer data. IEEE Trans. Geosci. Remote Sens.,
40, 1973–1983.
Uhlhorn, E. W., and P. G. Black, 2003: Verification of remotely
sensed sea surface winds in hurricanes. J. Atmos. Oceanic
Technol., 20, 99–116.
Von Ahn, J. M., J. M. Sienkiewicz, and P. S. Chang, 2006: The
operational impact of QuikSCAT winds at the NOAA Ocean
Prediction Center. Wea. Forecasting, 21, 523–539.
Weissman, D. E., M. A. Bourassa, and J. Tongue, 2002: Effects
of rain rate and wind magnitude on SeaWinds scatterometer
wind speed errors. J. Atmos. Oceanic Technol., 19, 738–746.
Zheng, Q., X.-H. Yan, W. T. Liu, W. Tang, and D. Kurz, 1997:
Seasonal and interannual variability of atmospheric conver-
gence zones in the tropical Pacific observed with ERS-1 scat-
terometer. Geophys. Res. Lett., 24, 261–263.
JUNE 2009 B R E N N A N E T A L . 645


