1 1
Akira Suehiro, Prof. Institute of Social Science,
University of Tokyo Carnegie Endowment for
International Peace, February 2015
The Middle Income Trap and Thai Corporate
Strategy in the Era of AEC (Digest Version)

2 2
Contents of My Presentation
1. Economic Performance and Trade Structure
2. The Middle-income Trap in Thailand 3. Big Firms and Revival of Family
Business 4. New Strategies of Thai Big
Corporations 5. Alternative to the East Asian Model
3 3
Part 1 Economic Performance
and Trade Structure
4 4
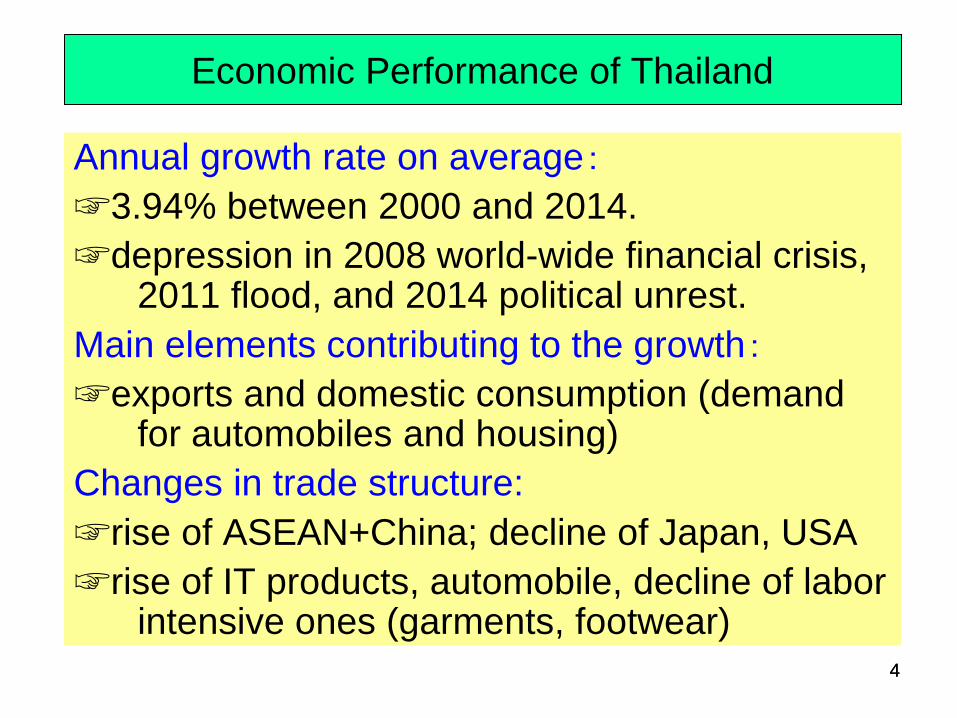
Economic Performance of Thailand
Annual growth rate on average: ☞3.94% between 2000 and 2014. ☞depression in 2008 world-wide financial crisis,
2011 flood, and 2014 political unrest. Main elements contributing to the growth: ☞exports and domestic consumption (demand
for automobiles and housing) Changes in trade structure: ☞rise of ASEAN+China; decline of Japan, USA ☞rise of IT products, automobile, decline of labor
intensive ones (garments, footwear)

5 5
1-1 Overview of Thailand Economy, 1996-2015
[Notes] (1) The scale of export is shown in a left-hand side, while growth rate in a right-hand side.
(2) Growth rates in 2014 and 2015 are addressed by NESDB in November 2014.
[Source] Compiled by Suehiro on the basis of Bank of Thailand website.
Figure 1-1 Overview of Thailand Economy, 1996-2015 (US$ Billion, %)
5.8
-1.4
-10.5
4.4 4.8
2.2
5.3
7.16.3
4.6
5.24.9
2.5
-2.3
7.8
0.1
6.5 2.9
1.2
4.5
-12.0
-10.0
-8.0
-6.0
-4.0
-2.0
0.0
2.0
4.0
6.0
8.0
0.0
50.0
100.0
150.0
200.0
250.0
1996 1998 2000 2002 2004 2006 2008 2010 2012 2014
Exports Growth rate
1997 Asian currency crisis
2008 World financial crisis
Flood
Slow-pace growth in exports since 2012
6 6
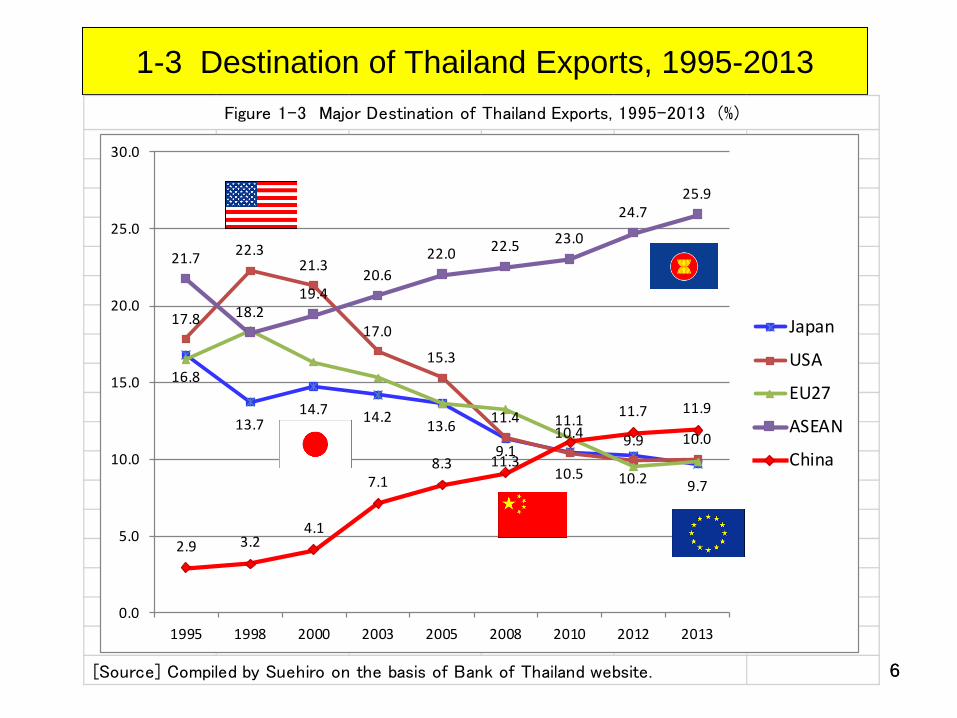
1-3 Destination of Thailand Exports, 1995-2013
[Source] Compiled by Suehiro on the basis of Bank of Thailand website.
Figure 1-3 Major Destination of Thailand Exports, 1995-2013 (%)
16.8
13.714.7 14.2 13.6
11.310.5 10.2 9.7
17.8
22.321.3
17.0
15.3
11.410.4 9.9 10.0
21.7
18.219.4
20.622.0 22.5 23.0
24.725.9
2.9 3.24.1
7.18.3
9.1
11.1 11.7 11.9
0.0
5.0
10.0
15.0
20.0
25.0
30.0
1995 1998 2000 2003 2005 2008 2010 2012 2013
Japan
USA
EU27
ASEAN
China

7 7
1-4. Diversification of Exportable Commodities, 1981-2014
Export Total
Million Baht Agriculture Agro industry Garments Electronics Automobile
1981 153,001 49.4 9.0 7.4 4.3 0.1
1985 193,366 40.7 12.6 11.0 4.7 0.2
1990 589,813 22.2 12.0 13.3 14.2 0.7
1996 1,378,902 12.5 12.2 10.0 22.4 1.9
2000 2,730,943 7.4 10.8 8.2 26.1 4.6
2005 4,406,673 7.4 10.2 6.1 22.4 8.7
2008 5,831,086 9.3 10.5 4.1 18.1 11.1
2010 6,060,184 9.1 11.3 4.1 17.5 11.7
2013 6,927,604 8.2 12.1 3.3 14.3 13.8
*2014/1-11 6,697,098 8.7 12.0 3.3 14.6 13.9
[Notes] (1) Agriculture include rice, tapioca, natural rubber, fronzen chickens, frozen shrimps etc.
(2) Agro include sugar, canned tuna, canned fruits etc. (3) Garments include yarns and fabrics.
(4) Electronics include computer parts, integrated circuits and telecommunication equipments.
[Sources] 1981-1990: Ministry of Commerce ; 1996-2014: Bank of Thailand website
1-4 Changes in Export Structure by Major Commodities Group, 1981-2014
Composition of Major Commodity Groups, 1981-2014 (%)Year
advantages for local firms foreign firms' advantage

8 8
Economic Problems Facing Thailand
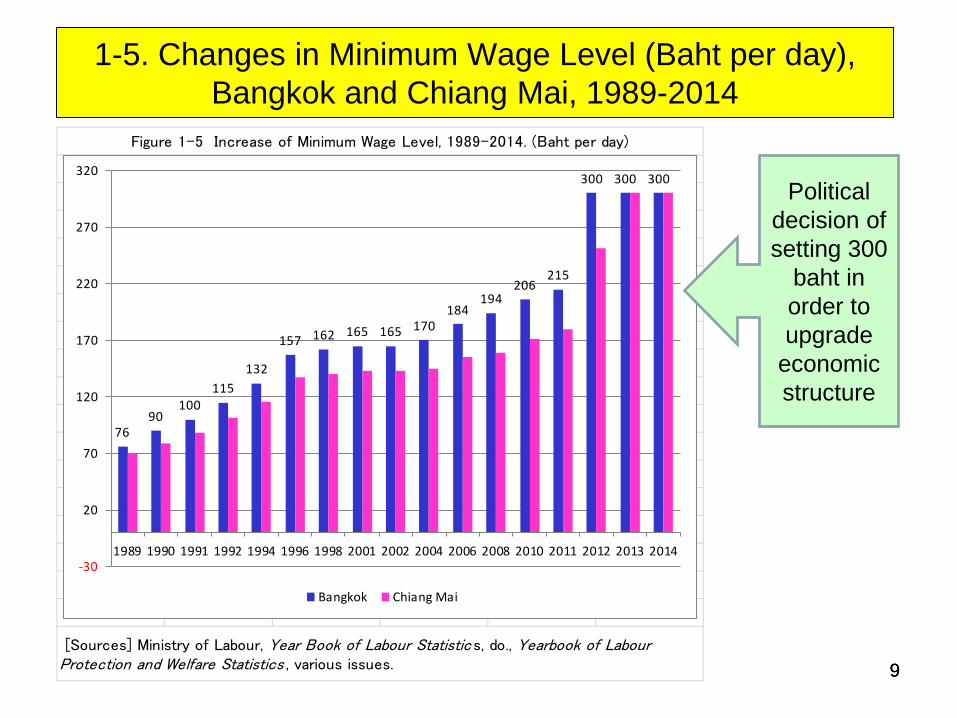
Stagnant in exports: Increase of minimum wage level: ☞uniformly introduced “300 baht per day” The end of demographic bonus, the coming of
aging society with smaller number of children. ☞the annual growth rate of working-age
population is decreasing. The absolute shortage of labor force in
unskilled labor markets. ☞depending on migrant workers from Myanmar,
Laos and Cambodia, 1.8 million persons
9 9
1-5. Changes in Minimum Wage Level (Baht per day), Bangkok and Chiang Mai, 1989-2014
[Sources] Ministry of Labour, Year Book of Labour Statistic s, do., Yearbook of Labour Protection and Welfare Statistics , various issues.
Figure 1-5 Increase of Minimum Wage Level, 1989-2014. (Baht per day)
7690
100115
132
157 162 165 165 170184
194206
215
300 300 300
-30
20
70
120
170
220
270
320
1989 1990 1991 1992 1994 1996 1998 2001 2002 2004 2006 2008 2010 2011 2012 2013 2014
Bangkok Chiang Mai
Political decision of setting 300
baht in order to upgrade
economic structure
10 10
Part 2 The Middle-income Trap
in Thailand

11 11
What is the Middle-Income Trap?
1. “East Asian Miracle” is a Myth, because their economic success are due mainly to continuous input of both cheap labor force and capital including foreign capital (low-cost-advantage).
2. Rising wage-level and re-allocation of FDI will inevitably lead East Asian countries to the so-called middle income trap (☞ slow-down of growth rates).
3. China or other emerging East Asia cannot compete with lower income countries because of rising wage on one hand, they are unable to compete with higher income countries because of lower value production and little innovation on the other.
12 12
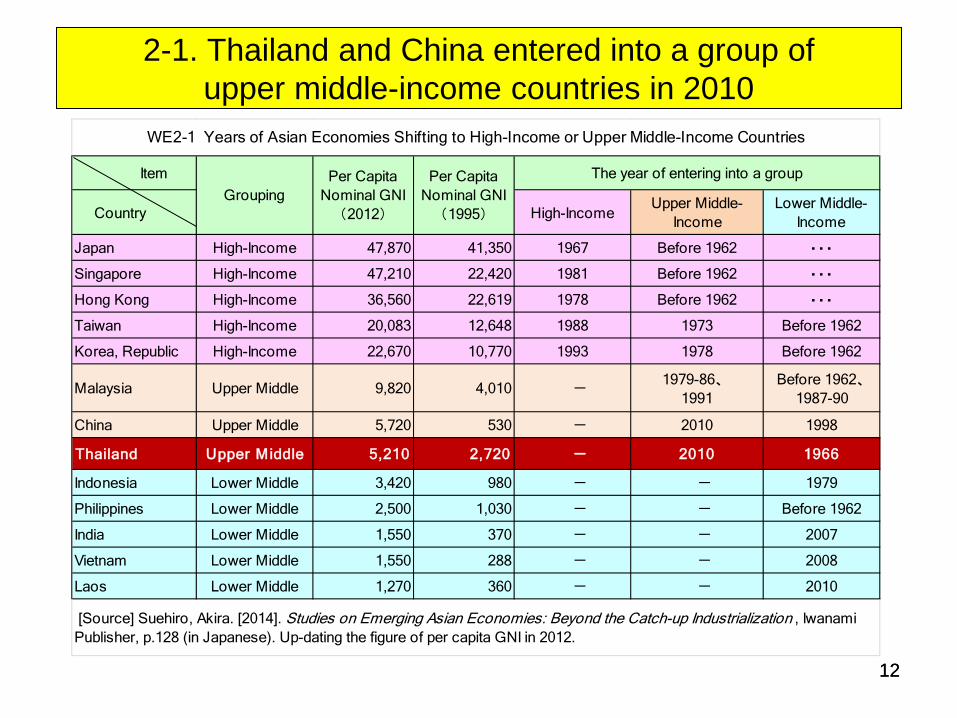
2-1. Thailand and China entered into a group of upper middle-income countries in 2010
Item
Country High-IncomeUpper Middle-
IncomeLower Middle-
Income
Japan High-Income 47,870 41,350 1967 Before 1962 ・・・
Singapore High-Income 47,210 22,420 1981 Before 1962 ・・・
Hong Kong High-Income 36,560 22,619 1978 Before 1962 ・・・
Taiwan High-Income 20,083 12,648 1988 1973 Before 1962
Korea, Republic High-Income 22,670 10,770 1993 1978 Before 1962
Malaysia Upper Middle 9,820 4,010 -1979-86、
1991Before 1962、
1987-90
China Upper Middle 5,720 530 - 2010 1998
Thailand Upper Middle 5,210 2,720 - 2010 1966
Indonesia Lower Middle 3,420 980 - - 1979
Philippines Lower Middle 2,500 1,030 - - Before 1962
India Lower Middle 1,550 370 - - 2007
Vietnam Lower Middle 1,550 288 - - 2008
Laos Lower Middle 1,270 360 - - 2010
[Source] Suehiro, Akira. [2014]. Studies on Emerging Asian Economies: Beyond the Catch-up Industrialization , IwanamiPublisher, p.128 (in Japanese). Up-dating the figure of per capita GNI in 2012.
WE2-1 Years of Asian Economies Shifting to High-Income or Upper Middle-Income Countries
GroupingPer Capita
Nominal GNI(1995)
Per CapitaNominal GNI
(2012)
The year of entering into a group
13 13
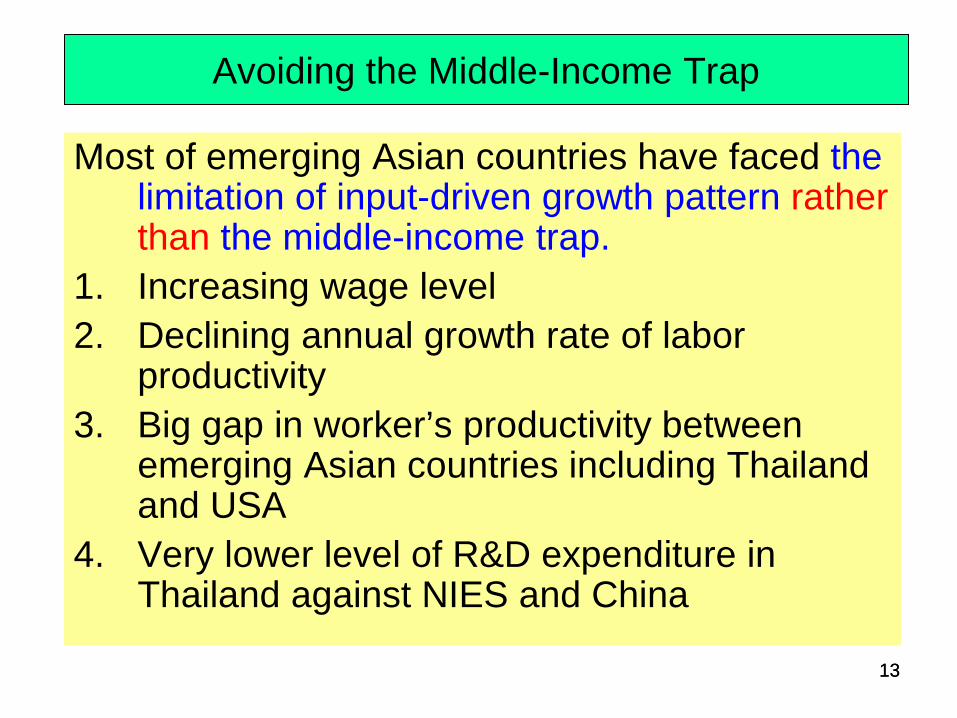
Avoiding the Middle-Income Trap
Most of emerging Asian countries have faced the limitation of input-driven growth pattern rather than the middle-income trap.
1. Increasing wage level 2. Declining annual growth rate of labor
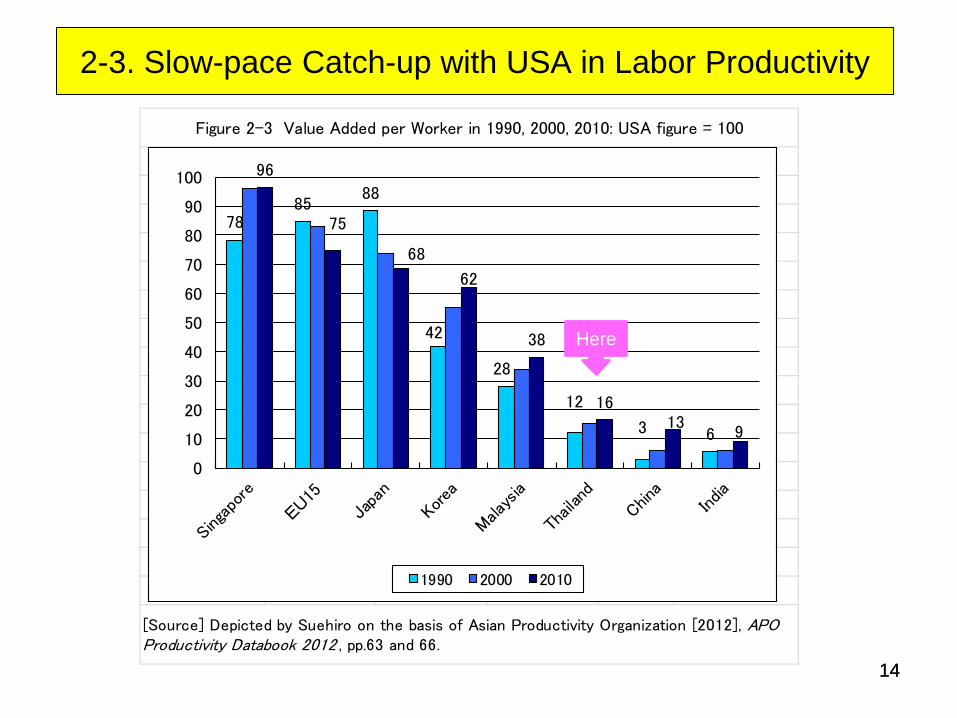
productivity 3. Big gap in worker’s productivity between
emerging Asian countries including Thailand and USA
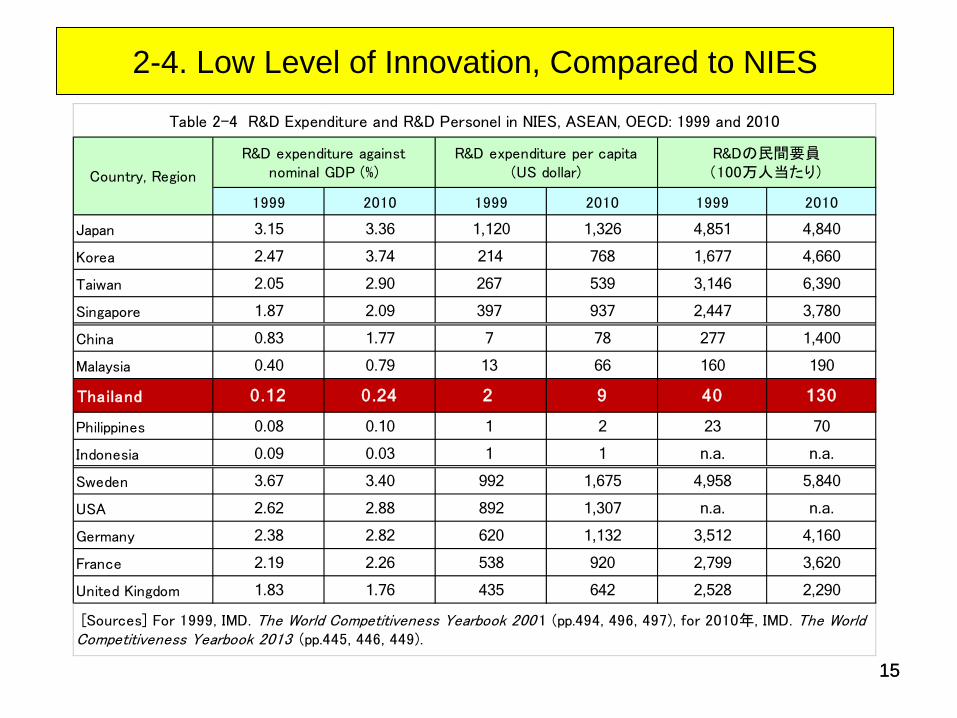
4. Very lower level of R&D expenditure in Thailand against NIES and China
14 14
2-3. Slow-pace Catch-up with USA in Labor Productivity
[Source] Depicted by Suehiro on the basis of Asian Productivity Organization [2012], APOProductivity Databook 2012 , pp.63 and 66.
Figure 2-3 Value Added per Worker in 1990, 2000, 2010: USA figure = 100
7885
88
42
28
12
3 6
96
75
68
62
38
1613
9
0
10
20
30
40
50
60
70
80
90
100
1990 2000 2010
Here
15 15
2-4. Low Level of Innovation, Compared to NIES
1999 2010 1999 2010 1999 2010
Japan 3.15 3.36 1,120 1,326 4,851 4,840
Korea 2.47 3.74 214 768 1,677 4,660
Taiwan 2.05 2.90 267 539 3,146 6,390
Singapore 1.87 2.09 397 937 2,447 3,780
China 0.83 1.77 7 78 277 1,400
Malaysia 0.40 0.79 13 66 160 190
Thailand 0.12 0.24 2 9 40 130
Philippines 0.08 0.10 1 2 23 70
Indonesia 0.09 0.03 1 1 n.a. n.a.
Sweden 3.67 3.40 992 1,675 4,958 5,840
USA 2.62 2.88 892 1,307 n.a. n.a.
Germany 2.38 2.82 620 1,132 3,512 4,160
France 2.19 2.26 538 920 2,799 3,620
United Kingdom 1.83 1.76 435 642 2,528 2,290
R&D expenditure againstnominal GDP (%)
R&D expenditure per capita(US dollar)
R&Dの民間要員(100万人当たり)
Table 2-4 R&D Expenditure and R&D Personel in NIES, ASEAN, OECD: 1999 and 2010
Country, Region
[Sources] For 1999, IMD. The World Competitiveness Yearbook 200 1 (pp.494, 496, 497), for 2010年, IMD. The WorldCompetitiveness Yearbook 2013 (pp.445, 446, 449).
16 16
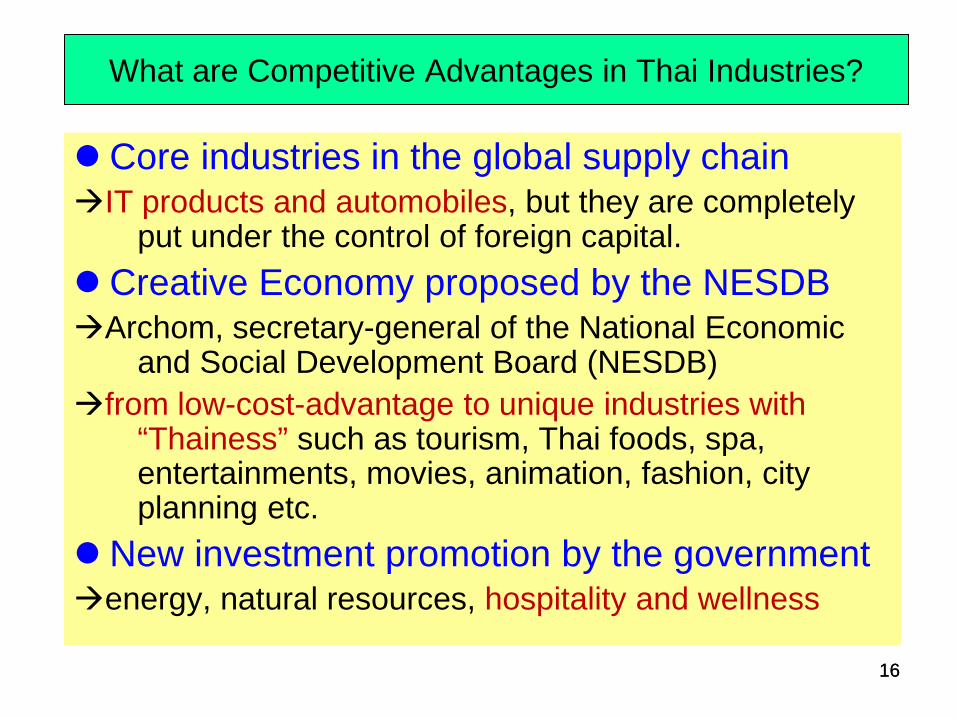
What are Competitive Advantages in Thai Industries?
Core industries in the global supply chain IT products and automobiles, but they are completely
put under the control of foreign capital. Creative Economy proposed by the NESDB Archom, secretary-general of the National Economic
and Social Development Board (NESDB) from low-cost-advantage to unique industries with
“Thainess” such as tourism, Thai foods, spa, entertainments, movies, animation, fashion, city planning etc.
New investment promotion by the government energy, natural resources, hospitality and wellness
17 17
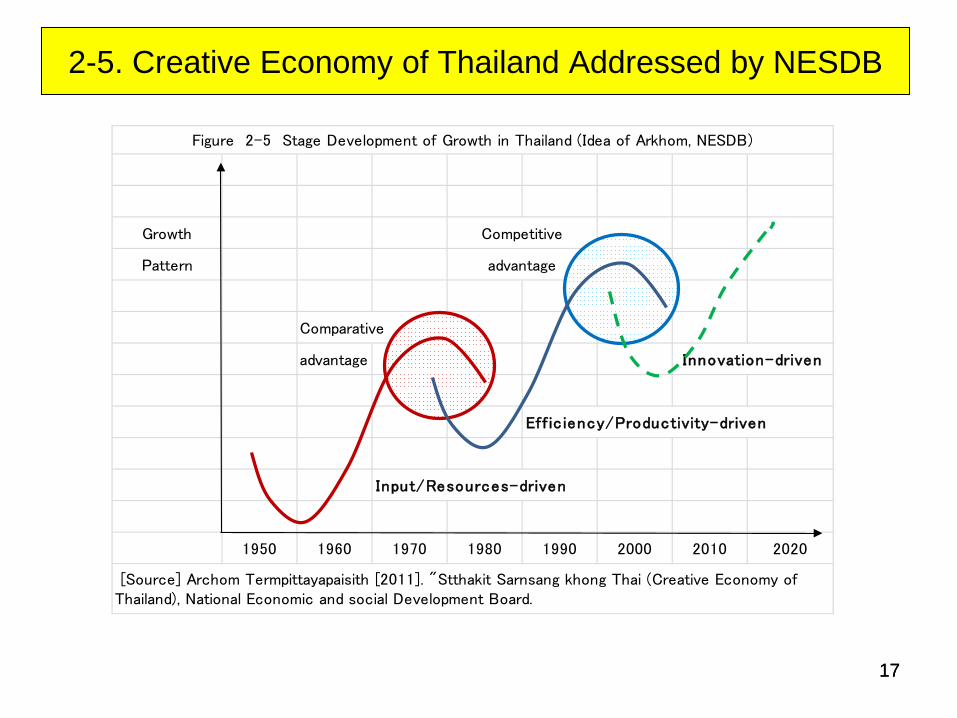
2-5. Creative Economy of Thailand Addressed by NESDB
Growth
Pattern
Comparative
advantage Innovation-driven
Eff ic iency/Productivity-driven
Input/Resources-driven
1950 1960 1970 1980 1990 2000 2010 2020
Competitive
advantage
Figure 2-5 Stage Development of Growth in Thailand (Idea of Arkhom, NESDB)
[Source] Archom Termpittayapaisith [2011]. "Stthakit Sarnsang khong Thai (Creative Economy ofThailand), National Economic and social Development Board.

18 18
Part 3 Big Firms and
Revival of Family Business
19 19
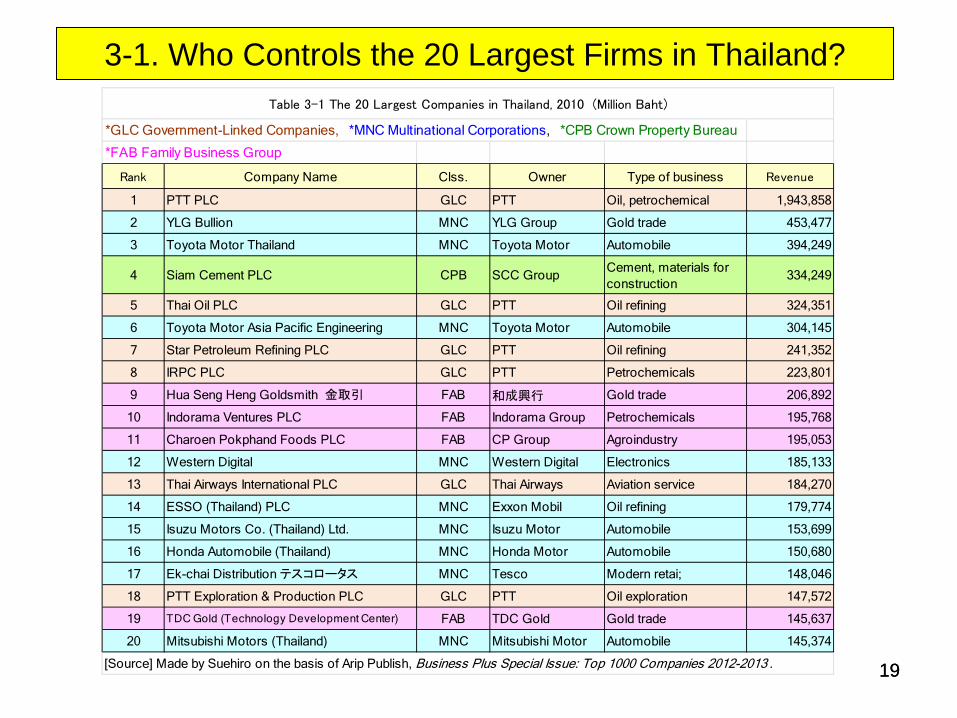
3-1. Who Controls the 20 Largest Firms in Thailand?
*GLC Government-Linked Companies, *MNC Multinational Corporations, *CPB Crown Property Bureau
*FAB Family Business Group
Rank Company Name Clss. Owner Type of business Revenue
1 PTT PLC GLC PTT Oil, petrochemical 1,943,858
2 YLG Bullion MNC YLG Group Gold trade 453,477
3 Toyota Motor Thailand MNC Toyota Motor Automobile 394,249
4 Siam Cement PLC CPB SCC Group Cement, materials forconstruction
334,249
5 Thai Oil PLC GLC PTT Oil refining 324,351
6 Toyota Motor Asia Pacific Engineering MNC Toyota Motor Automobile 304,145
7 Star Petroleum Refining PLC GLC PTT Oil refining 241,352
8 IRPC PLC GLC PTT Petrochemicals 223,801
9 Hua Seng Heng Goldsmith 金取引 FAB 和成興行 Gold trade 206,892
10 Indorama Ventures PLC FAB Indorama Group Petrochemicals 195,768
11 Charoen Pokphand Foods PLC FAB CP Group Agroindustry 195,053
12 Western Digital MNC Western Digital Electronics 185,133
13 Thai Airways International PLC GLC Thai Airways Aviation service 184,270
14 ESSO (Thailand) PLC MNC Exxon Mobil Oil refining 179,774
15 Isuzu Motors Co. (Thailand) Ltd. MNC Isuzu Motor Automobile 153,699
16 Honda Automobile (Thailand) MNC Honda Motor Automobile 150,680
17 Ek-chai Distribution テスコロータス MNC Tesco Modern retai; 148,046
18 PTT Exploration & Production PLC GLC PTT Oil exploration 147,572
19 TDC Gold (Technology Development Center) FAB TDC Gold Gold trade 145,637
20 Mitsubishi Motors (Thailand) MNC Mitsubishi Motor Automobile 145,374
[Source] Made by Suehiro on the basis of Arip Publish, Business Plus Special Issue: Top 1000 Companies 2012-2013 .
Table 3-1 The 20 Largest Companies in Thailand, 2010 (Million Baht)

20 20
3-2. Decline and Revival of Family Business, 1989-2010
Ownesrhip Pattern 1989 1997 2000 2004 2010
Number of firms 100 100 100 100 100
①State enterprises (listed) 5.0 9.0 13.0 14.0 14.0
②Crown Property Bureau 7.0 5.0 5.0 7.0 8.0
③Family-owned (Zaibatsu) 50.0 46.0 32.0 19.0 24.0
④Widely-held firms (Independent) 3.0 5.0 3.0 5.0 3.0
⑤Foreign firms (MNC) 33.0 30.0 47.0 55.0 51.0
--Japanese firms 17.0 18.0 20.0 28.0 24.0
Sales or Turnover 719,145 2,439,113 2,847,566 4,979,761 11,650,651
①State enterprises (listed) 14.9 15.7 19.3 32.7 31.6
②Crown Property Bureau 7.5 4.7 4.7 4.8 6.4
③Family-owned (Zaibatsu) 42.6 48.3 27.9 11.6 18.3
④Widely-held firms (Independent) 3.0 2.1 1.2 2.8 2.0
⑤Foreign firms (MNC) 32.0 29.2 46.9 48.1 41.8
--Japanese firms 14.8 18.4 16.4 24.1 19.8
[Note] Crown Property Bureau include the Siam Cement Group (SCG) and the Siam Commercial Bank Group (SCB).
[Source] Arranged by Suehiro on the basis of his own company database of Thailand 1979-2014.
(2) Distribution of sales or turnover (Million Baht)
(1) Number of Firms (total 100)
Table 3-2 The 100 Largest Companies in Thailand, by Ownership Pattern, 1989-2010 (Million Bahts, %)

21 21
3-4. 7-Eleven: Thailand is the 2nd Position in the World, Following Japan, 2006-2015
Country/region
Year of thefirst shop
Dec. 2006 Sept. 2011 Aug. 2014 Jan. 2015
Japan 1973 11,735 14,005 16,375 17,206
Thailand 1989 3,785 6,206 7,651 8,127
Korea 1989 1,421 4,755 7,085 7,231
Taiwan 1979 4,385 4,783 4,966 5,040
China 2004 1,055 1,732 2,010 2,064
Malaysia 1984 838 1,305 1,581 1,745
Philippines 1988 368 (2008) … 1,049 1,282
Hong Kong 1981 … … 966 966
Singapore 1983 345 556 528 493
Indonesia 2009 0 … 158 187
USA 1946 … … … 7,800
[Source] Made by Suehiro on the basis of the homepage of 7-Eleven, Inc.
Table 3-4 Growth of 7-Eleven in Asian Countries, 2006-2015
22 22
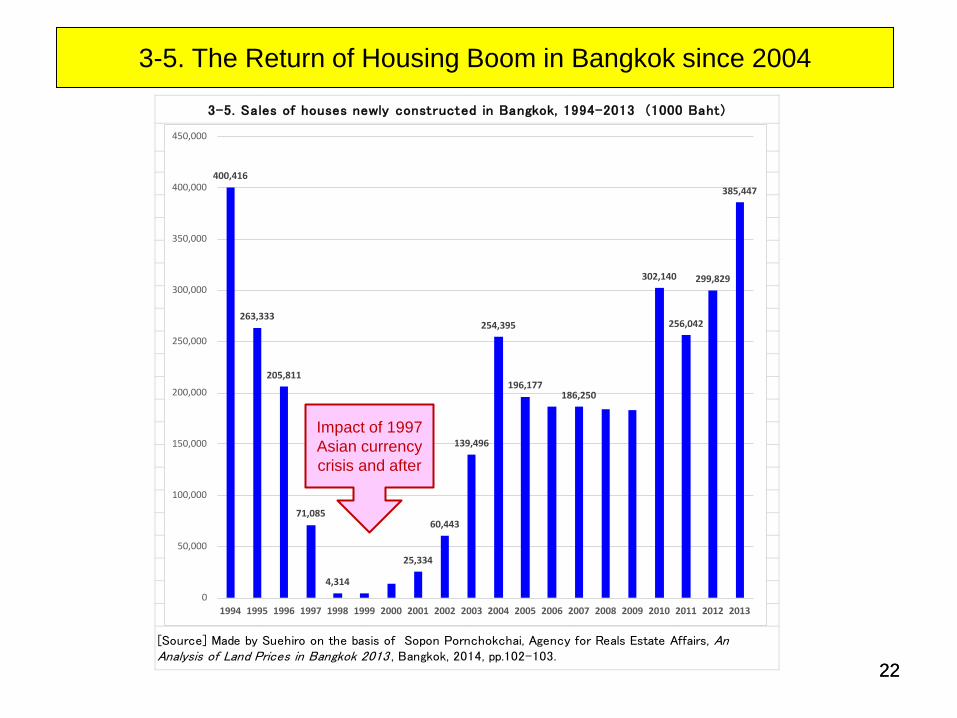
3-5. The Return of Housing Boom in Bangkok since 2004
[Source] Made by Suehiro on the basis of Sopon Pornchokchai, Agency for Reals Estate Affairs, AnAnalysis of Land Prices in Bangkok 2013 , Bangkok, 2014, pp.102-103.
3-5. Sales of houses newly constructed in Bangkok, 1994-2013 (1000 Baht)
400,416
263,333
205,811
71,085
4,314
25,334
60,443
139,496
254,395
196,177186,250
302,140
256,042
299,829
385,447
0
50,000
100,000
150,000
200,000
250,000
300,000
350,000
400,000
450,000
1994 1995 1996 1997 1998 1999 2000 2001 2002 2003 2004 2005 2006 2007 2008 2009 2010 2011 2012 2013
Impact of 1997 Asian currency crisis and after

23 23
Revival of Family Business in Service Sector
Backgrounds: ① Progress of urbanization and the growth of
urban middle class in Thailand ② Globalization and the growth of wealthy class
in emerging Asian countries. Development of new service sector: ① Department stores, mega shopping centers. ② Convenience stores, fast foods, restaurants ③ Housing, condominium, hotels ④ Hospital, health services (including medical
tourism from the Middle East)
24 24
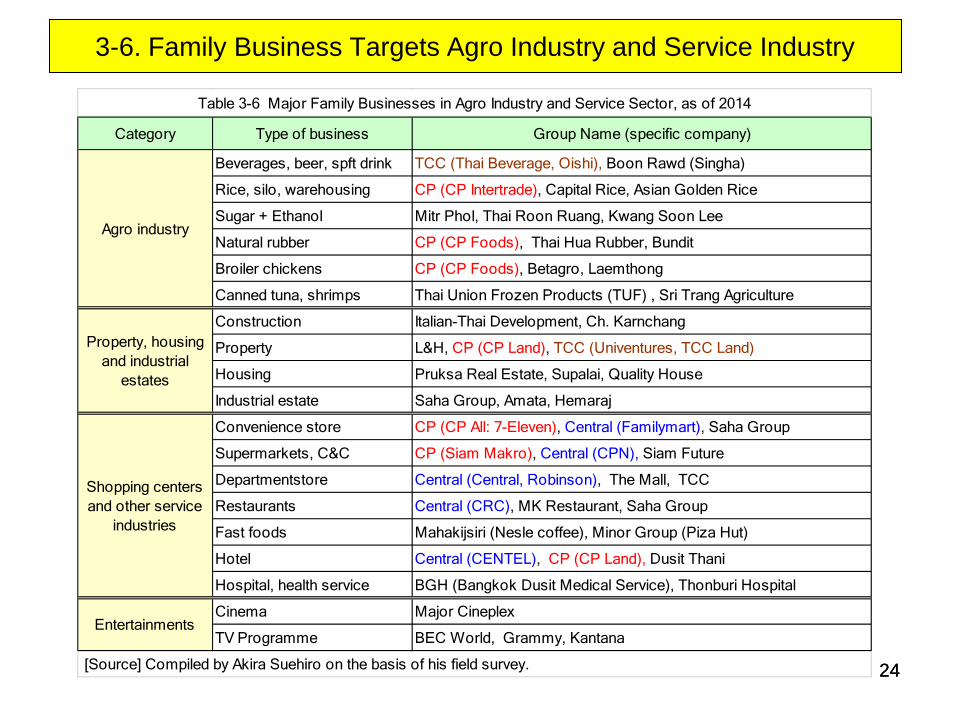
3-6. Family Business Targets Agro Industry and Service Industry
Category Type of business Group Name (specific company)
Beverages, beer, spft drink TCC (Thai Beverage, Oishi), Boon Rawd (Singha)
Rice, silo, warehousing CP (CP Intertrade), Capital Rice, Asian Golden Rice
Sugar + Ethanol Mitr Phol, Thai Roon Ruang, Kwang Soon Lee
Natural rubber CP (CP Foods), Thai Hua Rubber, Bundit
Broiler chickens CP (CP Foods), Betagro, Laemthong
Canned tuna, shrimps Thai Union Frozen Products (TUF) , Sri Trang Agriculture
Construction Italian-Thai Development, Ch. Karnchang
Property L&H, CP (CP Land), TCC (Univentures, TCC Land)
Housing Pruksa Real Estate, Supalai, Quality House
Industrial estate Saha Group, Amata, Hemaraj
Convenience store CP (CP All: 7-Eleven), Central (Familymart), Saha Group
Supermarkets, C&C CP (Siam Makro), Central (CPN), Siam Future
Departmentstore Central (Central, Robinson), The Mall, TCC
Restaurants Central (CRC), MK Restaurant, Saha Group
Fast foods Mahakijsiri (Nesle coffee), Minor Group (Piza Hut)
Hotel Central (CENTEL), CP (CP Land), Dusit Thani
Hospital, health service BGH (Bangkok Dusit Medical Service), Thonburi Hospital
Cinema Major Cineplex
TV Programme BEC World, Grammy, Kantana
[Source] Compiled by Akira Suehiro on the basis of his field survey.
Shopping centersand other service
industries
Property, housingand industrial
estates
Agro industry
Entertainments
Table 3-6 Major Family Businesses in Agro Industry and Service Sector, as of 2014
25 25
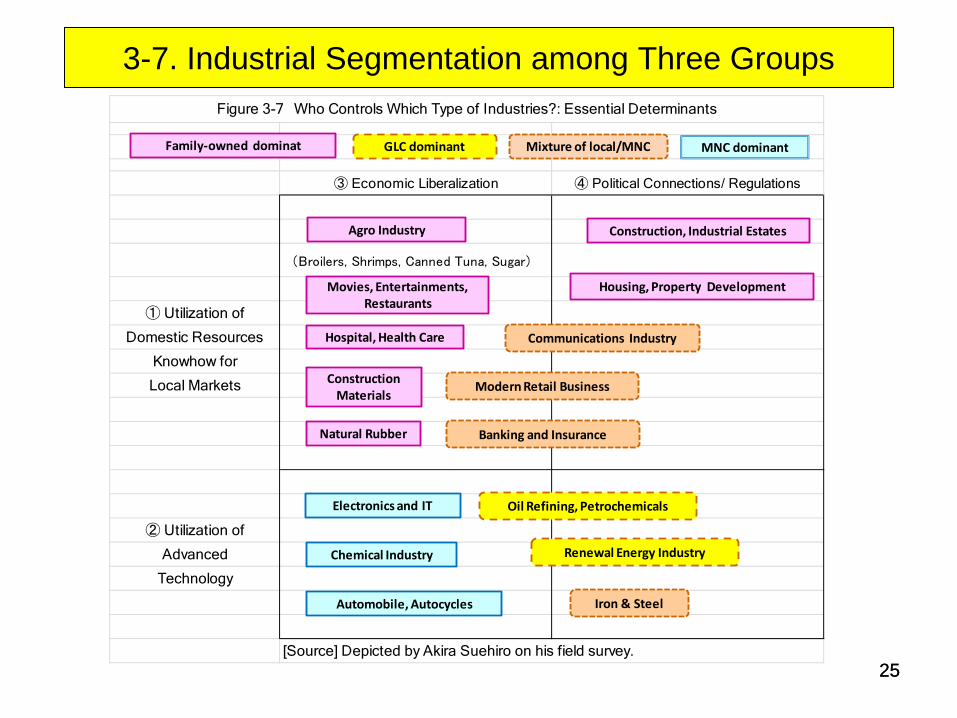
3-7. Industrial Segmentation among Three Groups
③ Economic Liberalization ④ Political Connections/ Regulations
(Broilers, Shrimps, Canned Tuna, Sugar)
① Utilization of
Domestic Resources
Knowhow for
Local Markets
② Utilization of
Advanced
Technology
[Source] Depicted by Akira Suehiro on his field survey.
Figure 3-7 Who Controls Which Type of Industries?: Essential Determinants
Agro Industry
Movies, Entertainments, Restaurants
Automobile, Autocycles
Electronics and IT
Iron & Steel
Oil Refining, Petrochemicals
Renewal Energy Industry
Banking and Insurance
Mixture of local/MNC
Hospital, Health Care
Modern Retail Business
Construction, Industrial Estates
Housing, Property Development
Communications Industry
Family-owned dominat MNC dominant
ConstructionMaterials
Natural Rubber
Chemical Industry
GLC dominant
26 26
Part 4 New Strategies of
Thai Big Corporations
27 27
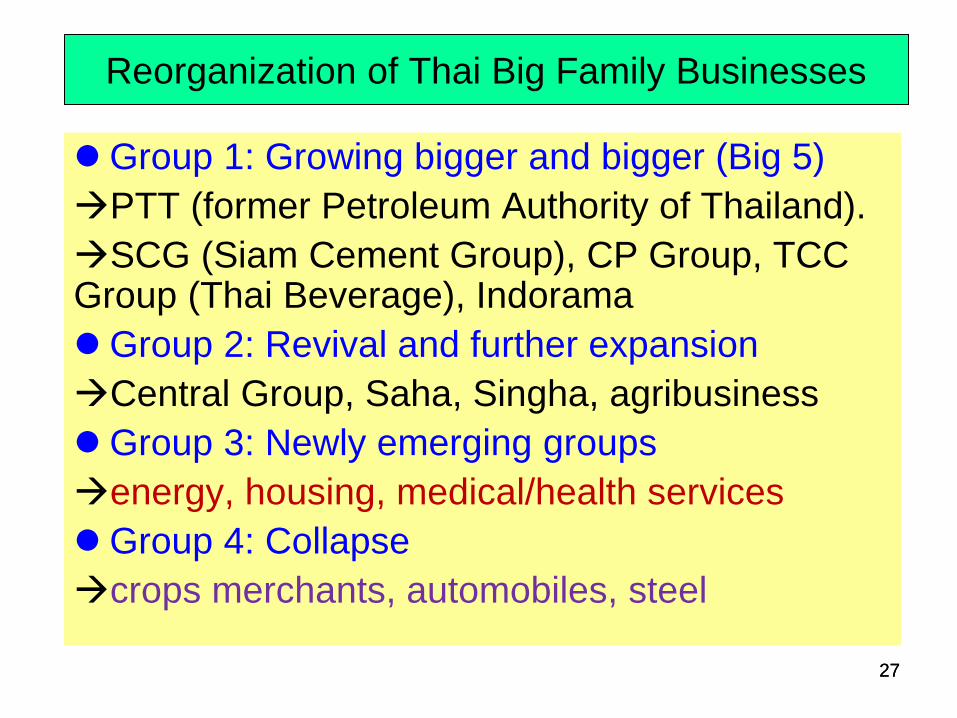
Reorganization of Thai Big Family Businesses
Group 1: Growing bigger and bigger (Big 5) PTT (former Petroleum Authority of Thailand). SCG (Siam Cement Group), CP Group, TCC Group (Thai Beverage), Indorama Group 2: Revival and further expansion Central Group, Saha, Singha, agribusiness Group 3: Newly emerging groups energy, housing, medical/health services Group 4: Collapse crops merchants, automobiles, steel
28 28
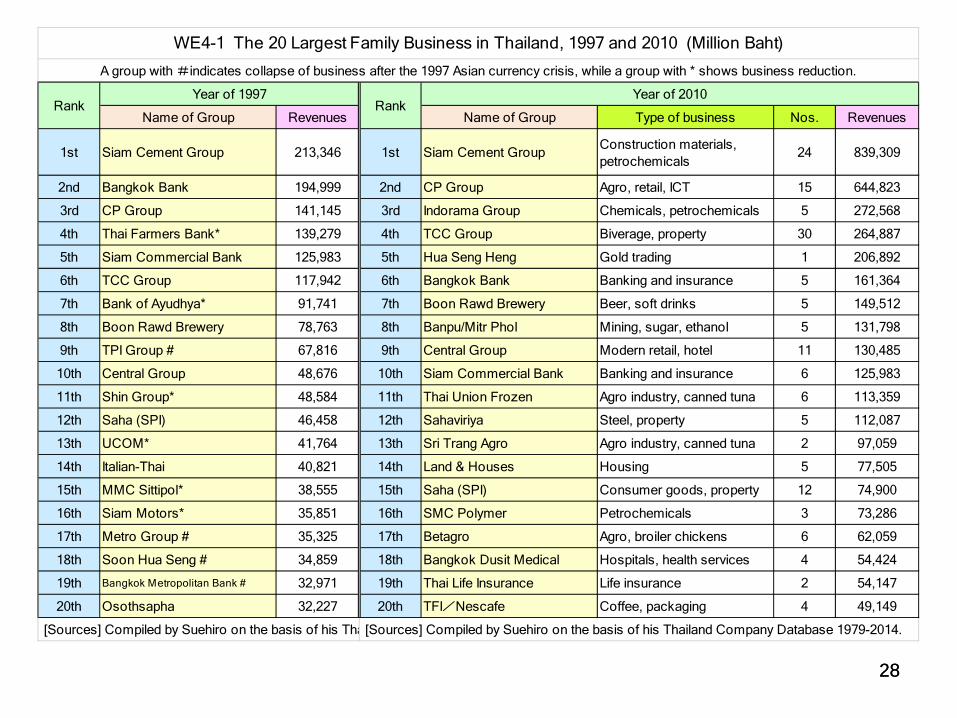
Name of Group Revenues Name of Group Type of business Nos. Revenues
1st Siam Cement Group 213,346 1st Siam Cement Group Construction materials,petrochemicals
24 839,309
2nd Bangkok Bank 194,999 2nd CP Group Agro, retail, ICT 15 644,823
3rd CP Group 141,145 3rd Indorama Group Chemicals, petrochemicals 5 272,568
4th Thai Farmers Bank* 139,279 4th TCC Group Biverage, property 30 264,887
5th Siam Commercial Bank 125,983 5th Hua Seng Heng Gold trading 1 206,892
6th TCC Group 117,942 6th Bangkok Bank Banking and insurance 5 161,364
7th Bank of Ayudhya* 91,741 7th Boon Rawd Brewery Beer, soft drinks 5 149,512
8th Boon Rawd Brewery 78,763 8th Banpu/Mitr Phol Mining, sugar, ethanol 5 131,798
9th TPI Group # 67,816 9th Central Group Modern retail, hotel 11 130,485
10th Central Group 48,676 10th Siam Commercial Bank Banking and insurance 6 125,983
11th Shin Group* 48,584 11th Thai Union Frozen Agro industry, canned tuna 6 113,359
12th Saha (SPI) 46,458 12th Sahaviriya Steel, property 5 112,087
13th UCOM* 41,764 13th Sri Trang Agro Agro industry, canned tuna 2 97,059
14th Italian-Thai 40,821 14th Land & Houses Housing 5 77,505
15th MMC Sittipol* 38,555 15th Saha (SPI) Consumer goods, property 12 74,900
16th Siam Motors* 35,851 16th SMC Polymer Petrochemicals 3 73,286
17th Metro Group # 35,325 17th Betagro Agro, broiler chickens 6 62,059
18th Soon Hua Seng # 34,859 18th Bangkok Dusit Medical Hospitals, health services 4 54,424
19th Bangkok Metropolitan Bank # 32,971 19th Thai Life Insurance Life insurance 2 54,147
20th Osothsapha 32,227 20th TFI/Nescafe Coffee, packaging 4 49,149
[Sources] Compiled by Suehiro on the basis of his Tha [Sources] Compiled by Suehiro on the basis of his Thailand Company Database 1979-2014.
Year of 1997 Year of 2010Rank
WE4-1 The 20 Largest Family Business in Thailand, 1997 and 2010 (Million Baht)
Rank
A group with #indicates collapse of business after the 1997 Asian currency crisis, while a group with * shows business reduction.

29 29
Strategy and Means to Expand Business
① Selection and concentration from zaibatsu-type to specific industry ② Utilization of land as strategic assets collateral for banking loans, property funds ③ M&A employed to expand businesses the same core industries outside Thailand ④ Response to the start of AEC in 2015/16 (ASEAN Economic Community) targeting the markets in CLMV and ASEAN ⑤ Strategic alliance with Chinese firms both in Thailand and in mainland China

30 30
4-4. Increase of Land Price in Bangkok Area, 1985=100
(出所)Agency for Real Estate Affairs, Bangkok Land Prices Change, 1994-2013: Chronological Research , presentedby Dr. Sopon Pornchokchai onJaunuary 28, 2014,
Figure 4-4 Increase of Land Price in Bangkok, 1985-2013 (The year of 1985=100 )
100 170 260490
930
1940
2350
2620
2920
3320
2900
25902690
2930
3270
36103840
40104170
43204450
0
500
1000
1500
2000
2500
3000
3500
4000
4500
5000
1997 Asian currency crisis
1988 economic boom starts

31 31
4-6. M&A of Major Thai Family Businesses, 2010-2013
Million Baht Million dollar
July. 2010 Banpu AcquisitionCentennial Coal (largest miningcompany in New Southwales ofAU)
Coal mining 60,000 1,905
July. 2010 TUF Acquisition MWBrands SAS (largest cannedtuna mfg in France)
Canned tuna 28,500 884
Aug. 2010 Sahaviriya Acquisition Blast furnace division of CorusGroup PLC (UK).
Blast furnace 14,800 469
Dec. 2010 BGH Acquisition Health Network PLC(Payatai,Memorial 7hospitals)
Hospital 10,000 317
Sept. 2011 Central Acquisition La Rinascente SpA (Italian old-branded hotel chain)
Hotel chain 12,000 372
Sept. 2011 SCG Investment PT.Chandra Asri Petrochemical(inegrated firm in Indonesia)
Petrochemicals 13,600 425
Feb. 2012 Indorama Acquisition Chemical division of Old WorldIndustries, LLC (USA)
Ethylene 24,400 795
July. 2012 TCC Group AcquisitionFraser & Neave Ltd. (Singapore、
younger brother of PM LeeShenlong)
Beverage 70,000 2,210
Sept. 2012 TCC Group Acquisition Golden Land Property PLC Property 10,400 340
Dec. 2012 CP Group Investment Ping An Insurance (平安保険、2ndlargest in China) 15%
Life Insurance 288,000 9,386
April. 2013 CP Group Acquisition Siam Makro (SHV Holdings inHollanda)
Global retail 121,500 3,980
(注)BGH: Bangkok Dusit Medical Services PLC; SCG: Siam Cement Group
[Sources] Compiled by Suehiro on the basis of UNCTAD, World Investment Report, Appendix Thailand; Information included into annualreports of each group.
WE4--6 M&A of Major Thai Family Business, 2010-2013
Month/Year Group M&A Type Firms Acquisited Type of businessValue
32 32
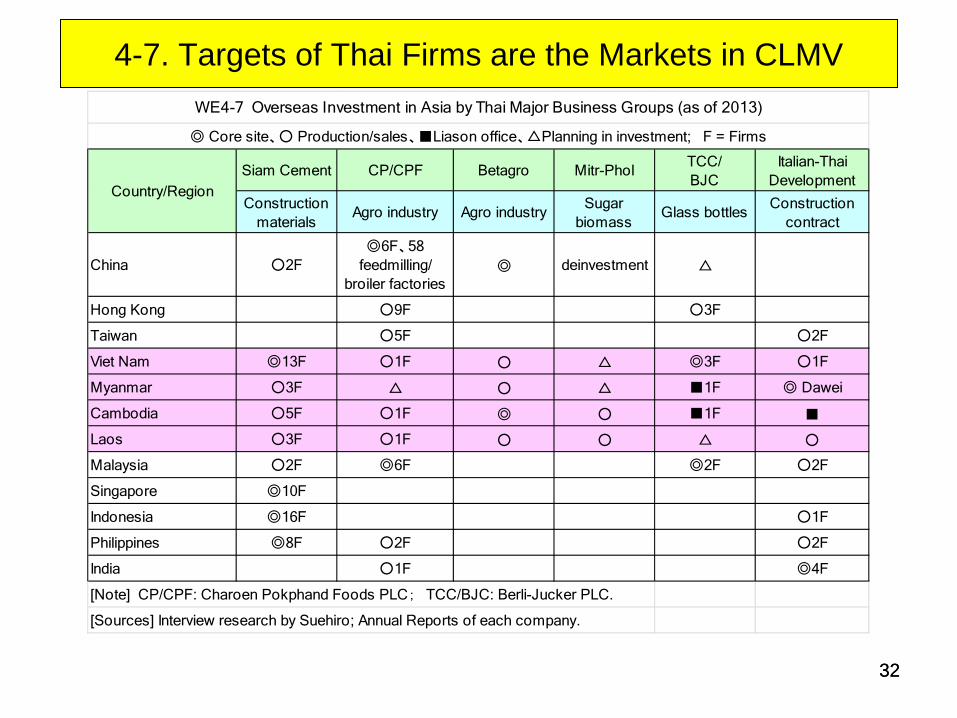
4-7. Targets of Thai Firms are the Markets in CLMV
Siam Cement CP/CPF Betagro Mitr-Phol TCC/BJC
Italian-ThaiDevelopment
Constructionmaterials
Agro industry Agro industry Sugarbiomass
Glass bottles Constructioncontract
China ○2F◎6F、58
feedmilling/broiler factories
◎ deinvestment △
Hong Kong ○9F ○3F
Taiwan ○5F ○2F
Viet Nam ◎13F ○1F ○ △ ◎3F ○1F
Myanmar ○3F △ ○ △ ■1F ◎ Dawei
Cambodia ○5F ○1F ◎ ○ ■1F ■
Laos ○3F ○1F ○ ○ △ ○
Malaysia ○2F ◎6F ◎2F ○2F
Singapore ◎10F
Indonesia ◎16F ○1F
Philippines ◎8F ○2F ○2F
India ○1F ◎4F
[Note] CP/CPF: Charoen Pokphand Foods PLC; TCC/BJC: Berli-Jucker PLC.
[Sources] Interview research by Suehiro; Annual Reports of each company.
WE4-7 Overseas Investment in Asia by Thai Major Business Groups (as of 2013)
◎ Core site、○ Production/sales、■Liason office、△Planning in investment; F = Firms
Country/Region

33 33
4-10. Strategic Corporate Alliance between Thailand and China
Type of Business Year/Month Forms Place Thailand China
Undersea oil Feb. 2008 Alliance Myanmar PTT Group CNOOC (SE) 中国海洋石油
Atomic power plant Oct. 2007 Tech. assistance Thailand EGCO CLP Power, Cantong
Biomass May. 2010 Joint venture China Mitr Phol Sugar Funan Sugar 扶南製糖所
Solar power plant May.2014 Construction Thailand EGAT Consosium
Compact car Jan. 2009 Joint venture Thailand CP Group Chery Auto 奇瑞汽車
Tyre Dec. 2010 Joint venture Thailand Thai Hua Rubber Hangzhou Rubber 杭州中策
Automobile Dec. 2012 Joint venture Thailand CP Group Shanghai Motor 上海汽車
Carriage for railway July. 2010 Purchase Thailand Bangkok Mass Transit 長春軌道車
Home appliance 2007年4月 Acquisition Thailand Sanyo Universal Hier 海璽
Communications Aug. 2013 Single Thailand Huawei 華為技術
Communications Dec.2013 Planning Thailand Baidu 百度
Communications July 2014. Alliance Thailand CP Group China Mobile 中国移動通信
Industrial estate Mar.2011 Joint venture Thailand Amata Corporation Holy Group
Property business April.2013 Joint venture Thailand CP Group Greenland (Shanghai)
Property business Jan. 2015 Investment China CP Group CITIC 中信
Banking Jan. 2010 Alliance China/Thailand Kasikorn Bank China Minsheng Banking Corp.中国民生銀行
Banking Mar.2011 Alliance China/Thailand Bangkok BankICBC. Industrial and CommericalBank of China 中国工商銀行
Life insurance Dec. 2012 Investment China CP Group Ping An Insurance 平安保険
[Sources] Compiled by Akira Suehiro on the basis of Thai news papers.
WE4-10 Strategic Alliance between Thai Firms and Chinese Firms, 2007-2015
(1)Energy, Natural Resources
(2)Automobiles, Tyre
(3) Information Communications Technology
(4)Property Development, Industrial Estates
(5)Banking, Insurance

34 34
Part 5 Alternative to
the East Asian Model
35 35
The East Asian Model and Another Way
Catch-up type industrialization has requested a country to promote continuous innovation and to upgrade industrial structure.
Japan, following Korea and Taiwan, and now China. But Thailand has poor technological base in manufacturing sector.
Needs 43 years for Thailand to catch up with the average per capita income of the OECD.
Thailand should not aim at becoming a high-income country, but should seek for its own positioning in non-manufacturing sector such as agro industry and service sector

36 36
Thank you for your attention
Udonthani city in Northeastern Thailand, Dec. 3, 2014


