THE INFLUENCE OF GEOLOGIC SAMPLE SURFACES ON THERMAL INFRARED REFLECTANCE SPECTROSCOPY
EVELIEN ROST, CHRIS HECKER, FREEK VAN DER MEER
MARTIN SCHODLOK, BGR
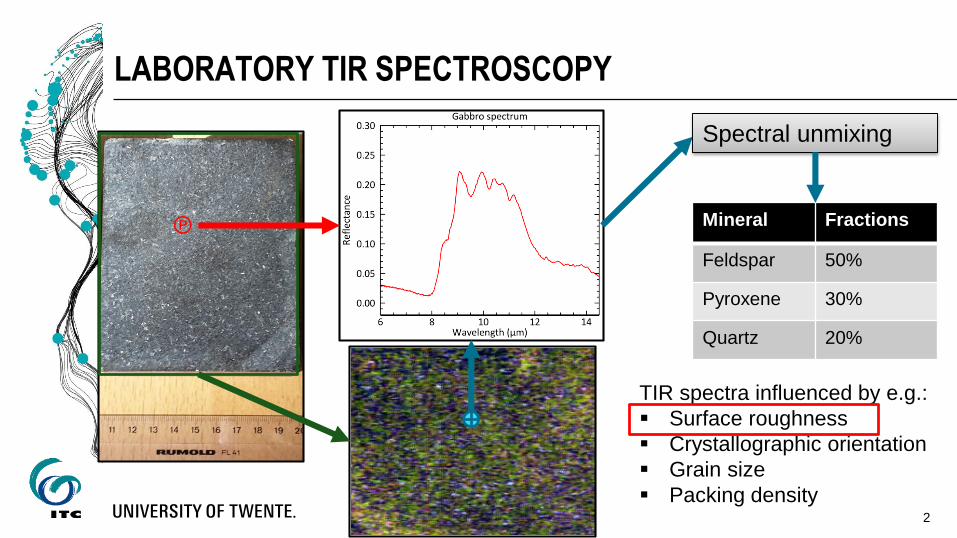
LABORATORY TIR SPECTROSCOPY
2
℗ Mineral Fractions
Feldspar 50%
Pyroxene 30%
Quartz 20%
Spectral unmixing
TIR spectra influenced by e.g.:
Surface roughness
Crystallographic orientation
Grain size
Packing density
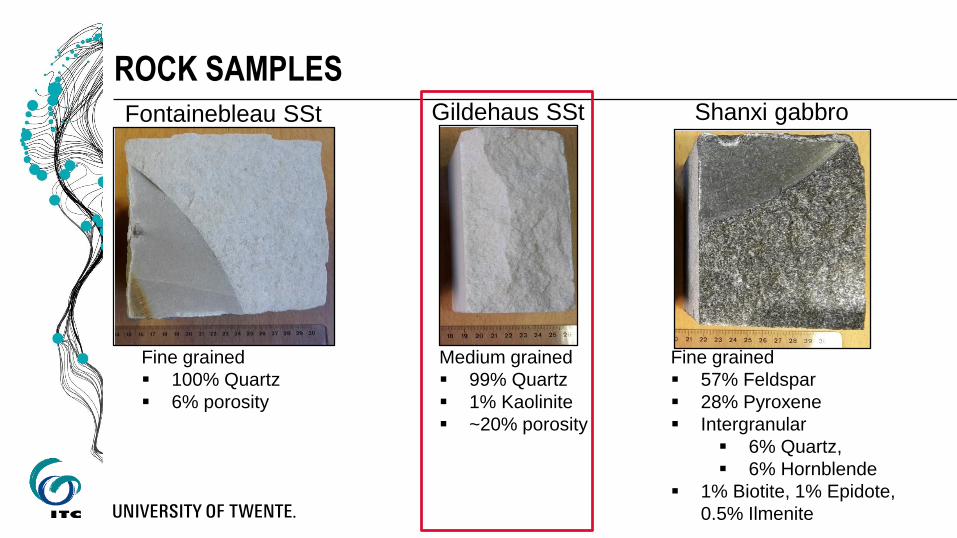
ROCK SAMPLESGildehaus SStFontainebleau SSt Shanxi gabbro
Fine grained
100% Quartz
6% porosity
Medium grained
99% Quartz
1% Kaolinite
~20% porosity
Fine grained
57% Feldspar
28% Pyroxene
Intergranular
6% Quartz,
6% Hornblende
1% Biotite, 1% Epidote,
0.5% Ilmenite
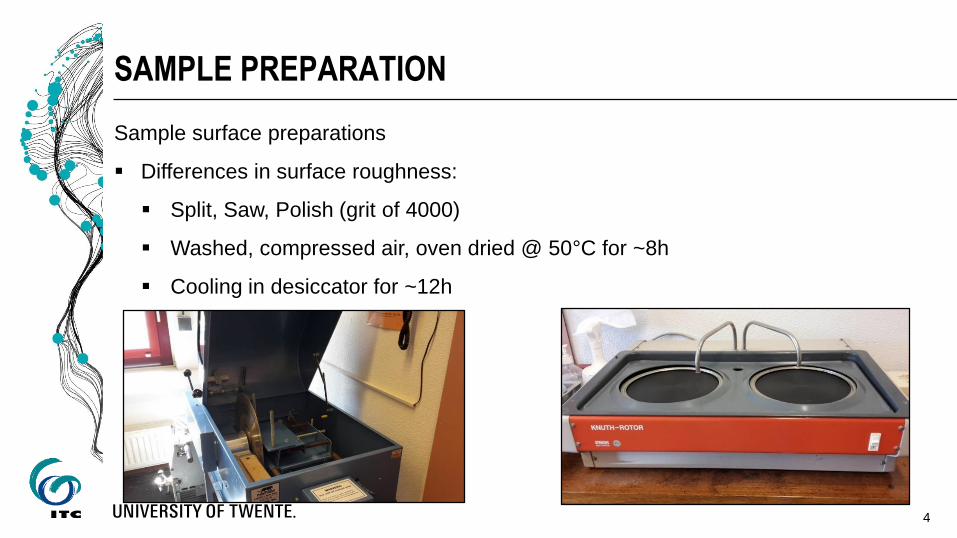
SAMPLE PREPARATION
4
Sample surface preparations
Differences in surface roughness:
Split, Saw, Polish (grit of 4000)
Washed, compressed air, oven dried @ 50°C for ~8h
Cooling in desiccator for ~12h

METHODS – SPECTRAL MEASUREMENTS
Point measurements
Bruker Vertex70 FTIR with DHR integrating sphere
Studied range 7.5 – 16 µm
Spectral resolution 4 cm-1
9 measurements/sample surface
℗Symbol
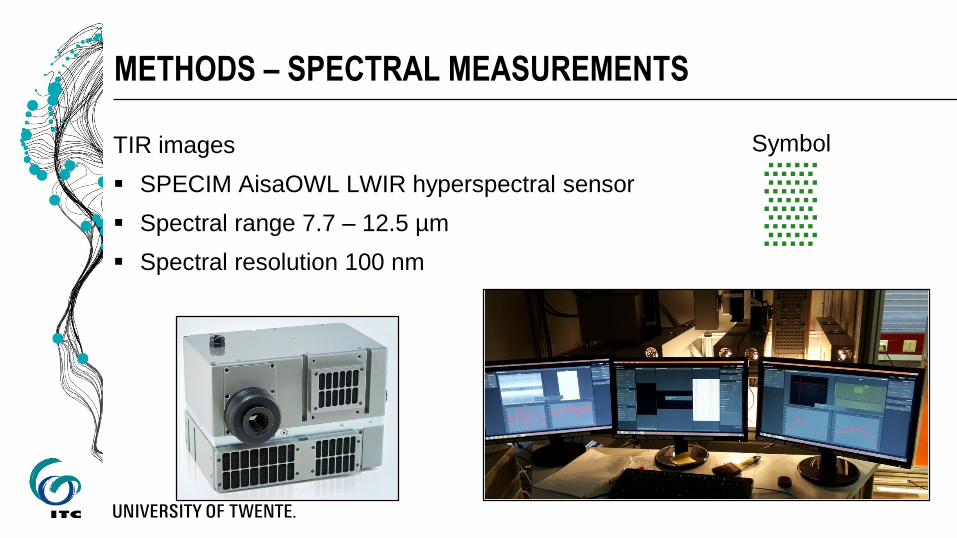
METHODS – SPECTRAL MEASUREMENTS
TIR images
SPECIM AisaOWL LWIR hyperspectral sensor
Spectral range 7.7 – 12.5 µm
Spectral resolution 100 nm
▒Symbol
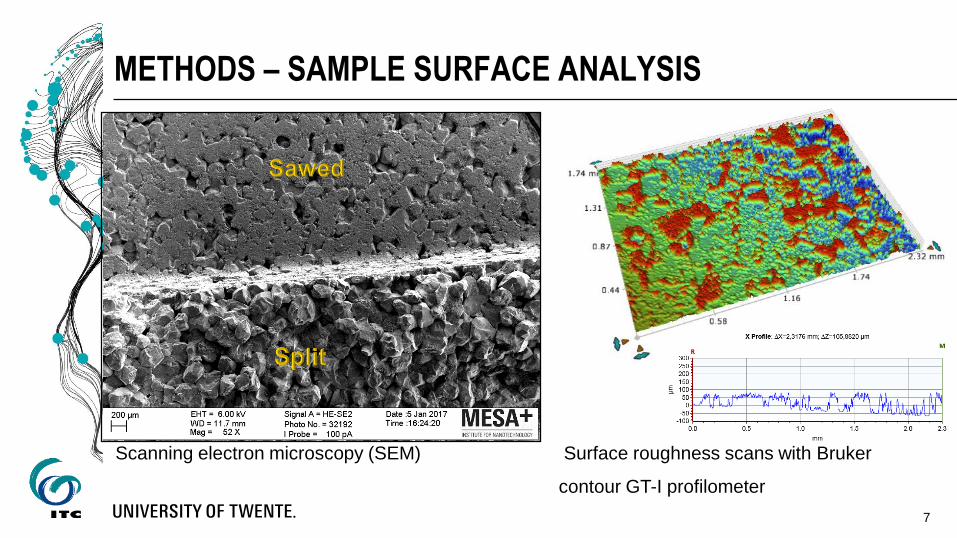
Surface roughness scans with Bruker
contour GT-I profilometer
METHODS – SAMPLE SURFACE ANALYSIS
7
Scanning electron microscopy (SEM)
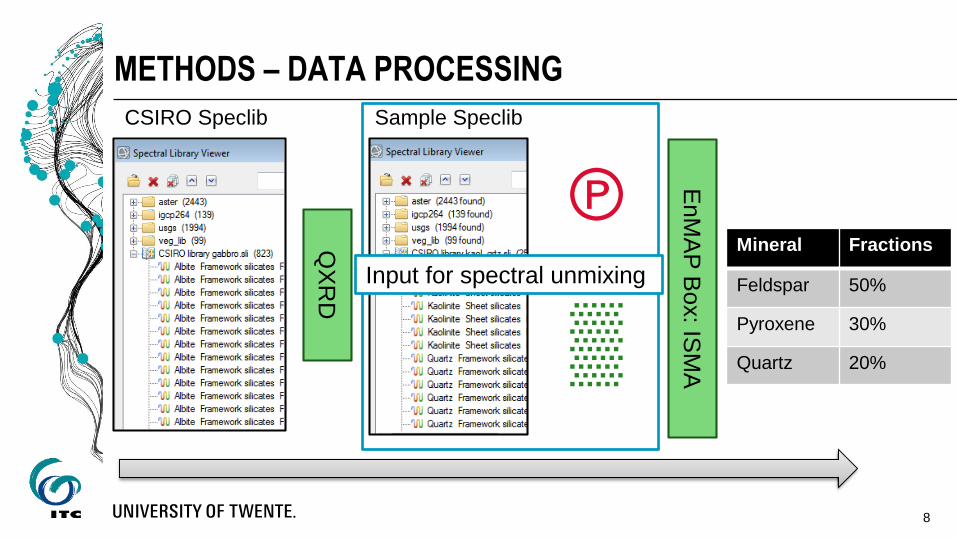
METHODS – DATA PROCESSING
8
℗
▒
QX
RD
EnM
AP
Box: IS
MA
Mineral Fractions
Feldspar 50%
Pyroxene 30%
Quartz 20%
CSIRO Speclib Sample Speclib
Input for spectral unmixing

Surface
roughness
Unmixed minerals
Mean StdDev
Polished Quartz
Kaol
99.9%
0.01%
± 0.30
± 0.01
Sawed Quartz 100% ± 0.50
Split Quartz 100% ± 0.49
RESULTS – GILDEHAUS
9
Point measurements ℗ LWIR images ▒
Surface
roughness
Unmixed minerals
Mean StdDev
Polished Quartz 100% ± 0.25
Sawed Quartz 100% ± 0.33
Split Quartz 100% ± 0.50
Up to 50% kaol for
individual pixelsOnly kaolinite unmixed for polished surface,
also observed with biotite in gabbro

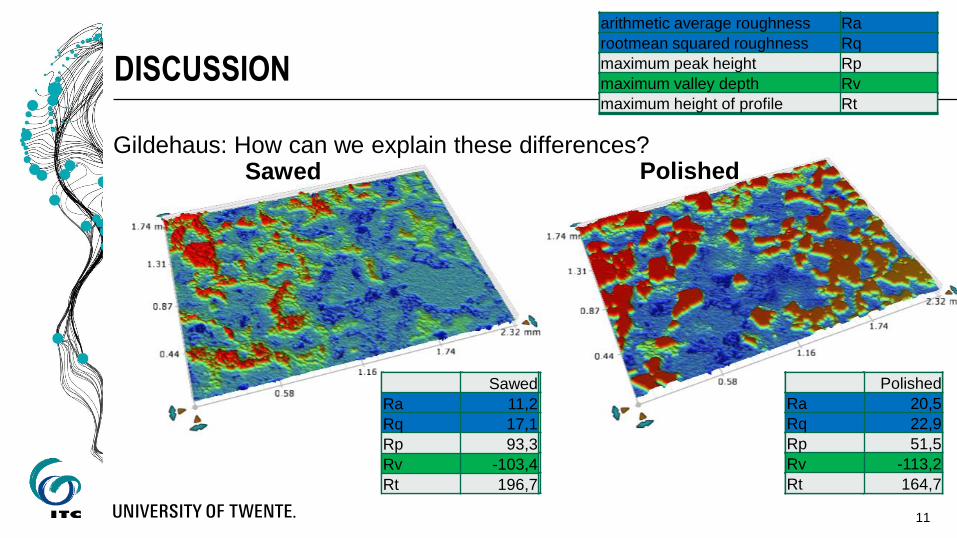
DISCUSSION
Gildehaus: How can we explain these differences?
Observations confirmed by SEM images
10
Polished zoom-in
Kaol
Qrtz
Kaol
Polished zoom-in20 𝝁𝒎
Qrtz
10 𝝁𝒎
Polished
DISCUSSION
11
Sawed
Polished
Ra 20,5
Rq 22,9
Rp 51,5
Rv -113,2
Rt 164,7
Sawed
Ra 11,2
Rq 17,1
Rp 93,3
Rv -103,4
Rt 196,7
arithmetic average roughness Ra
rootmean squared roughness Rq
maximum peak height Rp
maximum valley depth Rv
maximum height of profile Rt
Polished
Ra 20,5
Rq 22,9
Rp 51,5
Rv -113,2
Rt 164,7
Sawed
Ra 11,2
Rq 17,1
Rp 93,3
Rv -103,4
Rt 196,7
arithmetic average roughness Ra
rootmean squared roughness Rq
maximum peak height Rp
maximum valley depth Rv
maximum height of profile Rt
Polished
Ra 20,5
Rq 22,9
Rp 51,5
Rv -113,2
Rt 164,7
Sawed
Ra 11,2
Rq 17,1
Rp 93,3
Rv -103,4
Rt 196,7
arithmetic average roughness Ra
rootmean squared roughness Rq
maximum peak height Rp
maximum valley depth Rv
maximum height of profile Rt
Gildehaus: How can we explain these differences?

DISCUSSION
12
Quartz
Kaolinite
Polish
Sawed Polished

THE INFLUENCE OF GEOLOGIC SAMPLE SURFACES ON TIR SPECTROSCOPY
EVELIEN ROST, CHRIS HECKER, FREEK VAN DER MEER
MARTIN SCHODLOK, BGR

14


