
1 1 1 1
The importance of a Credit Culture for
Capital Markets
Crediamo nella supremazia della Conoscenza.
Crediamo nelle forza delle Idee.
Crediamo nell’Ispirazione.
Prof. Edward I. Altman NYU Stern School of Business
Senior Advisor & Co-Founder Classis Capital SIM Milan, June 11th 2014
2
The Importance of Credit Ratings
• General and accepted risk measurement metric
– International Language of Credit
• Linkage between internal credit scoring models and external agency bond and loan ratings
– Basis for internal ratings based (IRB) models
• BIS standards on Capital Adequacy
– Bucket approach based on external (possibly internal) ratings – Basel II
– Model approach-linked to ratings and portfolio risk
• Databases – Defaults and Rating Migration
– Statistics based on original rating (Altman-Mortality) and (Static Pool - S&P, Cohorts -
Moody’s) yearly and cumulative default rates
– Major influence on structured finance products
• Credit Derivatives
– Price linked to current rating, expected default and recovery rates, arbitrage
• Role of a Credit Culture in the Italian Minibond market
– Greater understanding between borrowers and investors
3
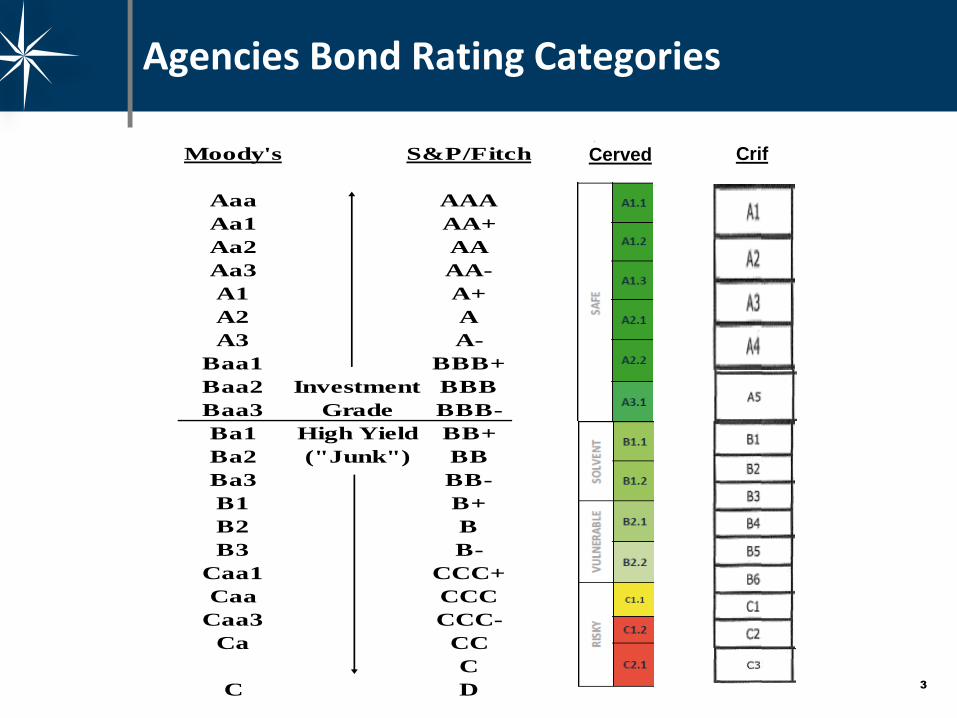
Agencies Bond Rating Categories
Moody's S&P/Fitch
Aaa AAA
Aa1 AA+
Aa2 AA
Aa3 AA-
A1 A+
A2 A
A3 A-
Baa1 BBB+
Baa2 Investment BBB
Baa3 Grade BBB-
Ba1 High Yield BB+
Ba2 ("Junk") BB
Ba3 BB-
B1 B+
B2 B
B3 B-
Caa1 CCC+
Caa CCC
Caa3 CCC-
Ca CC
C
C D
Cerved Crif
4
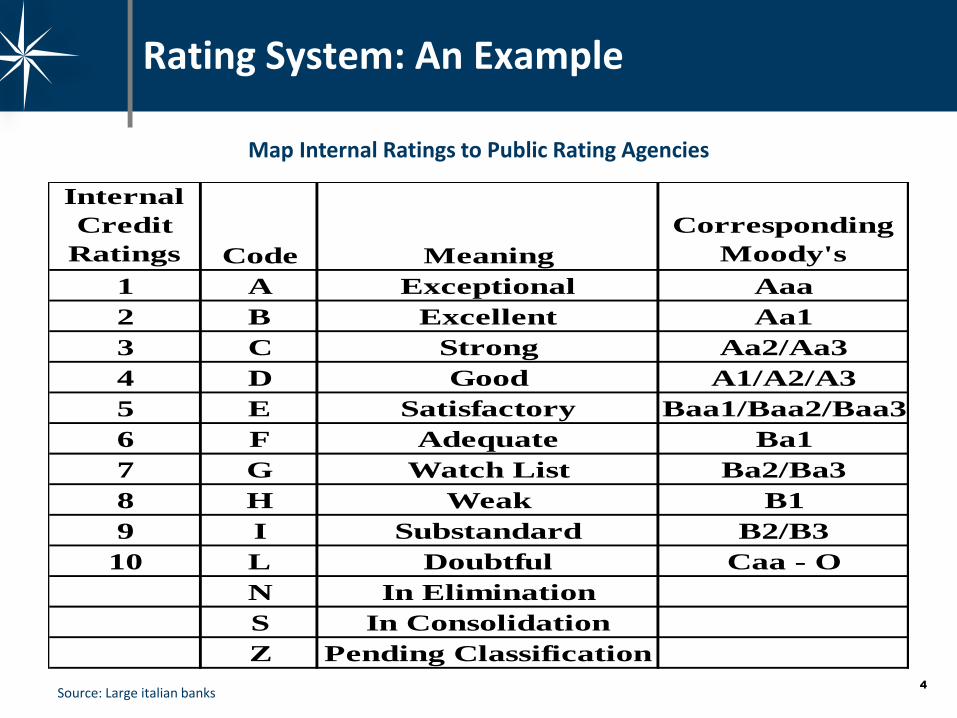
Rating System: An Example
Internal
Credit
Ratings Code Meaning
Corresponding
Moody's
1 A Exceptional Aaa
2 B Excellent Aa1
3 C Strong Aa2/Aa3
4 D Good A1/A2/A3
5 E Satisfactory Baa1/Baa2/Baa3
6 F Adequate Ba1
7 G Watch List Ba2/Ba3
8 H Weak B1
9 I Substandard B2/B3
10 L Doubtful Caa - O
N In Elimination
S In Consolidation
Z Pending Classification
Map Internal Ratings to Public Rating Agencies
Source: Large italian banks
5
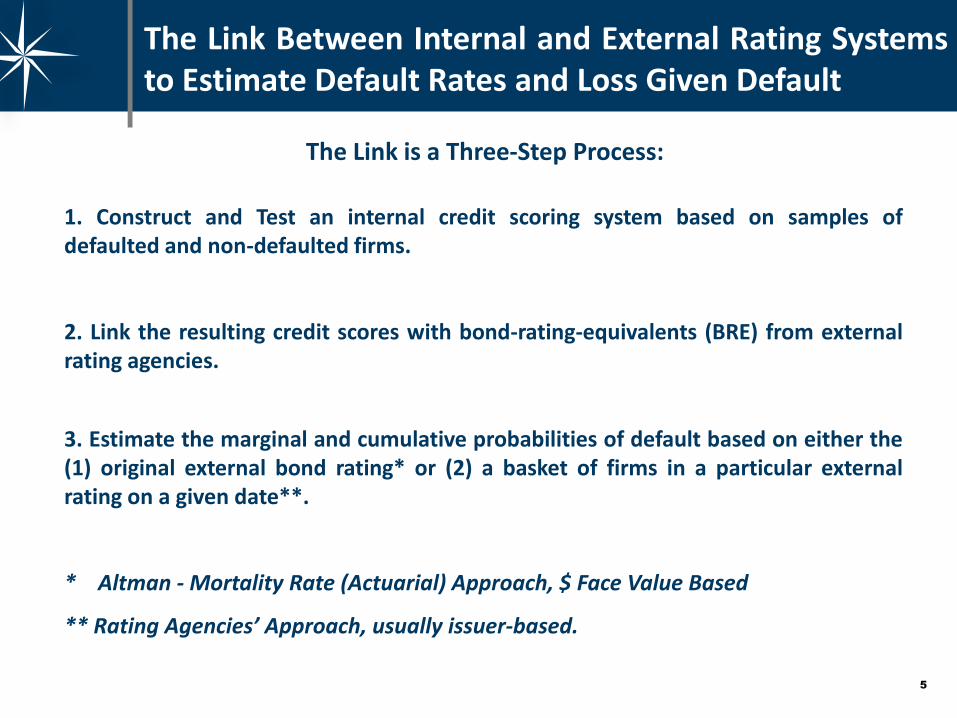
The Link Between Internal and External Rating Systems to Estimate Default Rates and Loss Given Default
1. Construct and Test an internal credit scoring system based on samples of defaulted and non-defaulted firms.
2. Link the resulting credit scores with bond-rating-equivalents (BRE) from external rating agencies.
The Link is a Three-Step Process:
3. Estimate the marginal and cumulative probabilities of default based on either the (1) original external bond rating* or (2) a basket of firms in a particular external rating on a given date**.
* Altman - Mortality Rate (Actuarial) Approach, $ Face Value Based
** Rating Agencies’ Approach, usually issuer-based.
6
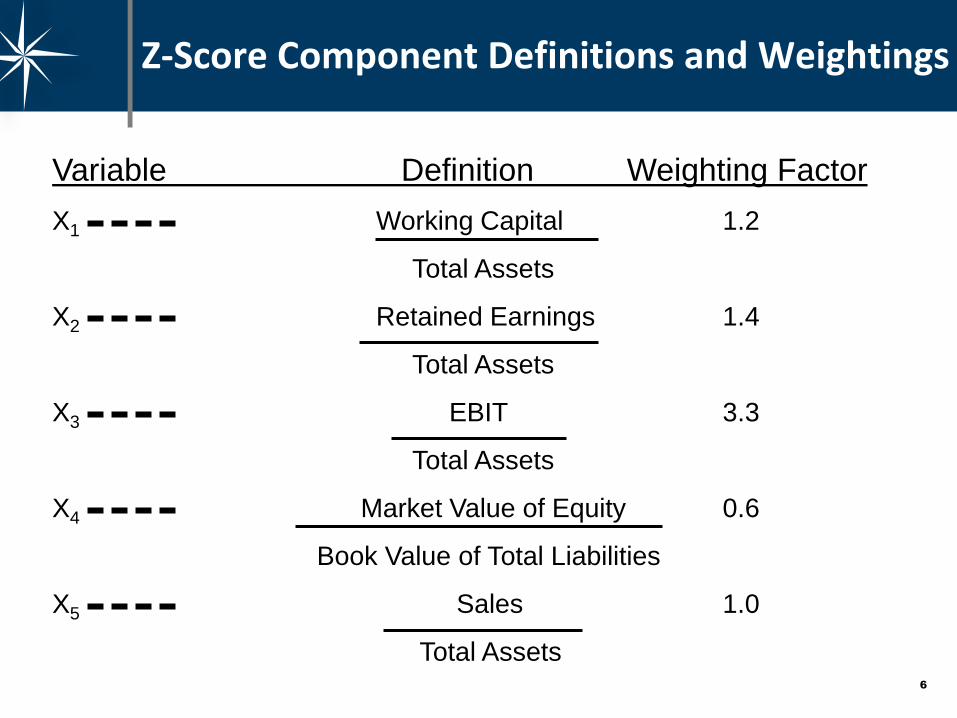
Z-Score Component Definitions and Weightings
Variable Definition Weighting Factor
X1 Working Capital 1.2
Total Assets
X2 Retained Earnings 1.4
Total Assets
X3 EBIT 3.3
Total Assets
X4 Market Value of Equity 0.6
Book Value of Total Liabilities
X5 Sales 1.0
Total Assets
7 7
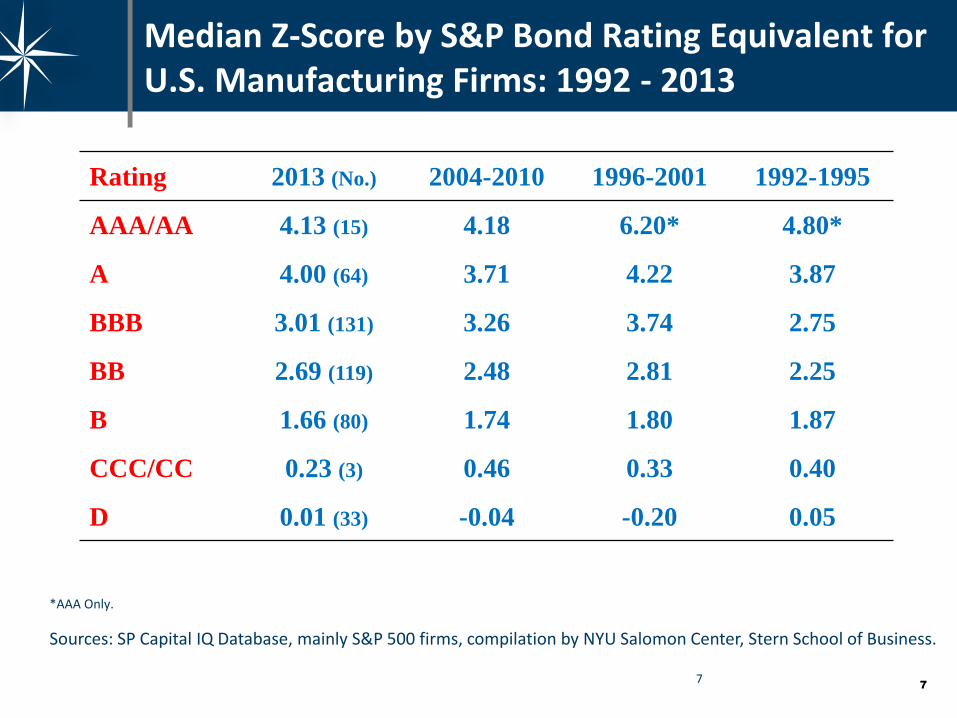
Median Z-Score by S&P Bond Rating Equivalent for U.S. Manufacturing Firms: 1992 - 2013
Sources: SP Capital IQ Database, mainly S&P 500 firms, compilation by NYU Salomon Center, Stern School of Business.
Rating 2013 (No.) 2004-2010 1996-2001 1992-1995
AAA/AA 4.13 (15) 4.18 6.20* 4.80*
A 4.00 (64) 3.71 4.22 3.87
BBB 3.01 (131) 3.26 3.74 2.75
BB 2.69 (119) 2.48 2.81 2.25
B 1.66 (80) 1.74 1.80 1.87
CCC/CC 0.23 (3) 0.46 0.33 0.40
D 0.01 (33) -0.04 -0.20 0.05
*AAA Only.
8
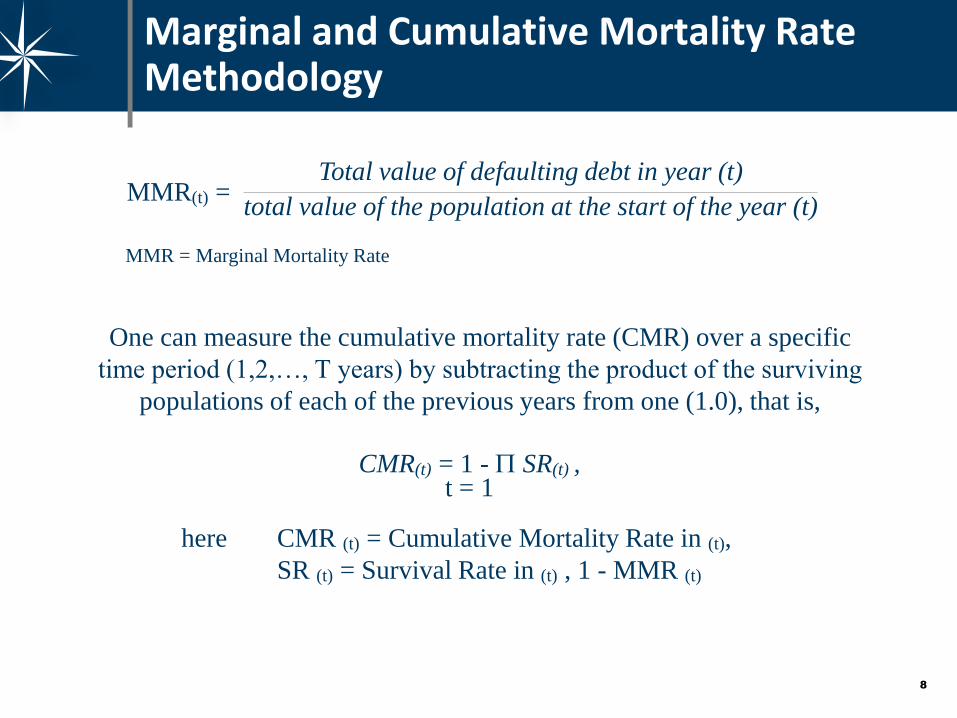
Marginal and Cumulative Mortality Rate Methodology
One can measure the cumulative mortality rate (CMR) over a specific
time period (1,2,…, T years) by subtracting the product of the surviving
populations of each of the previous years from one (1.0), that is,
MMR(t) = Total value of defaulting debt in year (t)
total value of the population at the start of the year (t)
MMR = Marginal Mortality Rate
CMR(t) = 1 - SR(t) , t = 1
here CMR (t) = Cumulative Mortality Rate in (t),
SR (t) = Survival Rate in (t) , 1 - MMR (t)
9
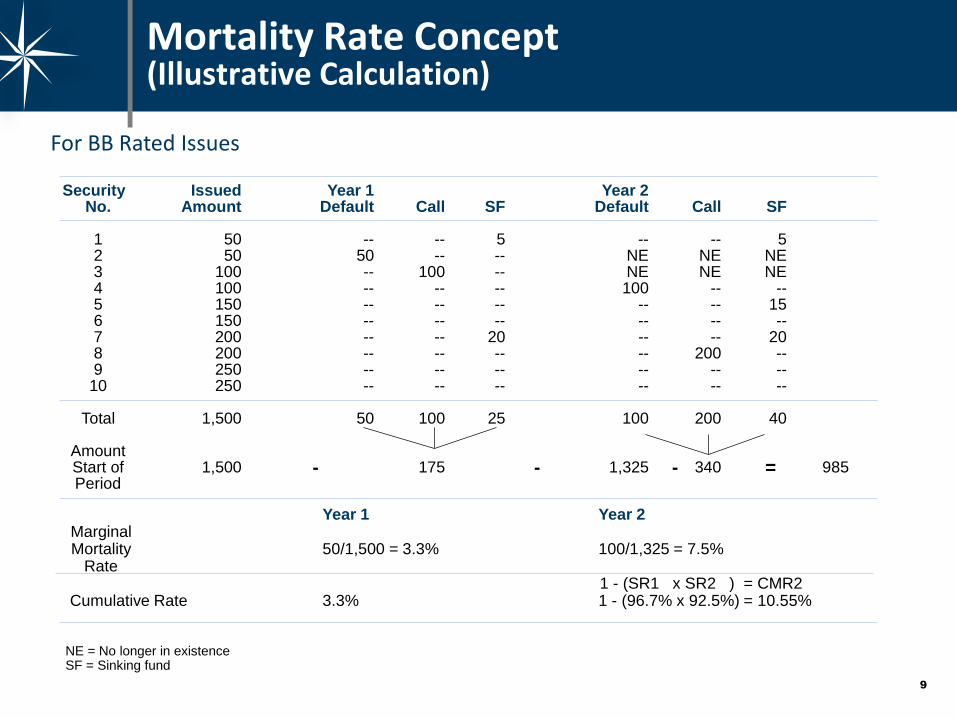
Mortality Rate Concept (Illustrative Calculation)
For BB Rated Issues
Security Issued Year 1 Year 2 No. Amount Default Call SF Default Call SF 1 50 -- -- 5 -- -- 5 2 50 50 -- -- NE NE NE 3 100 -- 100 -- NE NE NE 4 100 -- -- -- 100 -- -- 5 150 -- -- -- -- -- 15 6 150 -- -- -- -- -- -- 7 200 -- -- 20 -- -- 20 8 200 -- -- -- -- 200 -- 9 250 -- -- -- -- -- -- 10 250 -- -- -- -- -- -- Total 1,500 50 100 25 100 200 40 Amount Start of 1,500 175 1,325 340 985 Period - - - =
Year 1 Year 2 Marginal Mortality 50/1,500 = 3.3% 100/1,325 = 7.5% Rate 1 - (SR1 x SR2 ) = CMR2 Cumulative Rate 3.3% 1 - (96.7% x 92.5%) = 10.55% NE = No longer in existence SF = Sinking fund
10
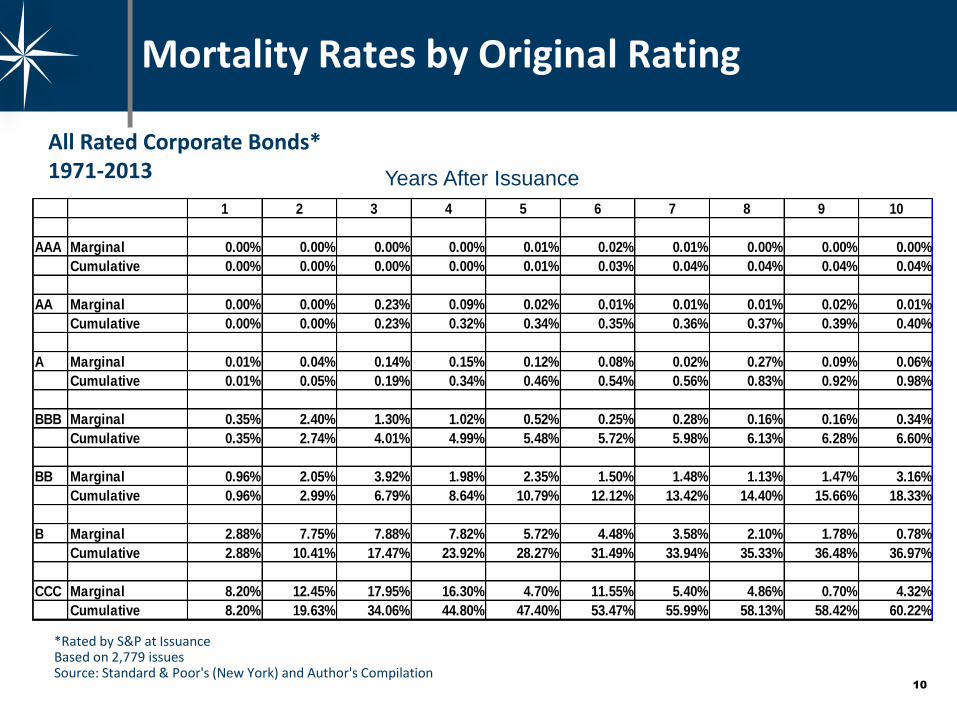
All Rated Corporate Bonds* 1971-2013
Mortality Rates by Original Rating
*Rated by S&P at Issuance Based on 2,779 issues Source: Standard & Poor's (New York) and Author's Compilation
Years After Issuance
1 2 3 4 5 6 7 8 9 10
AAA Marginal 0.00% 0.00% 0.00% 0.00% 0.01% 0.02% 0.01% 0.00% 0.00% 0.00%
Cumulative 0.00% 0.00% 0.00% 0.00% 0.01% 0.03% 0.04% 0.04% 0.04% 0.04%
AA Marginal 0.00% 0.00% 0.23% 0.09% 0.02% 0.01% 0.01% 0.01% 0.02% 0.01%
Cumulative 0.00% 0.00% 0.23% 0.32% 0.34% 0.35% 0.36% 0.37% 0.39% 0.40%
A Marginal 0.01% 0.04% 0.14% 0.15% 0.12% 0.08% 0.02% 0.27% 0.09% 0.06%
Cumulative 0.01% 0.05% 0.19% 0.34% 0.46% 0.54% 0.56% 0.83% 0.92% 0.98%
BBB Marginal 0.35% 2.40% 1.30% 1.02% 0.52% 0.25% 0.28% 0.16% 0.16% 0.34%
Cumulative 0.35% 2.74% 4.01% 4.99% 5.48% 5.72% 5.98% 6.13% 6.28% 6.60%
BB Marginal 0.96% 2.05% 3.92% 1.98% 2.35% 1.50% 1.48% 1.13% 1.47% 3.16%
Cumulative 0.96% 2.99% 6.79% 8.64% 10.79% 12.12% 13.42% 14.40% 15.66% 18.33%
B Marginal 2.88% 7.75% 7.88% 7.82% 5.72% 4.48% 3.58% 2.10% 1.78% 0.78%
Cumulative 2.88% 10.41% 17.47% 23.92% 28.27% 31.49% 33.94% 35.33% 36.48% 36.97%
CCC Marginal 8.20% 12.45% 17.95% 16.30% 4.70% 11.55% 5.40% 4.86% 0.70% 4.32%
Cumulative 8.20% 19.63% 34.06% 44.80% 47.40% 53.47% 55.99% 58.13% 58.42% 60.22%
11
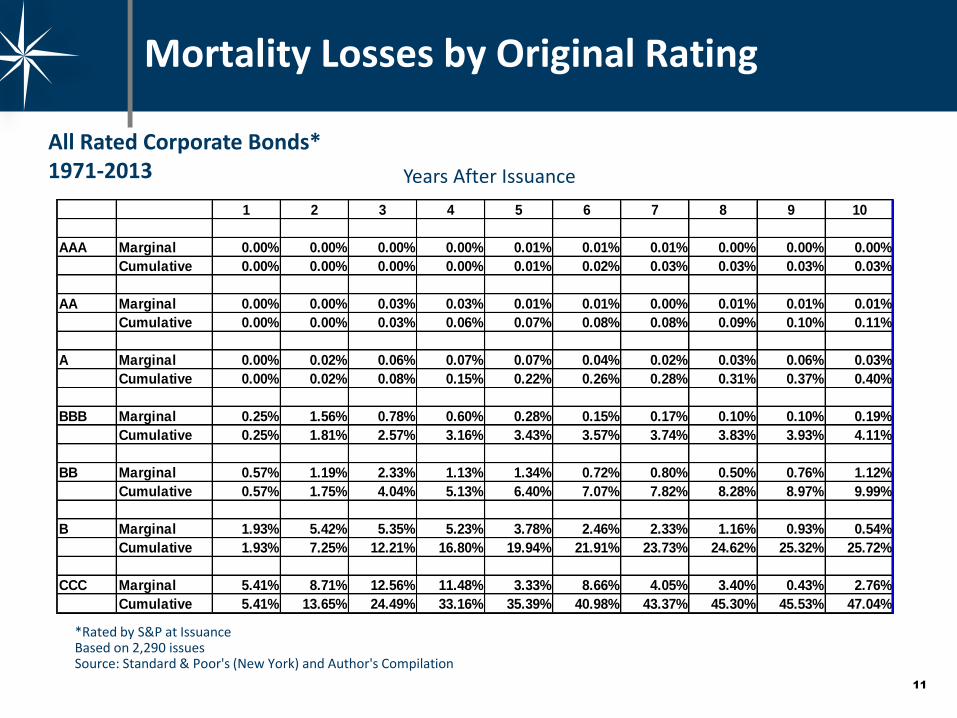
All Rated Corporate Bonds* 1971-2013
Mortality Losses by Original Rating
*Rated by S&P at Issuance Based on 2,290 issues Source: Standard & Poor's (New York) and Author's Compilation
Years After Issuance
1 2 3 4 5 6 7 8 9 10
AAA Marginal 0.00% 0.00% 0.00% 0.00% 0.01% 0.01% 0.01% 0.00% 0.00% 0.00%
Cumulative 0.00% 0.00% 0.00% 0.00% 0.01% 0.02% 0.03% 0.03% 0.03% 0.03%
AA Marginal 0.00% 0.00% 0.03% 0.03% 0.01% 0.01% 0.00% 0.01% 0.01% 0.01%
Cumulative 0.00% 0.00% 0.03% 0.06% 0.07% 0.08% 0.08% 0.09% 0.10% 0.11%
A Marginal 0.00% 0.02% 0.06% 0.07% 0.07% 0.04% 0.02% 0.03% 0.06% 0.03%
Cumulative 0.00% 0.02% 0.08% 0.15% 0.22% 0.26% 0.28% 0.31% 0.37% 0.40%
BBB Marginal 0.25% 1.56% 0.78% 0.60% 0.28% 0.15% 0.17% 0.10% 0.10% 0.19%
Cumulative 0.25% 1.81% 2.57% 3.16% 3.43% 3.57% 3.74% 3.83% 3.93% 4.11%
BB Marginal 0.57% 1.19% 2.33% 1.13% 1.34% 0.72% 0.80% 0.50% 0.76% 1.12%
Cumulative 0.57% 1.75% 4.04% 5.13% 6.40% 7.07% 7.82% 8.28% 8.97% 9.99%
B Marginal 1.93% 5.42% 5.35% 5.23% 3.78% 2.46% 2.33% 1.16% 0.93% 0.54%
Cumulative 1.93% 7.25% 12.21% 16.80% 19.94% 21.91% 23.73% 24.62% 25.32% 25.72%
CCC Marginal 5.41% 8.71% 12.56% 11.48% 3.33% 8.66% 4.05% 3.40% 0.43% 2.76%
Cumulative 5.41% 13.65% 24.49% 33.16% 35.39% 40.98% 43.37% 45.30% 45.53% 47.04%

12
Quality Junk Strategy
12
13
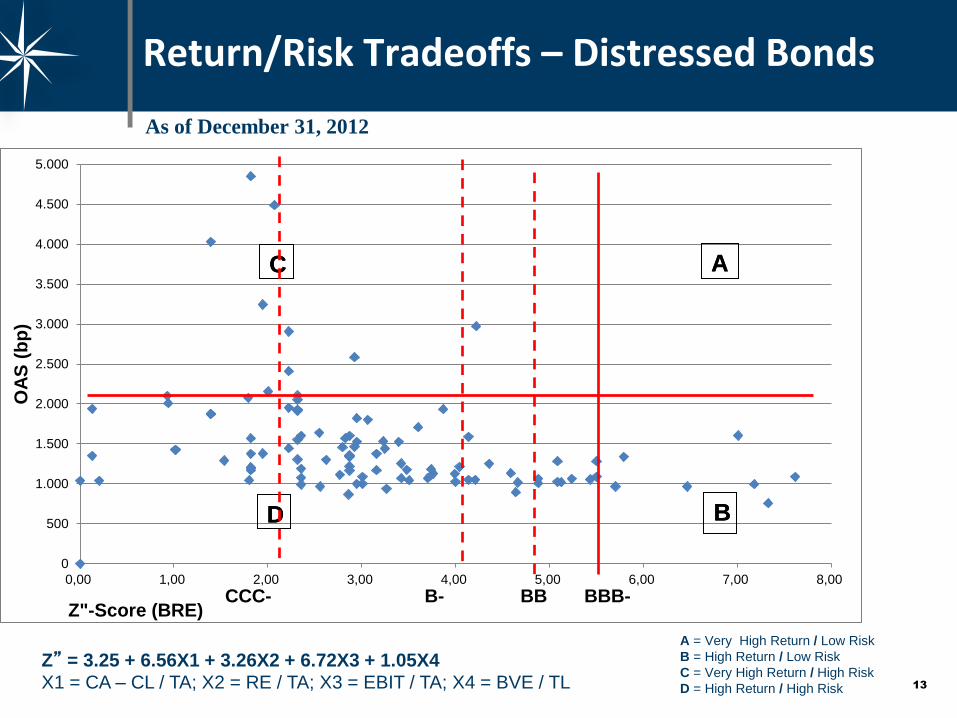
Return/Risk Tradeoffs – Distressed Bonds
0
500
1.000
1.500
2.000
2.500
3.000
3.500
4.000
4.500
5.000
0,00 1,00 2,00 3,00 4,00 5,00 6,00 7,00 8,00
OA
S (
bp
)
Z"-Score (BRE) BBB- BB
A
B
C
D
A
B
C
D
B- CCC-
Z” = 3.25 + 6.56X1 + 3.26X2 + 6.72X3 + 1.05X4
X1 = CA – CL / TA; X2 = RE / TA; X3 = EBIT / TA; X4 = BVE / TL
A = Very High Return / Low Risk
B = High Return / Low Risk
C = Very High Return / High Risk
D = High Return / High Risk
As of December 31, 2012
14
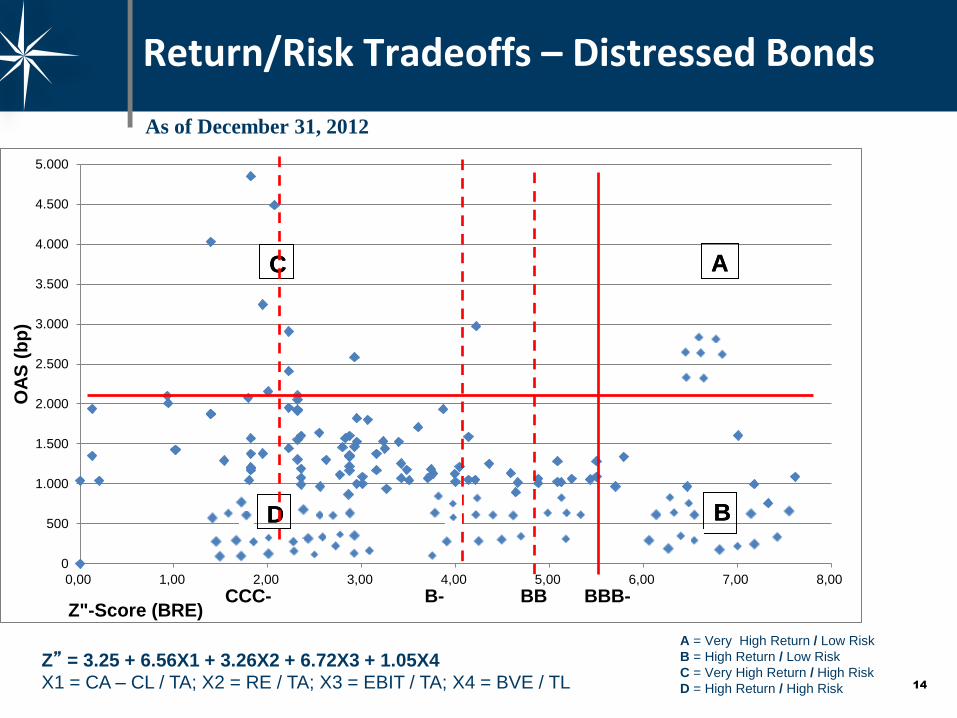
Return/Risk Tradeoffs – Distressed Bonds
0
500
1.000
1.500
2.000
2.500
3.000
3.500
4.000
4.500
5.000
0,00 1,00 2,00 3,00 4,00 5,00 6,00 7,00 8,00
OA
S (
bp
)
Z"-Score (BRE) BBB- BB
A
B
C
D
A
B
C
D
B- CCC-
Z” = 3.25 + 6.56X1 + 3.26X2 + 6.72X3 + 1.05X4
X1 = CA – CL / TA; X2 = RE / TA; X3 = EBIT / TA; X4 = BVE / TL
A = Very High Return / Low Risk
B = High Return / Low Risk
C = Very High Return / High Risk
D = High Return / High Risk
As of December 31, 2012

15
Junk quality strategy or
short high-yield strategy
15
16
Rating Stability and Rating Accuracy are Conflicting Investor’s Objectives
• “Moody’s analysts attempt to balance the market’s need for timely updates on issuer risk profiles, with its conflicting expectation for stable ratings” (Cantor, 2001).
• Rating stability affects the default prediction performance significantly (Altman and Rijken, 2004).
• Hamilton and Cantor (2004) have shown a significant improvement in default prediction when agency ratings are combined with agencies’ Outlook / Review information.
• The agencies “through-the-cycle” methodology is aimed to find an optimal level of rating stability. This “through-the-cycle” methodology has two aspects
– Long default horizon: filtering of short term credit quality fluctuations.
– Prudent migration policy: a rating is triggered if the (long-term) credit quality movements exceeds a certain threshold and - if triggered - it is only partly adjusted.
17
The Impact of Rating-Stability Objectives on the Credit Process
• Ratings stability is an expressed objective and practice of the rating agencies and some investors [Fons, Cantor & Mahoney (Moody’s) 2002, Hamilton & Cantor, 2004 and S&P (2003)].
- Avoiding rating reversals and too frequent rating changes.
• Ratings stability is consistent with a through-the-cycle (TTC) rating strategy, i.e., rating changes should be enduring.
• Impact of the stability objective on the accuracy for Type I (Default) and Type II (Non-Default) forecasts
-Rating agencies’ ratings are likely to have lower Type I accuracy and higher Type II accuracy
-Can partially explain why point-in-time (PIT) models consistently outperform TTC “models” in predicting defaults, e.g., Z-Scores and EDFs have been shown to have lower Type I errors, especially for short-term (one-year) predictive accuracy?
- Longer-term (3-5 years) accuracies tend to be similar between PIT and TTC approaches.
18
Of concern is the Timeliness of Agency Ratings
• Association for Financial Professionals (2002): most respondents believe that agency ratings are slow.
• Baker and Mansi (2001): 27% of the issuers and 71% of the institutional investors have doubts on the timeliness of agency ratings.
• Ellis (1998): 70% of investors indicate ratings should reflect recent changes. even if they are likely to be reversed within a year.
• Saunders and Allen (2002): case studies Enron and Worldcom.
But at the same time investor’s desire rating stability
• Ellis (1998): investor’s don’t want ratings to be updated to reflect small, marginal changes in financial condition.
• Moody’s (2002): Institutional buyside investors value the current rating stability level and do not want ratings to simply follow market prices.
• S&P (2003)
19
Investors, Companies and Financial Authorities Value a Certain Level of Rating Stability
1. "The value of its rating products is greatest when its ratings focus on the long term and do not fluctuate with near term performance. Ratings should never be a mere snapshot of the present situation ratings" (Standard & Poor’s, 2003).
2. Timely ratings, which adjust promptly and fully to the actual creditworthiness, could deepen a financial crisis. Rating stability could dampen procyclicality effects.
3. A certain level of rating stability protects the reputation of agencies. “Better be late and right than fast and wrong”.
20
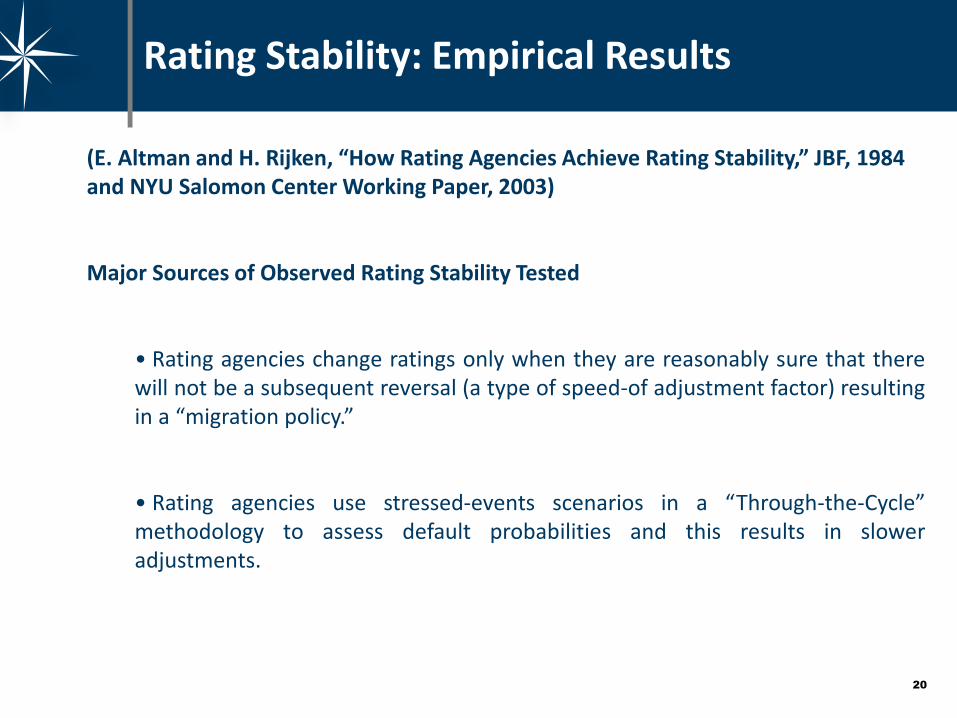
Rating Stability: Empirical Results
(E. Altman and H. Rijken, “How Rating Agencies Achieve Rating Stability,” JBF, 1984 and NYU Salomon Center Working Paper, 2003)
Major Sources of Observed Rating Stability Tested
• Rating agencies change ratings only when they are reasonably sure that there will not be a subsequent reversal (a type of speed-of adjustment factor) resulting in a “migration policy.”
• Rating agencies use stressed-events scenarios in a “Through-the-Cycle” methodology to assess default probabilities and this results in slower adjustments.
21
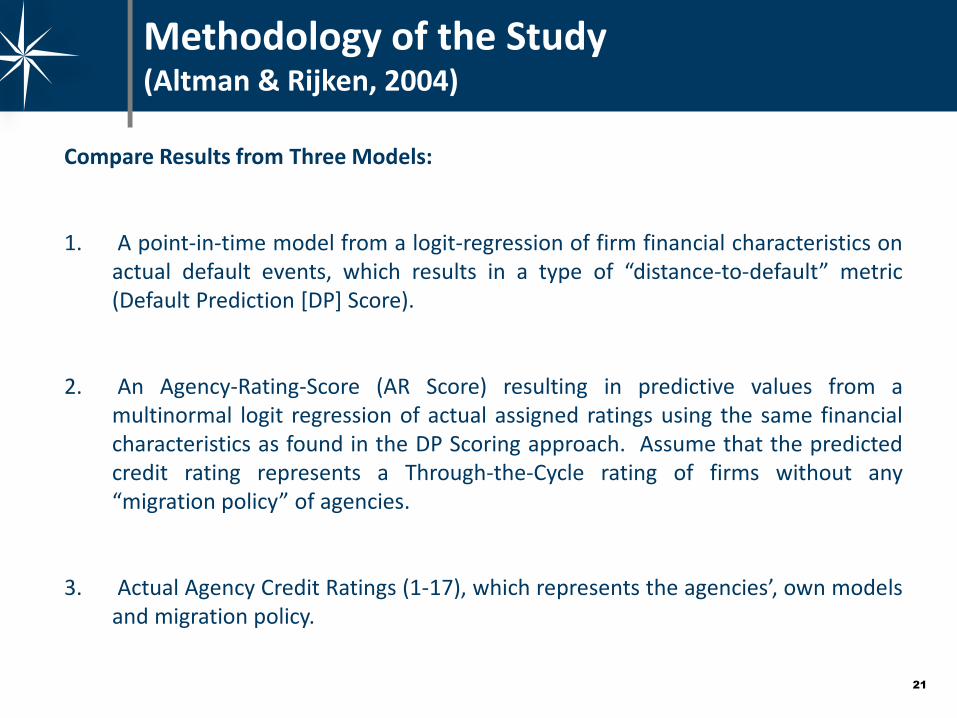
Methodology of the Study (Altman & Rijken, 2004)
Compare Results from Three Models:
1. A point-in-time model from a logit-regression of firm financial characteristics on actual default events, which results in a type of “distance-to-default” metric (Default Prediction [DP] Score).
2. An Agency-Rating-Score (AR Score) resulting in predictive values from a multinormal logit regression of actual assigned ratings using the same financial characteristics as found in the DP Scoring approach. Assume that the predicted credit rating represents a Through-the-Cycle rating of firms without any “migration policy” of agencies.
3. Actual Agency Credit Ratings (1-17), which represents the agencies’, own models and migration policy.
22
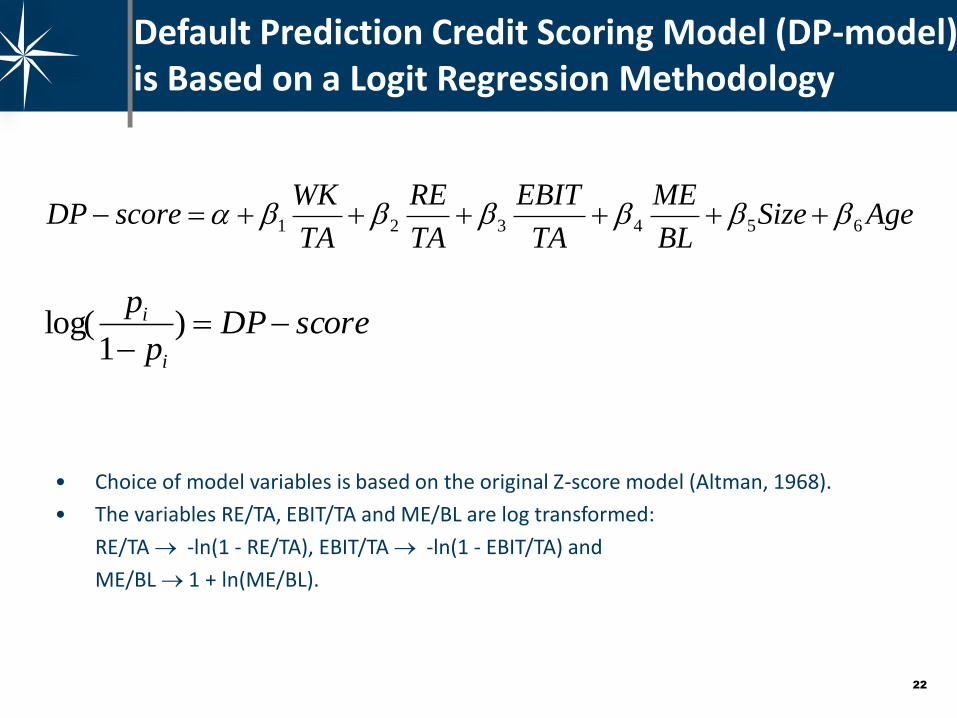
Default Prediction Credit Scoring Model (DP-model) is Based on a Logit Regression Methodology
scoreDPp
p
i
i
)1
log(
AgeSizeBL
ME
TA
EBIT
TA
RE
TA
WKscoreDP 654321
• Choice of model variables is based on the original Z-score model (Altman, 1968).
• The variables RE/TA, EBIT/TA and ME/BL are log transformed:
RE/TA -ln(1 - RE/TA), EBIT/TA -ln(1 - EBIT/TA) and
ME/BL 1 + ln(ME/BL).
23
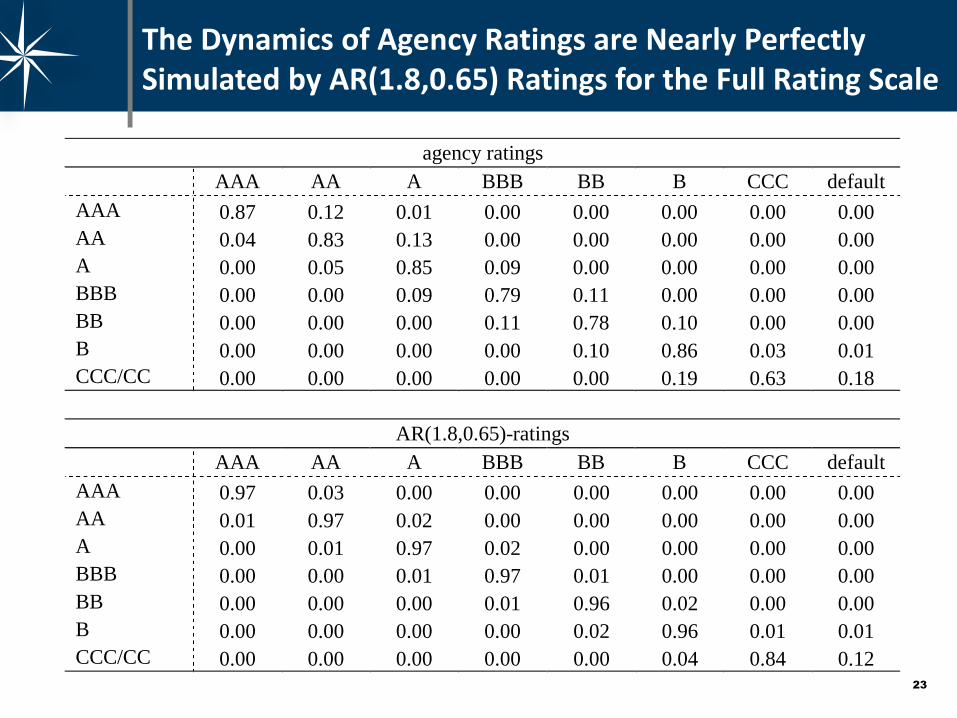
agency ratings
AAA AA A BBB BB B CCC default
AAA 0.87 0.12 0.01 0.00 0.00 0.00 0.00 0.00
AA 0.04 0.83 0.13 0.00 0.00 0.00 0.00 0.00
A 0.00 0.05 0.85 0.09 0.00 0.00 0.00 0.00
BBB 0.00 0.00 0.09 0.79 0.11 0.00 0.00 0.00
BB 0.00 0.00 0.00 0.11 0.78 0.10 0.00 0.00
B 0.00 0.00 0.00 0.00 0.10 0.86 0.03 0.01
CCC/CC 0.00 0.00 0.00 0.00 0.00 0.19 0.63 0.18
AR(1.8,0.65)-ratings
AAA AA A BBB BB B CCC default
AAA 0.97 0.03 0.00 0.00 0.00 0.00 0.00 0.00
AA 0.01 0.97 0.02 0.00 0.00 0.00 0.00 0.00
A 0.00 0.01 0.97 0.02 0.00 0.00 0.00 0.00
BBB 0.00 0.00 0.01 0.97 0.01 0.00 0.00 0.00
BB 0.00 0.00 0.00 0.01 0.96 0.02 0.00 0.00
B 0.00 0.00 0.00 0.00 0.02 0.96 0.01 0.01
CCC/CC 0.00 0.00 0.00 0.00 0.00 0.04 0.84 0.12
The Dynamics of Agency Ratings are Nearly Perfectly Simulated by AR(1.8,0.65) Ratings for the Full Rating Scale
24
Major Findings
• Actual agency ratings are more stable than results using model-ratings from the DP and
AR models. The likelihood of a change in a rating in one year is about three times greater
for a DP-Model than the actual observed rating change.
• We observe a “drift” in ratings over time in actual rating changes whose magnitude is
conditional on whether there was downgrade or an upgrade in the prior period (the well
known autocorrelation of negative rating changes). In contrast, there is no drift observed
in DP or AR model results. [Thus, we conclude the observed “drift” is due to “migration
policy” on the part of rating agencies].
• Agencies only partially adjust their ratings based on comparing changes in AR scores with
actual rating changes (i.e., adjustments are typically made in two or more steps instead
of a full adjustment). The agency rating migration “policy” is characterized by a threshold
of 1.8 notch and an adjustment fraction of 0.65.
• Therefore, both the stability objective and the migration “Policy” of rating agencies affect
the timeliness of agency ratings.

25
Role of a Credit Culture in the
Italian Minibond market
- Greater understanding between borrowers and investors
- Create a Shadow Rating Model
Classis Approach for the Italian Minibond Market

26
26
Disclaimer The information in this document is neither verified nor updated. This document is provided for informational purposes only and is not intended as investment advice or as an offer or solicitation for the purchase or sale of any financial instrument. The authors make no express or implied warranties relating to the information, provided herein or as to the consequences to the recipient from any use whatsoever of this document of the information provided herein. The authors will not be liable in any way for inaccuracies, errors in, or omissions of, or in the transmission of, any use of, information provided in this document, of for any damages arising there from. The information contained herein regarding prices and statistical data, if any, has been obtained from sources which we believe to be reliable but in no way are warranted by us to accuracy or completeness. Copyright, all rights reserved.

27
Classis Capital SIM S.p.A V. Vittor Pisani, 19
20124 Milano
www.classiscapital.it
Classis (classem, classì, classis) è il termine Latino che indica la Flotta. Classis era conosciuta come la flotta navale della marina dell’impero Romano. La sua funzione era quella di controllare le acque attorno alle province di Roma. Il suo compito era quello di dare supporto logistico, tenendo aperte le rotte di comunicazione marittime.


