
The Impact of Payroll Taxes on Informality. The Case of
the 2012 Colombian Tax Reform.
Cristina FernándezLeonardo Villar

Why this might be of interest to SSA and particularly to South
Africa?• Useful for South Africa in the discussion of increasing
its payroll taxes.
• Useful for other countries in Africa that show high payroll taxes as the Cote d’Ivoire, Sudan and Tanzania
• Methodology itself useful in analyzing the impact of labour policies and particularly (but not only) for those countries that do not household panel data.

Colombian Reform Characteristics.• Reduced payroll taxes from
29.5% to 16% of wages.
• It only affects contributionsmade by employers andnot contributions made byworkers.
• The fiscal source of thecontributions was replacedby a profit tax under theassumption that it is betterto tax the capital thanwork.
3% 4%
11%14% 14% 16% 16% 16% 17%
19% 19% 19% 19% 20%21%
25%
29% 29%32%
40%
Hond
uras
Chile
Peru
Ecua
dor
Gua
tem
ala
Uru
guay
Wor
ldLA
CEl
Sal
vado
rCo
lom
bia
Dom
inic
an R
.Pa
ragu
ayBo
livia
Pana
ma
Nic
arag
uaM
exic
o*Co
lom
bia
2013
Arge
ntin
aCo
sta
Rica
Braz
il*
Contributions payable by the employer

Reform characteristics.
Despite this reduction, payroll taxes remainrelatively high at international level.
Source: World Bank * Before the Reform
0.05.0
10.015.020.025.030.035.040.045.0
Braz
ilCo
sta
Rica
Arge
ntin
aCo
lom
bia*
Mex
ico
Cote
d'Iv
oire
Pana
ma
Suda
nBo
livia
Para
guay
Dom
inic
an R
.Co
lom
bia
Cam
eroo
nEl
Sal
vado
rTa
nzan
iaW
orld
Uru
guay SSA
Ghan
aGu
atem
ala
LAC
Ecua
dor
Cong
o D.
R.
Nig
eria
Uga
nda
Peru
Zam
bia
Trin
idad
and
T.
Ethi
opia
Sout
h Af
rica
Chile
Keny
a
Labor tax and contributions (% of profit)

3 HINTS ON THE IMPACT OF THE REFORM

Hint 1: Informality Declined.
Source: Dane GEIH – ECH 13 main metropolitan areas
40%
45%
50%
55%
60%
65%
2000
2002
2004
2006
2008
2010
2012
2014
Informality ratesDifferent measurements.
Firm (newdefinition)
Healthcontributions
Pensioncontributions
Health & pensioncontributions 4.0
4.24.44.64.85.05.25.45.65.86.0
Jan-
09Se
p-09
May
-10
Jan-
11Se
p-11
May
-12
Jan-
13Se
p-13
May
-14
Jan-
15Se
p-15
Mill
ions
of j
obs
Formal and informal workers.
Formal
Informal
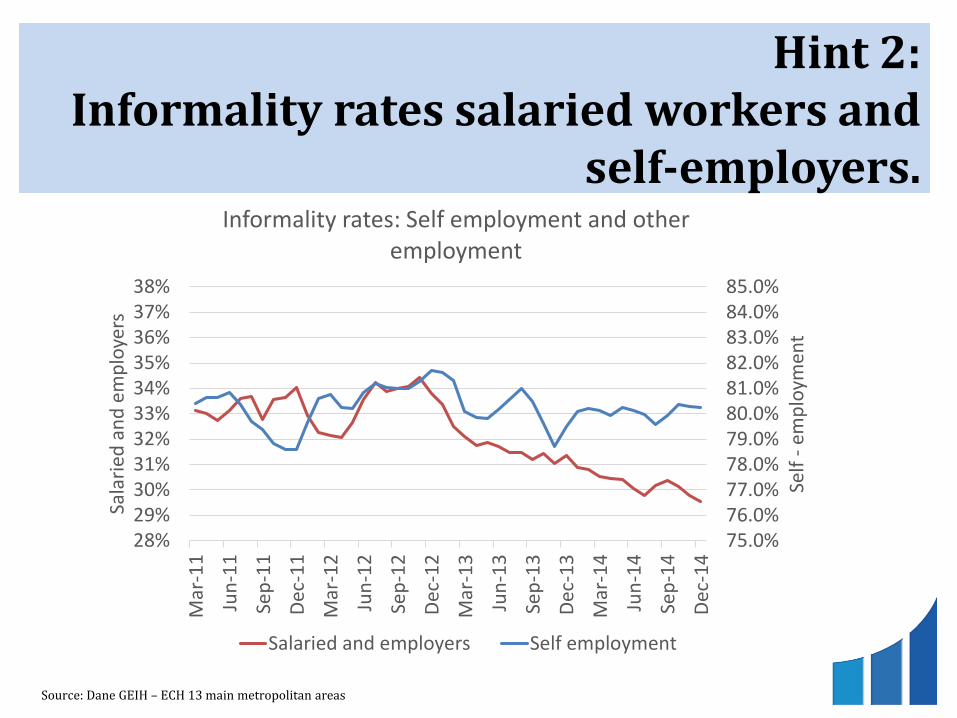
Hint 2: Informality rates salaried workers and
self-employers.
75.0%76.0%77.0%78.0%79.0%80.0%81.0%82.0%83.0%84.0%85.0%
28%29%30%31%32%33%34%35%36%37%38%
Mar
-11
Jun-
11
Sep-
11
Dec-
11
Mar
-12
Jun-
12
Sep-
12
Dec-
12
Mar
-13
Jun-
13
Sep-
13
Dec-
13
Mar
-14
Jun-
14
Sep-
14
Dec-
14
Self
-em
ploy
men
t
Sala
ried
and
empl
oyer
s
Informality rates: Self employment and other employment
Salaried and employers Self employment
Source: Dane GEIH – ECH 13 main metropolitan areas

-10.0%
-8.0%
-6.0%
-4.0%
-2.0%
0.0%
2.0%
4.0%
6.0%
8.0%
40%
42%
44%
46%
48%
50%
52%
54%
1984
1986
1988
1990
1992
1994
1996
1998
2000
2002
2004
2006
2008
2010
2012
2014
Brec
ha d
el p
rodu
cto
Tasa
de
form
alid
adFo
rmal
ity R
ate
Out
put g
ap
Hint 3: Relationship informality - growth
Source: GEIH y Fedesarrollo
--- Formality Rate (OIT, 10). Informality Rate (OIT, 5).Output Gap
Correlations
(2002-2013)
(2002-2015)
0.74** 0.46*
Formality in Colombia is pro-cyclical, except in the most recent period

METHODOLOGY

Objetive: How much of the reduction in informality was due to the reform
To isolate the impact of other variables affecting informality as:• Growth• A general tax increase, including the creation of the
profit tax• Increases in the state payroll (the share fell 3.9% to
3.7% ). • The increase in the minimum wage (adjusted by
productivity) which increased in 1.8 p.p. per year. (increases informality)

Differences in Differences.
• It compares the change in the probability of being informally within the control group with the change in the probability of being informal in the treated group.
• Nets factors that simultaneously affects both groups such as growth.Before After
Treatmenteffect

Control cms Treatment cms
Baseline 100 90
Followup
120140
Differences 20 50
Differences in Differences 30
Differences in Differences.

In the case of the Colombian Reform.
• Treatment group (beneficiaries)– Earn between 1 and 10 salaries.– Do not work at universities / NGOs.– More than two workers
• Control group (neutral)– Earn less than the minimum wage or more than 10
minimum wages.– University workers / NGOs.– Self employment (alternatively excluded)
Government and no reported income - excluded

Graphic Analysis.
• Analysis period:– 2012
(before the reform)
– 2014 (after the reform).
• Long moving averages (volatility).
y = -0.000017x + 0.944726
y = -0.000021x + 1.650880
70%
72%
74%
76%
78%
80%
18.0%
20.0%
22.0%
24.0%
26.0%
28.0%
Mar
-09
Aug-
09Ja
n-10
Jun-
10N
ov-1
0Ap
r-11
Sep-
11Fe
b-12
Jul-1
2De
c-12
May
-13
Oct
-13
Mar
-14
Aug-
14Ja
n-15
Jun-
15N
ov-1
5
Cont
rol g
roup
Trea
ted
grou
p
Informality rates (13 metropolitan areas - 3 month MA)
Treated informality rate No treated informality rate
!stw
aive
r
2nd
wai
ver
Appr
oval
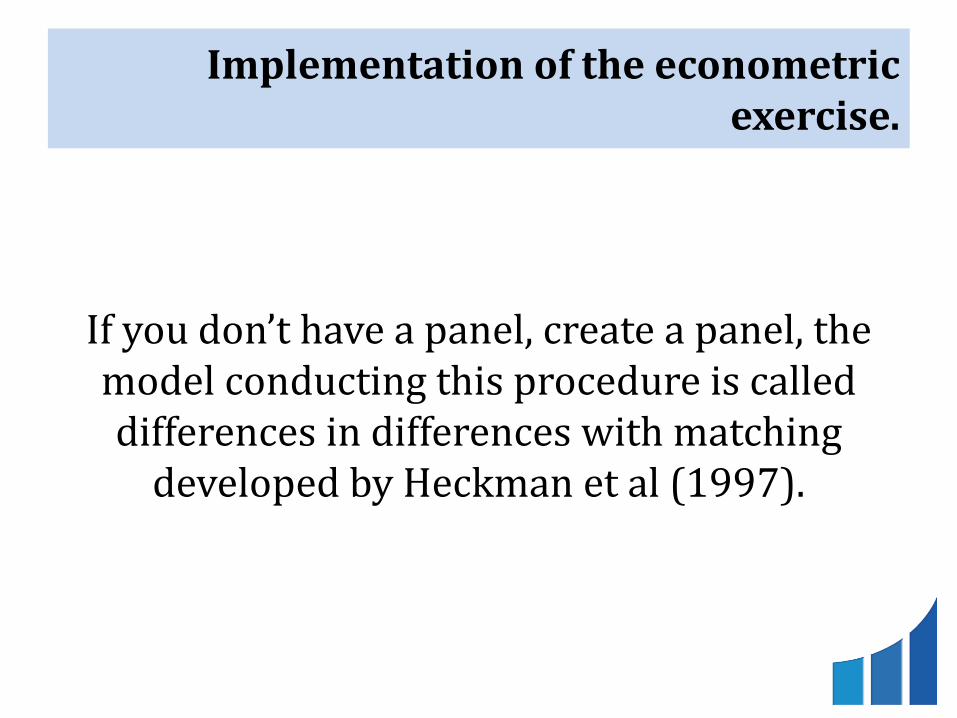
Implementation of the econometric exercise.
If you don’t have a panel, create a panel, the model conducting this procedure is called differences in differences with matching
developed by Heckman et al (1997).
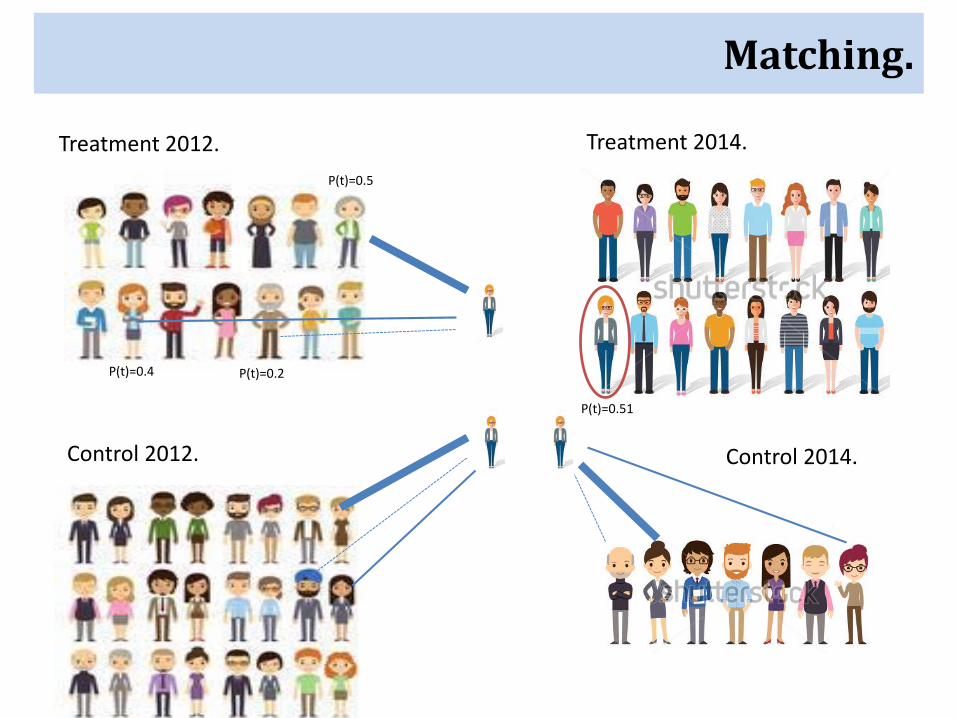
Matching.
P(t)=0.5
P(t)=0.4 P(t)=0.2
Treatment 2012. Treatment 2014.
Control 2014.
P(t)=0.51
Control 2012.

Matching.Treatment 2012. Treatment 2014.
Control 2012. Control 2012.

RESULTS

Control Informality Treatment Informality
Baseline(2012) 76% 28%
Follow Up(2014)
75% 23%
Differences -1% -5%
Differences in Differences -4.3%
% treated 38%
Impact of informality rate -1.6%
Differences in Differences (13 areas).Including self-employment in the control group

Control Informality Treatment Informality
Baseline(2012) 61% 28%
Follow Up(2014)
62% 23%
Differences 1% -5%
Differences in Differences -6.8%
% treated 38%
Impact of informality rate -2.6%
Differences in Differences (13 areas).Excluding self-employment in the control group

Robustness Tests.
• Common Support (similar range of p-scores)
• Quality of Matching (Rubin’s criteria hold)
• Placebo Test (2009-2012: no significant)

Results of past exercises.
• Anton (2014), the recent reform reduced the rate of informality between 2.9 p.p. and 3.4 p.p. Theoretical model.
• Kugler and Kugler (2009), an increase of 10 % in payroll taxes reduces formal employment between 4% and 5 %.
• Mondragón et al (2010), a 10% increase in payroll contributions increases the probability of being informal between 5 % and 8%.
• More recent work on the impact of recent reforms show that the number of formal workers increased between 3.1 and 3.4 p.p. (IDB) and 1 p.p 2014 , 2 p.p. for 2016 and 5.6 p.p. 2018 (Central Bank-preliminar) .

DISTRIBUTION EFFECT

Informality rate by income quintiles.They benefit more those who receive similar income to a minimum because a restriction carving more at this point where wages are not flexible downward shifted.

MDID by economic sector.Including self-employment
• Students with high-school education or less were most favored by the reform.
Baseline (2012) Follow Up (2014)DID
Control Treatment Control Treatment
Low Educated(Primary or less)
92% 49% 92% 39% -10.4%
High school 56% 25% 66% 22% -13%
Tertiary education or
higher56% 14% 54% 11% -1.2% (n.s.)
Male 25-45 years
75% 26% 75% 21% -5%
Source: Own calculations, based on GEIH 2007-2015 *Male 25 – 45 years * Not significant. All the other results aresignificant 99%.
Conclusions.
• The 13.5 points reduction in payroll taxes decreased the informality rate in Colombia in between 4.3 and 6.8 p.p. that impacted the informality rate in between 1.6 and 2.6 points.
• Men in productive years with low levels of education (high school or less) were most favored by the reform.


