1*SANJAY KAILA, G. R. SELOKAR2 AND AMITESH PAUL3
1Department of Mechanical Engineering, RGTU, SSSIST Sehore, MP-Bhopal2Principal of Dept. of Mechanical Engineering, RGTU, SSSIST Sehore, MP-Bhopal
3Head of Dept. of Mechanical Engineering, RGTU, SSSIST Sehore, MP-Bhopal
Corresponding author: *[email protected],[email protected]
ABSTRACT
Municipal waste is the waste because of different humanactivity carried out for human comfort/survive/routinelife. Today than ever before regarding the importance ofenergy conservation measure and its efficient use, theresult achieved so far are insignificant. The primaryobjective of energy conservation measure in the industryis to lower energy is to lower energy costs by reducingthe need for purchased energy. By utilizing waste whichHuman activities create and it is the way these wastes arehandled, stored, collected and disposed of, which can poserisks to the environment and to public health. Industrialcountries account for a disproportionately high share ofthe world’s waste relative to their share of worldpopulation, while developing countries account for adisproportionately high share of the world’s waste relativeto their share of world income. To evaluate the efficiencyobtained from solid waste first law and second lawanalysis are used. Present study concluded that the exergyefficiency is lower (6.77%) in case of textile waste (cottonwaste) due to absent of any catalyst or their present islow compare to any other lignin cellulosic materials butin glossy paper it is found to be 12.06%.
Keywords: Exergy efficiency, Municipal Solid waste(MSW), Glossy paper, textile waste etc.
1. INTRODUCTION
1.1. Characteristics of MSW
Characteristics refers to those physical and chemicalproperties, which are relevant to the storage,collection, treatment and disposal of waste such asdensity, moisture content, calorific value andchemical composite.
The variations in composition andcharacteristics of wastes in different parts of thecountry underscores the profound influences ofnational income, socio-economic conditions, socialdevelopments and cultural practices, and therebyfocuses attention on the importance of obtainingthe data locally. The detail description differentMSW compositions are described by kreith F et al.[1, 2, 3].
Table 1Characteristics of MSW
Average Per Capita Municipal Solid 0.447Waste, kg
Average Per Square km Municipal Solid Waste 4227.34
Average HHV Per kg of Municipal 1720.04Solid Waste (kcal)
Average Recyclables of Municipal 16.21Solid Waste (%)
Average C/N of Municipal Solid Waste Ratio 33.02
Average Moisture of Municipal 47.4Solid Waste (%)
1.2. Exegetic Efficiency
For a control volume at steady state the exergyequation can be written as follows,
Exergy = Exergy out in product + Exergy loss +Exergy destruction
The exergetic efficiency is a measure ofperformance in terms of optimal performancepermitted by both first and second law ofthermodynamics and is devoid of the drawbacksinherent in the definition of first law efficiency.From exergy balance, exergetic efficiency �EX givenby E. L. Masri [4] is defined as,
Exergy out in productExergy inEX� �
Loss Destruction1
InputEX
�� � �
Percentage loss of exergy in the components isdefined as follows,
Loss Destruction* 100
InputEX
�� �
Thus one can find out the components in whichthe losses are considerable, so that one can suggestthe ways of reducing the losses and thus increasethe exergetic efficiency.
48 Sanjay Kaila, G. R. Selokar and Amitesh Paul
2. CONCEPT OF AVAILABLE ENERGY ANDIRREVERSBILITY
2.1. Available Energy and Dead State
The available energy of a system decreases as itstemperature decreases and approaches that of thesurroundings. When heat is transferred from asystem, its temperature decreases and hence thequality of its energy deteriorates. The degradationis more for energy loss at a higher temperature thanthat at a lower temperature. Quantity wise theenergy loss may be the same, but quality wise thelosses are different. While the first law states thatenergy is always conserved quantity wise, thesecond law emphasizes that energy alwaysdegrades quality wise. If the first law is law ofconservation of energy, the second law is called thelaw of degradation of energy. Energy is alwaysconserved, but its quality is always degraded. [5]
Matrida & Stecco [6] performed recently secondlaw analysis has been used extensively for theanalysis and optimization of gas turbine basedcogeneration and combined cycle power plants. Atypical example is the analysis of combined cycles .The combined cycle was analyzed in terms ofexegetic efficiency & exergy losses. High pressures& low superheating temperature resulted in thebetter efficiency. The dual pressure bottomer cyclewas found to have reduced heat transfer & exhaustlosses as compared to a single pressure cycle. Inthe dual pressure cycle the point should be locatedin the higher-pressure zone at off design condition.
It is this dead state which is of relevance incalculation of availability and has been employedby Keenan [7]. A more general dead state would beone in which the system and the environment areadditionally in chemical equilibrium, so thatadditional work will be released as a result of thedifference in composition between the contents ofcontrol mass and the environment. Itsdetermination requires a details description of thestate of the environment. It is this dead state whichis of relevance in calculation of exergy and has beenemployed by rant [8].
2.2. Irreversibility
Irreversibility is the destruction of availability inany real process. Unlike energy, availability is notconserved it is destroyed due to irreversibilites. Theeffect of irreversibilites, embodied in the productionof entropy, is to decrease the work below themaximum work. The destruction of availability is
proportional to creation of entropy due toirreversibility. The quantitative expression of theabove statement is termed as the ‘Guoy – Stodolatherorem’. [9]
3. RESULTS OF EXERGY EXTRACTIONANALYSIS
3.1. Using Glossy Paper Waste Composition
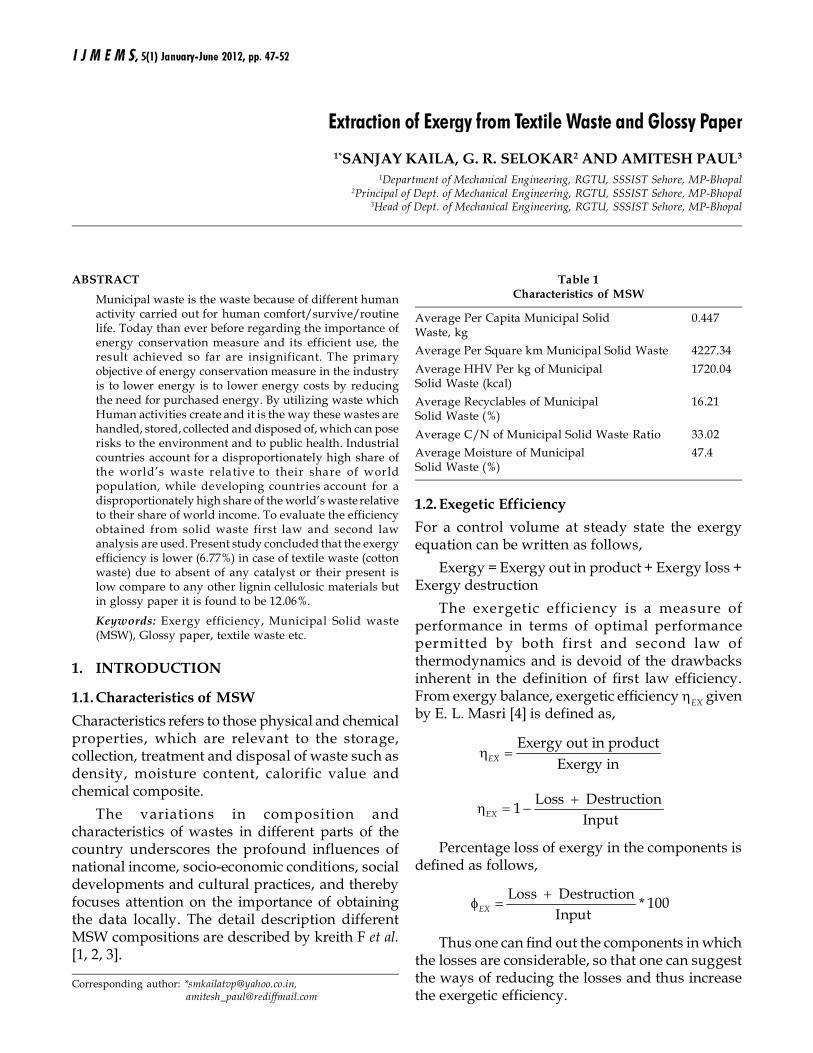
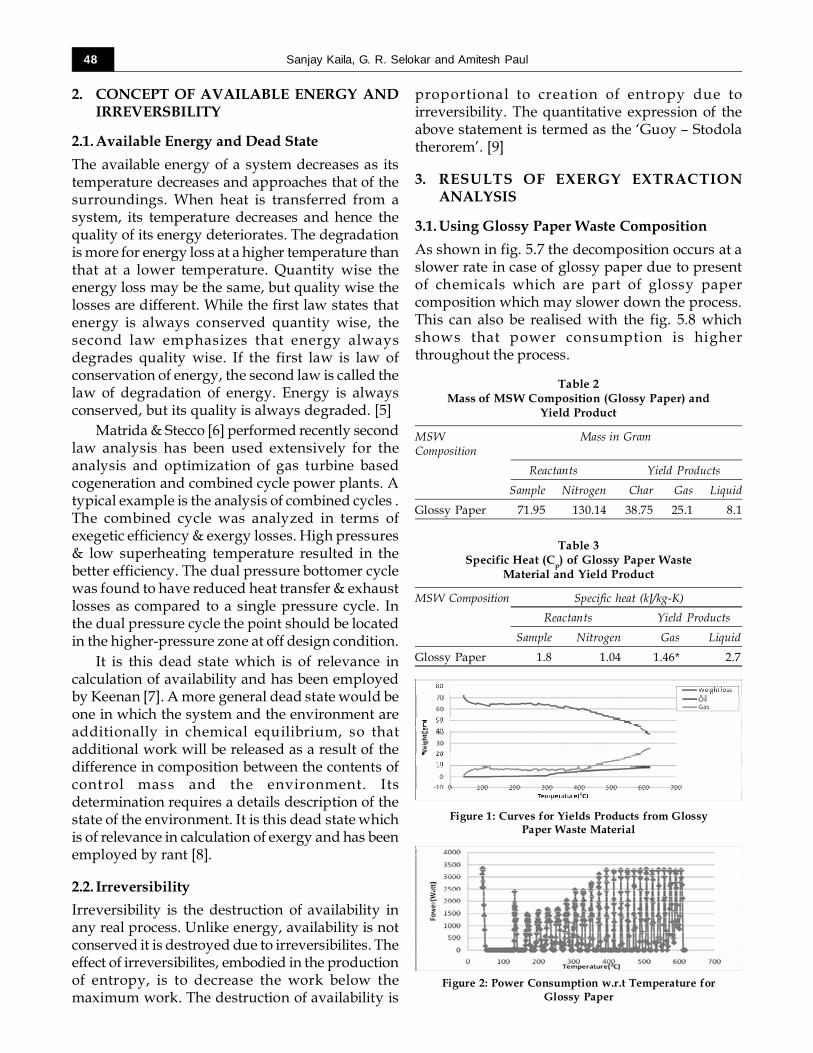
As shown in fig. 5.7 the decomposition occurs at aslower rate in case of glossy paper due to presentof chemicals which are part of glossy papercomposition which may slower down the process.This can also be realised with the fig. 5.8 whichshows that power consumption is higherthroughout the process.
Table 2Mass of MSW Composition (Glossy Paper) and
Yield Product
MSW Mass in GramComposition
Reactants Yield Products
Sample Nitrogen Char Gas Liquid
Glossy Paper 71.95 130.14 38.75 25.1 8.1
Table 3Specific Heat (Cp) of Glossy Paper Waste
Material and Yield Product
MSW Composition Specific heat (kJ/kg-K)
Reactants Yield Products
Sample Nitrogen Gas Liquid
Glossy Paper 1.8 1.04 1.46* 2.7
Figure 1: Curves for Yields Products from GlossyPaper Waste Material
Figure 2: Power Consumption w.r.t Temperature forGlossy Paper
Extraction of Exergy from Textile Waste and Glossy Paper 49
Table 4Ultimate Analysis of Glossy Paper Waste Material
Ultimate Analysis
Carbon(% wt.) Hydrogen(%wt.) Nitrogen(%wt.) Sulfur(%wt.) Oxygen (%wt.) GCV( kJ/kg)
53.99 3.24 0.8 0.68 15.89 6280.5
Table 5Proximate Analysis of Glossy Paper Waste Material
Proximate AnalysisMoisture (%wt.) Volatile Matter (%wt.) Fix Carbon (%wt.) Ash (% wt.)
3.46 66.14 5.0 25.4
Table 6Ultimate Analysis Glossy Paper Waste Material Yield Product
Ultimate Analysis
Yield Product Carbon H-ydrogen Nitrogen Sulphur Oxygen GCV(%wt.) (% wt.) (% wt.) (% wt.) (% wt.) (kJ/kg)
Pyrolytic Oil 44.11 5.92 0.02 Absent 49.35 1507.32
Char 36.82 Absent Absent Absent 0.71 8248.39
Table 7Proximate Analysis of Glossy Paper Waste Material
Proximate Analysis
Yield Product Moisture(%wt.) Volatile Matter(%wt.) Fix Carbon(%wt.) Ash(% wt.)
Pyrolytic Oil 31.11 63.61 4.68 0.60
Char 0.01 1.20 36.32 62.47
Table 8Gas Composition of Glossy Paper Waste Material
Butane Carbon Carbon Oxygen Ethane Propane Methane Nitrogen GCV(%wt.) Dioxide Monoxide (% wt.) (%wt.) (%wt.) (%wt.) (%wt.) ( kJ/kg)
(%wt.) (%y wt.)
ND 6.44 7.781 2.8 2.76 3.5 35.92 40.799 12561
The efficiency in case of glossy paper is highercompare to newspaper though during the processmaximum time energy consumptioncorresponding to different temperature but thechemicals which are present in the compositionare decomposed at higher temperature and somore amount of yield products are available at theend of process.
The exergy efficiency of BTP is higher withglossy paper composition compare to news paperwaste due to efficiency is higher as per first law of
thermodynamic as the yield products produce aremore in case of glossy paper.
3.2. Using Textile Waste Material
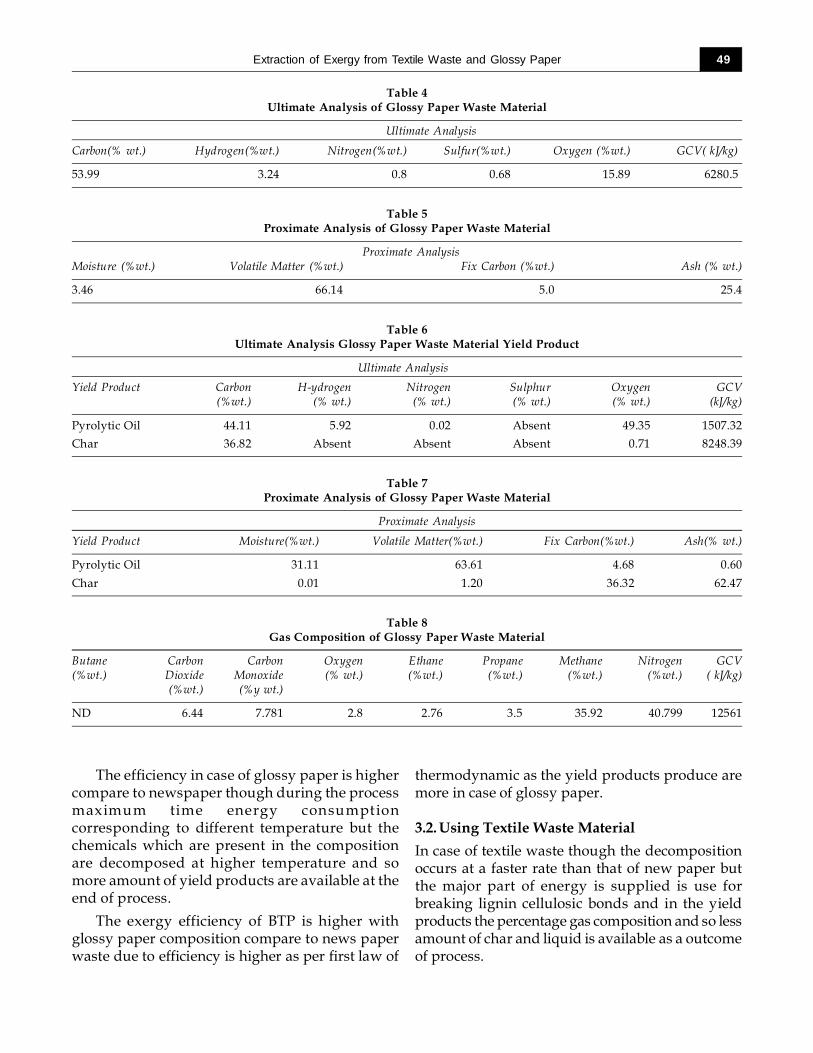
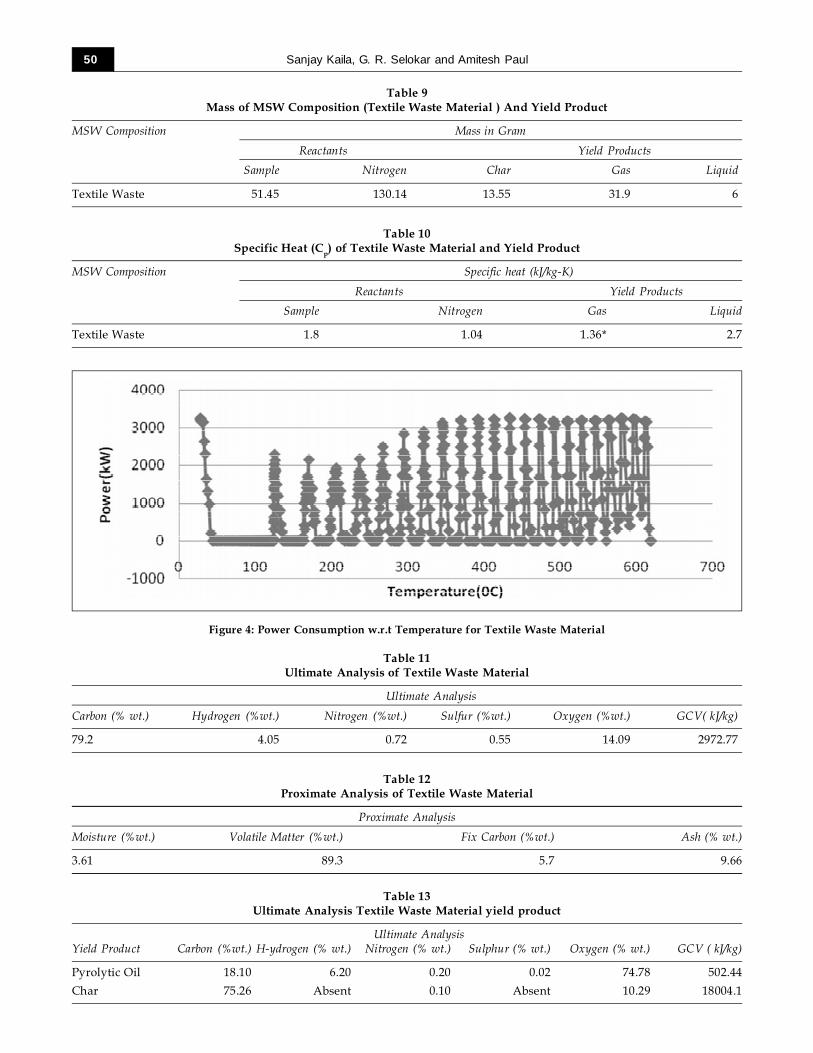
In case of textile waste though the decompositionoccurs at a faster rate than that of new paper butthe major part of energy is supplied is use forbreaking lignin cellulosic bonds and in the yieldproducts the percentage gas composition and so lessamount of char and liquid is available as a outcomeof process.
50 Sanjay Kaila, G. R. Selokar and Amitesh Paul
Table 9Mass of MSW Composition (Textile Waste Material ) And Yield Product
MSW Composition Mass in Gram
Reactants Yield Products
Sample Nitrogen Char Gas Liquid
Textile Waste 51.45 130.14 13.55 31.9 6
Table 10Specific Heat (Cp) of Textile Waste Material and Yield Product
MSW Composition Specific heat (kJ/kg-K)
Reactants Yield Products
Sample Nitrogen Gas Liquid
Textile Waste 1.8 1.04 1.36* 2.7
Figure 4: Power Consumption w.r.t Temperature for Textile Waste Material
Table 11Ultimate Analysis of Textile Waste Material
Ultimate Analysis
Carbon (% wt.) Hydrogen (%wt.) Nitrogen (%wt.) Sulfur (%wt.) Oxygen (%wt.) GCV( kJ/kg)
79.2 4.05 0.72 0.55 14.09 2972.77
Table 12Proximate Analysis of Textile Waste Material
Proximate Analysis
Moisture (%wt.) Volatile Matter (%wt.) Fix Carbon (%wt.) Ash (% wt.)
3.61 89.3 5.7 9.66
Table 13Ultimate Analysis Textile Waste Material yield product
Ultimate AnalysisYield Product Carbon (%wt.) H-ydrogen (% wt.) Nitrogen (% wt.) Sulphur (% wt.) Oxygen (% wt.) GCV ( kJ/kg)
Pyrolytic Oil 18.10 6.20 0.20 0.02 74.78 502.44
Char 75.26 Absent 0.10 Absent 10.29 18004.1
Extraction of Exergy from Textile Waste and Glossy Paper 51
The exergy efficiency is lower compare to newspaper composition due to fewer amounts of liquidexergy of yield product of textile waste and the yieldproduct compositions in terms of percentage is alsolower.
4. CONCLUSIONS AND COMPARISONS OFRESULTS
4.1. Comparisons of Results
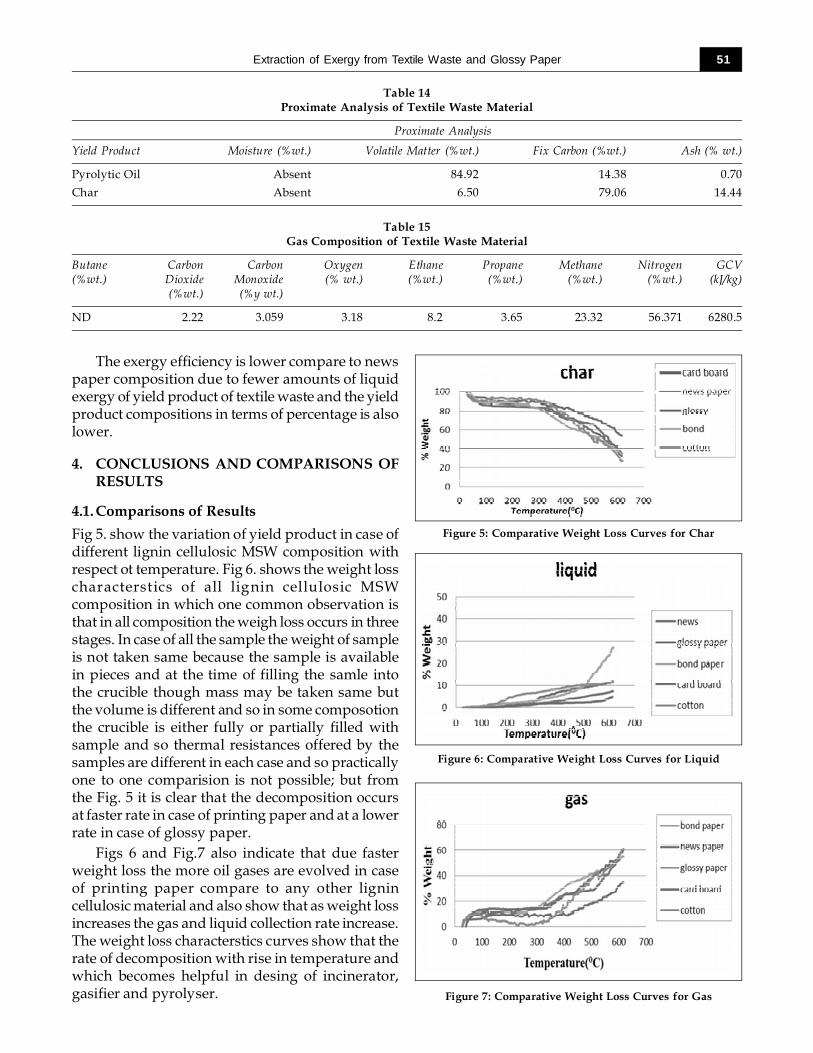
Fig 5. show the variation of yield product in case ofdifferent lignin cellulosic MSW composition withrespect ot temperature. Fig 6. shows the weight losscharacterstics of all lignin cellulosic MSWcomposition in which one common observation isthat in all composition the weigh loss occurs in threestages. In case of all the sample the weight of sampleis not taken same because the sample is availablein pieces and at the time of filling the samle intothe crucible though mass may be taken same butthe volume is different and so in some composotionthe crucible is either fully or partially filled withsample and so thermal resistances offered by thesamples are different in each case and so practicallyone to one comparision is not possible; but fromthe Fig. 5 it is clear that the decomposition occursat faster rate in case of printing paper and at a lowerrate in case of glossy paper.
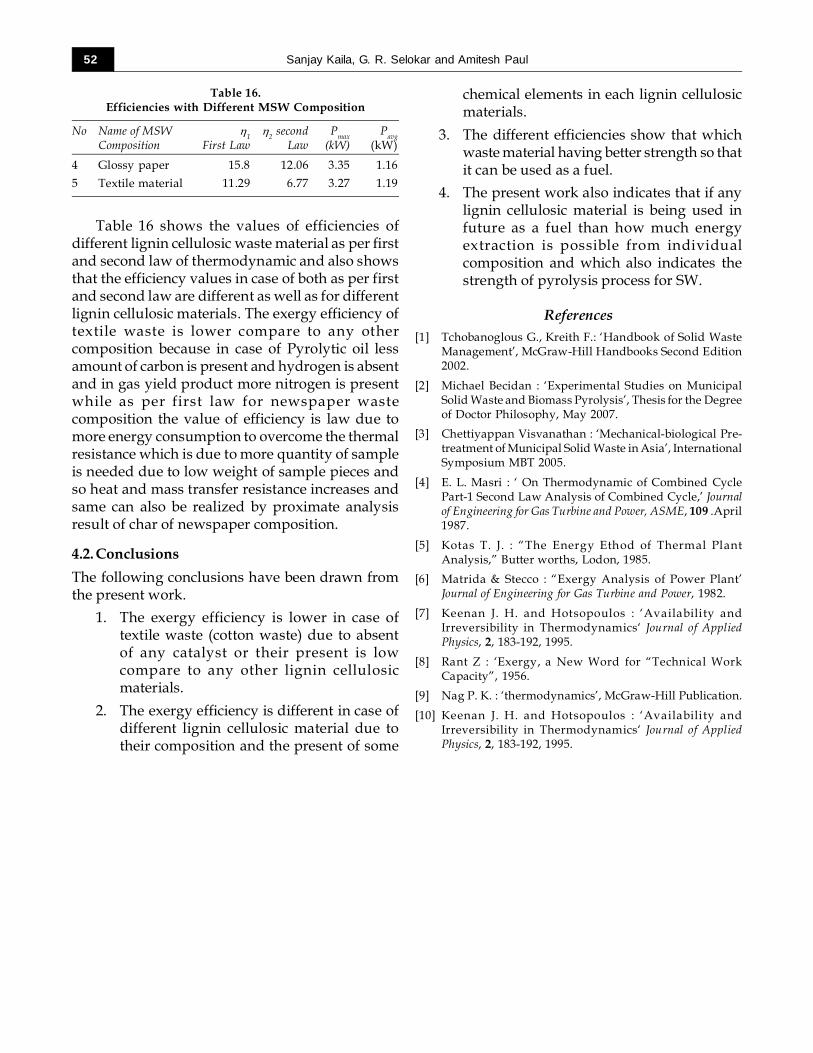
Figs 6 and Fig.7 also indicate that due fasterweight loss the more oil gases are evolved in caseof printing paper compare to any other lignincellulosic material and also show that as weight lossincreases the gas and liquid collection rate increase.The weight loss characterstics curves show that therate of decomposition with rise in temperature andwhich becomes helpful in desing of incinerator,gasifier and pyrolyser.
Table 14Proximate Analysis of Textile Waste Material
Proximate Analysis
Yield Product Moisture (%wt.) Volatile Matter (%wt.) Fix Carbon (%wt.) Ash (% wt.)
Pyrolytic Oil Absent 84.92 14.38 0.70
Char Absent 6.50 79.06 14.44
Table 15Gas Composition of Textile Waste Material
Butane Carbon Carbon Oxygen Ethane Propane Methane Nitrogen GCV(%wt.) Dioxide Monoxide (% wt.) (%wt.) (%wt.) (%wt.) (%wt.) (kJ/kg)
(%wt.) (%y wt.)
ND 2.22 3.059 3.18 8.2 3.65 23.32 56.371 6280.5
Figure 5: Comparative Weight Loss Curves for Char
Figure 6: Comparative Weight Loss Curves for Liquid
Figure 7: Comparative Weight Loss Curves for Gas
52 Sanjay Kaila, G. R. Selokar and Amitesh Paul
Table 16.Efficiencies with Different MSW Composition
No Name of MSW �1 �2 second Pmax PavgComposition First Law Law (kW) (kW)
4 Glossy paper 15.8 12.06 3.35 1.16
5 Textile material 11.29 6.77 3.27 1.19
Table 16 shows the values of efficiencies ofdifferent lignin cellulosic waste material as per firstand second law of thermodynamic and also showsthat the efficiency values in case of both as per firstand second law are different as well as for differentlignin cellulosic materials. The exergy efficiency oftextile waste is lower compare to any othercomposition because in case of Pyrolytic oil lessamount of carbon is present and hydrogen is absentand in gas yield product more nitrogen is presentwhile as per first law for newspaper wastecomposition the value of efficiency is law due tomore energy consumption to overcome the thermalresistance which is due to more quantity of sampleis needed due to low weight of sample pieces andso heat and mass transfer resistance increases andsame can also be realized by proximate analysisresult of char of newspaper composition.
4.2. Conclusions
The following conclusions have been drawn fromthe present work.
1. The exergy efficiency is lower in case oftextile waste (cotton waste) due to absentof any catalyst or their present is lowcompare to any other lignin cellulosicmaterials.
2. The exergy efficiency is different in case ofdifferent lignin cellulosic material due totheir composition and the present of some
chemical elements in each lignin cellulosicmaterials.
3. The different efficiencies show that whichwaste material having better strength so thatit can be used as a fuel.
4. The present work also indicates that if anylignin cellulosic material is being used infuture as a fuel than how much energyextraction is possible from individualcomposition and which also indicates thestrength of pyrolysis process for SW.
References[1] Tchobanoglous G., Kreith F.: ‘Handbook of Solid Waste
Management’, McGraw-Hill Handbooks Second Edition2002.
[2] Michael Becidan : ‘Experimental Studies on MunicipalSolid Waste and Biomass Pyrolysis’, Thesis for the Degreeof Doctor Philosophy, May 2007.
[3] Chettiyappan Visvanathan : ‘Mechanical-biological Pre-treatment of Municipal Solid Waste in Asia’, InternationalSymposium MBT 2005.
[4] E. L. Masri : ‘ On Thermodynamic of Combined CyclePart-1 Second Law Analysis of Combined Cycle,’ Journalof Engineering for Gas Turbine and Power, ASME, 109 .April1987.
[5] Kotas T. J. : “The Energy Ethod of Thermal PlantAnalysis,” Butter worths, Lodon, 1985.
[6] Matrida & Stecco : “Exergy Analysis of Power Plant’Journal of Engineering for Gas Turbine and Power, 1982.
[7] Keenan J. H. and Hotsopoulos : ‘Availability andIrreversibility in Thermodynamics‘ Journal of AppliedPhysics, 2, 183-192, 1995.
[8] Rant Z : ‘Exergy, a New Word for “Technical WorkCapacity”, 1956.
[9] Nag P. K. : ‘thermodynamics’, McGraw-Hill Publication.
[10] Keenan J. H. and Hotsopoulos : ‘Availability andIrreversibility in Thermodynamics‘ Journal of AppliedPhysics, 2, 183-192, 1995.


