
1
A Structured Methodology for Developing a Service Operations Strategy
The Case of BTC-Egypt
Sherwat E. Ibrahim, Ph.D.�, Assistant Professor, American University in Cairo, Egypt Ahmed Khodeir, MBA Student, Maastricht School of Management, Maastricht, The Netherlands
Purpose
This study aims to present a structured methodology that can be used to assist decision-
makers in developing their service operations strategy and their leading competitive priorities.
Design/methodology/approach
In this constructive case study for BTC-Egypt; an IT service provider, we relate the previous
success of the company�s sales operations with the prioritized operational strategy during
their previous sales. Decision-makers use an AHP model to measure the relative importance
ratings given to a comprehensive set of competitive priorities derived from accumulated
literature. Qualitative analysis for individual operations and quantitative analysis including
Logistic regression and correlations are used to analyze the data.
Findings
The proposed structured approach assisted BTC-Egypt in determining its competitive
priorities and identified the different market segments. While Quality as an operation strategy
was rated the highest across all sales, Customer Focus and Service Provision were the two
most differentiating variables.
Practical implications, limitations and originality
The methodology used in this study is unique. While the origin of the competitive priorities
are well grounded in the literature, and the relative ratings have been applied before to these
priorities in other studies, this study uses the relative ratings to analyze each sale project
within a company to come out with a structured methodology in determining the competitive
priorities of a company based on it previous performance. The simple classification of the
sales according to their success denoted by a purchase order, while has its limitations, is also
an attractive alternative compared to other more complicated performance measures criteria.
� Corresponding Author Tel: 201 681 7154 Tel: 201203 3806 Email: [email protected]

2
INTRODUCTION Formulating a business strategy entails positioning a company among its competitors
and identifying how one competes in the marketplace. Strategic positioning involves a
decision making process of choosing one or two important competences on which to
concentrate on and do well. The determination of the competitive priorities is the first step in
developing and explaining the competitive strategy and for achieving its goals. (Wheelwright
1978) There is a significant relationship between the business environment in terms of
competitive hostility and the operation strategy a business chooses in terms of its competitive
priorities (Ward et el 1995). Companies that are well positioned have competitive priorities
that are strongly supported by its operations strategy and decisions (Hill 1993, Kim and
Arnold 1996, Boyer and McDermott 1999, Smith and Reece 1999, Acur et al. 2003,
Christiansen et al. 2003, Swink et al. 2005). Trade-off studies examine the need for
companies to prioritize their strategic objectives and devote resources to improving those
operational capabilities. It is stressful for a company to try to compete by offering superior
performance along all of competitive dimensions, since it will probably end up second best on
each dimension to some other company that devotes more of its resources to developing that
competitive advantage. The determination of competitive priorities usually starts with an
extensive study of a company�s operations in which strengths and capabilities that create
competitive advantage are identified. Creating a competitive advantage requires determining
the factors that put a firm in a better position in comparison to what competitors have in the
marketplace.
Barnes (2001) points to the debate related to the process of strategy formation. He
suggests that a combination of communicated senior management �intentions� together with
on-going decisions and actions carried out by people in an organization result in an �intended
and emergent� process of strategy formulation. Applying this to operation strategy, he quotes

3
from Hayes and Wheelwright, (1984 p. 30) �it is the patterns of decisions actually made�
that constitute a functions strategy, not what is said or written in annual reports and planning
documents� indicating that operations strategy might have emergent rather than deliberate
features. In this study we follow this emergent approach in identifying a company�s
competitive priorities. Instead of analyzing the company�s capabilities and identifying the
core operational competencies as perceived by upper management, we ask lower level
managers to identify the variables that allowed them to compete successfully in different
situations.
BTC-Egypt has been operating for the past six years with no clear operation strategy.
What has trickled down from the mother company related to quality and customer service has
been diluted with the harsh realities of the local market and competition. In turn BTC Egypt
has been alternating between conflicting operational strategies without a clear vision of what
really works. For example, the level of know-how varies widely with respect to employees
and projects. Some projects require no design from BTC�s side and some require extensive
work and iterations till the design is complete.
Meetings with upper management indicated a lack of strategic view and operational
consistency throughout the organization. Sales efforts have been alternating between
different competitive priorities and targeted market segments are very diverse. Our goal for
this study is to assist BTC-Egypt to determine which competitive priorities they should
emphasize in their operational strategy. While every one calls for quality at BTC-Egypt, we
test to see if this is a differentiating factor when winning a sale. Six service competitive
priorities will be compared in light of the success and failure of BTC�s previous sales records,
and interaction with the different market segments will also be tested. A survey sample
consisting of 103 stratified Quantitative sales cases and 10 qualitative analysis sales cases are

4
used to examine the model propositions. An AHP model to measure the relative importance
ratings given to the competitive priorities will be used. Qualitative analysis for individual
operations and quantitative analysis including logistic regression and correlations are used to
analyze the data.
The study is organized as follows. The remainder of this section presents the literature
reviewing the different competitive priorities and the debate on trade-off, cumulative, and
integrative models and summarize their varied arguments. The business nature of IT service
providers is explained and the case of BTC is presented. Section two introduces the
theoretical framework. Section three represents the research design and methodology
followed. Section four discusses the data collection process and analysis, followed by a
detailed discussion of the study results. Section five represents the conclusion and includes
recommendations for future research.

5
Background
The literature on operations strategy has extensively focused on the competitive priorities that
act as strategic capabilities which can help organizations create and sustain the competitive
advantage. In these means competitive priorities could be defined as �the dimensions that a
firm�s operation system must possess to achieve its goals and objectives in the markets they
decided to compete in� (Wheelwright 1989). Competitive priorities are key decision
variables for operations managers and researchers. They denote a strategic emphasis on
developing certain operational capabilities that may enhance a company�s position in the
marketplace. Such emphasis may guide decisions regarding the process design, capacity,
partnership, technology, planning, and control (Skinner 1974; Hayes and Wheelwright 1985).
Competitive Priorities: From Manufacturing to Services Competitive Priorities
Over the past two decades, a relatively shared framework of the content of operations strategy
has emerged. Most researchers view operations strategy as defined by the relative weighting
of business capabilities, including low cost, quality, flexibility, and delivery (Skinner 1970;
Hayes and Wheelright, 1984; Ferdows and De Meyer, 1990; Ward et al, 1998; Ward and
Duray, 2000; Dangayach & Deshmukh, 2001; Boyer and Lewis, 2002). Studies focusing on
the service industries usually add responsiveness, innovativeness, and customer service as
additional priorities (Leong, Snyder, and Ward 1990; Miller and Roth, 1994; Schmenner and
Swink 1998; Ward, McCreery, Ritzman, and Sharma 1998; Frohlich and Dixon, 2001;
Takala, 2002, Lee, 2002). The recent pressures from globalization and rapid changes in
technologies have increased an interest on competitive priorities among companies. These
priorities have changed dramatically from the 1970s until the 1990s from focused to multi-

6
focused (Takala, et al 2005). The primary change was from cost to quality, and eventually to
delivery and responsiveness. More recently, firms have placed greater emphasis on flexibility
and agility while maintaining high performance on dependability, quality, and cost (Vokurka
and Fliedner, 1998; Helo, 2005).
Table 1 shows the evolvement of competitive priorities in the operations literature
from manufacturing to service oriented business over the past twenty years. To present our
comparisons over time of the different competitive priority sets, we selected the work done by
Adams and Swamidass (1989), Ward et al (1998), and Phusavat and Kanchana (2008)�.
Selection was based on dispersed time between studies and the level of detail communicated
in the papers (item questions for questionnaires). All three studies considered acknowledge
previous literature and take major steps in developing measurements for competitive
priorities. We also include the survey questions that were used in this study in the last
column of Table 1 to show from where they were derived.
The first two columns of the table present Adam and Swamidass (1989); Ward et al
(1998)§ listing four sets of competitive priorities mainly derived from the literature on
operations for the manufacturing sector (cost, quality, delivery and flexibility). In the third
column Phusavat and Kanchana (2008) add �customers focus� and �know-how� as essential
priorities for the operations strategies for the service sector. Phusavat and Kanchana (2008)
also use the term �Service provision� instead of �delivery� where they widen the definition of
delivery to include delivery in terms of agreed quantity and quality of the delivered product or
service, and not just timely delivery as defined in earlier studies. We did our best effort to
� Phusavat and Kanchana (2008) survey is adapted from Takala, J. (2002) �Analyzing and synthesizing multi-
focused manufacturing strategies by analytical hierarchy process�. Journal of Manufacturing technology and
Management, 345-350.
§ The questionnaire used by Ward et al, includes a section on evaluating the performance of manufacturing line
managers and supervisors, which we exclude from our analysis.

7
map and group the competitive priorities stated by each researcher based on the description
and definitions of the variables.
Adam and Swamidass (1989) Ward et al (1998) Phusavat and Kanchana (2008)
Retail and Service Providers
Cost Cost Cost Cost Reduce inventory Reducing inventory Low vendor costs Increase capacity utilization Capacity utilization Low waste resources cost Reduce Production cost Production cost Low cost Low operational costs Productivity Productivity Value added Quality costs Low quality costs Activity based measurement Continuous improvement Profit margins Quality Quality Quality Quality Reliability & consistency High product reliability Consistency High Performance High product performance Performance Performance of products Conformance to specification Conformance to design specs Reliability of products High product durability Reliability of services design Ease to service product Promptness in solving complaints Low installation error rate Environmental aspects Low repeated work Certification Delivery Delivery Service Provision Service Provision Manufacturing lead time Reduce production lead time Fast provision Fast provision Due date (delivery promises) Delivery on due date Dependable promise Dependable promises Frequent delivery (fast delivery) On-time delivery Agreed time Agreed time Rate of product introduction Short delivery time Fast provision* Agreed amount Agreed amount and terms Agreed quality Agreed quality Flexibility Flexibility Flexibility Flexibility Adjusting capacity Rapid capacity adjustment Broad range of capacity Rapid Volume changes Changes in amount of services Number of Product features Number of product features Rapid changes to existing products
Design changes in production Service adjustment
Degree of product variety Broad service line Broad range services offered Adjust product mix New products into production Mix changes Broad range of products
offered Broad range of technologies Customer Focus Customer Focus Measurement of satisfaction After-sales follow-up After-sales follow up After-sales follow-up* Customer information Customer information Customization Customization Contractual agreement Customer trust Support Support Know-how Know-how Continuous learning Training/education Learning & training Problem solving skills Problem solving skills Knowledge management Knowledge management Creativity Creativity & experience R&D Education and skill level
* Mark variables that are used more than once to match earlier variables.
We see all researchers referring to low cost, quality in terms of reliability and
performance, and speed and flexibility as competitive priorities. This shows that there is a
broad agreement that these common priorities are the norm for competing in marketplace.

8
While Ward et al (1998) agree with most of Adam and Swamidass (1989)� variables
they expand on �quality� which becomes an important priority during the 90�s. We also
notice that they combine several of the �flexibility� items previously expressed by Adam and
Swamidass with less focus on product variety and products mix. Within, the four basic
competitive priorities, Phusavat and Kanchana (2008), add �activity based measurement� to
the �cost� variable and �certification� to the �quality� variable. In our mapping attempt we
combine fast provision to include former �production lead time� and �short time delivery�, and
�service adjustment� to cover former �capacity adjustment� and �design changes to existing
products�. While we note that the two newly introduced variables by Phusavat and Kanchana
(2008) �customer focus� and �know-how� are derived and comprehended from previous
writings discussing quality dimensions, we believe they emerged to meet a growing need in
differentiating service operations from manufacturing operations. The service sector has a
unique competitive nature and more complex market requirements. The basic �manufacturing
derived� set of competitive priorities are no longer suffice to cover the different strategies
service providers prioritize when competing. This led to a new set of competitive priorities in
the literature tailored to the service sector. Phusavat and Kanchana (2008) clearly stress on
customers involvement, satisfaction and awareness in their research on the service sector. For
our study, we add a fourth column to the table representing the set of competitive priorities
that we used in our survey. We borrow heavily from Phusavat and Kanchana (2008) for the
last two service priorities and select from the earlier studies those item questions we believe
most relevant to our study of service providers.
Relationship between competitive priorities

9
Yet while the general framework for operations strategy is fairly well defined, debate
continues over the relationship between competitive priorities. This debate involves three
perspectives: the trade-off, cumulative, and integrative models.
• The trade-off model is the most established, first posited by Skinner (1969). This
model proposes that companies must make choices regarding which competitive priorities
should receive the greatest investment of time and resources. Companies are generally forced
to make trade-offs between various priorities, based on their relative importance. Managers
must choose a manufacturing priority, then allocate their scarce resources accordingly (Hayes
and Wheelwright 1984; Garvin 1993).
• The cumulative model, in contrast, claims that trade-offs are irrelevant in a world of
intense competition and advanced technologies. Competitive priorities are considered
complementary, rather than mutually exclusive, as an existing capability (e.g., quality) may
aid development of other capabilities (e.g., flexibility).
• The integrative perspective seeks to reconcile differences between trade-off and
cumulative models. Proponents claim that these models address varied facets of operations
strategy, allowing theorists to link their disparate insights (e.g., Hayes and Pisano 1996;
Schmenner and Swink 1998).
Skinner (1969, 1974) proposed the trade-off model in a series of conceptual studies. His work
calls for managers to choose their company�s competitive priority, then design and operate
the business operations accordingly, concentrating efforts on developing assets and practices
that help achieve their goals. Companies should focus on one priority at a time, because cost,
flexibility, quality, and delivery capabilities require different operational structures and
infrastructures for support. Hayes and Wheelwright 1984, (p. 141) consider it difficult (if not
impossible) and potentially dangerous for a company to try to compete by offering superior
10
performance along all of these dimensions, since it will probably end up second best on each
dimension to some other company that devotes more of its resources to developing that
competitive advantage. Trade-off studies examine the need for companies to prioritize their
strategic objectives and devote resources to improving those operational capabilities. For
example, researchers frequently claim that companies must make choices between achieving
low costs or high flexibility (e.g., Hayes and Wheelwright 1984; Garvin 1993; Hill 1994).
Advocates of the cumulative model, however, claim that trade-offs are neither desirable nor
necessary. Global competition has intensified the pressure on plants to improve along all four
dimensions. Ferdows and De Meyer (1990) extend this notion, advocating that companies
should apply a "sand cone model." They should build capabilities sequentially, first seeking
high quality, then dependable delivery, followed by low costs and flexibility. Each successive
capability becomes the primary focus once minimum levels of the preceding capabilities have
been achieved. Their sample of 187 European manufacturers lent some support to the model,
depicting the cumulative effect of quality. Studies by Roth and Miller (1994) and Noble
(1997) also suggest that priorities are positively correlated and that high-performing plants are
more likely to compete on multiple dimensions.
Yet proponents of integrative models stress that there remains little "proof' that either the
trade-off or cumulative model is more correct. Indeed, elements of both may be applicable.
Skinner (1996) claims that his original ideas have been interpreted too rigidly, Hayes and
Pisano (1996) separate static, first-order trade-offs from dynamic, second-order trade-offs.
They contend that managers are still faced with critical trade-offs, but these are more subtle
than those addressed by early writers on strategy where they involve not only the competitive
dimensions themselves, but also their rates of improvement. Schmenner and Swink (1998)
propose that the two models examine operations strategy from different, but potentially

11
complementary perspectives. They explain: "The law of trade-offs is reflected in comparisons
across companies at a given point in time, whereas the law of cumulative capabilities is
reflected in improvements within individual companies over time. The two laws are not in
conflict" (1998, p. 107). To integrate the models, they argue that companies possess both an
operating and an asset frontier. The asset frontier is the maximum performance possible based
on a companies structural capabilities (i.e., physical investments), while the operating frontier
denotes the performance made possible by infrastructural choices (i.e., operating policies),
given a set of assets. The farther companies are from operating on their asset frontier, the
more operational choices available. For example, major capacity changes extend the asset
frontier, providing more room for improvement and expansion and thereby enabling
companies to enhance multiple capabilities concurrently. This premise fits the cumulative
model. Yet, as a company approaches its asset frontier (i.e., becomes fully utilized), building
capabilities requires more resources and intensifies the need for focus. Thus, the trade-off
model is most applicable to firms operating near their asset frontier.
Despite this heated debate, there is little empirical evidence supporting approaches that
promote, negate, or integrate the trade-off model (Swink and Way 1995; Szwejczewski,
Mapes, and New 1997). This study investigates the need for trade-offs in operations strategy
for an IT service provider in terms of the relative importance of competitive priorities. Sales
representatives are asked to weight competitive priorities against each other.
Case Background: BTC Networks-KSA
Baud Telecom Company-KSA, established in 1975 in Jeddah, Kingdom of Saudi Arabia, is a
leading Telecommunications company, better known as BTC Networks. It has offices in
Jeddah, Riyadh, Khobar, Madinah. Outside the Kingdom, branches were established in Egypt,
12
Lebanon, Jordan, Syria and Iraq. BTC Networks represents global Telecom vendors like
Nortel Networks, Tellabs, Polycom, ND SatCom, Nexans, Juniper, MGE, and many others.
Products and services provided include networks, either in Fiber Optics, single or multi-mode
or Copper to implement LAN, CAW, security or surveillance applications.
BTC Networks Egypt is a subsidiary of Baud Telecommunication launched in the Egyptian
market in May 2001 with a very strong start in means of staff, support and business. The
holding Baud Telecommunication Mission Statement states the goal of BTC "To be the
leading unified networks solutions company in the region through the deployment of
innovative, state-of-the-art technology; providing first class customer services, rendered by a
highly motivated national workforce, aiming at customer satisfaction and a commitment to
market needs and aspirations". In turn BTC Egypt employs an experienced staff of sales, pre-
sales and post sales departments and holds a stock of over $1M covering different ranges with
different line of products.
THEORETICAL FRAMEWORK
Competitive priorities represent the future focus of a company (Hoehn, 2003). It is important
that competitive priorities need to be clearly identified and established. A failure to recognize
the relationship between competitive priorities and operational strategies will eventually make
companies less productive (Takala, 2002). Competitive priorities are multidimensional.
Ward et. al (1998) use the degree of emphasis that a company places on activities to remain
competitive as a measure of its competitive priorities. Our study uses a similar approach in
identifying competitive priorities for BTC Egypt.
13
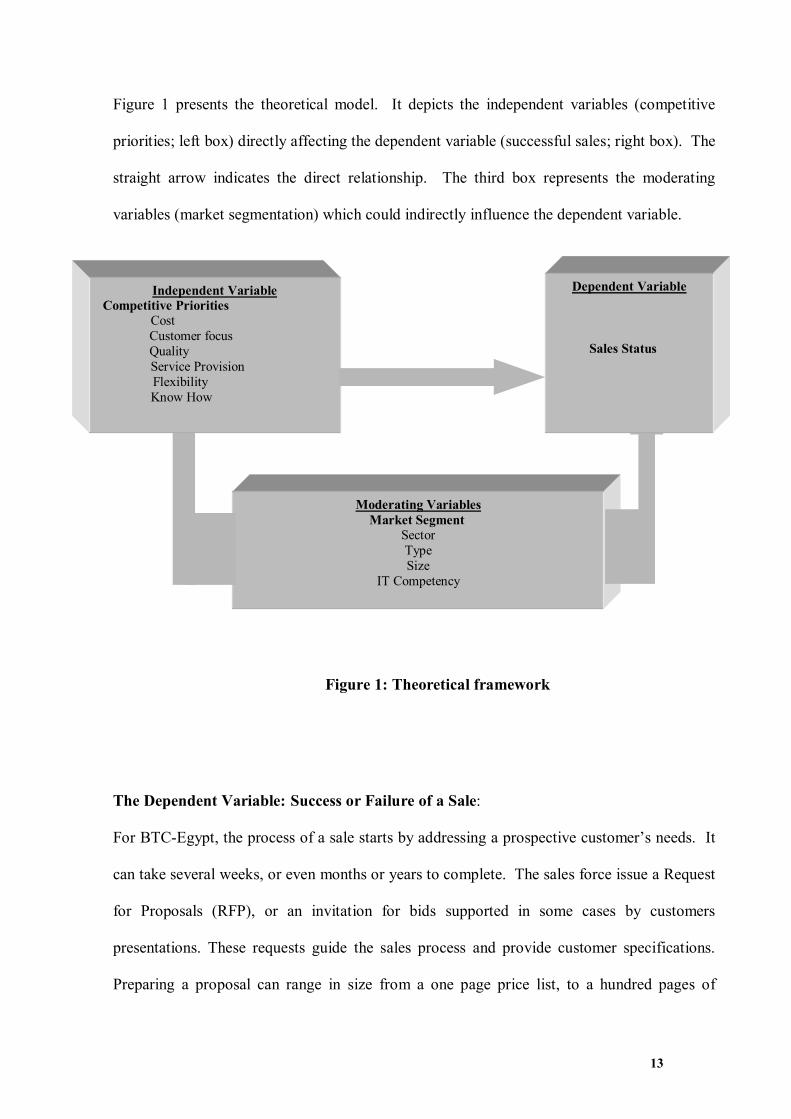
Figure 1 presents the theoretical model. It depicts the independent variables (competitive
priorities; left box) directly affecting the dependent variable (successful sales; right box). The
straight arrow indicates the direct relationship. The third box represents the moderating
variables (market segmentation) which could indirectly influence the dependent variable.
Figure 1: Theoretical framework
The Dependent Variable: Success or Failure of a Sale:
For BTC-Egypt, the process of a sale starts by addressing a prospective customer�s needs. It
can take several weeks, or even months or years to complete. The sales force issue a Request
for Proposals (RFP), or an invitation for bids supported in some cases by customers
presentations. These requests guide the sales process and provide customer specifications.
Preparing a proposal can range in size from a one page price list, to a hundred pages of
Moderating Variables Market Segment
Sector Type Size
IT Competency
Independent Variable Competitive Priorities Cost Customer focus Quality Service Provision Flexibility Know How
Dependent Variable Sales Status

14
detailed specifications including detailed technical and commercial issues. For some projects,
extensive discussions take place between the customer and the sales force before finalizing
the specifications and eventually accepting the business proposal. The written proposal may
be the final reference document that carries the terms of agreement between the customer and
the provider, or it can form the basis for a later business contract or purchase order.
The dependent variable in this study is the status of a sale, classified into a Success sale or a
Failure sale, where:
Success is defined as when a proposal is accepted by the customer, and a purchase order (PO)
is issued to the BTC-Egypt, indicating the type, quantities and agreed prices for products or
services the company is expected to provide to the customer. Internally, procurement orders
the products according to the specified quantity, quality, time, place and source, and supplies
it to the customer with the promised implementation and technical service.
Failure is defined as those projects that went through the sales process utilizing the
company's different resources over time, but that ended with no purchase orders and no
economic return to the business.
The Independent Variables
For this study, Cost, Customer Focus, Quality, Service Provision (Delivery), Flexibility, and
Know-How represent the independent variables. Following are the definitions of each and
their related dimensions:
Costs:
The cost priority will be measured by the cost of operation, product, quality, wasted time cost,
and finally the vendors� involvement through discounted prices. In general, the cost of quality
15
is the measure of the extra cost incurred by the company because it's under or over
performing
Customer Focus:
This priority is achieved by using effective ways in following up with customers after sales
has been provided (Noble 1997), customization to meet the specific needs requested by
different types of customers, providing different kinds of support to customers while utilizing
and finalizing the service. It also shows how the company uses channels to inform customers
about the new products and services. Finally, it reflects the company's ability to build a
relationship of trust with customers.
Quality:
The term quality will be measured by measuring the frequent rate of errors for system service
design, the offered product performance relatively with other products, reliability of products
and services are also to be of high consideration as for quality dimensions
Service Provision:
Referring to the modified work which has been done by Takala (2002), service provision
reflects how a company tries to create a relationship of accountability with customer. It refers
to how fast the company responds to customer requests, also in terms of quality, and quantity.
It also measures the ability of the company to keep promises with customers.
Flexibility:
Flexibility dimension adopted service industry includes the road range of technologies, wide
range of capacity, broad range of products, and broad range of services offered.
Know-How:
With the future indications, the knowledge based economy would be extremely dependable
on knowledge management. Knowledge management comprises a range of practices used by
organizations to identify, create, represent, distribute and enable adoption of what it knows,

16
and how it knows it. Many large companies have resources dedicated to Knowledge
Management (often as a part of Information Technology, Human Resource Management or
Business strategy departments). Creativity as the capability to invent new services designs to
satisfy new market demand. Measuring the level of learning and training and how
organizations shares knowledge on all levels, the skills to solve problems in innovative ways,
and determining the education and skill level for each individual.
The Moderating Variables
The different market segments represent our moderating variables: The market will be
segmented according to the following five categories: Customer�s Sector, Type, Industry, IT
competency, and Company size.
Customer sector based on ownership may be categorized into Public Sector and Private
Sector. Public sector deals with the delivery of goods and services by and for the government.
Private sector consists of private companies that are established for private profit and are not
controlled by the government in the country's economy. Recently, due to privatization
programs, Public-private countries have emerged; this contains companies which are funded
and operated through a partnership of government and one or more private sector companies.
For this study, privatized companies are still classified as public.
Type refers to the international or local affiliation of the customer. Companies are classified
into Multinational companies and Local companies. It is hypothesized that the global nature
of the customer will affect their decision making process when seeking IT solutions.
IT Competency Index categorizes the customer�s IT awareness level and the extent to which
their business managers show leadership with regard to investment and deployment of IT in
their organizations. We divide the IT competency into two levels: High and low; high refers
17
to when the customer company has its own internal, well trained IT team that participate in
the design and product selection, and Low, refers to when the customer has maybe one or two
IT specialists available to communicate with IT service providers (all companies sampled had
at least one IT specialist).
Company size definition often varies by country and industry. We use the number of
employees hired by the customer to define this category. Our cutoff for small companies is
under 50 employees, mid-sized companies had anywhere between 50 to 500 employees and
large companies been those larger than 500 employees. Only medium and large sizes will be
considered in the study since we did not encounter small companies in our sample.
The study investigates the following propositions:
Proposition one:
The relationship between the dependent variable (success or failure of a sale) and the
independent variables (service competitive priorities) at BTC, can assist in
determining the competitive priorities which the company should focus on in the
future.
We first categorize the sales efforts into successful and unsuccessful, then we recall on the
competitive priorities (using forced prioritizing) that were emphasized during the sale, and
use the differential ratings to decide upon the most influential competitive priorities.

18
Proposition two:
The dependent variable (success and failure) are related to the moderating variables
(the different market segments). In this proposition we examine the relationship
between the different market segments of the customers in our sample and the success
and failure of sales.
Proposition three:
The moderating variables (the different market segments) will affect the relationship
between the dependent variable (success and failure) and the independent variables
(competitive priorities).
METHODOLOGY
Figure 2 presents the research steps that were followed in designing this study. Our first step
was to identify the different competitive priorities from the literature and decide on which are
most applicable to the service industry generally and to IT service provides (in the case of
BTC-Egypt) specifically. We then designed our research tool (survey questionnaire) after
meetings and interviews with top management and tested 10 surveys on managers and
experts. We then finalized the survey and selected the study participants based on the sales
history of BTC -Egypt. We selected a stratified sample to make sure we have a reasonable
representation of the dependent variable. We were able to collect data related to 103 cases
using Expert Choice, we analyzed the data using SPSS and documented our findings in the
thesis.

19
Figure 2 Research Methodology
Competitive Priorities & Market Segmentation
(Variables & Constructs)
Adapting Competitive Priorities for ICT Servers Providers
Pre-test Interviews with Top Management & Expert Analyst
Questionnaire modification to the Applied Case
Respondent Selection
Stratified Sample Selection
10 Case Analysis 103 Pair-wise Comparison Expert Choice
Observation & Data AnalysisSPSS
Qualitative data and analysis

20
DATA ANALYSIS AND RESULTS
The Data Collection and Sampling Method
As proposed by yin (2003), multiple sources of evidence could be collected in order to
construct validity for this case study. The initial data source is subjective, and normally
qualitative, this gives insight and allows in-depth analysis to the different constructs used in
the study. The secondary data source is quantitative in nature, subjective measures are
expressed using a prioritization scale. This allows the use of statistical analysis that help
determine the competitive priorities for BTC.
The primary source of data collection was direct interviews with the top management
(Country and General Managers), executive senior management (2 managers), and account
managers for in BTC Company (5 members), as well as a business analyst expert in the same
field, this helped the questionnaire to cover and test the case propositions. Direct interviews
conducted with the highest management level were used to determine the construct for
variables included in the research proposition, and validate the theoretical framework. Table 2
presents the list of interviewees and Table 3 summarizes a sample the results of the interviews.
Table 2: List of Interviewees
S/N Position Years of Experience
Years in BTC Egypt
Projects Participant
1 Country Manager 32 8 2 General Manager 38 5 3 Sales Manager 25 8 12 4 Purchasing Manager 22 8 5 Sales Account Manager 10 7 24 6 Sales Account Manager 10 3 20 7 Sales Account Manager 6 4 20 8 Business Analyst 35 9 Sales Account Manager 8 6 27

21
Table 3: Qualitative Results of Interviews
The Survey:
As previously discussed, the researchers borrow form the survey used by (Takala 2002) and
(Phusavat and Kanchana, 2008) to assess the relevancy, accuracy, and legibility of the
measures. The survey questions were locally evaluated by telecommunication field experts
and a pretest was done first with country and top management. They were asked to review
22
the questionnaire for readability, completeness, and to evaluate whether individuals items
appeared to be appropriate measures of their respective constructs (Dillman, 1978). This
process had led to several minor changes, which were made prior to generating the final
version of questionnaire. The final questionnaire was used during interviews with different
account managers. The interviewees were asked to rate their responses to which competitive
priorities were prioritized during each particular sale using a seven point Likert scale. These
initial questionnaires resulted in a set of 27 detailed itemized data that was used as the main
source in developing the second questionnaire.
The second questionnaire, advances on the previous one in that it uses forced prioritization
This helped reduce the general tendency to rate all competitive priorities highly, and forced
sales managers to relatively rate each priority in light of the others. The survey uses Expert
Choice software to go through a set of pair wise comparisons where sales mangers were asked
to compare priorities to one another for their relative importance. For example, decision-
makers were asked to compare Cost to quality to determine which was more important in
contributing to the success of the project, and then they were asked to rate quality with
flexibility and subsequently compare flexibility with cost and so on. Expert Choice provides
survey questions weights using pair wise comparisons. This methodology requires
participants to make tradeoffs between each need, thus creating a true list of relative
priorities. Additionally, without asking repetitive questions, pair wise comparisons create an
inconsistency measure, which helps identify participants who are not paying attention to the
survey.
The survey was conducted with account managers who had been representing the company
for the last 5 years; participants were selected based on their wide experience with different
customers. Over the span of the entire sample that consisted of 103 various cases, the
participant members were asked to complete the questionnaires, the basic Questionnaire was
23
accompanied by a covering letter explaining the research objectives and defining variables
and constructs (see Appendix).
Data Results and Analysis:
Descriptive Statistics:
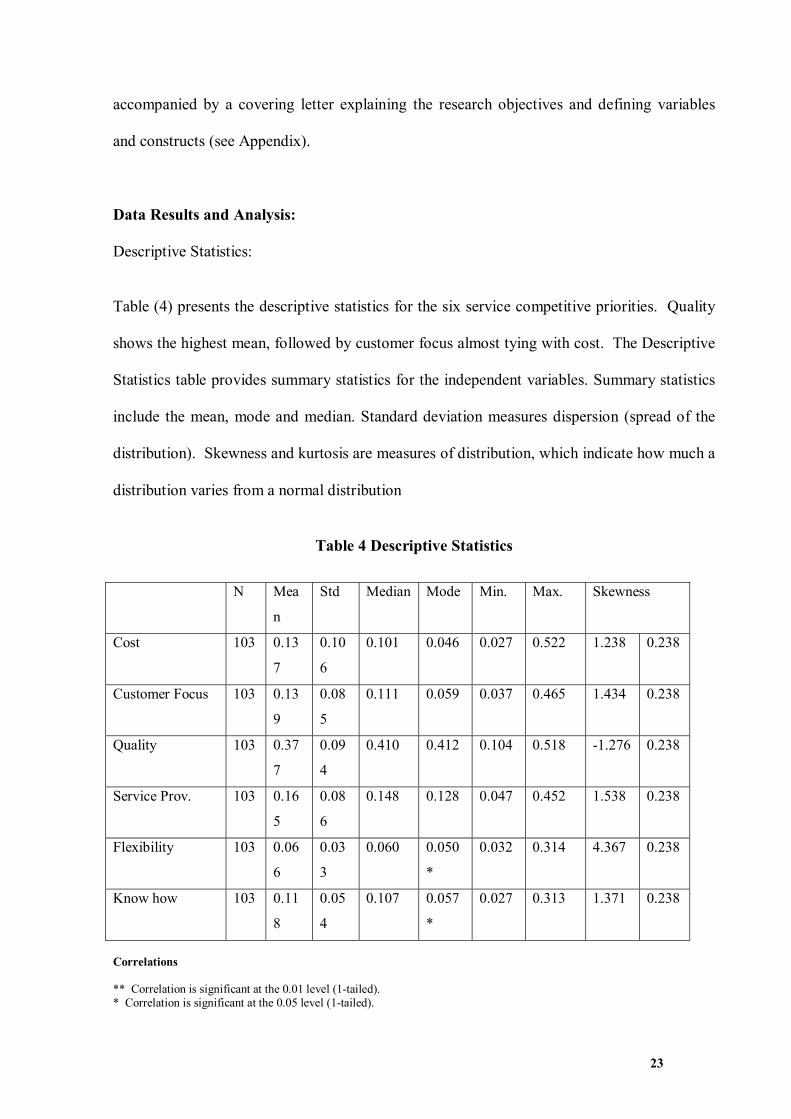
Table (4) presents the descriptive statistics for the six service competitive priorities. Quality
shows the highest mean, followed by customer focus almost tying with cost. The Descriptive
Statistics table provides summary statistics for the independent variables. Summary statistics
include the mean, mode and median. Standard deviation measures dispersion (spread of the
distribution). Skewness and kurtosis are measures of distribution, which indicate how much a
distribution varies from a normal distribution
Table 4 Descriptive Statistics
N Mea
n
Std Median Mode Min. Max. Skewness
Cost 103 0.13
7
0.10
6
0.101 0.046 0.027 0.522 1.238 0.238
Customer Focus 103 0.13
9
0.08
5
0.111 0.059 0.037 0.465 1.434 0.238
Quality 103 0.37
7
0.09
4
0.410 0.412 0.104 0.518 -1.276 0.238
Service Prov. 103 0.16
5
0.08
6
0.148 0.128 0.047 0.452 1.538 0.238
Flexibility 103 0.06
6
0.03
3
0.060 0.050
*
0.032 0.314 4.367 0.238
Know how 103 0.11
8
0.05
4
0.107 0.057
*
0.027 0.313 1.371 0.238
Correlations ** Correlation is significant at the 0.01 level (1-tailed). * Correlation is significant at the 0.05 level (1-tailed).

24
Figure 3: Descriptive Statistics
Descriptive Statistics
00.050.1
0.150.2
0.250.3
0.350.4
Cost CustomerFocus
Quality Service Prov. Flexibility Know how
MeanStd
Table (5) represents the descriptive group statistics for the competitive priorities grouped by
the dependent variable (successful sales and failure sales). The table displays the number of
cases, mean value, standard deviation, and standard error for the test variables within each
category. The significance of these differences will be tested with an independent sample T
test in the following section.
Table 5: Group Statistics
Variable: Competitive Priority
Status: Success vs. Failure
N Mean Std. Deviation
Std. Error Mean
Cost Success 37 0.089 0.103 0.017 Failure 66 0.257 0.100 0.124 Customer Focus Success 37 0.176 0.085 0.014 Failure 66 0.119 0.079 0.009 Quality Success 37 0.349 0.108 0.017 Failure 66 0.393 0.082 0.010 Service Provision
Success 37 0.209 0.112 0.018
Failure 66 0.140 0.053 0.006 Flexibility Success 37 0.052 0.011 0.001 Failure 66 0.074 0.039 0.004 Know How Success 37 0.123 0.070 0.011 Failure 66 0.116 0.043 0.005

25
Table (6) presents the frequency for the top three ranked competitive priorities for the
sample tested as also shown in Figure (4)
Table 6: Top Three Ranking Frequency Ranking
3 2.9 2.9 2.92 1.9 1.9 4.91 1.0 1.0 5.81 1.0 1.0 6.81 1.0 1.0 7.82 1.9 1.9 9.73 2.9 2.9 12.61 1.0 1.0 13.68 7.8 7.8 21.4
17 16.5 16.5 37.98 7.8 7.8 45.6
13 12.6 12.6 58.31 1.0 1.0 59.23 2.9 2.9 62.16 5.8 5.8 68.01 1.0 1.0 68.94 3.9 3.9 72.8
11 10.7 10.7 83.52 1.9 1.9 85.47 6.8 6.8 92.21 1.0 1.0 93.23 2.9 2.9 96.11 1.0 1.0 97.12 1.9 1.9 99.01 1.0 1.0 100.0
103 100.0 100.0
C,Q,SPC,SP,QCF,C,FCF,Q,FCF,Q,KHCF,SP,QQ,C,CFQ,C,FQ,C,KHQ,C,SPQ,CF,KHQ,CF,SPQ,F,SPQ,KH,CQ,KH,CFQ,KH,SPQ,SP,CQ,SP,CFQ,SP,FQ,SP,KHSP,C,CFSP,CF,QSP,CFQSP,Q,CFSP,Q,KHTotal
ValidFrequency Percent Valid Percent
CumulativePercent
C,Q,SP
C,SP,QCF,C,FCF,Q
,FCF,Q
,KHCF,SP,QQ
,C,CFQ
,C,FQ
,C,KHQ
,C,SPQ
,CF,KHQ
,CF,SPQ
,F,SPQ
,KH,CQ
,KH,CFQ
,KH,SPQ
,SP,CQ
,SP,CFQ
,SP,FQ
,SP,KHSP,C,CFSP,CF,QSP,CFQSP,Q
,CFSP,Q
,KH
Ranking
0
5
10
15
20
Freq
uenc
y
Ranking
Figure 4: Top three ranked priorities

26
Logistic Regression:
Logistic regression analysis was used to assess the strength of association between the
independent variables and the dependent variable described in Proposition one. Table (7)
presents the regression results and notes the significant findings. The table summarizes the
roles of the parameters in the model. B is the estimated coefficient, with standard error S.E.
The ratio of B to S.E., squared, equals the Wald statistic. If the Wald statistic is significant
then the parameter is useful to the model. Exp(B) is the predicted change in odds for a unit
increase in the predictor.
Table 7: Logistic Regression Analysis
B S.E. Wald df Sig. Exp (B)
Cost
Constant
-7.926
0.358
2.678
0.353
8.758
1.026
1
1
0.003
0.331
0.000
1.430 Custfocs
Constant
8.111
-1.744
2.723
0.448
8.873
15.136
1
1
0.003
0.000
3330.950
.175 Quality
Constant
-4.971
1.279
2.220
0.851
5.014
2.257
1
1
0.025
0.133
0.007
3.593 Servprov
Constant
10.776
-2.392
3.117
0.563
11.952
18.072
1
1
0.001
0.000
47859.740
0.091 Flexibility
Constant
-72.861
3.714
19.994
1.136
13.281
10.685
1
1
0.000
0.001
0.000
41.022 Know How
Constant
2.589
-0.889
3.730
0.495
0.482
3.223
1
1
0.488
0.073
13.316
0.411

27
Cost, quality and flexibility show negative coefficients. Service provision and flexibility show
the most significance at the 0.001 level. Cost and customer focus show significance at the 0.01
level, and quality shows significance at the 0.05 level. Know how shows no significance.
An independent samples t test, comparing the means of both groups, confirms the above
results. The Independent-Samples T Test procedure compares means for two groups of cases.
The mean values for the two groups are displayed in the Group Statistics table (5). If the
significance value for the Levene test is high (typically greater that 0.05), we use the results
that assume equal variances for both groups. If the significance value for the Levene test is
low, we use the results that do no assume equal variances for both groups.
A low significance value for the t test (typically less than 0.05) indicates that there is a
significant difference between the two group means. If the confidence interval for the mean
difference does not contain zero, this also indicates that the difference is significant. If the
significance value is high and the confidence interval for the mean difference contains zero,
then you cannot conclude that there is a significant difference between the two group means.
Table (8) shows the means for customer focus and service provision to be significantly higher
(at the 0.001 level) under successful sales when compared to the means for the unsuccessful
sales. It also shows the means for flexibility and costs to be significantly lower (at the 0.001
and 0.01 level respectively) under successful sales when compared to the means of
unsuccessful sales. Quality is also significantly lower (at the 0.05 level). Comparison of
means between the two groups for know how showed no significance

28
Independent Samples Test
.009 .924 -3.241 101 .002 -.067745 .020901 -.109208 -.026282
-3.219 73.180 .002 -.067745 .021044 -.109685 -.025805
.524 .471 3.366 101 .001 .056432 .016764 .023177 .089687
3.293 69.954 .002 .056432 .017135 .022256 .090608
11.120 .001 -2.351 101 .021 -.044558 .018953 -.082155 -.006961
-2.177 59.563 .033 -.044558 .020464 -.085497 -.003618
25.179 .000 4.278 101 .000 .069870 .016333 .037470 .102270
3.572 45.456 .001 .069870 .019560 .030485 .109256
8.389 .005 -3.420 101 .001 -.022672 .006628 -.035821 -.009523
-4.385 81.228 .000 -.022672 .005171 -.032960 -.012384
6.815 .010 .692 101 .491 .007771 .011231 -.014509 .030051
.606 51.201 .547 .007771 .012818 -.017960 .033502
Equal variancesassumedEqual variancesnot assumedEqual variancesassumedEqual variancesnot assumedEqual variancesassumedEqual variancesnot assumedEqual variancesassumedEqual variancesnot assumedEqual variancesassumedEqual variancesnot assumedEqual variancesassumedEqual variancesnot assumed
Cost
Customer Focus
Quality
Service Provison
Flexibility
Know How
F Sig.
Levene's Test forEquality of Variances
t df Sig. (2-tailed)Mean
DifferenceStd. ErrorDifference Lower Upper
95% ConfidenceInterval of the
Difference
t-test for Equality of Means
Table 8: Comparison of means
To test for the second proposition, we ran a bivariate correlation analysis (Table 9) between
the dependent variable (success and failure) and the moderating variables (market segments).
The correlations table displays Pearson correlation coefficients, significance values, and the
number of cases with non-missing values. The significance of each correlation coefficient is
displayed in the correlation table. If the significance level is very small (less than 0.05) then
the correlation is significant and the two variables are linearly related.
29
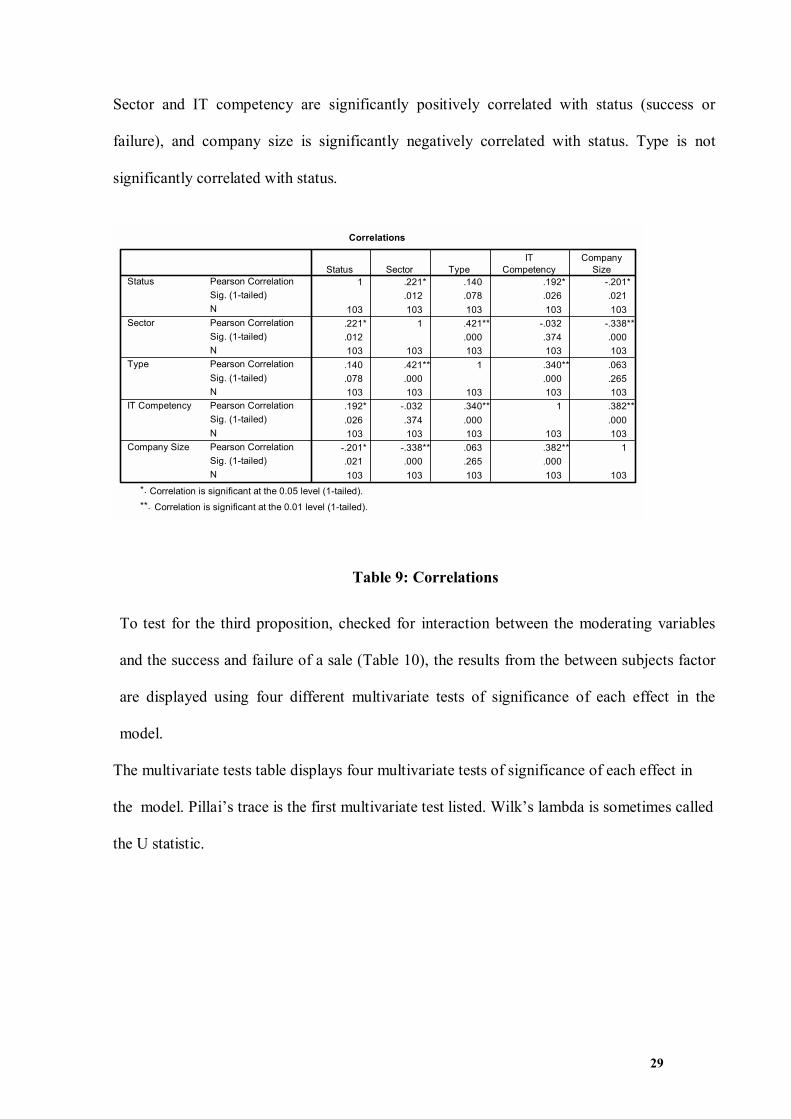
Sector and IT competency are significantly positively correlated with status (success or
failure), and company size is significantly negatively correlated with status. Type is not
significantly correlated with status.
Correlations
1 .221* .140 .192* -.201*.012 .078 .026 .021
103 103 103 103 103.221* 1 .421** -.032 -.338**.012 .000 .374 .000103 103 103 103 103.140 .421** 1 .340** .063.078 .000 .000 .265103 103 103 103 103.192* -.032 .340** 1 .382**.026 .374 .000 .000103 103 103 103 103
-.201* -.338** .063 .382** 1.021 .000 .265 .000103 103 103 103 103
Pearson CorrelationSig. (1-tailed)NPearson CorrelationSig. (1-tailed)NPearson CorrelationSig. (1-tailed)NPearson CorrelationSig. (1-tailed)NPearson CorrelationSig. (1-tailed)N
Status
Sector
Type
IT Competency
Company Size
Status Sector TypeIT
CompetencyCompany
Size
Correlation is significant at the 0.05 level (1-tailed).*.
Correlation is significant at the 0.01 level (1-tailed).**.
Table 9: Correlations
To test for the third proposition, checked for interaction between the moderating variables
and the success and failure of a sale (Table 10), the results from the between subjects factor
are displayed using four different multivariate tests of significance of each effect in the
model.
The multivariate tests table displays four multivariate tests of significance of each effect in
the model. Pillai�s trace is the first multivariate test listed. Wilk�s lambda is sometimes called
the U statistic.

30
Effect Value F Hypothesis df Error df Sig
Pillai;s Trace 0.984 7 90 0.448
Wilks� Lambada 0.984 7 90 0.448
Hotelling�s Trace 0.984 7 90 0.448
Sector
Roy�s Largest Root 0.984 7 90 0.448
Pillai;s Trace 0.778 14 182 0.693
Wilks� Lambada 0.771 14 180 0.699
Hotelling�s Trace 0.765 14 178 0.706
Sector*Highest
Roy�s Largest Root 1.039 7 91 0.410
Type Pillai;s Trace 0.996 7 90 0.439
Wilks� Lambada 0.996 7 90 0.439
Hotelling�s Trace 0.996 7 90 0.439
Roy�s Largest Root 0.996 7 90 0.439
Type*Highest Pillai;s Trace 1.016 14 182 0.439
Wilks� Lambada 1.011 14 180 0.444
Hotelling�s Trace 1.006 14 178 0.449
Roy�s Largest Root 1.447 7 91 0.196
Industry Pillai;s Trace 0.856 56 581 0.762
Wilks� Lambada 0.868 56 419 0.739
Hotelling�s Trace 0.882 56 527 0.714
Roy�s Largest Root 3.675 8 83 0.001
Industry*Highest Pillai;s Trace 0.654 56 581 0.975
Wilks� Lambada 0.648 56 419 0.976
Hotelling�s Trace 0.647 56 527 0/978
Roy�s Largest Root 2.572 8 83 0.015
Size Pillai;s Trace 0.387 7 89 0.908
Wilks� Lambada 0.387 7 89 0.908
Hotelling�s Trace 0.387 7 89 0.908
Roy�s Largest Root 0.387 7 89 0.908
Size*Highest Pillai;s Trace 0.423 21 273 0.989
Wilks� Lambada 0.420 21 256.11 0.989
Hotelling�s Trace 0.417 21 263 0.990
Roy�s Largest Root 0.923 7 91 0.493
IT Comp. Pillai;s Trace 0.618 7 89 739
Wilks� Lambada 0.618 7 89 739
Hotelling�s Trace 0.618 7 89 739
Roy�s Largest Root 0.618 7 89 739
IT Comp*Highest Pillai;s Trace 0.859 21 273 0.645
Wilks� Lambada 0.875 21 256.11 0.624
Hotelling�s Trace 0.890 21 263 0.604
Roy�s Largest Root 2.265 7 91 0.036
Table 10: Between Subjects Factor Multivariable Tests

31
Lambda ranges between 0 and 1, with values close to 0 indicating the group means are
different and values close to 1 indicating the group means are not different (equal to 1
indicates all means are the same). Hotelling�s trace is based on the sum of eigenvalues and
Roy�s largest root is the largest eigenvalue. Of the four test statistics, Wilks� lambda is
convenient and related to the likelihood-ratio criterion.
The value of the test statistic is displayed followed by the F statistic, which is a transformed
value of the corresponding test statistic and has an approximate F distribution. The
hypothesis and error degrees of freedom of the F distribution are shown. When the
significance level is relatively small (less than 0.05) for the effect being tested, then we
conclude that the effect is significant. In the above table, the interaction effect between the
competitive priorities ranking and the different market segments is not significant. Therefore,
we conclude that there is no interaction effect.
Discussion and Findings
The overall findings indicated quality to have the highest relative ranking given to
competitive priorities (mean quality ratings is almost three times as high as any other ratings
given to the other competitive priorities like customer focus and cost). This is understandable
in light of BTC�s mission statement and current perceived competitive position.
The frequencies for the consistently highest three ranked competitive priorities shows
Quality, Cost, and Service Provision to be of highest priority when dealing with 17 out of the
103 projects. This stresses the importance of supporting high quality with competitive costs
and a high level of service. Interestingly, the second and third runner ups did not include
costs; 13 out of the 103 projects rated Quality, Customer Focus, and Service provision the
most important during a sale, and 11 out of the 103 projects rated the same three most
important, except giving Service Provision priority over Customer focus. Put together, both

32
rankings position customer focus and service provision higher than cost. This is the first
indication that cost is currently not on the top of the list of BTC.
All variables show significant correlations with each other except for flexibility. Using our
data set, factor analysis did not result in the six separate competitive priorities, this can be due
to the limited sample size. The internal validity of the six competitive priorities have been
tested in the literature (Takala, 2002 and Phusavat and Kanchana, 2008) and in both cases
provided Alpha�s between 0.05 and 0.07, which are acceptable given the exploratory nature
of their studies.
Group statistics and logistic regression show differential analysis. The relative rankings given
to successful projects are compared to the relative rankings given to unsuccessful projects.
This allows us to determine which competitive priorities can make or break a sale.
Both Customer Focus and Service Provision showed the most significance. This is to say,
that while the relative ranking indicated Quality to be prioritized throughout all projects, the
projects which ranked customer focus and service provision relatively higher than the other
competitive priorities were successful sales, while other projects who gave low relative
importance to these two competitive priorities resulted in failed sales. This is an important
finding since it responds to the first proposition, where BTC seeks to determine its future
competitive priorities in light of its previous performance.
Cost shows a negative relationship with success, projects that relatively prioritized cost over
other competitive priorities, resulted in failure sales. This indicates that even after BTC
attempts to reduce its operational costs and margins, and negotiate better prices from the
vendor, they still have a problem competing on a cost basis. Lower quality products and more
cost efficient alternatives exist to the customer seeking to pay less. While it is important that

33
BTC�s prices remain competitive, it does not stand out as a differentiating competitive
priority.
Quality also shows a negative relationship with successful sales, this relationship is only
significant at the 0.05 level. What the data shows is that the ratings given to quality by both
groups of the dependent variable are very close, while both groups rate quality very high. In
both successful sales and failure sales, quality was prioritized, but it did not positively impact
the success rate.
Also interesting, Flexibility showed a negative relationship, this might be due to the
inefficiencies that might come with such emphasis that could have indirectly affected the
costs leading to higher margins.
While the previous performance of BTC, might not be satisfactory, given that the number of
failure sales are higher than that of the success sales, BTC still needs to identify its core
competencies and work on what they do best. Market differentiation is key to
competitiveness, and the results show Customer Focus and Service provision as the core
competitive priorities for BTC.
Qualitative analysis resulted in a set of moderating variables related to different market
segments, sales managers felt the need to adjust the competitive priorities while dealing with
different customers. The effect of these different market segments on success and failure of a
sale were tested; Sector type and IT competency showed a significant positive correlation
with success. BTC sales were more successful with the private sector than with the public
sector, this could be due to the limited capacity available at BTC when dealing with the
commonly large size of public sector proposals. Also, the level of customer IT competency
was positively associated with success, this can be explained that for customers to select BTC
and to appreciate the added value it provides over its competitors, they usually have to have a

34
high level of internal IT literacy and experience, when compared to customers that have
limited knowledge of IT products and what is out there. Company size is negatively
correlated with success, the larger the company the lower the success rate. This can be
understood given the highly significant correlation between company size and IT
competency, since larger companies can afford to have their own IT experienced staff.
However, other factors might be involved in the correlation between company size and
success like the availability of larger budgets dedicated to support the IT function and needs
in these companies. Together these correlations support our second proposition indicating,
that when dealing with different market segments, BTC has different chances of success and
failure.
In light of the opposing literature on using a tradeoff approach to determine one companies�
competitive priorities, we tested our third proposition for any moderating effects between the
different market segments and the relative prioritization of a competitive factor. While the
data, did not support this proposition, we can explain this due to the limited sample size.
Interaction analysis usually require a larger set of data, to allow for the dynamics of a
moderating effect to appear. We also have to consider the fact that for a company like BTC -
Egypt, given its current size and lifetime, resources are limited, and that they cannot afford to
follow a cumulative or integrative approach when dealing with their competitive priorities.
CONCLUSIONS AND FUTURE WORK
For BTC �Egypt to improve its operations and market performance a clear vision of the
companies� competitive priorities is required. Meetings with upper management indicated a
lack of strategic view and operational consistency throughout the organization. Sales efforts
have been alternating between different competitive priorities and the targeted market
segments are very diverse. This study is an attempt to determine the most critical

35
competitive priorities that BTC- Egypt needs to focus on when going through their sales
process. Literature review and qualitative analysis confirmed six competitive priorities
popular in the service operations literature, namely; quality, customer focus, quality, service
provision, flexibility and know-how. Sales mangers tend to relatively focus on one of these
priorities when carrying out a sale or responding to a proposal. The analysis also highlighted
the use of multiple competitive priorities for multiple segments of the customer. Qualitative
analyses pointed to five possible market segmentations, namely; sector type; international
affiliation; industry type; IT competency level and company size. Managers seemed to be
serving their own market segments with different sets of priorities each time. We found this
relationship worth investigating, so we decided to measure the effect of the different market
segments on the success of the sales, and attempted to test which competitive priorities best
match the market segments. To examine our propositions, a stratified sample of 103 sales
projects was selected. A survey including the six competitive priorities and the different
market segments was designed. The success and failure of the sales projects were
structurally determined and sales managers responsible for the sales projects were asked to
recall on their personal experiences and relatively rate the competitive priorities that were
prioritized during the sale process. Expert Choice software was used to calculate pair wise
comparisons. The ratings were summarized and coded, and statistical models; namely;
logistic regression, bi-variate correlations, multivariate analysis, were used to analyze the
quantitative data using SPPS program.
The results show, that while quality was mostly emphasized in the company, it was not the
differentiating factor in winning or losing a sale for BTC. Customer focus and service
provision, were the leading factors in successful sales. Interestingly, flexibility worked
against the success of some sales, this might be due to the inefficiencies that might come
with such emphasis that could have indirectly affected the costs leading to higher margins.

36
The results also show that focusing on costs is not the suitable competitive priority for BTC-
Egypt. While BTC-Egypt needs to remain price competitive, it is important to note that in
the cases where costs were emphasizes, BTC lost to its competitors. BTC � Egypt should
concentrate on their core competencies that revolve around customer focus and service
provision.
The results also indicate a positive relationship between serving the private sector and the
success of sale, BTC-Egypt tends to win more sales among the private sector when
compared to the public sector. Similarly, the level of IT competency and company size
showed a positive relationship with success. The higher the level of the customers�
knowledge of IT and the larger the customers company size, the higher the rate of successful
sales. International affiliations showed no significant correlation with success. Market
segmentation appeared to affect the rate of success of sales.
Finally, the results did not indicate any moderating effect from the market segmentation on
the ranking of competitive priorities while making sales. This was explained by the limited
sample size. But given the results we can only conclude that BTC � Egypt should focus on a
specific set of competitive priorities regardless of market segmentation, and these
recommended priorities are Customer Focus and Service provision.
Recommendations
BTC Egypt should aim to differentiate itself in competitive market of ICT Service providers,
since quality and cost have became the norm in competing, BTC needs to focus on other
competitive priorities.

37
Customer Focus and Service provision should be the main concern of BTC management and
employees. Customer Focus in terms of after sale follow-up and tailoring to the customers
requirement, transparency with the customer and gaining the customer trust are of key
importance in assuring a sale. Service provision in terms of prompt response to the customers�
needs with respect to time, quality, and budget, and any other promises made, is of key
importance in attaining a sale. BTC-Egypt should allocate its resources to the market sectors
of which they have a better chance of making a sale.
The methodology used in this study is unique. While the origin of the competitive priorities
are well grounded in the literature, and the relative ratings have been applied before to these
priorities in other studies, this study uses the relative ratings to analyze each sale project
within a company to come out with a structured methodology in determining the competitive
priorities of a company based on it previous performance. The simple classification of the
sales according to their success denoted by a purchase order, while has its limitations, is also
an attractive alternative compared to other more complicated performance measures criteria
(Johnston, 2005).
Limitations:
The definition of �success� in the dependent variable ignores any problems that might arise
after the purchase order is issued, some sales are terminated before delivery (due to financial,
technical, or delivery problems) and other cases might have problems during the
implementation phase (with long term negative effects on BTC image). Both cases are
beyond the scope of this study. Also, the model used is relatively static. It neglects the
dynamism of the business environment assuming stable external effects and competition.
There are other factors involved in winning a sale and beating competition that goes beyond
the control of BTC. Personal relationships, politics and monopolies can influence the

38
variation in the dependent variable. The survey rankings represent the personal views of the
sales mangers responsible for a group of sales. This makes the results subject to bias risk.
The data used in this case study are specific to BTC, while other IT service providers can
benefit from the model, methodology and outputs, any generalization should be done with
caution.
Future Work:
The methodology used in this study can be applied to other cases within the service sector to
add validity to suggested theoretical framework. Other performance measures should be
identified and similarly ranked against the six competitive priorities. After sale customer
satisfaction and financial value of each sale could be considered. The competitive priorities
can be expanded or adjusted to include other sectors needs. The moderating effect of market
segments can also be further tested using a larger sample size. Further work on measuring the
internal consistency of the competitive priorities within BTC-Egypt seems to be the logical
next step.

39
REFERENCES
Acur, N., Gertsen, F., Sun, H., and Frick, J. (2003). �The Formalisation of
manufacturing strategy and its influence on the relationship between competitive objectives�.
International Journal of Operations and Production Management 23(10), 1114-1141.
Adam, E.E. and Swamidass, P.M. (1989), �Assessing operations management from a
strategic perspective�, Journal of Management, Vol. 15 No. 2, pp. 181-203.
Aranda, D.A. (2003) �Service Operation Strategy, flexibility and performance in
engineering consulting firms�. International Journal of Operations & Production
Management, 1401-1421.
David Barnes, D., (2001). �Research methods for the empirical investigation of the
process of formation,� International Journal of Operations & Production Management; 21,
(8); pg. 1076
Boyer, K. and Lewis, M. (2002) �Competitive priorities: Investigating the need for
trade-offs in operations strategy�. Production and Operations Management, Vol. 11, No. 1,
pp. 9-20.
Christiansen, T., Berry, W.L., Bruun, P. and Ward, P. (2003), �A mapping of
competitive priorities, manufacturing practices, and operational performance in groups of
Danish manufacturing companies�, International Journal of Operations & Production
Management, Vol. 23 No. 10, pp. 1163-83
Dangayach, G.S., and Deshmukh, S.G, (2001) �Manufacturing strategy literature
review�. International Journal of Operations & Production Management, 884-932
Dillman, D. (1978) Mail and Telephone Surveys: The Total Design Method, New
York: Wiley

40
Ferdows, K. and De Meyer, A. (1990) �Lasting improvements in manufacturing
performance in search of a new theory�. Journal of Operations Management, Vol. 9 No. 2,
pp. 83-168.
Frohlich, M. T., and Dixon, J. R.,(2001). �A taxonomy of manufacturing strategies revisited,�
Journal of Operations Management, 19, 5; p. 541
Garvin, D. A. (1987) �Competing on the eight dimensions of quality�. Harvard
Business Review, November-December, pp. 101-109.
Garvin, D.A. (1993) �What does product quality really mean�. Sloan Management
Review, 63-74.
Hayes, R. H, (2002) �Challenges posed to Operations Management by the �new
economy.� Production and Operations Management, 21-32.
Hayes, R.H. and G.P. Pisano (1996) �Manufacturing Strategy at the Intersection of
Two Paradigm Shifts�. Production and Operations Management, 5, 1, 25-41.
Hayes, R.H., and Wheelwright, S.C. (1985) Restoring competitive edge, competing
through manufacturing. John Wiley & Sons, New York.
Hoehn, W. (2003). �Managing organizational performance linking the balanced
scored to a process improvement�. Kasetsart University. 1-12.
Kathuria. R. (2000) �Competitive priorities and managerial performance: a taxonomy
of small manufacturers�. Journal of Operations Management, Vol. 18, pp. 627-641.
Kazan, H.; Ozer, G.; and Cetin, A. (2006) �Insight from research: the effect of
manufacturing strategies on financial performance�. Measuring Business Excellence, Vol. 10
No. pp. 14-26.
Kim, B.Y. and Oh, H. (2004) �How do hotel firms obtain a competitive advantage?�
International Journal of Contemporary Hospitality Management, Vol. 16, No. 1, pp. 65-71.

41
Kim, J.S., and Arnold, P. (1996) �Operationalizing manufacturing strategy: An
exploratory study of constructs and linkage�. International Journal of Operations &
Production Management, 16(12), 45-73.
Krajewski, L. and Ritzman, L. (1996) Operations Management: Strategy and
Analysis, Addison-Wesley Publishing Company, Reading, MA.
Kumar, K. and Kumar, U. (2004) �A conceptual framework for the development of a
service delivery strategy for industrial systems and products�. Journal of Business &
Industrial Marketing, Vol. 19 · No. 5 , pp. 310-319.
Lee, C. Y. and Zhou, X. (2000) �Quality management and manufacturing strategies in
China�. International Journal of Quality and Reliability Management, Vol. 17 No. 8, pp. 876-
898.
Lee, D, and Ahn, J. (2007) �Factor affecting companies� telecommunication service
selection strategy�. Omega, Vol. 35 No. 5, 486-493.
Leong, G.K., D. Snyder, and P. Ward (1990) �Research in the Process and Content of
Manufacturing Strategy�. Omega, 18, 109-122.
Li, L. (2000) �Manufacturing capability development in a changing business
environment�. Industrial Management and Data Systems, Vol. 100 No. 6, pp. 261-70.
Management Journal, Vol. 5, pp. 77-91.
Mandelbaum, M. (1978) �Flexibility in decision making: An exploration and
unification� PhD thesis, Department of Industrial Engineering, University of Toronto,
Toronto.
Miller, J.G. and A. V. Roth (1994) �A taxonomy of Manufacturing Strategies�.
Management Science, 40, 3, 285-304
Noble, M.A. (1997) �Manufacturing competitive priorities and productivity; an
empirical study�. International Journal of Operations and Production Management, 17(1),
85-99.

42
Porter, M.E. (1980) Competitive Strategy: Techniques for Analyzing Industries and
Competitors. The Free Press, New York, NY.
Porter, M.E. (1991) �Towards a dynamic theory of strategy�. Strategic Management
Journal,
Reeves, C. and Bednar, D. (1994) �Defining quality; alternatives and implications�.
Academy of Management Review, No. 2, 202-211.
Sekeran, U. (2003) Research methods for business, a skill building approach. John
Wiley.
Skinner, W. (1974) The Focused Factory. Harvard Business Review, 52(3), 113-121.
Sethi, A.K. and Sethi, S.P. (1990) �Flexibility in manufacturing: A survey�.
International Journal of Flexible Manufacturing Systems, Vol. 2, No. 4, pp. 289-328.
Sharma, S., Gupta, J. and Wickramasinghe, N. (2005) � A framework for building a
learning organization in the 21st century�. International Journal of Innovation and Learning,
261-273.
Shmenner, R. W. and M.L. Swink (1998) �On Theori in Operations Management�.
Journal of Operations Management, 97-113
Smith, T.M. and Reece, J.S. (1999), �The relationship of strategy, fit, productivity, and
business performance in a service setting�, Journal of Operations Management, Vol. 17, pp.
145-61
Swamidass, P. M. (1986) �Manufacturing Strategy; Its assessment and practice�.
Journal of Operations Management, 471-484.
Swink, M., Way, M.H., 1995. Manufacturing strategy: propositions, current research,
renewed directions. International Journal of Operations and Production Management
Szwejczewski, M., Mapes, J., New, C., (1997). �Delivery and trade-offs,�
International Journal of Production Economics, 53, (3); pg. 323-331
Takala, J. (2002) �Analyzing and synthesizing multi-focused manufacturing strategies
by analytical hierarchy process�. Journal of Manufacturing technology and Management,
345-350.
Upton, D.M. (1994) �The management of manufacturing flexibility�. California
Management Review, Vol. 36, No. 2, pp. 72-89.

43
Ward, P. T, McCreery, L. P, Ritzman, and D. Sharma (1998) �Competitive Priorities
in Operations Management�. Decision Sciences, 29, 4, 1035-1046
Wheelwright, S.C. (1984) �Manufacturing strategy: defining the missing strategic
link�.
Wheelwright, S.C. (1978). Reflecting corporate strategy in manufacturing
decisions. Business Horizons, February, pp. 57�66
Yin, R.K., (1989). Case Study Research: Design and Methods. Sage Publications,
London.
Zhao, X., Yeung, J., and Zhou, Q. (2002) �Competitive priorities of enterprises in
mainland china�. Total Quality Management, 13(3), 285-300.
APPENDIX
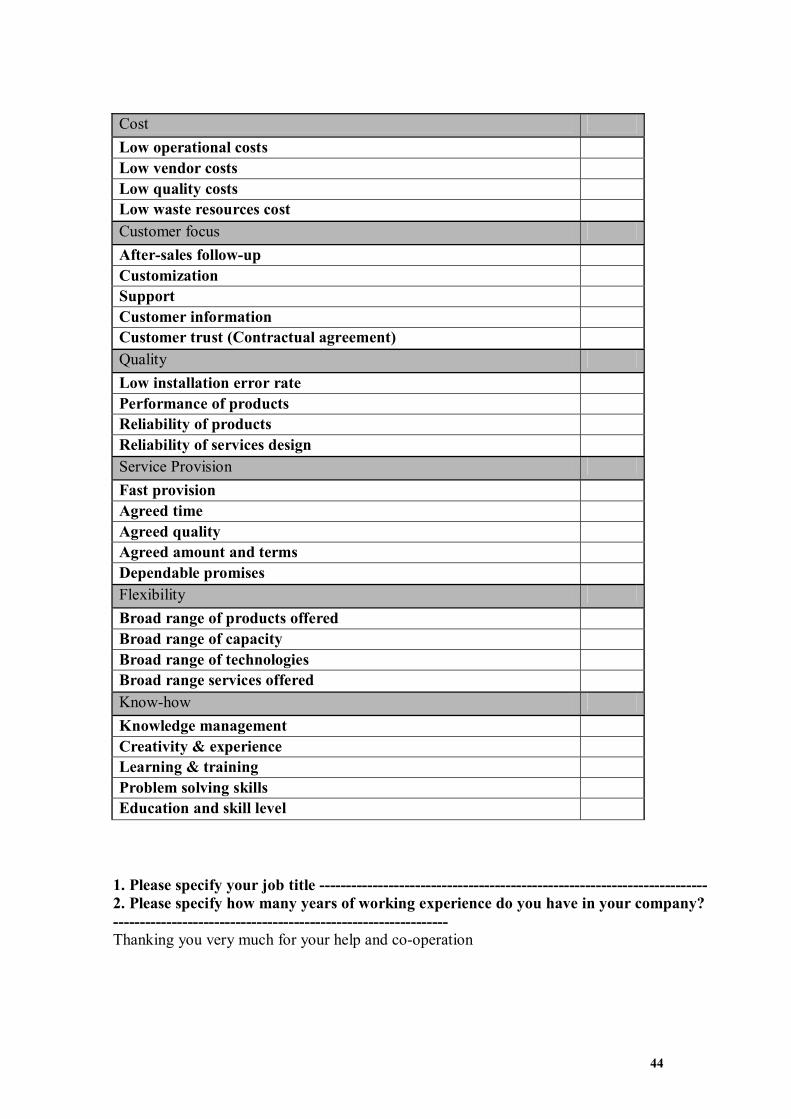
Dear participant: I am currently undertaking a research project investigating the link between competitive priorities and company success. Your response is extremely important to the success of this study. I would like to assure you that your response will be treated as "Strictly Confidential". Your response will be used for research purposes only. Please answer the questionnaire from the perspective that defines the company attitude toward customer segment. Thanking you very much for your help and co-operation Section A: Market Segmentation Customer Sector Type Size IT Competence 1. Public 1. Local 1. Med. 1. High 2. Private 2. MNC 2. Large 2. Very High Section B: Competitive priorities This section is concerned with predicting the relationship between the competitive priorities and company success. For the following set of priorities, please use the following scale ranging from: (1 = Not Important, to 4 = Very Important, to 7 = Absolutely Critical) to state: How important it is that BTC is able to:
44
Cost Low operational costs Low vendor costs Low quality costs Low waste resources cost Customer focus After-sales follow-up Customization Support Customer information Customer trust (Contractual agreement) Quality Low installation error rate Performance of products Reliability of products Reliability of services design Service Provision Fast provision Agreed time Agreed quality Agreed amount and terms Dependable promises Flexibility Broad range of products offered Broad range of capacity Broad range of technologies Broad range services offered Know-how Knowledge management Creativity & experience Learning & training Problem solving skills Education and skill level
1. Please specify your job title ------------------------------------------------------------------------- 2. Please specify how many years of working experience do you have in your company? --------------------------------------------------------------- Thanking you very much for your help and co-operation


