Teacher Overview
Answer Key Part 1
Answer Key Part 3
Answer Key Part 4
Answer Key Part 5
Answer Key Part 6
Student Guide Part 1
Student Guide Part 2
Student Guide Part 3
Student Guide Part 4
Student Guide Part 5
Student Guide Part 6
Student Response Sheet: Part 5
Student Response Sheet: Part 6
3. Bioaccumulation and Biomagnification

NOAA EcoCasting 2011 67
© 2011 Office of STEM Education Partnerships, Northwestern University Investigation III: Bioaccumulation – Teacher Overview, All Parts – 9 pages
Investigation III: Bioaccumulation and Biomagnification Purpose The purpose of this activity is to familiarize students with:
• Bioaccumulation and biomagnification • Persistent organic pollutants (POPs) and dangers they pose to human health • How humans can be exposed to POPs, and to recognize those pathways in a lake
ecosystem • Develop a working definition of one particular POP: polychlorinated biphenyls
(PCBs)
Overview This investigation explores the concepts of bioaccumulation and biomagnification and the effects of POPs present in an aquatic ecosystem. In Part 1, students will take a self-‐graded, pre-‐activity test that will help teachers to determine students' prior knowledge of these topics. Part 2 is a reading from the U.S. Environmental Protection Agency, "Persistent Organic Pollutants: A Global Issue, A Global Response." The graphic organizer "What is POP (don't you mean soda)?" may be used to help students organize what they learn from this document. In Part 3, students will work in groups to brainstorm ways that they might be exposed to toxins in their environment and then they will determine which of these pathways could also apply to aquatic organisms. In Part 4, students will read two factsheets published by the U.S. EPA and answer questions about polychlorinated biphenyls (PCBs) and their health effects. This investigation concludes with two modeling activities. Part 5 is a hands-‐on activity that will introduce students to the concept of bioaccumulation and biomagnification. In Part 6, students will use the NetLogo Aquatic Bioaccumulation model to further explore these concepts in a simulated environment. Students will collect model data and analyze it in table and graph format to answer activity questions. Student Outcomes Specific to this Investigation Illinois State Standards for grades 9-‐12
• Analyze the transmission of genetic traits, disease, and defects
College Readiness Standards • Understand the methods and tools used in an experiment • Determine experimental conditions that would produce a specified result
National Research Council’s (NRC) National Science Education Standards for grades 9-‐12
• Scientists usually inquire about how physical, living, or design systems function
NOAA EcoCasting 2011 68
© 2011 Office of STEM Education Partnerships, Northwestern University Investigation III: Bioaccumulation – Teacher Overview, All Parts – 9 pages
Time • Part 1: What do I know about pollutants? (pretest) – one 45-‐minute class period • Part 2: What is POP (don’t you mean soda)? – one 45-‐minute class period • Part 3: How are we exposed to chemicals? – one-‐half of a 45-‐minute class period • Part 4: What is a PCB? – one 45-‐minute class period • Part 5: Modeling Bioaccumulation and Biomagnification with Candy – one 45-‐
minute class period • Part 6: NetLogo Bioaccumulation model – one 45 minute class period
Level Secondary (9-‐12) Materials and Tools Part 1: What do I know about pollutants? (pretest)
• Pre-‐/ post-‐test
Part 2: What is POP (don’t you mean soda)? • Computers with internet access to EPA website:
http://www.epa.gov/international/toxics/pop.html • Or download “Persistant Organic Pollutants: A Global Issue, A Global Response”
(PDF) (EPA 160-‐F-‐02-‐001 April 2002) at http://www.epa.gov/oia/toxics/brochure.html
• Copies of “What is POP (don’t you mean soda)?” graphic organizer – one per student
Part 3: How are we exposed to chemicals? • White boards and dry erase markers • Brainstorming worksheets and questions – one each per student • Four different colors of highlighters – one set per group
Part 4: What is a PCB? • Computers with internet access to EPA website:
http://www.epa.gov/epawaste/hazard/tsd/pcbs/pubs/about.htm http://www.epa.gov/epawaste/hazard/tsd/pcbs/pubs/effects.htm
• Copies of graphic organizers and questions – one each per student
Part 5: Modeling Bioaccumulation and Biomagnification with Candy • Copies of Student Guide – one per student • Pre-‐printed food chain worksheets – 1 per group • 25 Skittles or M&Ms per group • 50 plastic beads

NOAA EcoCasting 2011 69
© 2011 Office of STEM Education Partnerships, Northwestern University Investigation III: Bioaccumulation – Teacher Overview, All Parts – 9 pages
Part 6: NetLogo Bioaccumulation model • Computers – ideally one per student • Internet access and Java-‐enable web browser or NetLogo model software installed • Copies of Student Guide and Student Response Sheets – one each per student • Graph paper
Preparation Part 1: What do I know about pollutants?
• Copy one test per student
Part 2: What is POP (don’t you mean soda)? • Download, print, and copy EPA publication cited above or provide internet access to
online version • Copy one graphic organizer per student
Part 3: How are we exposed to chemicals? • If using white board, divide into 4 squares per lab group (2-‐3 students each) • Or, copy brainstorming and question sheets for each student
Part 4: What is a PCB? • If necessary, schedule time in computer lab • Ensure student computers can access above EPA site • Copy one graphic organizer and question sheet per student
Part 5: Modeling Bioaccumulation and Biomagnification with Candy • Copy food chain worksheets – 1 per group • Laminate worksheets (optional, if you want to reuse them later) • Copy and cut out vocabulary review activity (optional) • Divide candies into portions of 150 per student group (2-‐3 students per group) • Tape large picture of smallmouth bass to whiteboard at the front of the room • For a video of how this model should work: http://vimeo.com/20107416
Part 6: NetLogo Bioaccumulation model • If you are using the NetLogo software with the Aquatic Bioaccumulation model:
§ Download the NetLogo software from: http://ccl.northwestern.edu/netlogo/ § Then, go to:
http://ecocasting.northwestern.edu/NetLogo/Bioaccumulation.html. Under the model, right-‐click on “view/download model file” and select “Save Link As…”
§ Save file to a labeled folder that students can access from their computers. • Or, provide internet access to the NetLogo Aquatic Bioaccumulation model:
http://ecocasting.northwestern.edu/NetLogo/Bioaccumulation.html • If necessary, schedule time in computer lab

NOAA EcoCasting 2011 70
© 2011 Office of STEM Education Partnerships, Northwestern University Investigation III: Bioaccumulation – Teacher Overview, All Parts – 9 pages
Prerequisites Part 1: none Part 2:
• NOAA EcoCasting Investigations I and II and the Investigation III Pre-‐test (optional) • Students must understand the definition of a chemical, including being able to
define a compound. • Students should have a reading level from the 11-‐12 grades. Randomly selected
paragraphs from this reading were tested using the Flesch-‐Kincaid method and resulted in a grade level of 12. If students are not at this level you may need to scaffold the reading.
Part 3: Students should be able to define a compound Part 4: Basic introduction to the terms “persistent organic pollutant (POP)” and “exposure pathway” Part 5:
• Students will need to be familiar with the terms bioaccumulation and biomagnification
• Investigations I and II, Parts 1-‐4 of Investigation III (optional) • Students should understand the 90/10 rule, which states that only about 10% of the
energy from one trophic level will be transferred to the next higher trophic level; the remaining 90% is used for metabolic processes or lost as body heat.
Part 6: Students should be able to: • recognize a food chain and be able to define the trophic levels within it • define and qualitatively recognize biomagnification and bioaccumulation
Background Part 1: N/A Part 2: Students must have:
• basic knowledge of chemistry • reading level of grade 11-‐12; see note in Prerequisites
Part 3: Basic knowledge of chemistry Part 4: Basic knowledge of chemistry Part 5: Students should be familiar with the 90:10 rule, i.e. that only about 10% of the energy from one trophic level is passed on to the next highest level. The remaining 90% is used up for metabolic function or is lost as body heat
NOAA EcoCasting 2011 71
© 2011 Office of STEM Education Partnerships, Northwestern University Investigation III: Bioaccumulation – Teacher Overview, All Parts – 9 pages
Part 6: Students should be familiar with food chains/webs, POPs, and exposure pathways Teaching Notes Part 1: This test can be used as:
• a tool to assess knowledge retention from previous units and adjust the unit accordingly
• part of a pre-‐/post-‐test assessment to demonstrate evidence of content learning and/or to assess instruction effectiveness
Part 2: The Persistent Organic Pollutants: A Global Issue, A Global Response booklet is comprehensive. Strategies for maximizing the reading activity include: Independent Reading: Students read independently and are assigned a starting and stopping point for each section of content (i.e., “What are POPs? pp. 2-‐4) and a purpose for the reading. For example, “While you read determine three characteristics of a POP that you can share with the class.” They should use the graphic organizer to summarize what they read. After completion of the task, the class can have a short oral discussion and then the next section should be assigned. Note: to successfully complete this section of the activity the following sections should be read: What are POPs?, What Domestic Actions Have Been Taken to Control POPs, How Do POPs Affect People and Wildlife?, and The Great Lakes: A Story of Trials and Triumphs. Jigsaw: Split the students into groups and assign each group a section to read. As they read they should add their summaries to the “pop bubbles on the graphic organizer”. Upon completion of the task each group becomes the expert on their section and is required to teach their section to the rest of the class. Note that there is no answer key for this activity. Part 3: When students are brainstorming, remind them that we come into contact with liquids, solids, and gases every day. Part 4: It is suggested that you preview the suggested readings first, as you may need to review vocabulary and/or modify the readings depending on student ability. Part 5: To assist with developing a definition of biomagnification/bioaccumulation it may be helpful to open the activity by discussing the origin of the terms bioaccumulation and biomagnification.
• Bio is Greek in origin and means “life”; hence, biology is the study of life (logy refers “to the study of [a certain subject]”).
• Accumulate is from the Latin word accumulātus, past participle of accumulāre to heap up, from cumulus a heap. (Source: World English Dictionary, accumulate, http://dictionary.reference.com/browse/accumulate)

NOAA EcoCasting 2011 72
© 2011 Office of STEM Education Partnerships, Northwestern University Investigation III: Bioaccumulation – Teacher Overview, All Parts – 9 pages
• To magnify is to increase the apparent size of, especially with a lens; biomagnification is the increase in the concentration of a substance at higher trophic levels.
In the final step of this activity when you feed each group’s crayfish to the smallmouth bass, remember that after each day of feeding the fish will also respire. Make sure the fish is respiring the same amount each day: 32 units of energy. This way the total number of candy will consistently be higher than the PCB units, but students will still see bioaccumulation and biomagnification occurring. This lesson is adapted from “Bioaccumulation of Toxins,” produced by PolarTrec Resources, which can be found online at: http://www.polartrec.com/files/resources/lesson/10856/bioaccumulationtoxinsfinal.pdf This lesson can be modified for students at different learning levels. Variation: Have each group (2-‐3 students) model one periphyton through 10 days of feeding. Then, have 3 groups join together to feed each of their periphyton to one crayfish. The students will have only 3 days of data for biomagnification, unless you choose to have each initial group model more than one periphyton. From this point, follow the original lesson plan to feed the crayfish to the smallmouth bass at the front of the room. Additional Activity: The review activity on page 74 can be used as a vocabulary review at the end of this model. Divide the class into groups of 9. Cut up the following table so that every student has one line. (“I have ‘bioaccumulation’” and “Who as ‘PCBs’”). One student in the group will start by reading their paper aloud. Whoever has the corresponding card (in this case it would be followed by: “I have ‘polychlorinated biphenyls’”) reads their statement aloud. This will continue until all students have read their definitions. The terms in this activity are drawn from Investigations II and III; thus, if you have not done Investigation II with your students, not all of the terms may be familiar to them. Part 6: It is suggested that you familiarize yourself with the model and the various ways in which it can be manipulated prior to beginning this activity with the class. You can choose to use the NetLogo software—it will need to be installed prior to this class period—or you can use the online version, which requires a Java-‐enabled web browser. An explanation of this particular NetLogo model can be found by clicking on the “Information” tab at the top of the screen if you are using the software package. If you are using the online applet version, there is detailed information below the model screen. You can also visit the NetLogo website at http://ccl.northwestern.edu/netlogo/ for more detailed information. Encourage students to do a Screen Capture of their population graphs, print them out, and attach them to their Student Guides. That will give you a more accurate picture than their hand-‐drawings and will allow easier assessment of their analyses.

NOAA EcoCasting 2011 73
© 2011 Office of STEM Education Partnerships, Northwestern University Investigation III: Bioaccumulation – Teacher Overview, All Parts – 9 pages
Screen Captures can be done in several ways: • On a PC: fn+insert/prt sc key combination or use the Snipping Tool software
found on HP Tablet laptops. • On a Mac: command+shift+4 will produce a crosshairs symbol; students can then
drag the cursor and select the image they would like to save
Students may often find the model behaving in unpredictable ways. Encourage them to explore possible explanations, as well as the limits of a model of this type. Although the initial starting numbers are the same, both the locations of the individual organisms and the interactions between them are randomized for every run. Students may see some of their smallmouth bass turning orange if they allow the model to run for a while. This happens when the toxicity level of the individual fish exceeds 200 units. Additional Information You may need to more fully explain the technology, data analysis and graphing, or other aspects of these activities depending on student ability and background

NOAA EcoCasting 2011 74
© 2011 Office of STEM Education Partnerships, Northwestern University Investigation III: Bioaccumulation – Teacher Overview, All Parts – 9 pages
Review Activity
I have “bioaccumulation” Who has “PCBs”?
I have “polychlorinated biphenyls” Who has “the set of feeding relationships between different populations or organisms in an ecosystem”?
I have “food chain“ Who has “a POP”?
I have “persistent organic pollutant” Who has “an organism that can make its own food using energy from the sun and/or chemical compounds in its environment ”?
I have “producer “ Who has “the position in a food chain occupied by a certain organism”?
I have “trophic level “ Who has “the ratio of energy used for metabolism versus energy stored by an organism”?
I have “the 90:10 rule“ Who has “an organism that feeds on other organisms to get its energy”?
I have “consumer “ Who has “increasing concentration of contaminants in animals at higher trophic levels”?
I have “biomagnification “ Who has “increasing concentration of contaminants from any source within an individual over time”?

NOAA EcoCasting 2011 75
© 2011 Office of STEM Education Partnerships, Northwestern University Investigation III: Bioaccumulation – Teacher Overview, All Parts – 9 pages
If you want to add terms or delete terms according to students a new table may be made. The pattern is as follows: I have “Term 1” Who has “Term 2 definition” I have “Term 2” Who has “Term 3 definition” I have “Term 3” Who has “Term 1 definition” To make this table create a regular table term and definition side by side and an empty row on top. An example follows: I have “Term 1” Who has “Term 1 definition” I have “Term 2” Who has “Term 2 definition” I have “Term 3” Who has “Term 3 definition” Then cut and paste cells for second column up one. Who has “Term 1 definition” I have “Term 1” Who has “Term 2 definition” I have “Term 2” Who has “Term 3 definition” I have “Term 3” Then take the bottom term definition in first column and move to top of column. I have “Term 3” Who has “Term 1 definition” I have “Term 1” Who has “Term 2 definition” I have “Term 2” Who has “Term 3 definition”

NOAA EcoCasting 2011 77
© 2011 Office of STEM Education Partnerships, Northwestern University Investigation III: Bioaccumulation – Answer Key, Part 1 – 1 page
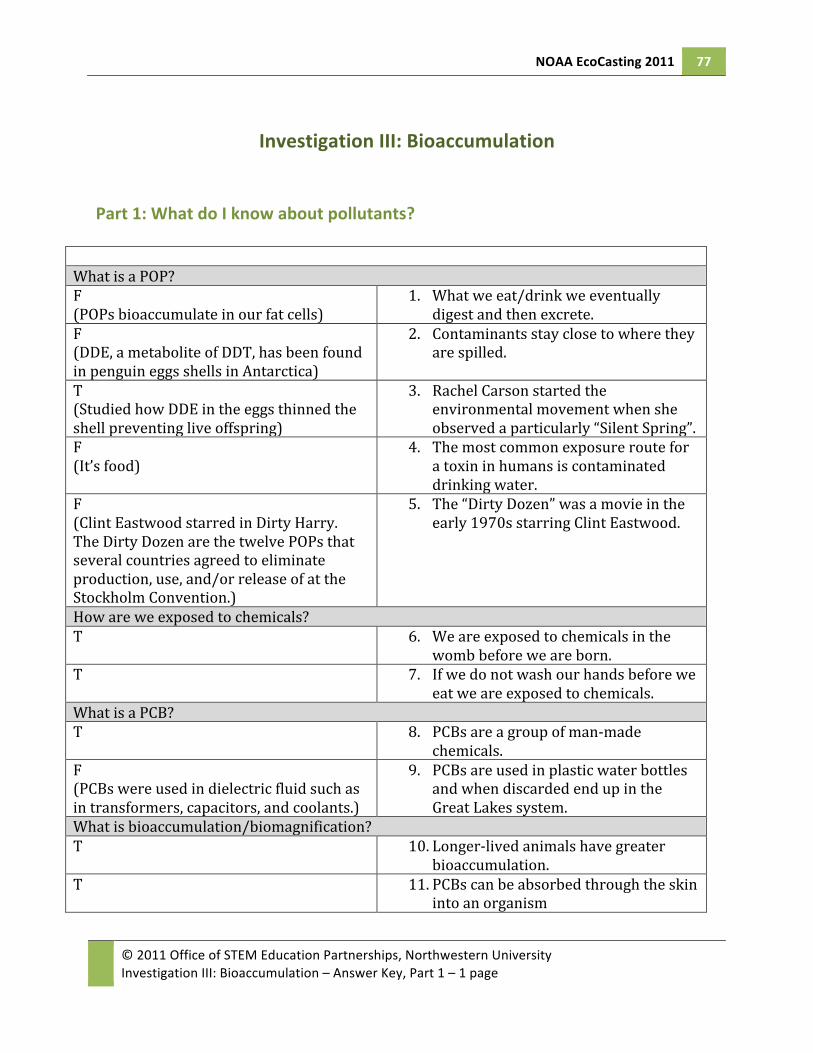
Investigation III: Bioaccumulation Part 1: What do I know about pollutants?
What is a POP? F (POPs bioaccumulate in our fat cells)
1. What we eat/drink we eventually digest and then excrete.
F (DDE, a metabolite of DDT, has been found in penguin eggs shells in Antarctica)
2. Contaminants stay close to where they are spilled.
T (Studied how DDE in the eggs thinned the shell preventing live offspring)
3. Rachel Carson started the environmental movement when she observed a particularly “Silent Spring”.
F (It’s food)
4. The most common exposure route for a toxin in humans is contaminated drinking water.
F (Clint Eastwood starred in Dirty Harry. The Dirty Dozen are the twelve POPs that several countries agreed to eliminate production, use, and/or release of at the Stockholm Convention.)
5. The “Dirty Dozen” was a movie in the early 1970s starring Clint Eastwood.
How are we exposed to chemicals? T 6. We are exposed to chemicals in the
womb before we are born. T 7. If we do not wash our hands before we
eat we are exposed to chemicals. What is a PCB? T 8. PCBs are a group of man-‐made
chemicals. F (PCBs were used in dielectric fluid such as in transformers, capacitors, and coolants.)
9. PCBs are used in plastic water bottles and when discarded end up in the Great Lakes system.
What is bioaccumulation/biomagnification? T 10. Longer-‐lived animals have greater
bioaccumulation. T 11. PCBs can be absorbed through the skin
into an organism

NOAA EcoCasting 2011 78
© 2011 Office of STEM Education Partnerships, Northwestern University Investigation III: Bioaccumulation – Answer Key, Part 3 – 2 pages
Name Date Class
Group members’ names
Investigation III: Bioaccumulation Part 3: How are we exposed to chemicals?
Exposure Pathways Concept Map
swimming in the high school pool
Drinking my morning Redbull
Eating food in the school cafeteria
Breathing the air in the weight room

NOAA EcoCasting 2011 79
© 2011 Office of STEM Education Partnerships, Northwestern University Investigation III: Bioaccumulation – Answer Key, Part 3 – 2 pages
Once the class has shared their brainstorming, complete the following: Q1. Write the three exposure pathways for humans by your class.
eating/drinking_(green) inhalation_(blue) skin contact/absorption (yellow)
Q2. Now imagine you’re an organism living in a beautiful lake. Would your exposure
pathways change?
Aquatic organisms can be exposed to chemicals via the food they eat (trophic transfer) or direct uptake from the water column.
Q3. Do exposure pathways change according to what type of aquatic organism you are:
forage fish, a mussel, or a top predator? Think about where each one lives, what they eat, how they breathe, etc.
Mussels are filter-‐feeders, and will take up toxins present in the water column and in their prey. They will also be exposed to toxins that are bound to sediments. Forage fish will be exposed to toxins via direct contact with water as well as trophic transfer. Top predators, like the smallmouth bass or larger fish in other ecosystems (tuna and swordfish, for example) are likely to be exposed to more toxicity from their prey than from the water column directly. Thus, the exposure pathways do not change entirely for different species, but the portion of toxicity transferred via each pathway will differ.
Q4. List the generalized exposure pathways for an aquatic organism.
Eating &_absorption (direct uptake)
NOAA EcoCasting 2011 80
© 2011 Office of STEM Education Partnerships, Northwestern University Investigation III: Bioaccumulation – Answer Key, Part 4 – 3 pages
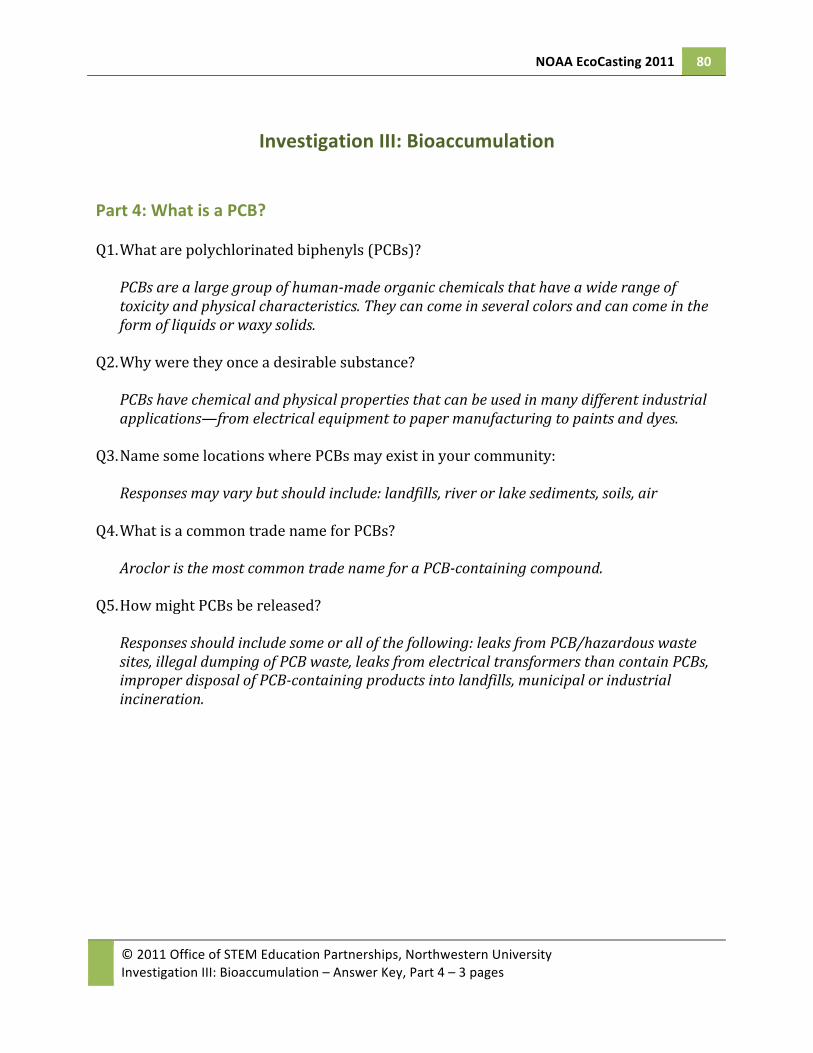
Investigation III: Bioaccumulation Part 4: What is a PCB? Q1. What are polychlorinated biphenyls (PCBs)?
PCBs are a large group of human-‐made organic chemicals that have a wide range of toxicity and physical characteristics. They can come in several colors and can come in the form of liquids or waxy solids.
Q2. Why were they once a desirable substance?
PCBs have chemical and physical properties that can be used in many different industrial applications—from electrical equipment to paper manufacturing to paints and dyes.
Q3. Name some locations where PCBs may exist in your community:
Responses may vary but should include: landfills, river or lake sediments, soils, air Q4. What is a common trade name for PCBs?
Aroclor is the most common trade name for a PCB-‐containing compound. Q5. How might PCBs be released?
Responses should include some or all of the following: leaks from PCB/hazardous waste sites, illegal dumping of PCB waste, leaks from electrical transformers than contain PCBs, improper disposal of PCB-‐containing products into landfills, municipal or industrial incineration.

NOAA EcoCasting 2011 81
© 2011 Office of STEM Education Partnerships, Northwestern University Investigation III: Bioaccumulation – Answer Key, Part 4 – 3 pages
Health Effects of PCB exposure Answers should include some or all of the following:
Endocrine Effect
Health Effects
Neurological Effect
Reproductive Effect
Immune Effect
in Rhesus monkeys: significant decrease in size of thymus gland, decreased resistance to Epstein-‐Barr virus and other infections, increased susceptibility to pneumonia and viral infections, decreased ability to mount primary antibody response and develop protective immunity
in Rhesus monkeys: reduced birth weights, reduced rates of conception and live births; in humans: decreased birth weights, gestational age
in newborn monkeys: persistent and significant deficits in neuro -‐logical development, including visual recognition, short-‐term memory and learning. Some evidence suggests similar effects in humans
can have effects on thyroid hormone levels, which are important for normal growth and development

NOAA EcoCasting 2011 82
© 2011 Office of STEM Education Partnerships, Northwestern University Investigation III: Bioaccumulation – Answer Key, Part 4 – 3 pages
Q6. What are other names for polychlorinated biphenyls? Student answers may vary; some other names include: Pyranol, Inerteen, Askarel, Pydraul. This MSDS can be found at: http://www.gepower.com/prod_serv/products/capacitors/en/downloads/pcb_msds_pcb.pdf
Q7. What are common uses of PCBs?
Pyranol and Inerteen were used as fluids in electrical transformers; Askarel is a generic name for a category of fire-‐resistant synthetic compounds; Pydraul is trade name for hydraulic fluids
Q8. What are the sources, routes, and types of exposure to PCBs?
Student answers will vary. For these compounds, routes of exposure include skin contact and inhalation of heated vapors
Q9. What are the effects of exposure to PCBs? (note if these are different from what the EPA
states) Effects may include: eye irritation; red, dry, itchy skin; respiratory tract irritation (at high temperatures)
Q10. What are the safety guidelines for exposure to PCBs?
If contact occurs, flush area with lots of water; handling instructions recommend safety equipment such as goggles, gloves, protective clothing, and when necessary respiratory protection equipment as well

NOAA EcoCasting 2011 83
© 2011 Office of STEM Education Partnerships, Northwestern University Investigation III: Bioaccumulation – Answer Key, Part 5 – 4 pages
Investigation III: Bioaccumulation Part 5: Pre-‐Modeling Activity – Bioaccumulation and Biomagnification
Periphyton
Day PCB units
(number of beads) Biomass Units
(number of candies after respiring)
Total Units Ratio PCB Units to Total Units in
decimal 0 0 1 1 0 1 0 2 2 0 2 1 3 4 0.25 3 2 4 6 0.33 4 3 5 8 0.38
Q1. Did the periphyton get “bigger” over the 4 day period?
After respiring on the 4th day, the periphyton should have a biomass of 5 units. Since after respiring on the 1st day it only had 2 units of biomass, it has gotten “bigger.”
Q2. What happened to the concentration of PCBs in the periphyton? Remember to use
appropriate science vocabulary.
The ratio of PCB units (plastic beads) to total units (biomass units+ PCB units) increased over time, from 0 to 0.38. Thus, the concentration of PCBs in the periphyton has increased and the organism has more toxins.

NOAA EcoCasting 2011 84
© 2011 Office of STEM Education Partnerships, Northwestern University Investigation III: Bioaccumulation – Answer Key, Part 5 – 4 pages
Teacher note: Uptake 4 periphyton = 4* 3 PCBS (beads) + 4* 5 candies (caloric units) This results in: Uptake per day 12 beads + 20 caloric units minus respiration per day = 90% (.9 *20 caloric units) -‐18 caloric units
Total gain per day = 12 beads + 2 caloric unit
Crayfish
Day
PCB units (number of beads)
Biomass Units (number of candies after respiring)
Total Units Ratio PCB Units to Total Units in decimal
0 0 10 10 0 1 12 12 24 0.5 2 24 14 38 0.63 3 36 16 52 0.69 4 48 18 66 0.73 Teacher note: Uptake 2 crayfish = 2* 48 PCBS (beads) + 2* 18 candies (caloric units) This results in Uptake per day 96 beads + 36 caloric units minus respiration per day 90% (.9 *36 caloric units) -‐32 caloric units
Total gain per day = 96 beads + 4 caloric unit
Smallmouth Bass
Day
PCB units (number of beads)
Biomass Units (number of candies after respiring)
Total Units Ratio PCB Units to Total Units in decimal
0 0 20 20 0 1 96 24 120 0.8 2 192 28 220 0.87 3 288 32 320 0.90 4 384 36 420 0.91
Q3. Based on the results of your previous two examples, what do you predict will happen to
the PCB concentration in the smallmouth bass after four days of eating this way?
The ratio of PCB to smallmouth bass biomass will increase with each day of feeding.
NOAA EcoCasting 2011 85
© 2011 Office of STEM Education Partnerships, Northwestern University Investigation III: Bioaccumulation – Answer Key, Part 5 – 4 pages
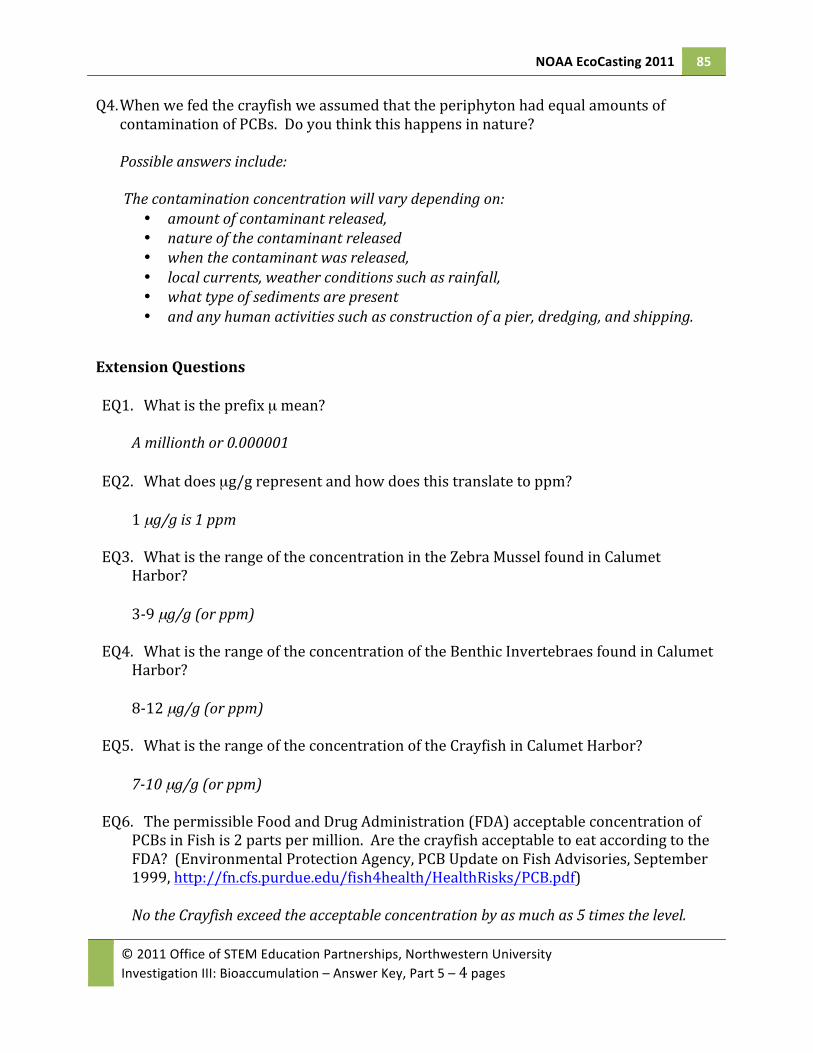
Q4. When we fed the crayfish we assumed that the periphyton had equal amounts of contamination of PCBs. Do you think this happens in nature?
Possible answers include:
The contamination concentration will vary depending on:
• amount of contaminant released, • nature of the contaminant released • when the contaminant was released, • local currents, weather conditions such as rainfall, • what type of sediments are present • and any human activities such as construction of a pier, dredging, and shipping.
Extension Questions EQ1. What is the prefix µ mean?
A millionth or 0.000001
EQ2. What does µg/g represent and how does this translate to ppm?
1 µg/g is 1 ppm
EQ3. What is the range of the concentration in the Zebra Mussel found in Calumet
Harbor? 3-‐9 µg/g (or ppm)
EQ4. What is the range of the concentration of the Benthic Invertebraes found in Calumet
Harbor? 8-‐12 µg/g (or ppm)
EQ5. What is the range of the concentration of the Crayfish in Calumet Harbor?
7-‐10 µg/g (or ppm)
EQ6. The permissible Food and Drug Administration (FDA) acceptable concentration of
PCBs in Fish is 2 parts per million. Are the crayfish acceptable to eat according to the FDA? (Environmental Protection Agency, PCB Update on Fish Advisories, September 1999, http://fn.cfs.purdue.edu/fish4health/HealthRisks/PCB.pdf) No the Crayfish exceed the acceptable concentration by as much as 5 times the level.

NOAA EcoCasting 2011 86
© 2011 Office of STEM Education Partnerships, Northwestern University Investigation III: Bioaccumulation – Answer Key, Part 5 – 4 pages
EQ7. Are the crayfish acceptable to eat according to the Great Lakes states themselves that have a far more stringent standard of 0.05?( “Salmon and PCBs,” Fox River Watch, www.foxriverwatch.com/salmon_pcb_pcbs.html) No the Crayfish exceed the acceptable concentration by as much as 200 times the acceptable level.

NOAA EcoCasting 2011 87
© 2011 Office of STEM Education Partnerships, Northwestern University Investigation III: Bioaccumulation – Answer Key, Part 6 – 8 pages
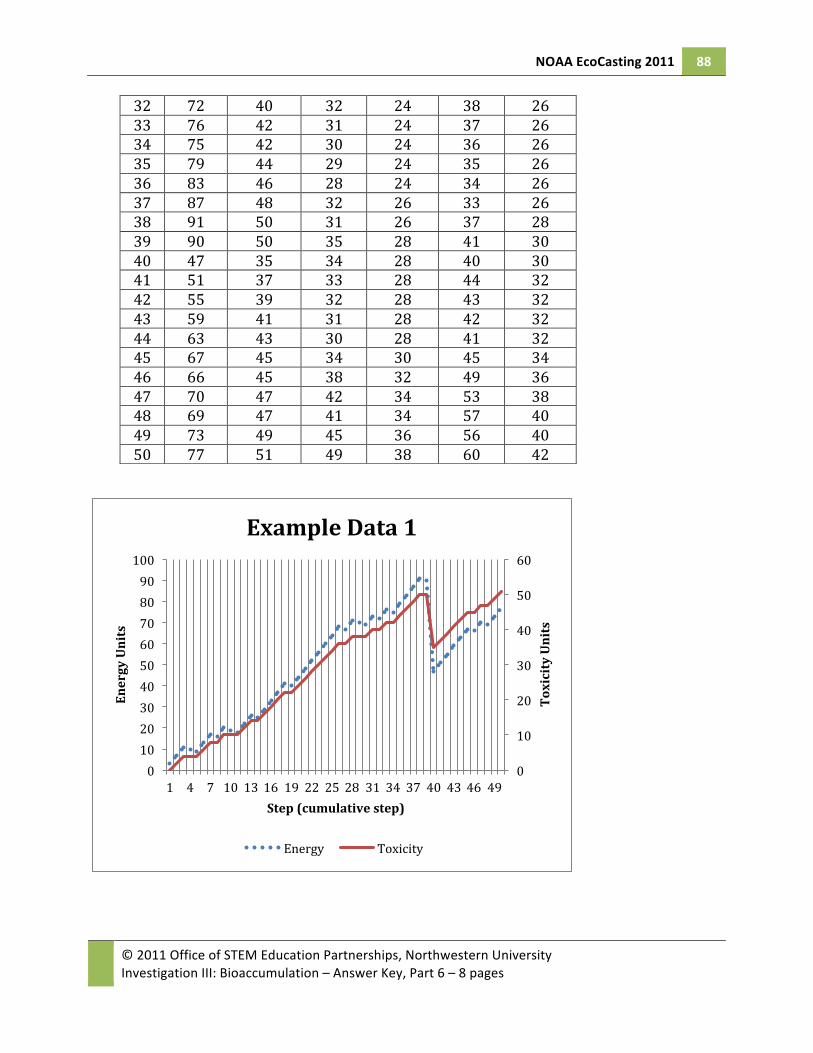
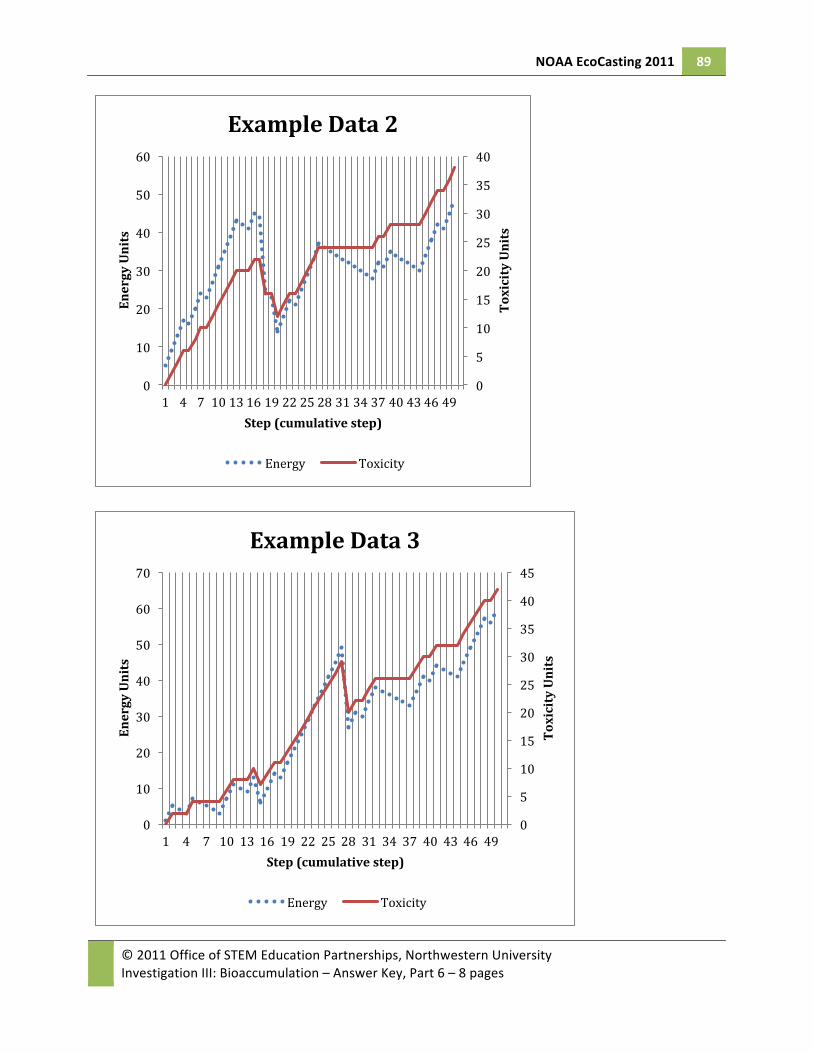
Investigation III: Bioaccumulation Part 6: Modeling bioaccumulation and biomagnification using NetLogo The Crayfish Below are there are three example data sets and graphs for these examples.
Example 1 Example 2 Example 3 Step Energy Toxicity Energy Toxicity Energy Toxicity 1 3 0 5 0 1 0 2 7 2 9 2 5 2 3 11 4 13 4 4 2 4 10 4 17 6 3 2 5 9 4 16 6 7 4 6 13 6 20 8 6 4 7 17 8 24 10 5 4 8 16 8 23 10 4 4 9 20 10 27 12 3 4 10 19 10 31 14 7 6 11 18 10 35 16 11 8 12 22 12 39 18 10 8 13 26 14 43 20 9 8 14 25 14 42 20 13 10 15 29 16 41 20 6 7 16 33 18 45 22 10 9 17 37 20 44 22 14 11 18 41 22 24 16 13 11 19 40 22 23 16 17 13 20 44 24 14 12 21 15 21 48 26 18 14 25 17 22 52 28 22 16 29 19 23 56 30 21 16 33 21 24 60 32 25 18 37 23 25 64 34 29 20 41 25 26 68 36 33 22 45 27 27 67 36 37 24 49 29 28 71 38 36 24 27 20 29 70 38 35 24 31 22 30 69 38 34 24 30 22 31 73 40 33 24 34 24
NOAA EcoCasting 2011 88
© 2011 Office of STEM Education Partnerships, Northwestern University Investigation III: Bioaccumulation – Answer Key, Part 6 – 8 pages
32 72 40 32 24 38 26 33 76 42 31 24 37 26 34 75 42 30 24 36 26 35 79 44 29 24 35 26 36 83 46 28 24 34 26 37 87 48 32 26 33 26 38 91 50 31 26 37 28 39 90 50 35 28 41 30 40 47 35 34 28 40 30 41 51 37 33 28 44 32 42 55 39 32 28 43 32 43 59 41 31 28 42 32 44 63 43 30 28 41 32 45 67 45 34 30 45 34 46 66 45 38 32 49 36 47 70 47 42 34 53 38 48 69 47 41 34 57 40 49 73 49 45 36 56 40 50 77 51 49 38 60 42
0
10
20
30
40
50
60
0 10 20 30 40 50 60 70 80 90 100
1 4 7 10 13 16 19 22 25 28 31 34 37 40 43 46 49
Toxicity Units
Energy Units
Step (cumulative step)
Example Data 1
Energy Toxicity
NOAA EcoCasting 2011 89
© 2011 Office of STEM Education Partnerships, Northwestern University Investigation III: Bioaccumulation – Answer Key, Part 6 – 8 pages
0
5
10
15
20
25
30
35
40
0
10
20
30
40
50
60
1 4 7 10 13 16 19 22 25 28 31 34 37 40 43 46 49
Toxicity Units
Energy Units
Step (cumulative step)
Example Data 2
Energy Toxicity
0
5
10
15
20
25
30
35
40
45
0
10
20
30
40
50
60
70
1 4 7 10 13 16 19 22 25 28 31 34 37 40 43 46 49
Toxicity Units
Energy Units
Step (cumulative step)
Example Data 3
Energy Toxicity
NOAA EcoCasting 2011 90
© 2011 Office of STEM Education Partnerships, Northwestern University Investigation III: Bioaccumulation – Answer Key, Part 6 – 8 pages
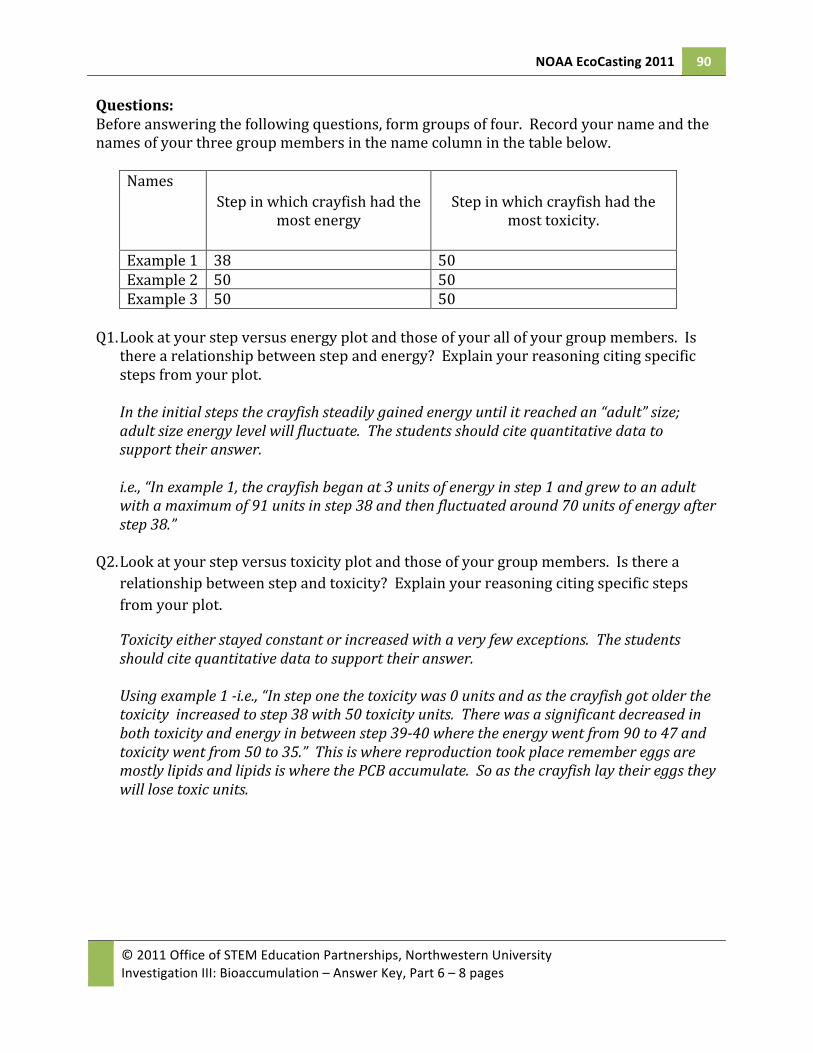
Questions: Before answering the following questions, form groups of four. Record your name and the names of your three group members in the name column in the table below.
Names Step in which crayfish had the
most energy Step in which crayfish had the
most toxicity.
Example 1 38 50 Example 2 50 50 Example 3 50 50
Q1. Look at your step versus energy plot and those of your all of your group members. Is
there a relationship between step and energy? Explain your reasoning citing specific steps from your plot.
In the initial steps the crayfish steadily gained energy until it reached an “adult” size; adult size energy level will fluctuate. The students should cite quantitative data to support their answer.
i.e., “In example 1, the crayfish began at 3 units of energy in step 1 and grew to an adult with a maximum of 91 units in step 38 and then fluctuated around 70 units of energy after step 38.”
Q2. Look at your step versus toxicity plot and those of your group members. Is there a
relationship between step and toxicity? Explain your reasoning citing specific steps from your plot.
Toxicity either stayed constant or increased with a very few exceptions. The students should cite quantitative data to support their answer.
Using example 1 -‐i.e., “In step one the toxicity was 0 units and as the crayfish got older the toxicity increased to step 38 with 50 toxicity units. There was a significant decreased in both toxicity and energy in between step 39-‐40 where the energy went from 90 to 47 and toxicity went from 50 to 35.” This is where reproduction took place remember eggs are mostly lipids and lipids is where the PCB accumulate. So as the crayfish lay their eggs they will lose toxic units.
NOAA EcoCasting 2011 91
© 2011 Office of STEM Education Partnerships, Northwestern University Investigation III: Bioaccumulation – Answer Key, Part 6 – 8 pages
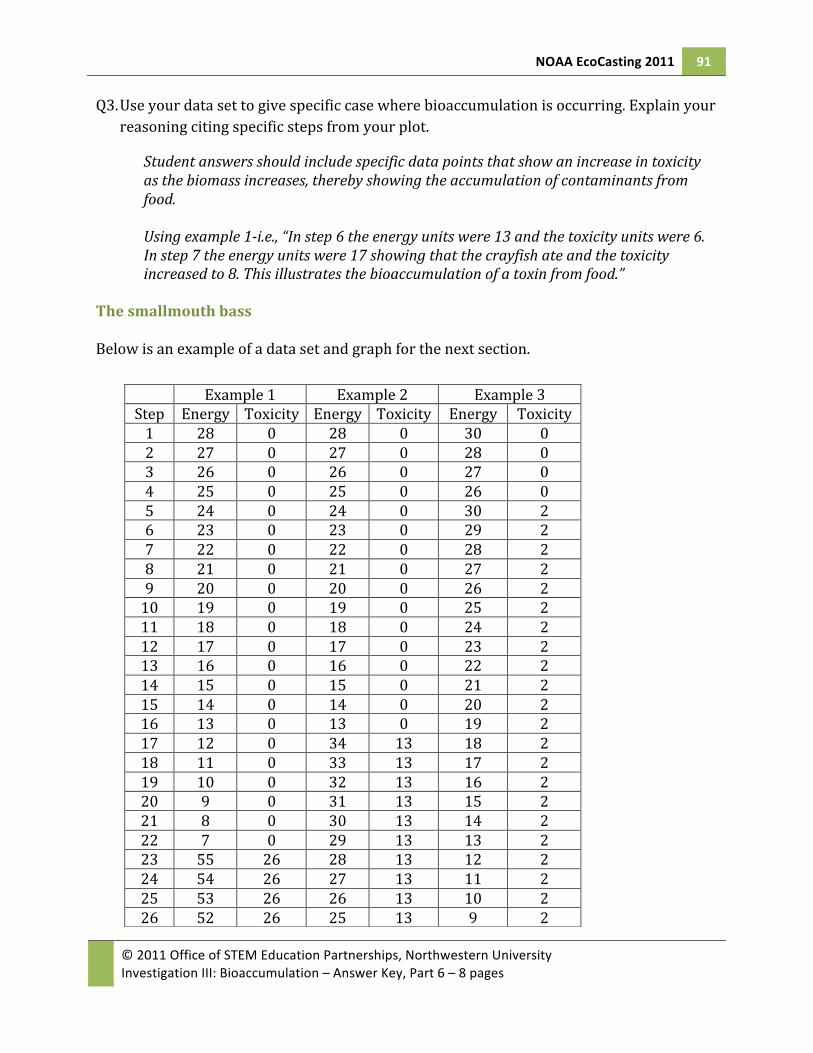
Q3. Use your data set to give specific case where bioaccumulation is occurring. Explain your reasoning citing specific steps from your plot.
Student answers should include specific data points that show an increase in toxicity as the biomass increases, thereby showing the accumulation of contaminants from food. Using example 1-‐i.e., “In step 6 the energy units were 13 and the toxicity units were 6. In step 7 the energy units were 17 showing that the crayfish ate and the toxicity increased to 8. This illustrates the bioaccumulation of a toxin from food.”
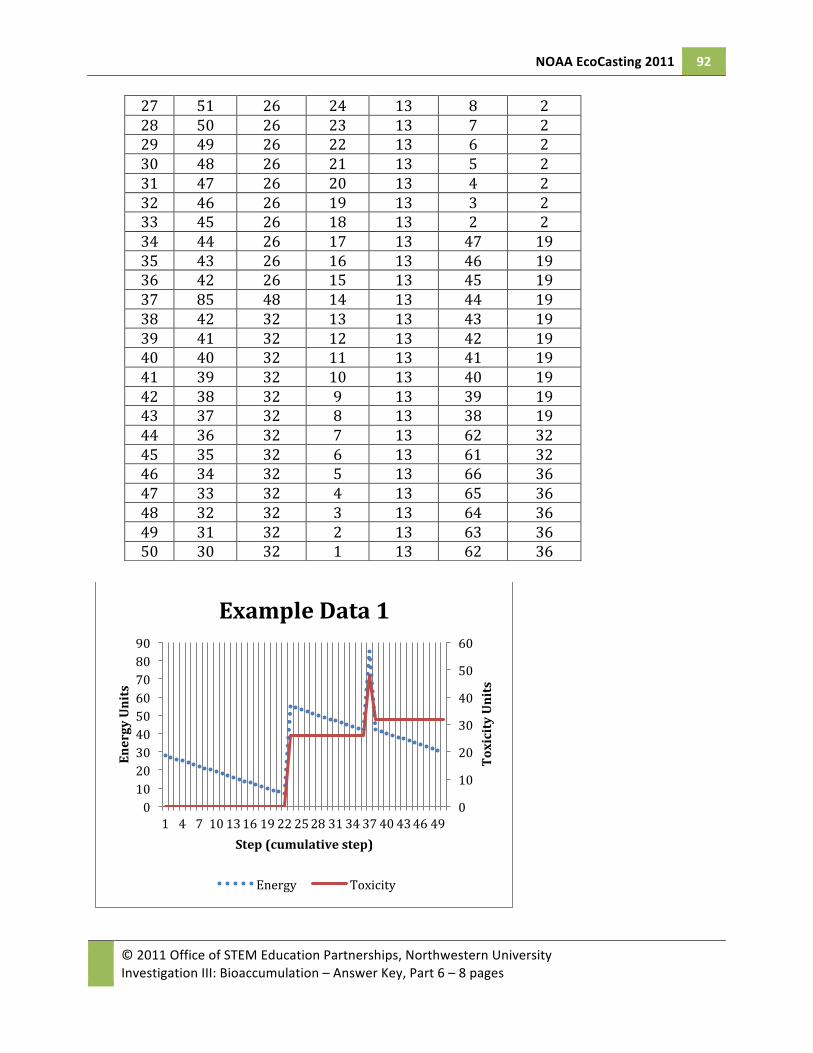
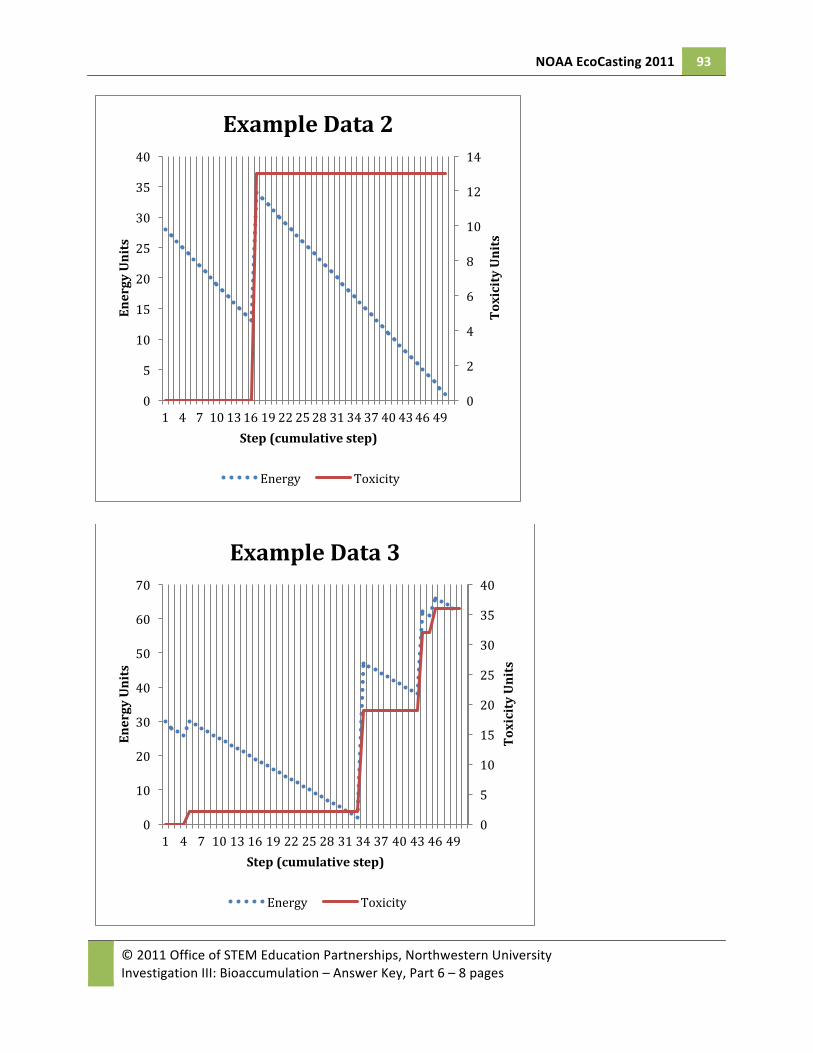
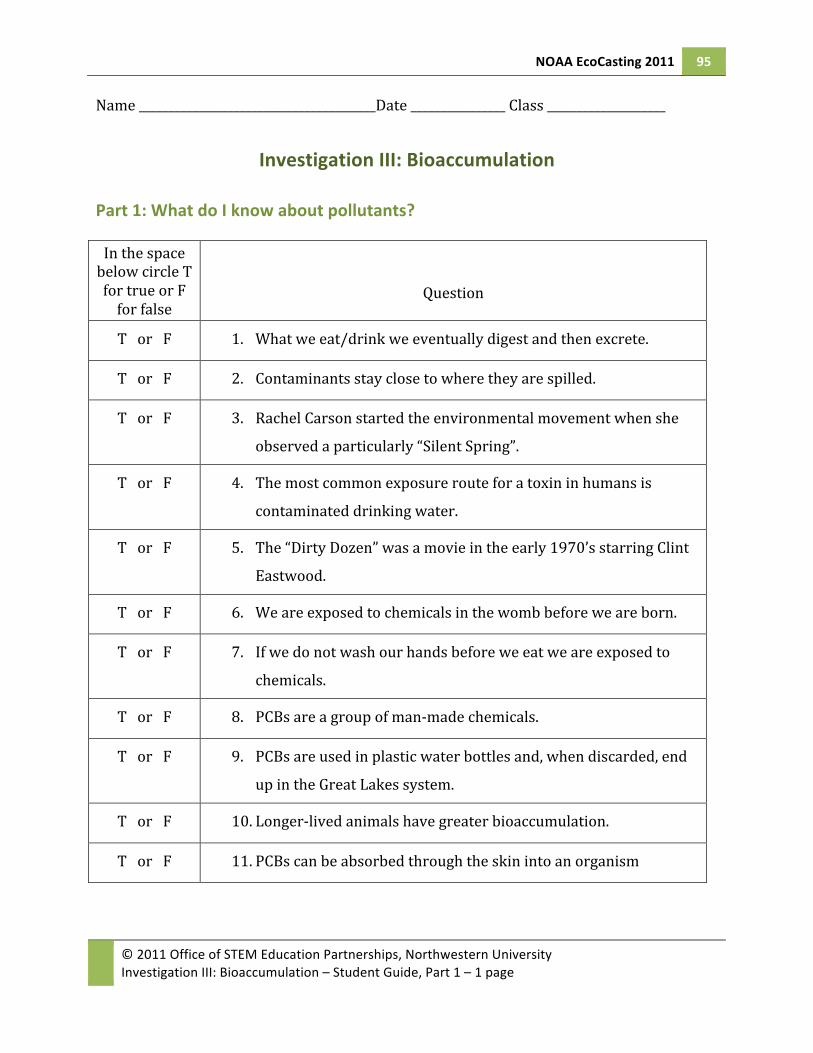
The smallmouth bass Below is an example of a data set and graph for the next section.
Example 1 Example 2 Example 3 Step Energy Toxicity Energy Toxicity Energy Toxicity 1 28 0 28 0 30 0 2 27 0 27 0 28 0 3 26 0 26 0 27 0 4 25 0 25 0 26 0 5 24 0 24 0 30 2 6 23 0 23 0 29 2 7 22 0 22 0 28 2 8 21 0 21 0 27 2 9 20 0 20 0 26 2 10 19 0 19 0 25 2 11 18 0 18 0 24 2 12 17 0 17 0 23 2 13 16 0 16 0 22 2 14 15 0 15 0 21 2 15 14 0 14 0 20 2 16 13 0 13 0 19 2 17 12 0 34 13 18 2 18 11 0 33 13 17 2 19 10 0 32 13 16 2 20 9 0 31 13 15 2 21 8 0 30 13 14 2 22 7 0 29 13 13 2 23 55 26 28 13 12 2 24 54 26 27 13 11 2 25 53 26 26 13 10 2 26 52 26 25 13 9 2
NOAA EcoCasting 2011 92
© 2011 Office of STEM Education Partnerships, Northwestern University Investigation III: Bioaccumulation – Answer Key, Part 6 – 8 pages
0
10
20
30
40
50
60
0 10 20 30 40 50 60 70 80 90
1 4 7 10 13 16 19 22 25 28 31 34 37 40 43 46 49
Toxicity Units
Energy Units
Step (cumulative step)
Example Data 1
Energy Toxicity
27 51 26 24 13 8 2 28 50 26 23 13 7 2 29 49 26 22 13 6 2 30 48 26 21 13 5 2 31 47 26 20 13 4 2 32 46 26 19 13 3 2 33 45 26 18 13 2 2 34 44 26 17 13 47 19 35 43 26 16 13 46 19 36 42 26 15 13 45 19 37 85 48 14 13 44 19 38 42 32 13 13 43 19 39 41 32 12 13 42 19 40 40 32 11 13 41 19 41 39 32 10 13 40 19 42 38 32 9 13 39 19 43 37 32 8 13 38 19 44 36 32 7 13 62 32 45 35 32 6 13 61 32 46 34 32 5 13 66 36 47 33 32 4 13 65 36 48 32 32 3 13 64 36 49 31 32 2 13 63 36 50 30 32 1 13 62 36
NOAA EcoCasting 2011 93
© 2011 Office of STEM Education Partnerships, Northwestern University Investigation III: Bioaccumulation – Answer Key, Part 6 – 8 pages
0
2
4
6
8
10
12
14
0
5
10
15
20
25
30
35
40
1 4 7 10 13 16 19 22 25 28 31 34 37 40 43 46 49
Toxicity Units
Energy Units
Step (cumulative step)
Example Data 2
Energy Toxicity
0
5
10
15
20
25
30
35
40
0
10
20
30
40
50
60
70
1 4 7 10 13 16 19 22 25 28 31 34 37 40 43 46 49
Toxicity Units
Energy Units
Step (cumulative step)
Example Data 3
Energy Toxicity

NOAA EcoCasting 2011 94
© 2011 Office of STEM Education Partnerships, Northwestern University Investigation III: Bioaccumulation – Answer Key, Part 6 – 8 pages
Q4. When the slope is horizontal for toxicity what is occurring with energy? Explain and support your answer with specific data.
The slope is horizontal on toxicity when the fish is losing energy due to basic body functioning (metabolism). However, the toxin is persistent, therefore the toxicity level remains constant while the bass’s energy level decreases.
The Community
Periphyton crayfish Smallmouth bass
Step Avg. Tox. level
Avg. Energy level
Tox/ energy
Avg. Tox. level
Avg. Energy level
Tox/ energy
Avg. Tox. level
Avg. Energy level
Tox/ energy
0 2.0 4.9 0.41 0 3.6 0 0 19.3 0 20 2.0 5.1 0.39 16.3 29 0.56 7.3 15.7 0.46 40 1.9 4.9 0.38 22.3 36.7 0.61 28.8 38.8 0.74 60 1.7 5.0 0.34 19.1 25 0.76 58 71 0.82
Q5. Compare the three scatter plots from steps 11, 21 and 29. Which has the steepest slope
and which has the shallowest? Use data from graph and tables to show.
The line for the smallmouth bass shows the steepest slope because POPs biomagnify as they move through the food chain. Smallmouth bass are at the 3rd trophic level in this ecosystem, and so they undergo significant biomagnification. Crayfish exist at the second trophic level and so the slope of this line is shallower than the smallmouth bass. Since the periphyton are on the first trophic level, the line is nearly flat. These patterns show an increasing accumulation of contaminant burden from food in this ecosystem.
0 0.1 0.2 0.3 0.4 0.5 0.6 0.7 0.8 0.9
0 20 40 60 80
Toxicity per energy
Steps (number)
Toxicity per Energy versus Time
periphyton
cray�ish
small mouth bass
NOAA EcoCasting 2011 95
© 2011 Office of STEM Education Partnerships, Northwestern University Investigation III: Bioaccumulation – Student Guide, Part 1 – 1 page
Name ________________________________________Date ________________ Class ____________________
Investigation III: Bioaccumulation Part 1: What do I know about pollutants? In the space below circle T for true or F for false
Question
T or F 1. What we eat/drink we eventually digest and then excrete.
T or F 2. Contaminants stay close to where they are spilled.
T or F 3. Rachel Carson started the environmental movement when she
observed a particularly “Silent Spring”.
T or F 4. The most common exposure route for a toxin in humans is
contaminated drinking water.
T or F 5. The “Dirty Dozen” was a movie in the early 1970’s starring Clint
Eastwood.
T or F 6. We are exposed to chemicals in the womb before we are born.
T or F 7. If we do not wash our hands before we eat we are exposed to
chemicals.
T or F 8. PCBs are a group of man-‐made chemicals.
T or F 9. PCBs are used in plastic water bottles and, when discarded, end
up in the Great Lakes system.
T or F 10. Longer-‐lived animals have greater bioaccumulation.
T or F 11. PCBs can be absorbed through the skin into an organism

NOAA EcoCasting 2011 97
© 2011 Office of STEM Education Partnerships, Northwestern University Investigation III: Bioaccumulation – Student Guide, Part 2 – 2 pages
Investigation III: Bioaccumulation Part 2: What is POP (don’t you mean soda)?
From the 1870s through much of the 20th century, Calumet Harbor, home to the ecosystem you are learning about, was one of the busiest ports in the Great Lakes. Steel mills, oil refineries and meat packing plants were a few of the big industries that established major facilities in what was to become Chicago’s South Side. Chicago became a major international port in 1959 with the opening of the St. Lawrence Seaway, because ships could finally navigate all the way inland from the Atlantic Ocean.
Waste from these industries and Chicago’s sewers flowed freely into the Calumet
River system, which polluted the local environment and contaminated Chicago’s drinking water. Though environmental regulations now prohibit the dumping of industrial waste, the pollutants from earlier in this century still persist in the sediments of Calumet Harbor and Lake Michigan.
Today you will read “Persistent Organic Pollutants: A Global Issue, A Global
Response,” which was published by the U.S. Environmental Protection Agency (EPA publication EPA160-‐F-‐02-‐001). This reading will familiarize you with the environmental and human health impacts of persistent organic pollutants (POPs). You will also learn about the current legal and scientific actions taken by the United States and other countries to address these pollutants.
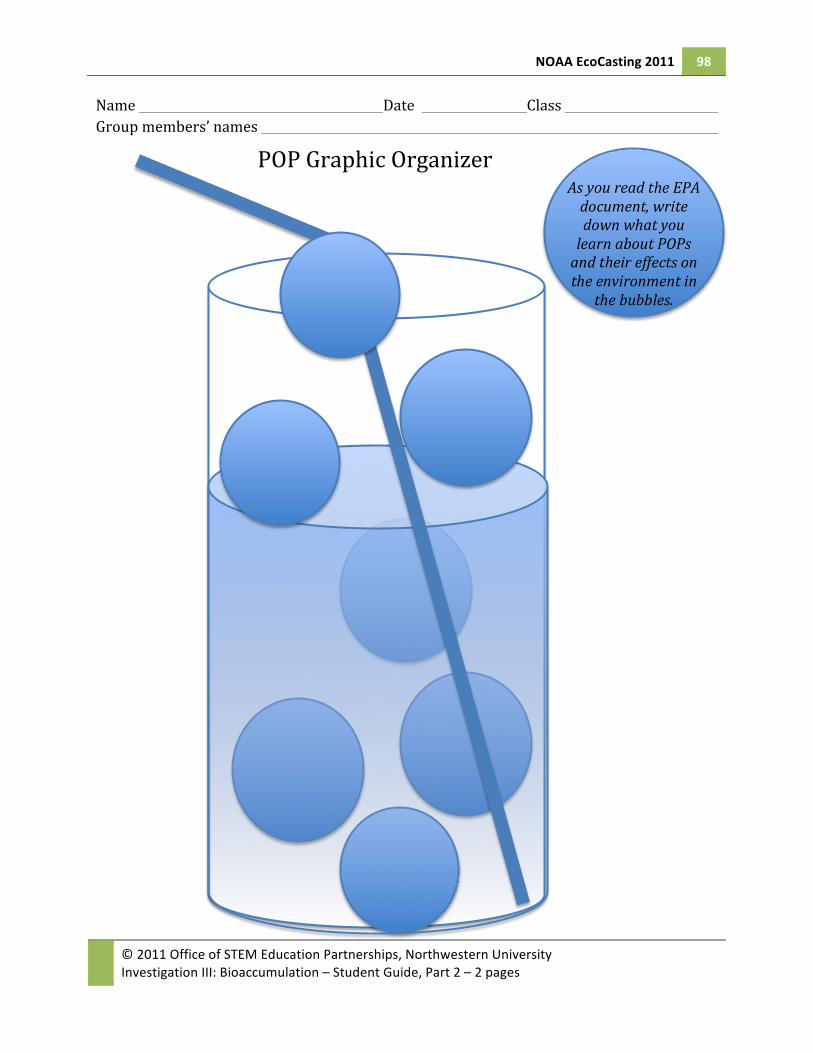
Use the following graphic organizer to identify important information as you read.
Write what you learn in the bubbles in the glass of soda. In particular, read carefully the following sections:
• “What are POPs?” • “What Domestic Actions Have Been Taken to Control POPs?” • “How Do POPs Affect People and Wildlife?” • “The Great Lakes: A Story of Trials and Triumphs”
You can read the document online at
http://www.epa.gov/international/toxics/pop.html or you can download it from: http://www.epa.gov/oia/toxics/brochure.html.
NOAA EcoCasting 2011 98
© 2011 Office of STEM Education Partnerships, Northwestern University Investigation III: Bioaccumulation – Student Guide, Part 2 – 2 pages
Name Date Class Group members’ names
POP Graphic Organizer
As you read the EPA document, write down what you learn about POPs and their effects on the environment in
the bubbles.

NOAA EcoCasting 2011 99
© 2011 Office of STEM Education Partnerships, Northwestern University Investigation III: Bioaccumulation – Student Guide, Part 3 – 3 pages
Investigation III: Bioaccumulation Part 3: How are we exposed to chemicals?
Every day, we come into contact with chemicals such as water, oxygen, nitrogen, fructose etc. If we come into contact with these substances for a short time – less than 14 days – we call this exposure “acute.” If, however, our exposure lasts over a year it is called “chronic.” Anything in between is called “intermediate.”
Most of these substances have no adverse health effects, but some do. A toxin is a substance that has adverse acute (immediate) or chronic (long-‐term) health effects when it enters the body. Today, we will consider all the ways we expose ourselves to toxins.
For example, gasoline stations carry the following warning at the pump: “Avoid prolonged breathing of vapors as long term exposure to vapors has caused cancer in laboratory animals.” Merely spilling gasoline on your hand does not provide a pathway for its toxins to enter your body. Gasoline must volatilize (vaporize) and be inhaled into your lungs for the exposure pathway to be complete. In this activity, you will work in groups of 4 to brainstorm routes of chemical exposure to humans using examples from everyday life. Procedure
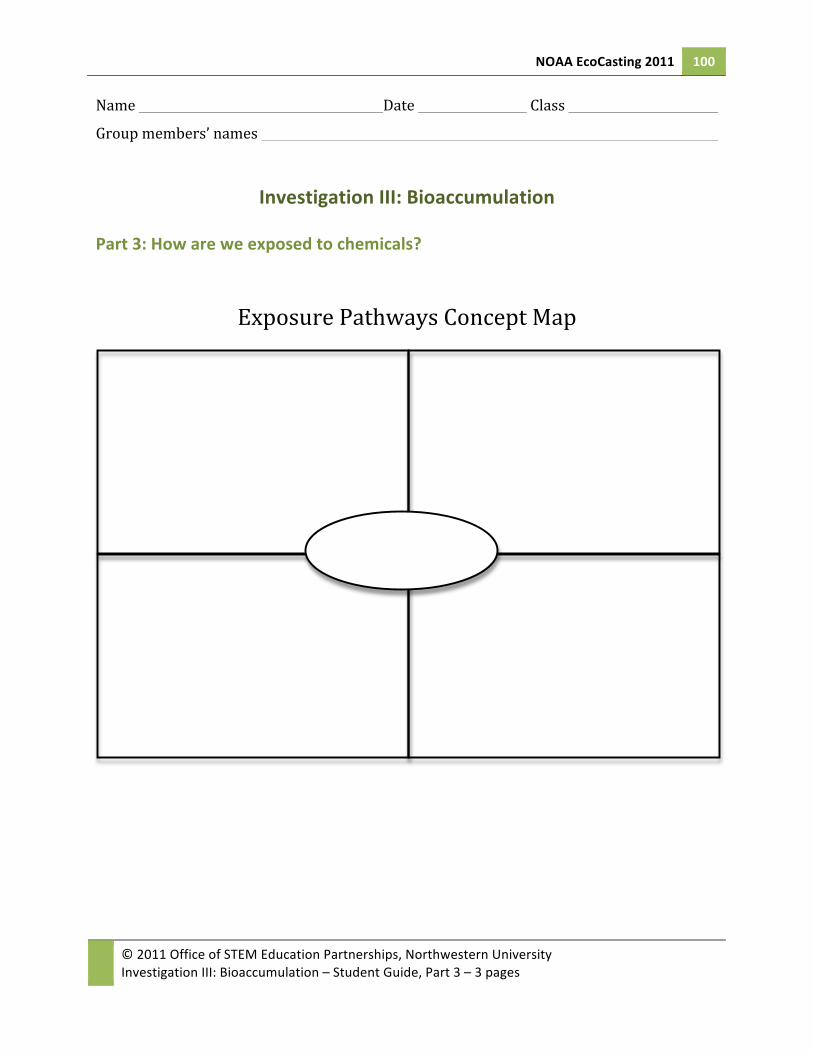
1. Write your name in the center oval of your map. 2. In each of the four squares on your map, write one way in which you think humans
are exposed to chemicals in their environment. 3. Once everyone in your group has finished, pass your map to your neighbor on your
left. Repeat this procedure until everyone in the group has read each other’s answers.
4. As a group, decide which activities could be grouped together. Use the highlighters provided to categorize the activities.
5. Once you think of three categories of activities, write them on the board at the front of the room under your group name.
6. Answer the questions on the following page.
NOAA EcoCasting 2011 100
© 2011 Office of STEM Education Partnerships, Northwestern University Investigation III: Bioaccumulation – Student Guide, Part 3 – 3 pages
Name Date Class
Group members’ names
Investigation III: Bioaccumulation Part 3: How are we exposed to chemicals?
Exposure Pathways Concept Map

NOAA EcoCasting 2011 101
© 2011 Office of STEM Education Partnerships, Northwestern University Investigation III: Bioaccumulation – Student Guide, Part 3 – 3 pages
Once the class has shared their brainstorming, complete the following:
Q1. Write the three exposure pathways for humans by your class.
______________________________ _________________________________ _____________________________
Q2. Now imagine you’re an organism living in a beautiful lake. Would your exposure pathways change?
Q3. Do exposure pathways change according to what type of aquatic organism you are: forage fish, a mussel, or a top predator? Think about where each one lives, what they eat, how they breathe, etc.
Q4. List the generalized exposure pathways for an aquatic organism.
_____________________________________________________________________________________________________


NOAA EcoCasting 2011 103
© 2011 Office of STEM Education Partnerships, Northwestern University Investigation III: Bioaccumulation – Student Guide, Part 4 – 4 pages
Name Date Class
Investigation III: Bioaccumulation Part 4: What is a PCB?
In every workplace and home there are chemicals. In an office, it is common to have toners for the copier or cleaners for equipment. In a hair salon, there are hair dyes and chemical straighteners. Auto shops have coolants, oils, degreasers and gasoline. In your home, there may be cleaning fluids, pesticides, or herbicides. Each of these chemicals has potential adverse health effects. Some of them are immediately (acutely) apparent, like a chemical burn or shortness of breath, or it might take years for these effects to appear, as is the case with cancer.
In order to protect workers’ safety, the federal government passed a law in 1983 that created the Occupational Health and Safety Administration (OHSA). As part of this law, a Material Safety Data Sheet (MSDS) is “required for all shipments of hazardous chemicals leaving the manufacturer’s workplace and from all importers of such on all shipments,” as well as all “distributors and employers.”
The OHSA-‐formatted MSDS requires identification of the substance, as listed on the product label, followed by:
I. Manufacturer’s Name and Pertinent Information II. Hazardous Ingredients/Identity Information III. Physical/Chemical Characteristics IV. Fire and Explosion Hazard Date V. Reactivity Data VI. Health Hazard Data VII. Precautions for Safe Handling and Use VIII. Control Measures
It is very easy to recognize the immediate adverse health effects of many chemicals;
however, long-‐term health effects can be easily dismissed. Think about smoking! Many people choose to smoke knowing that cancer or emphysema may occur years later. Someday, you will choose a career and/or start a family. It is very important to know the consequences of exposure to various substances so you can protect yourself and your family.

NOAA EcoCasting 2011 104
© 2011 Office of STEM Education Partnerships, Northwestern University Investigation III: Bioaccumulation – Student Guide, Part 4 – 4 pages
Today you will read a citizen’s guide developed by the U.S. Environmental Protection Agency (EPA). The purpose of this guide is to inform the general public of what PCBs are, and where and when they are used. Calumet Harbor in Chicago, IL has been heavily polluted with PCBs. As you have learned in this unit, toxins like PCBs are easily absorbed by aquatic organisms through feeding and direct exposure in their environment. Some of these organisms, like the smallmouth bass, are important sport fish and are eaten by humans. The EPA guide will detail what we now know about how PCBs can affect human health.
You will also do an internet search for a MSDS. As you read, complete the following questions and graphic organizer. Access the following website site and answer the questions below. http://www.epa.gov/epawaste/hazard/tsd/pcbs/pubs/about.htm
Q1. What are polychlorinated biphenyls (PCBs)?
Q2. Why were they once a desirable substance?
Q3. Name some locations where PCBs may exist in your community:
Q4. What is a common trade name for PCBs?
Q5. How might PCBs be released?

NOAA EcoCasting 2011 105
© 2011 Office of STEM Education Partnerships, Northwestern University Investigation III: Bioaccumulation – Student Guide, Part 4 – 4 pages
Health Effects of PCB exposure Go to: http://www.epa.gov/epawaste/hazard/tsd/pcbs/pubs/effects.htm#Repro
Endocrine Effect
Health Effects
Neurological Effect
Reproductive Effect
Immune Effect
NOAA EcoCasting 2011 106
© 2011 Office of STEM Education Partnerships, Northwestern University Investigation III: Bioaccumulation – Student Guide, Part 4 – 4 pages
Use the internet to search for 2 Material Safety Data Sheets for polychlorinated biphenyls (PCBs). Read the materials and attach them to this sheet. Then answer the following questions:
Q6. What are other names for polychlorinated biphenyls?
Q7. What are common uses of PCBs?
Q8. What are the sources, routes, and types of exposure to PCBs?
Q9. What are the effects of exposure to PCBs? (note if these are different from what the EPA states)
Q10. What are the safety guidelines for exposure to PCBs?
NOAA EcoCasting 2011 107
© 2011 Office of STEM Education Partnerships, Northwestern University Investigation III: Bioaccumulation – Student Guide, Part 5 – 7 pages
Name Date Class
Investigation III: Bioaccumulation Part 5: Modeling Bioaccumulation and Biomagnification with Candy What did you eat for dinner last night? Most of the food we eat is used up by our bodies for energy and growth, and some of it is excreted as waste. But this doesn’t account for everything that enters our bodies. Sometimes there are chemicals present in our food, like pesticides from the farm on which it was grown, or compounds from the soil, that our bodies can’t use up or get rid of. These substances are stored in our bodies and their amount increases over time. The same happens to organisms in the wild that live in contaminated environments. In today’s activity, you will model the bioaccumulation of PCBs in the freshwater organisms of the Calumet Harbor ecosystem. As you proceed through the activity, observe how PCBs biomagnify as they travel through the food web. Materials You will be provided with the following materials:
• Food chain diagrams • 25 Skittles or M&Ms (each piece of candy represents 1 unit of caloric energy) per
group • 50 plastic beads (each bead represents 1 unit of PCB toxin) per group • 1 small plate or napkin
Instructions Modeling bioaccumulation in a single periphyton. 1. Place one candy (1 unit of caloric energy) on one plate or napkin. This will be day zero
on your table. Please note at this time PCB contamination has not entered the system. Day 0 has been filled in for you.
2. Have the periphyton uptake energy. You will model this by placing 10 more caloric units (candies) on the plate or napkin.
3. The periphyton does not turn all of the caloric units into biomass it respires. When the periphyton respires, it will lose 90% units of caloric energy (remove 9 candies from the periphyton square). The 10% of caloric energy (a single candy) remaining is converted into biomass. Fill out “Day 1” of the table.
NOAA EcoCasting 2011 108
© 2011 Office of STEM Education Partnerships, Northwestern University Investigation III: Bioaccumulation – Student Guide, Part 5 – 7 pages
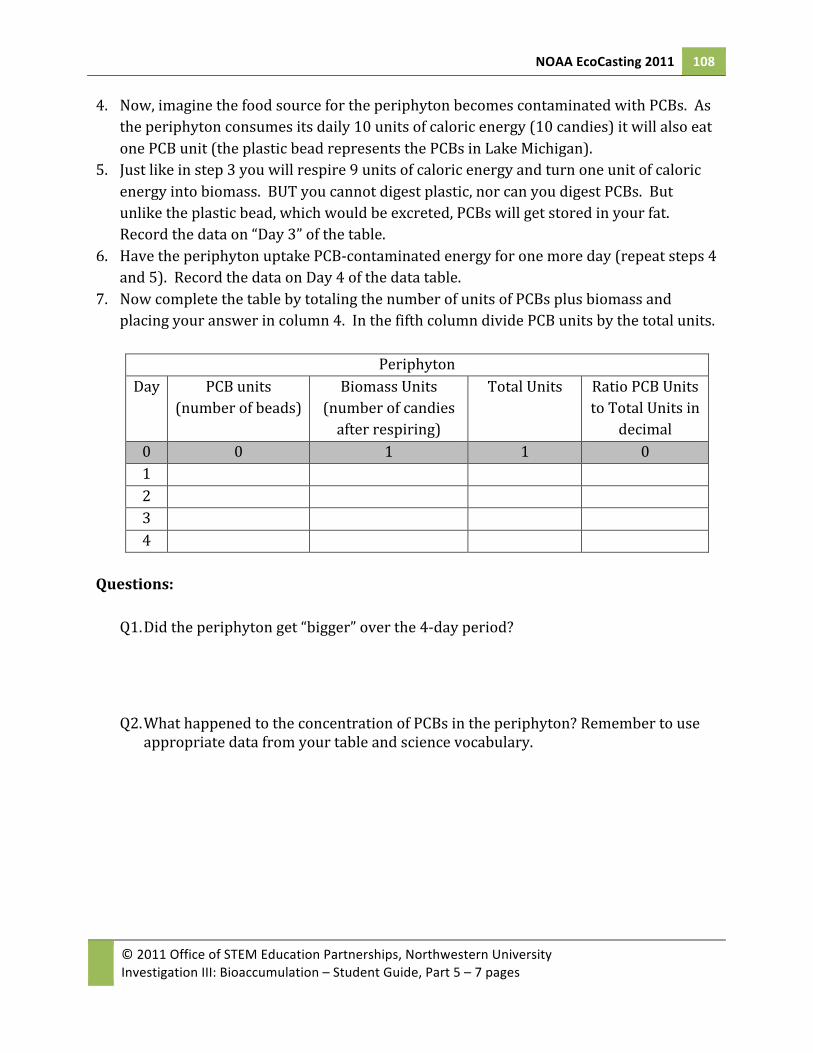
4. Now, imagine the food source for the periphyton becomes contaminated with PCBs. As the periphyton consumes its daily 10 units of caloric energy (10 candies) it will also eat one PCB unit (the plastic bead represents the PCBs in Lake Michigan).
5. Just like in step 3 you will respire 9 units of caloric energy and turn one unit of caloric energy into biomass. BUT you cannot digest plastic, nor can you digest PCBs. But unlike the plastic bead, which would be excreted, PCBs will get stored in your fat. Record the data on “Day 3” of the table.
6. Have the periphyton uptake PCB-‐contaminated energy for one more day (repeat steps 4 and 5). Record the data on Day 4 of the data table.
7. Now complete the table by totaling the number of units of PCBs plus biomass and placing your answer in column 4. In the fifth column divide PCB units by the total units.
Periphyton
Day PCB units (number of beads)
Biomass Units (number of candies after respiring)
Total Units Ratio PCB Units to Total Units in
decimal 0 0 1 1 0 1 2 3 4
Questions:
Q1. Did the periphyton get “bigger” over the 4-‐day period?
Q2. What happened to the concentration of PCBs in the periphyton? Remember to use appropriate data from your table and science vocabulary.
NOAA EcoCasting 2011 109
© 2011 Office of STEM Education Partnerships, Northwestern University Investigation III: Bioaccumulation – Student Guide, Part 5 – 7 pages
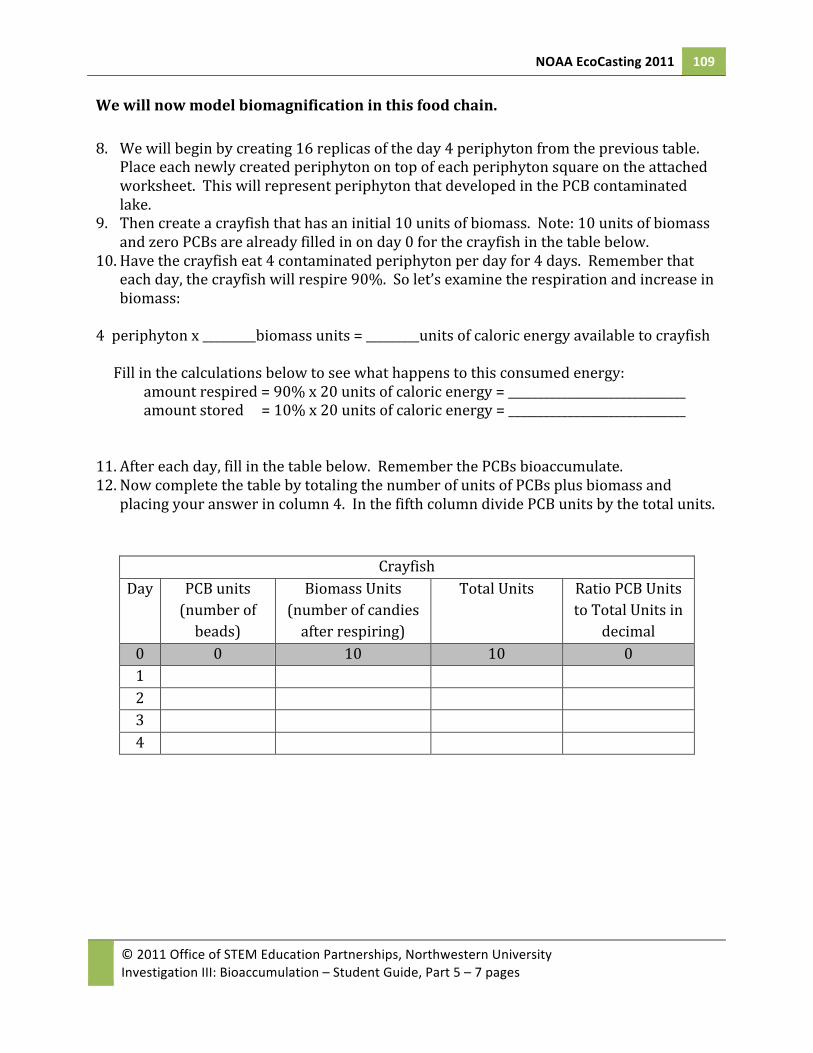
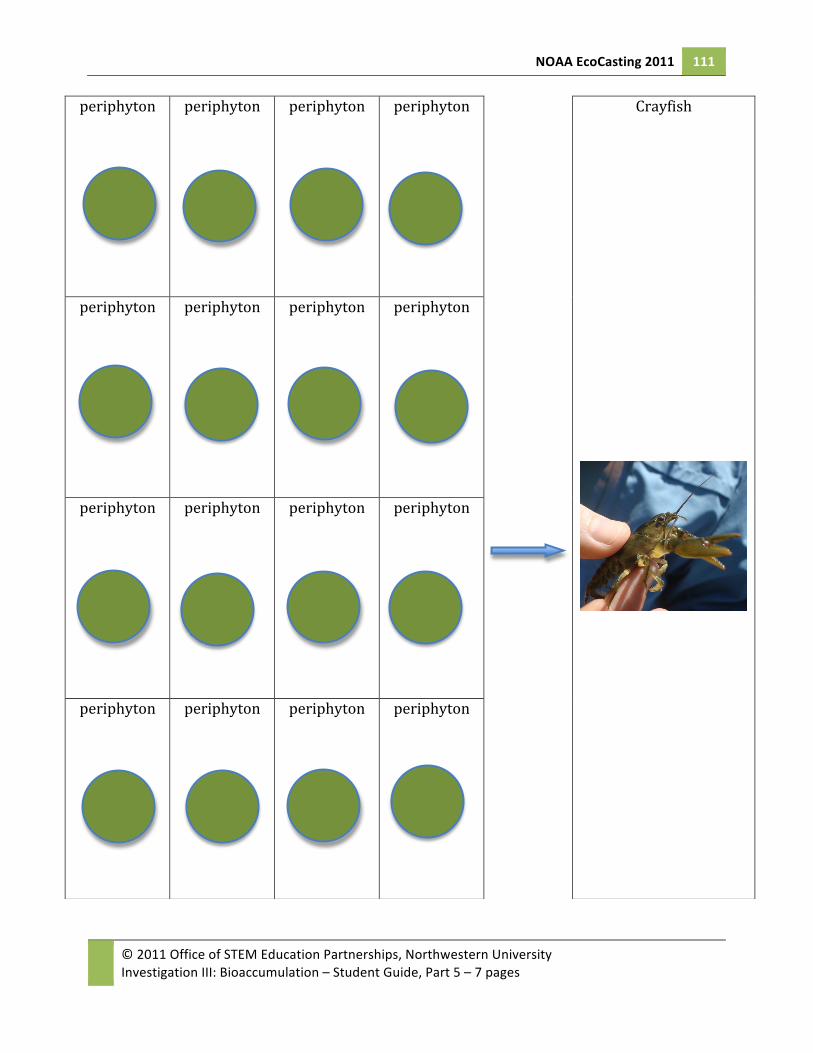
We will now model biomagnification in this food chain. 8. We will begin by creating 16 replicas of the day 4 periphyton from the previous table.
Place each newly created periphyton on top of each periphyton square on the attached worksheet. This will represent periphyton that developed in the PCB contaminated lake.
9. Then create a crayfish that has an initial 10 units of biomass. Note: 10 units of biomass and zero PCBs are already filled in on day 0 for the crayfish in the table below.
10. Have the crayfish eat 4 contaminated periphyton per day for 4 days. Remember that each day, the crayfish will respire 90%. So let’s examine the respiration and increase in biomass:
4 periphyton x _________biomass units = _________units of caloric energy available to crayfish Fill in the calculations below to see what happens to this consumed energy: amount respired = 90% x 20 units of caloric energy = ______________________________ amount stored = 10% x 20 units of caloric energy = ______________________________ 11. After each day, fill in the table below. Remember the PCBs bioaccumulate. 12. Now complete the table by totaling the number of units of PCBs plus biomass and
placing your answer in column 4. In the fifth column divide PCB units by the total units.
Crayfish
Day PCB units (number of beads)
Biomass Units (number of candies after respiring)
Total Units Ratio PCB Units to Total Units in
decimal 0 0 10 10 0 1 2 3 4

NOAA EcoCasting 2011 110
© 2011 Office of STEM Education Partnerships, Northwestern University Investigation III: Bioaccumulation – Student Guide, Part 5 – 7 pages
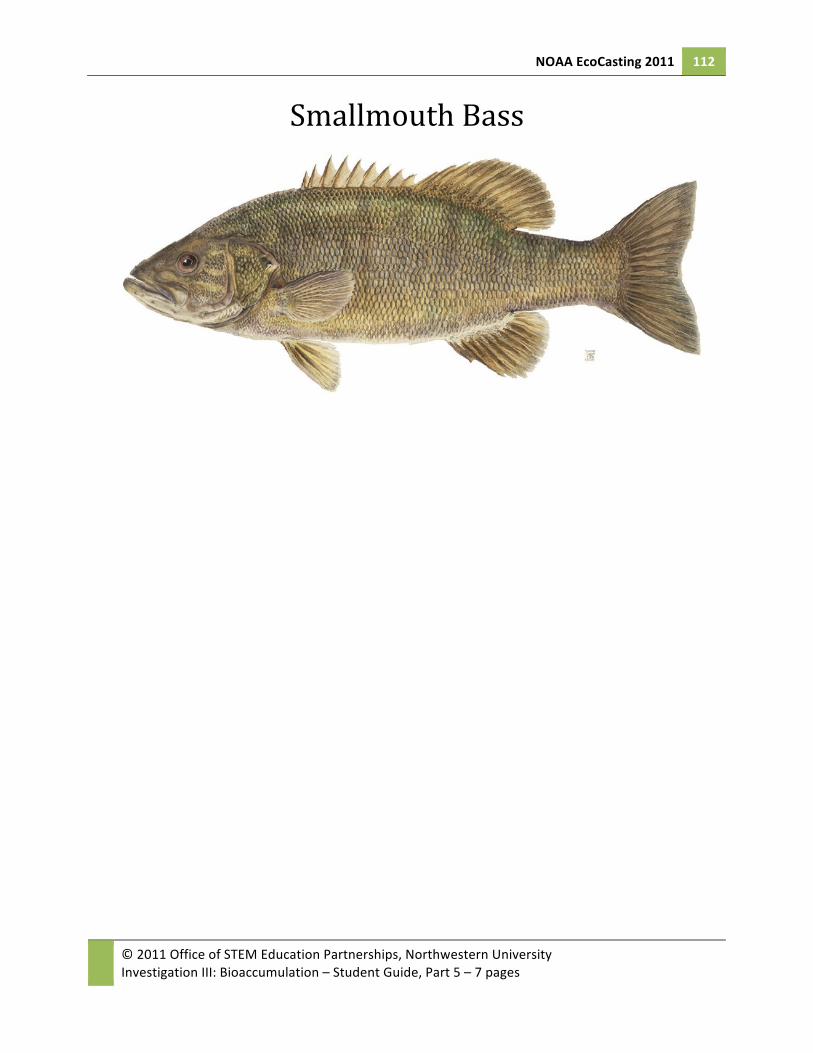
13. Wait until every group is complete. Now it is time to feed the smallmouth bass. For each day, two groups at a time will bring up their crayfish. The teacher will feed them to a smallmouth bass that initially has 20 units of biomass.
2 crayfish x ______biomass units = ______units of caloric energy available to smallmouth bass Fill in the calculations below to see what happens to this consumed energy:
amount respired = 90% x 20 units of caloric energy = ______________________________ amount stored = 10% x 20 units of caloric energy = ______________________________
14. Follow along in the table below. 15. Now complete the table by totaling the number of units of PCBs plus biomass and
placing your answer in column 4. In the fifth column divide PCB units by the total units.
Smallmouth bass Day PCB units
(number of beads)
Biomass Units (number of candies after respiring)
Total Units Ratio PCB Units to Total Units in
decimal 0 0 20 20 0 1 2 3 4
Questions:
Q3. Using your previous two models, what do you predict will happen to the PCB concentration in the smallmouth bass after ten days of eating this way?
Q4. When we fed the crayfish we assumed that the periphyton had equal amounts of contamination of PCBs. Do you think this happens in nature?
NOAA EcoCasting 2011 111
© 2011 Office of STEM Education Partnerships, Northwestern University Investigation III: Bioaccumulation – Student Guide, Part 5 – 7 pages
periphyton periphyton periphyton periphyton Crayfish
periphyton periphyton periphyton periphyton
periphyton periphyton periphyton periphyton
periphyton
periphyton periphyton periphyton
NOAA EcoCasting 2011 112
© 2011 Office of STEM Education Partnerships, Northwestern University Investigation III: Bioaccumulation – Student Guide, Part 5 – 7 pages
Smallmouth Bass
NOAA EcoCasting 2011 113
© 2011 Office of STEM Education Partnerships, Northwestern University Investigation III: Bioaccumulation – Student Guide, Part 5 – 7 pages
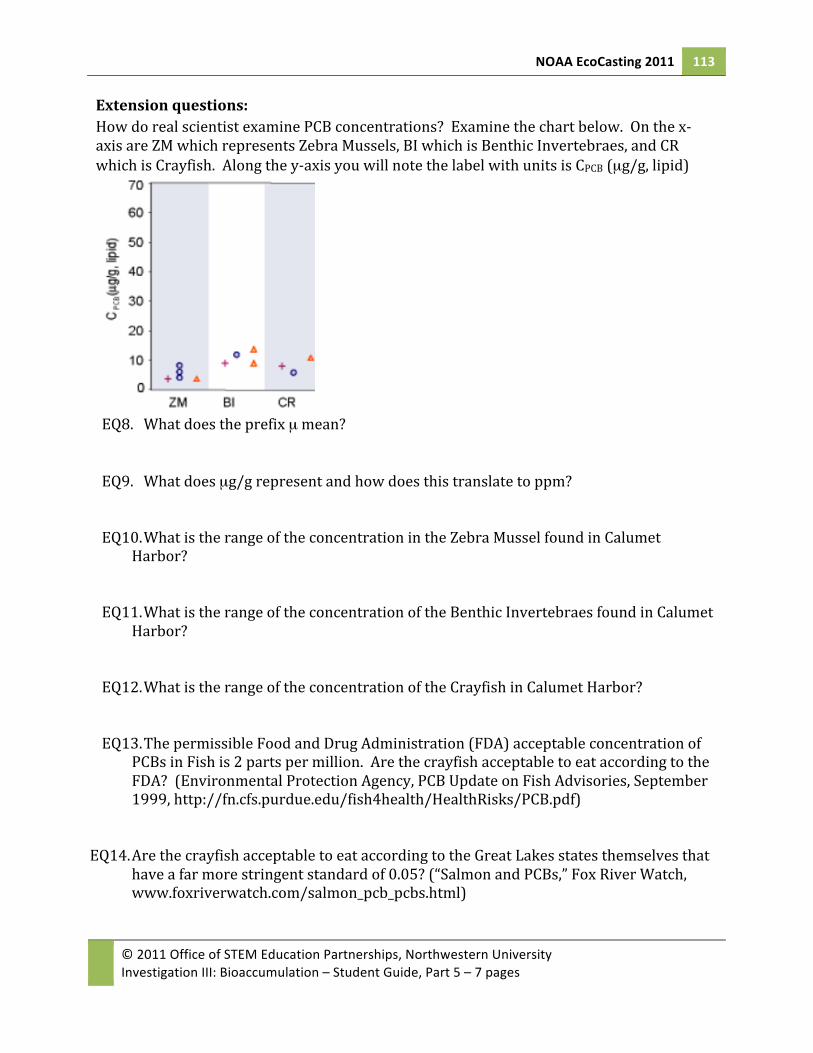
Extension questions: How do real scientist examine PCB concentrations? Examine the chart below. On the x-‐axis are ZM which represents Zebra Mussels, BI which is Benthic Invertebraes, and CR which is Crayfish. Along the y-‐axis you will note the label with units is CPCB (µg/g, lipid)
EQ8. What does the prefix µ mean?
EQ9. What does µg/g represent and how does this translate to ppm?
EQ10. What is the range of the concentration in the Zebra Mussel found in Calumet
Harbor? EQ11. What is the range of the concentration of the Benthic Invertebraes found in Calumet
Harbor? EQ12. What is the range of the concentration of the Crayfish in Calumet Harbor? EQ13. The permissible Food and Drug Administration (FDA) acceptable concentration of
PCBs in Fish is 2 parts per million. Are the crayfish acceptable to eat according to the FDA? (Environmental Protection Agency, PCB Update on Fish Advisories, September 1999, http://fn.cfs.purdue.edu/fish4health/HealthRisks/PCB.pdf)
EQ14. Are the crayfish acceptable to eat according to the Great Lakes states themselves that have a far more stringent standard of 0.05? (“Salmon and PCBs,” Fox River Watch, www.foxriverwatch.com/salmon_pcb_pcbs.html)

NOAA EcoCasting 2011 115
© 2011 Office of STEM Education Partnerships, Northwestern University Investigation III: Bioaccumulation – Student Guide, Part 6 – 9 pages
Name ____________________________________________________ Date ________________ Class ________________
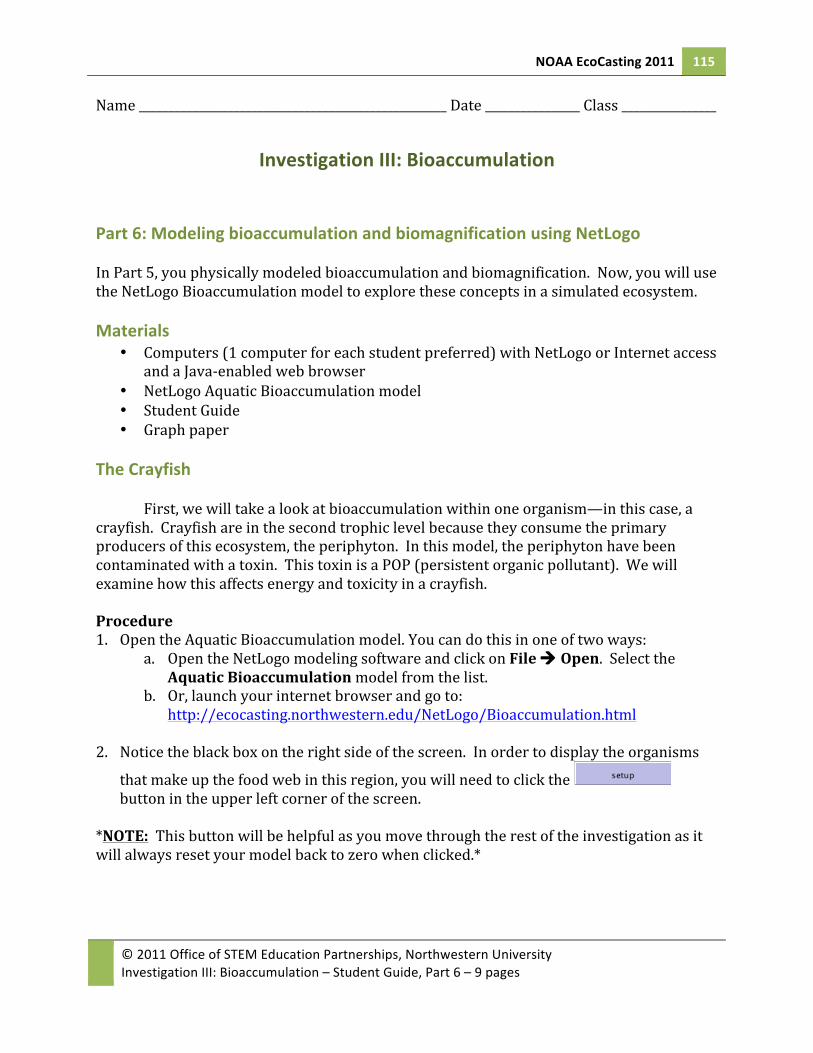
Investigation III: Bioaccumulation Part 6: Modeling bioaccumulation and biomagnification using NetLogo In Part 5, you physically modeled bioaccumulation and biomagnification. Now, you will use the NetLogo Bioaccumulation model to explore these concepts in a simulated ecosystem. Materials
• Computers (1 computer for each student preferred) with NetLogo or Internet access and a Java-‐enabled web browser
• NetLogo Aquatic Bioaccumulation model • Student Guide • Graph paper
The Crayfish
First, we will take a look at bioaccumulation within one organism—in this case, a crayfish. Crayfish are in the second trophic level because they consume the primary producers of this ecosystem, the periphyton. In this model, the periphyton have been contaminated with a toxin. This toxin is a POP (persistent organic pollutant). We will examine how this affects energy and toxicity in a crayfish. Procedure 1. Open the Aquatic Bioaccumulation model. You can do this in one of two ways:
a. Open the NetLogo modeling software and click on File à Open. Select the Aquatic Bioaccumulation model from the list.
b. Or, launch your internet browser and go to: http://ecocasting.northwestern.edu/NetLogo/Bioaccumulation.html
2. Notice the black box on the right side of the screen. In order to display the organisms
that make up the food web in this region, you will need to click the button in the upper left corner of the screen.
*NOTE: This button will be helpful as you move through the rest of the investigation as it will always reset your model back to zero when clicked.*

NOAA EcoCasting 2011 116
© 2011 Office of STEM Education Partnerships, Northwestern University Investigation III: Bioaccumulation – Student Guide, Part 6 – 9 pages
When the data loads, your model should look like this:
3. Click . 4. Right-‐click (ctrl+click on a Mac) on a crayfish. A pull down menu will pop up. (hint: for
this exercise, select a crayfish near a lot of periphyton but not near a smallmouth bass.) 5. Scroll down to the bottom of the pull down menu and select “a-‐crayfish ####”. A pop
up menu will open.
6. Write down the number of your crayfish here: (in this example, 1357)
NOAA EcoCasting 2011 117
© 2011 Office of STEM Education Partnerships, Northwestern University Investigation III: Bioaccumulation – Student Guide, Part 6 – 9 pages
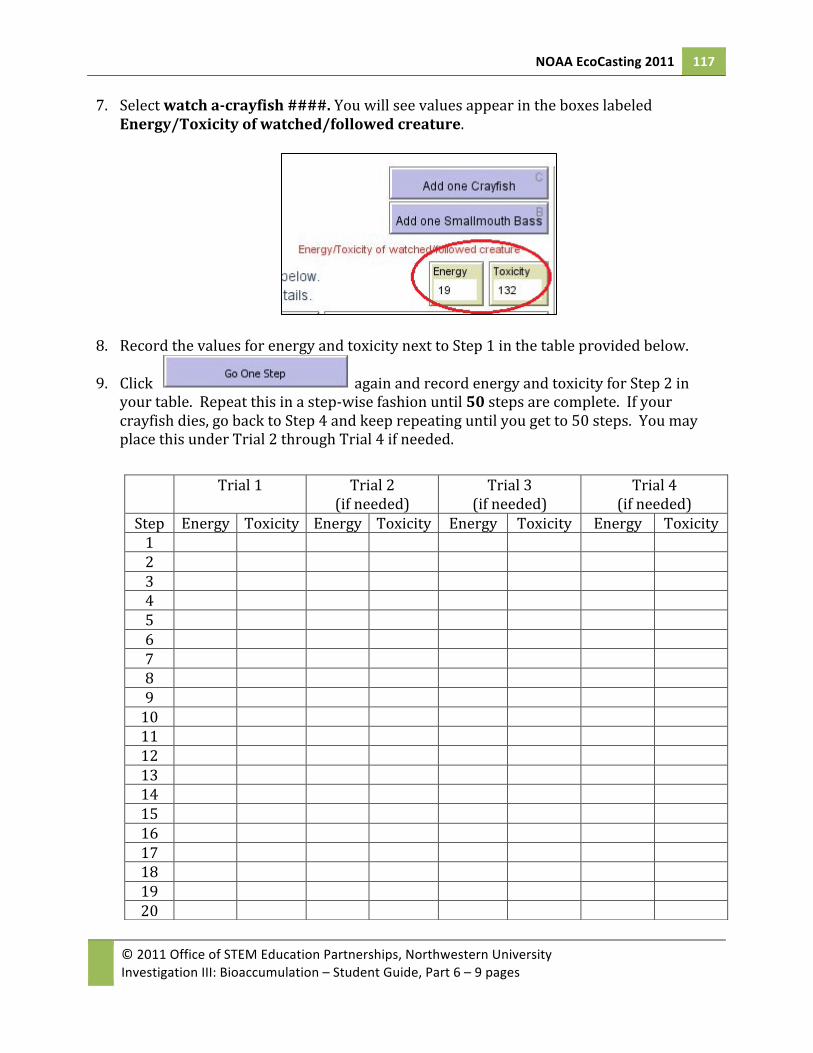
7. Select watch a-‐crayfish ####. You will see values appear in the boxes labeled Energy/Toxicity of watched/followed creature.
8. Record the values for energy and toxicity next to Step 1 in the table provided below.
9. Click again and record energy and toxicity for Step 2 in your table. Repeat this in a step-‐wise fashion until 50 steps are complete. If your crayfish dies, go back to Step 4 and keep repeating until you get to 50 steps. You may place this under Trial 2 through Trial 4 if needed.
Trial 1 Trial 2 (if needed)
Trial 3 (if needed)
Trial 4 (if needed)
Step Energy Toxicity Energy Toxicity Energy Toxicity Energy Toxicity 1 2 3 4 5 6 7 8 9 10 11 12 13 14 15 16 17 18 19 20

NOAA EcoCasting 2011 118
© 2011 Office of STEM Education Partnerships, Northwestern University Investigation III: Bioaccumulation – Student Guide, Part 6 – 9 pages
Analysis 10. On a sheet of graph paper, create a plot of step (x-‐axis) versus energy (left y-‐axis) and
on the same graph plot step (x-‐axis) versus toxicity (right y-‐axis).
21 22 23 24 25 26 27 28 29 30 31 32 33 34 35 36 37 38 39 40 41 42 43 44 45 46 47 48 49 50

NOAA EcoCasting 2011 119
© 2011 Office of STEM Education Partnerships, Northwestern University Investigation III: Bioaccumulation – Student Guide, Part 6 – 9 pages
Questions: Before answering the following questions, form groups of four. Record your name and the names of your three group members in the name column in the table below. Names
Step in which crayfish had the most energy
Step in which crayfish had the most toxicity
Q1. Look at your step versus energy plot and those of your group members. Is there a
connection between step and energy? Explain your reasoning citing specific steps from your graph.
Q2. Look at your step versus toxicity plot and those of your group members. Is there a connection between step and toxicity? Explain your reasoning citing specific steps from your graph.
Q3. Use your data set to give a specific example of where bioaccumulation is occurring. Explain your reasoning citing specific steps from your graph.

NOAA EcoCasting 2011 120
© 2011 Office of STEM Education Partnerships, Northwestern University Investigation III: Bioaccumulation – Student Guide, Part 6 – 9 pages
The smallmouth bass Next, we will explore bioaccumulation at the third trophic level of this ecosystem by measuring toxin increase in the smallmouth bass. Procedure, continued
11. Click to reset your model.
12. Click . 13. Right-‐click (or ctrl+click on a Mac) on a smallmouth bass (hint: make sure it is near a
few crayfish). A pop-‐up menu will appear. 14. Scroll down to the bottom of the menu and select a-‐smallmouth_bass ####. A second
pop-‐up menu will appear. 15. Write the number of the smallmouth bass you selected here:
a-‐small-‐mouth-‐bass .
16. Select watch a-‐smallmouth_bass ####. Values will appear in the boxes labeled Energy/Toxicity of watched/followed creature.
17. Record the values for energy and toxicity next to Step 1 in the table provided on the next page.
18. Click again and record the new values for energy and toxicity next to Step 2 in your table. Repeat this in a step-‐wise fashion until 50 steps are complete in the table below. If your smallmouth bass dies go back to Step 13 and begin again.
Trial 1 Trial 2 (if needed)
Trial 3 (if needed)
Trial 4 (if needed)
Step Energy Toxicity Energy Toxicity Energy Toxicity Energy Toxicity 1 2 3 4 5 6 7 8 9 10 11

NOAA EcoCasting 2011 121
© 2011 Office of STEM Education Partnerships, Northwestern University Investigation III: Bioaccumulation – Student Guide, Part 6 – 9 pages
12 13 14 15 16 17 18 19 20 21 22 23 24 25 26 27 28 29 30 31 32 33 34 35 36 37 38 39 40 41 42 43 44 45 46 47 48 49 50
NOAA EcoCasting 2011 122
© 2011 Office of STEM Education Partnerships, Northwestern University Investigation III: Bioaccumulation – Student Guide, Part 6 – 9 pages
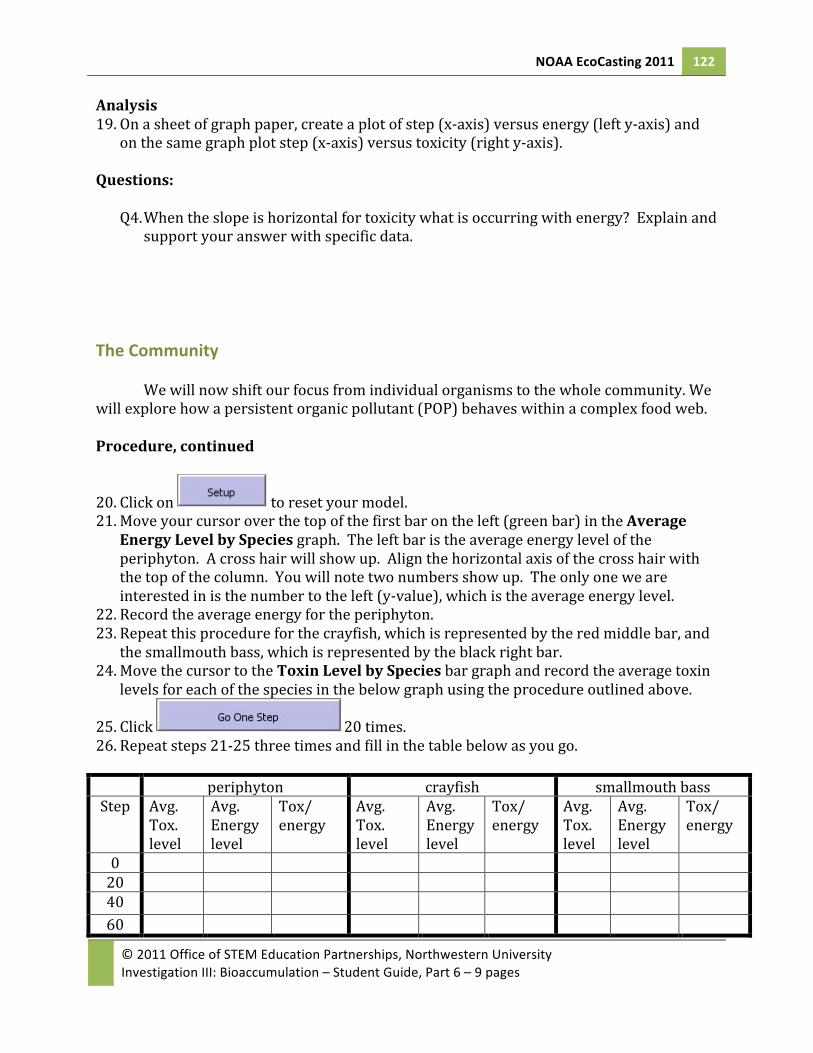
Analysis 19. On a sheet of graph paper, create a plot of step (x-‐axis) versus energy (left y-‐axis) and
on the same graph plot step (x-‐axis) versus toxicity (right y-‐axis). Questions:
Q4. When the slope is horizontal for toxicity what is occurring with energy? Explain and support your answer with specific data.
The Community
We will now shift our focus from individual organisms to the whole community. We will explore how a persistent organic pollutant (POP) behaves within a complex food web. Procedure, continued
20. Click on to reset your model. 21. Move your cursor over the top of the first bar on the left (green bar) in the Average
Energy Level by Species graph. The left bar is the average energy level of the periphyton. A cross hair will show up. Align the horizontal axis of the cross hair with the top of the column. You will note two numbers show up. The only one we are interested in is the number to the left (y-‐value), which is the average energy level.
22. Record the average energy for the periphyton. 23. Repeat this procedure for the crayfish, which is represented by the red middle bar, and
the smallmouth bass, which is represented by the black right bar. 24. Move the cursor to the Toxin Level by Species bar graph and record the average toxin
levels for each of the species in the below graph using the procedure outlined above.
25. Click 20 times. 26. Repeat steps 21-‐25 three times and fill in the table below as you go. periphyton crayfish smallmouth bass
Step Avg. Tox. level
Avg. Energy level
Tox/ energy
Avg. Tox. level
Avg. Energy level
Tox/ energy
Avg. Tox. level
Avg. Energy level
Tox/ energy
0 20 40 60

NOAA EcoCasting 2011 123
© 2011 Office of STEM Education Partnerships, Northwestern University Investigation III: Bioaccumulation – Student Guide, Part 6 – 9 pages
Analysis 27. On one graph, create a plot for step (x-‐ axis) versus average toxicity level per average
energy level energy (y-‐axis) for all three species. Questions:
Q5. Compare the three graphs you made in steps 10, 19, and 27. Which has the steepest slope and which has the shallowest? Use data from your graphs and tables to support your answer.

NOAA EcoCasting 2011 125
© 2011 Office of STEM Education Partnerships, Northwestern University Investigation III: Bioaccumulation – Student Response Sheet, Part 5 – 3 pages
Name Date Class
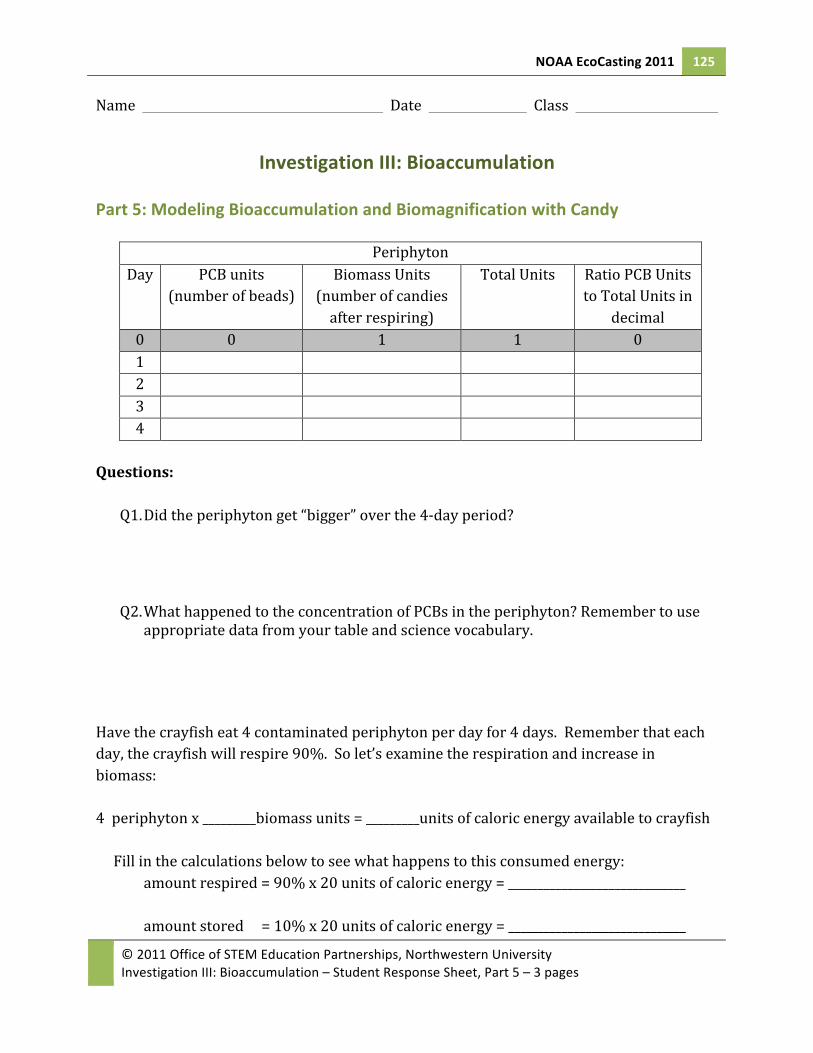
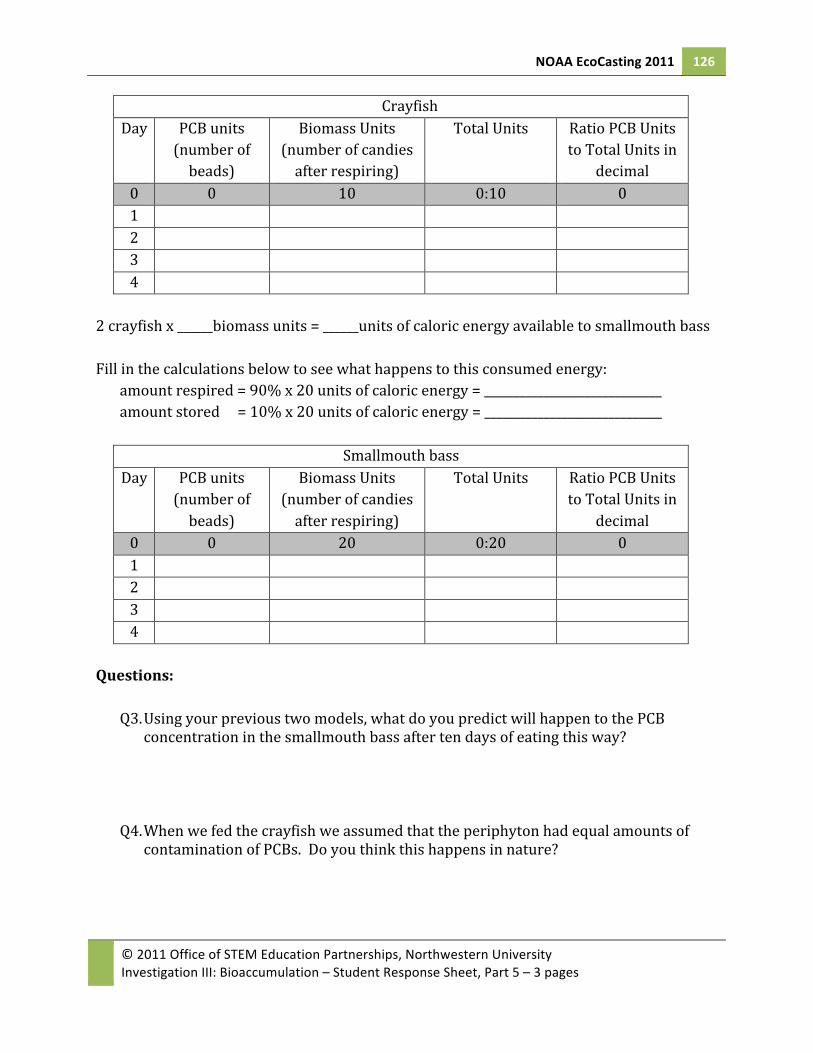
Investigation III: Bioaccumulation Part 5: Modeling Bioaccumulation and Biomagnification with Candy
Periphyton Day PCB units
(number of beads) Biomass Units
(number of candies after respiring)
Total Units Ratio PCB Units to Total Units in
decimal 0 0 1 1 0 1 2 3 4
Questions:
Q1. Did the periphyton get “bigger” over the 4-‐day period?
Q2. What happened to the concentration of PCBs in the periphyton? Remember to use appropriate data from your table and science vocabulary.
Have the crayfish eat 4 contaminated periphyton per day for 4 days. Remember that each day, the crayfish will respire 90%. So let’s examine the respiration and increase in biomass: 4 periphyton x _________biomass units = _________units of caloric energy available to crayfish Fill in the calculations below to see what happens to this consumed energy: amount respired = 90% x 20 units of caloric energy = ______________________________
amount stored = 10% x 20 units of caloric energy = ______________________________
NOAA EcoCasting 2011 126
© 2011 Office of STEM Education Partnerships, Northwestern University Investigation III: Bioaccumulation – Student Response Sheet, Part 5 – 3 pages
Crayfish Day PCB units
(number of beads)
Biomass Units (number of candies after respiring)
Total Units Ratio PCB Units to Total Units in
decimal 0 0 10 0:10 0 1 2 3 4
2 crayfish x ______biomass units = ______units of caloric energy available to smallmouth bass Fill in the calculations below to see what happens to this consumed energy:
amount respired = 90% x 20 units of caloric energy = ______________________________ amount stored = 10% x 20 units of caloric energy = ______________________________
Smallmouth bass
Day PCB units (number of beads)
Biomass Units (number of candies after respiring)
Total Units Ratio PCB Units to Total Units in
decimal 0 0 20 0:20 0 1 2 3 4
Questions:
Q3. Using your previous two models, what do you predict will happen to the PCB concentration in the smallmouth bass after ten days of eating this way?
Q4. When we fed the crayfish we assumed that the periphyton had equal amounts of contamination of PCBs. Do you think this happens in nature?

NOAA EcoCasting 2011 127
© 2011 Office of STEM Education Partnerships, Northwestern University Investigation III: Bioaccumulation – Student Response Sheet, Part 5 – 3 pages
Extension questions: EQ15. What does the prefix µ mean? EQ16. What does µg/g represent and how does this translate to ppm? EQ17. What is the range of the concentration in the Zebra Mussel found in Calumet
Harbor? EQ18. What is the range of the concentration of the Benthic Invertebraes found in Calumet
Harbor? EQ19. What is the range of the concentration of the Crayfish in Calumet Harbor? EQ20. The permissible Food and Drug Administration (FDA) acceptable concentration of
PCBs in Fish is 2 parts per million. Are the crayfish acceptable to eat according to the FDA? (Environmental Protection Agency, PCB Update on Fish Advisories, September 1999, http://fn.cfs.purdue.edu/fish4health/HealthRisks/PCB.pdf)
EQ21. Are the crayfish acceptable to eat according to the Great Lakes states themselves that
have a far more stringent standard of 0.05? (“Salmon and PCBs,” Fox River Watch, www.foxriverwatch.com/salmon_pcb_pcbs.html)


NOAA EcoCasting 2011 129
© 2011 Office of STEM Education Partnerships, Northwestern University Investigation III: Bioaccumulation – Student Response Sheet, Part 6 – 5 pages
Name ____________________________________________ Date ________________ Class ________________
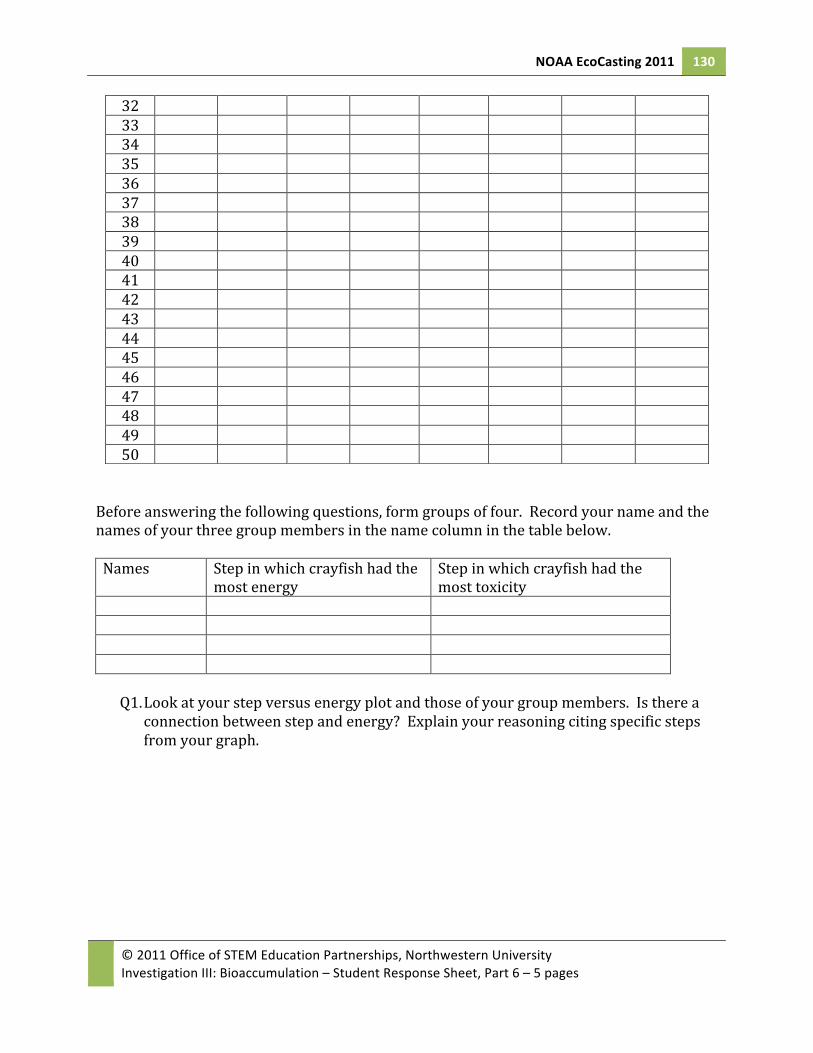
Investigation III: Bioaccumulation Part 6: Modeling bioaccumulation and biomagnification using NetLogo Record the energy level and toxicity of the crayfish you are watching in the table below.
Trial 1 Trial 2 (if needed)
Trial 3 (if needed)
Trial 4 (if needed)
Step Energy Toxicity Energy Toxicity Energy Toxicity Energy Toxicity 1 2 3 4 5 6 7 8 9 10 11 12 13 14 15 16 17 18 19 20 21 22 23 24 25 26 27 28 29 30 31
NOAA EcoCasting 2011 130
© 2011 Office of STEM Education Partnerships, Northwestern University Investigation III: Bioaccumulation – Student Response Sheet, Part 6 – 5 pages
Before answering the following questions, form groups of four. Record your name and the names of your three group members in the name column in the table below. Names
Step in which crayfish had the most energy
Step in which crayfish had the most toxicity
Q1. Look at your step versus energy plot and those of your group members. Is there a connection between step and energy? Explain your reasoning citing specific steps from your graph.
32 33 34 35 36 37 38 39 40 41 42 43 44 45 46 47 48 49 50

NOAA EcoCasting 2011 131
© 2011 Office of STEM Education Partnerships, Northwestern University Investigation III: Bioaccumulation – Student Response Sheet, Part 6 – 5 pages
Q2. Look at your step versus toxicity plot and those of your group members. Is there a connection between step and toxicity? Explain your reasoning citing specific steps from your graph.
Q3. Use your data set to give a specific example of where bioaccumulation is occurring.
Explain your reasoning citing specific steps from the graph you created in step 11.
Record the energy level and toxicity of the smallmouth bass you are following in the table below.
Trial 1 Trial 2 (if needed)
Trial 3 (if needed)
Trial 4 (if needed)
Step Energy Toxicity Energy Toxicity Energy Toxicity Energy Toxicity 1 2 3 4 5 6 7 8 9 10 11 12 13 14 15 16 17 18 19 20

NOAA EcoCasting 2011 132
© 2011 Office of STEM Education Partnerships, Northwestern University Investigation III: Bioaccumulation – Student Response Sheet, Part 6 – 5 pages
Q4. Look at the graph you drew for step 19. When the slope is horizontal what is occurring? Explain and support your answer with specific data.
21 22 23 24 25 26 27 28 29 30 31 32 33 34 35 36 37 38 39 40 41 42 43 44 45 46 47 48 49 50

NOAA EcoCasting 2011 133
© 2011 Office of STEM Education Partnerships, Northwestern University Investigation III: Bioaccumulation – Student Response Sheet, Part 6 – 5 pages
Record the average toxicity and energy levels for each species in your model below. periphyton crayfish smallmouth bass
Step Avg. Tox. level
Avg. Energy level
Tox/ energy
Avg. Tox. level
Avg. Energy level
Tox/ energy
Avg. Tox. level
Avg. Energy level
Tox/ energy
0 20 40 60
Q5. Compare the three graphs you made in steps 10, 19, and 27. Which has the steepest slope and which has the shallowest? Use data from your graphs and tables to support your answer.


