The Development Trend of the Confectionery
Market of the Russian Federation
N. Frolova*
Amur State University
Blagoveshchensk, Russian Federation
V. Pomozova
Kemerovo State University
Kemerovo, Russian Federation
Т. Kiseleva
Kemerovo State University
Kemerovo, Russian Federation
D. Pekov
Amur State Medical Academy
Blagoveshchensk, Russian Federation
N. Shkrabtak
Amur State University
Blagoveshchensk, Russian Federation
I. Reznichenko
Kemerovo State University
Kemerovo, Russian Federation
Abstract-Ensuring the production of high-quality and
competitive products is a strategic task of the national
economy, on which the pace of industrial development of the
country and its national prestige depend [1,2]. One of the
highly competitive industries in the Russian Federation is the
confectionery industry, which produces a large range of
confectionery products. In modern conditions of growing
competition, the confectionery market must be flexible and be
able to adapt to the consumer. To effectively regulate the
production of confectionery products, it is necessary to
analyze the production volumes of these products for a long
time, as well as to estimate consumption volumes. Today it is
very important for the Russian economy, in particular for the
enterprises themselves, to establish the level of exports and
imports of confectionery. Analyzed per capita consumption of
confectionery. The article presents an analysis of the Russian
confectionery market for 2013-2018. The main manufacturers
and types of their products are presented.
Keywords-market, confectionery, production dynamics,
export and import, Russian Federation
I. INTRODUCTION
The modern Russian confectionery market as an integral part of the food market is saturated with a high degree of competition.
At present, confectionery products in the domestic market are represented by two large segments: sugary and flour products. Berry products, caramel, dragee, chocolate, and products based on cocoa powder, candies, toffee, halva and oriental sweets like caramel and sweets are sugary. In turn, flour confectionery includes biscuits, gingerbread, waffles, muffins, rum babies, rolls, floury oriental sweets, cakes, pastries.
II. RESULTS AND ITS DISCUSSION
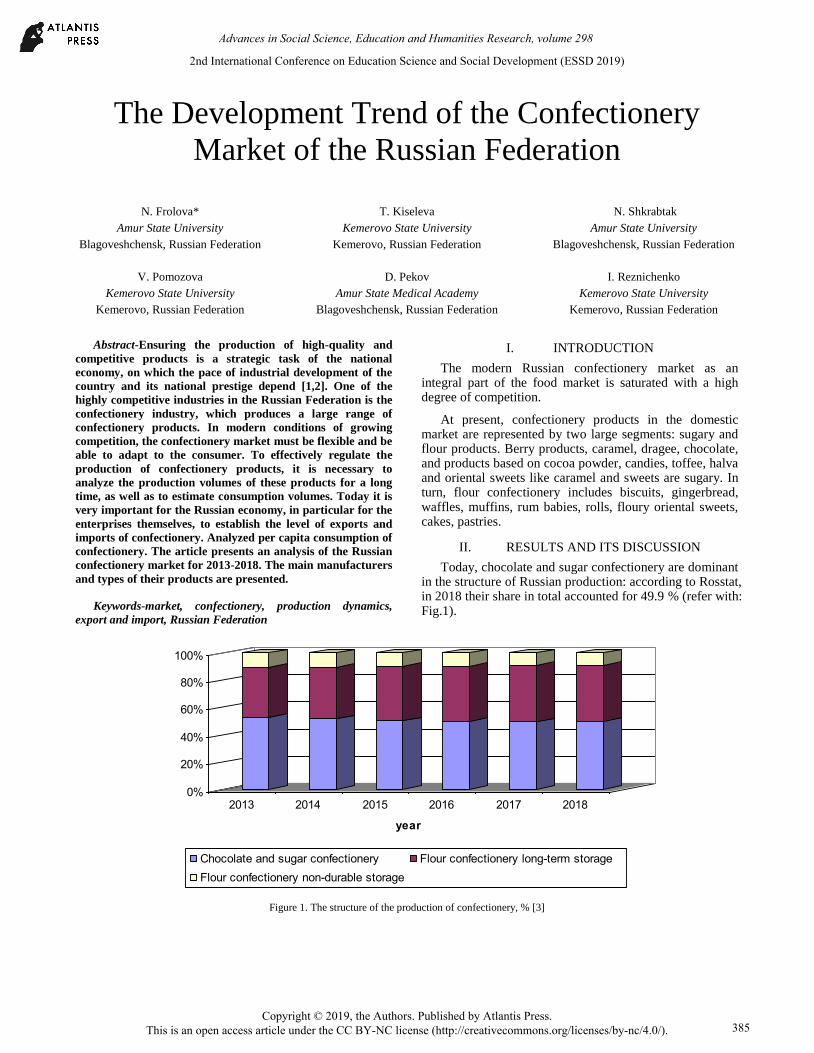
Today, chocolate and sugar confectionery are dominant in the structure of Russian production: according to Rosstat, in 2018 their share in total accounted for 49.9 % (refer with: Fig.1).
0%
20%
40%
60%
80%
100%
2013 2014 2015 2016 2017 2018
year
Chocolate and sugar confectionery Flour confectionery long-term storage
Flour confectionery non-durable storage
Figure 1. The structure of the production of confectionery, % [3]
2nd International Conference on Education Science and Social Development (ESSD 2019)
Copyright © 2019, the Authors. Published by Atlantis Press. This is an open access article under the CC BY-NC license (http://creativecommons.org/licenses/by-nc/4.0/).
Advances in Social Science, Education and Humanities Research, volume 298
385
Long-term flour confectionery products account for 41 % of the total production structure, and the share of non-durable flour confectionery products is 9.2 %.
Against the background of the decline in real incomes in recent times, the population has shifted to the savings model of consumption; there has been a reorientation of demand for cheaper food products, including the sweets of the economy segment. The growth in consumption is
largely due to the adaptation of consumers and producers to the current economic situation: due to the crisis, people increasingly prefer low-cost sweets and long-term storage products.
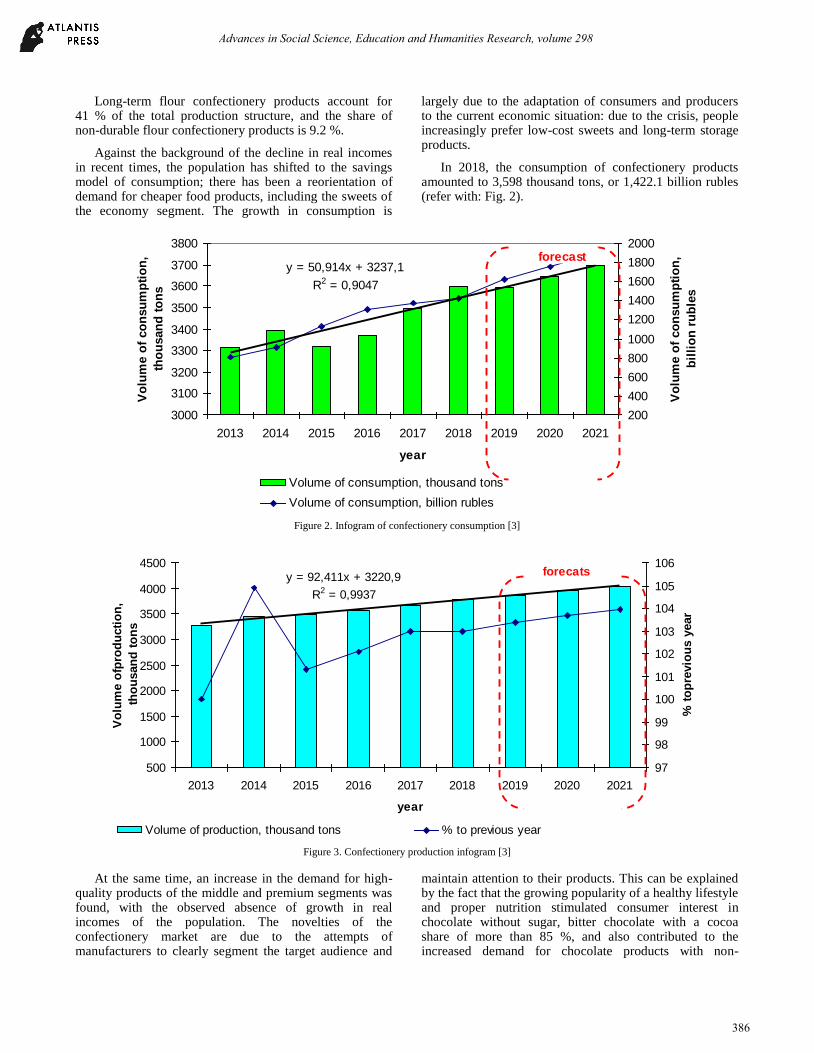
In 2018, the consumption of confectionery products amounted to 3,598 thousand tons, or 1,422.1 billion rubles (refer with: Fig. 2).
y = 50,914x + 3237,1
R2 = 0,9047
3000
3100
3200
3300
3400
3500
3600
3700
3800
2013 2014 2015 2016 2017 2018 2019 2020 2021
year
Vo
lum
e o
f co
nsu
mp
tio
n,
tho
usan
d t
on
s
200
400
600
800
1000
1200
1400
1600
1800
2000
Vo
lum
e o
f co
nsu
mp
tio
n,
bil
lio
n r
ub
les
Volume of consumption, thousand tons
Volume of consumption, billion rubles
Линейный (Volume of consumption, thousand tons)
forecast
Figure 2. Infogram of confectionery consumption [3]
y = 92,411x + 3220,9
R2 = 0,9937
500
1000
1500
2000
2500
3000
3500
4000
4500
2013 2014 2015 2016 2017 2018 2019 2020 2021
year
Vo
lum
e o
fpro
du
cti
on
,
tho
usan
d t
on
s
97
98
99
100
101
102
103
104
105
106
% t
op
revio
us y
ear
Volume of production, thousand tons % to previous year
Линейный (Volume of production, thousand tons)
forecats
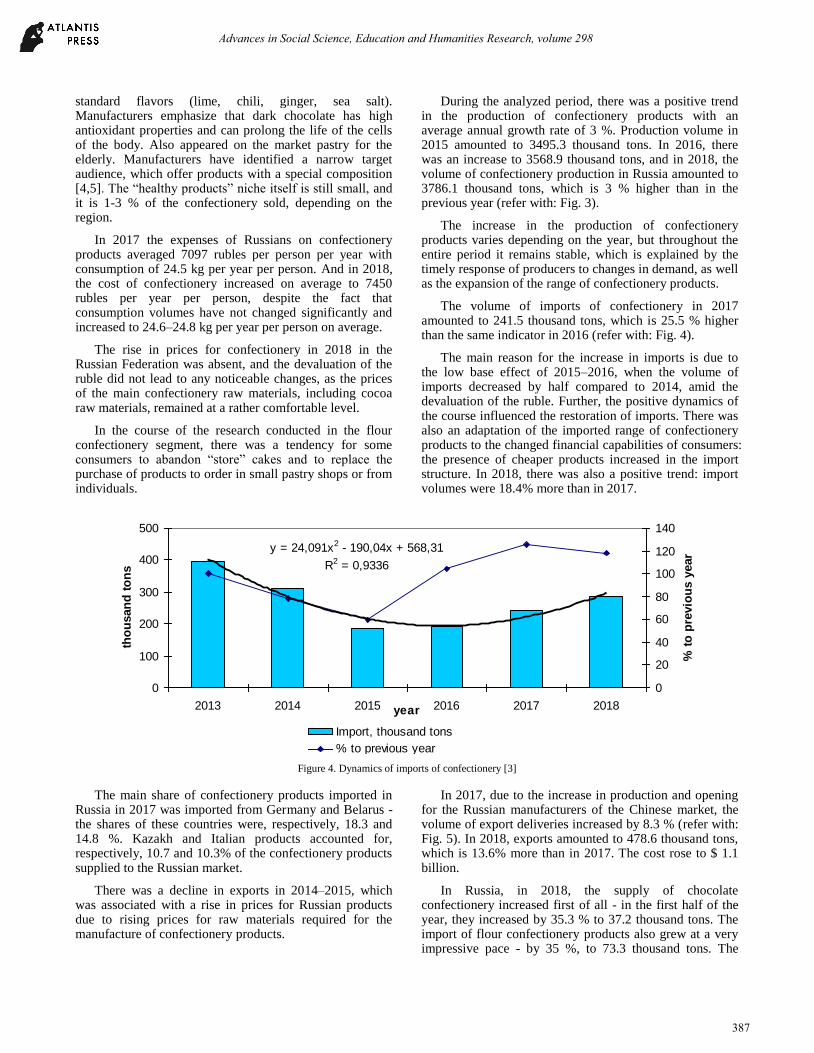
Figure 3. Confectionery production infogram [3]
At the same time, an increase in the demand for high-quality products of the middle and premium segments was found, with the observed absence of growth in real incomes of the population. The novelties of the confectionery market are due to the attempts of manufacturers to clearly segment the target audience and
maintain attention to their products. This can be explained by the fact that the growing popularity of a healthy lifestyle and proper nutrition stimulated consumer interest in chocolate without sugar, bitter chocolate with a cocoa share of more than 85 %, and also contributed to the increased demand for chocolate products with non-
Advances in Social Science, Education and Humanities Research, volume 298
386
standard flavors (lime, chili, ginger, sea salt). Manufacturers emphasize that dark chocolate has high antioxidant properties and can prolong the life of the cells of the body. Also appeared on the market pastry for the elderly. Manufacturers have identified a narrow target audience, which offer products with a special composition [4,5]. The “healthy products” niche itself is still small, and it is 1-3 % of the confectionery sold, depending on the region.
In 2017 the expenses of Russians on confectionery products averaged 7097 rubles per person per year with consumption of 24.5 kg per year per person. And in 2018, the cost of confectionery increased on average to 7450 rubles per year per person, despite the fact that consumption volumes have not changed significantly and increased to 24.6–24.8 kg per year per person on average.
The rise in prices for confectionery in 2018 in the Russian Federation was absent, and the devaluation of the ruble did not lead to any noticeable changes, as the prices of the main confectionery raw materials, including cocoa raw materials, remained at a rather comfortable level.
In the course of the research conducted in the flour confectionery segment, there was a tendency for some consumers to abandon “store” cakes and to replace the purchase of products to order in small pastry shops or from individuals.
During the analyzed period, there was a positive trend in the production of confectionery products with an average annual growth rate of 3 %. Production volume in 2015 amounted to 3495.3 thousand tons. In 2016, there was an increase to 3568.9 thousand tons, and in 2018, the volume of confectionery production in Russia amounted to 3786.1 thousand tons, which is 3 % higher than in the previous year (refer with: Fig. 3).
The increase in the production of confectionery products varies depending on the year, but throughout the entire period it remains stable, which is explained by the timely response of producers to changes in demand, as well as the expansion of the range of confectionery products.
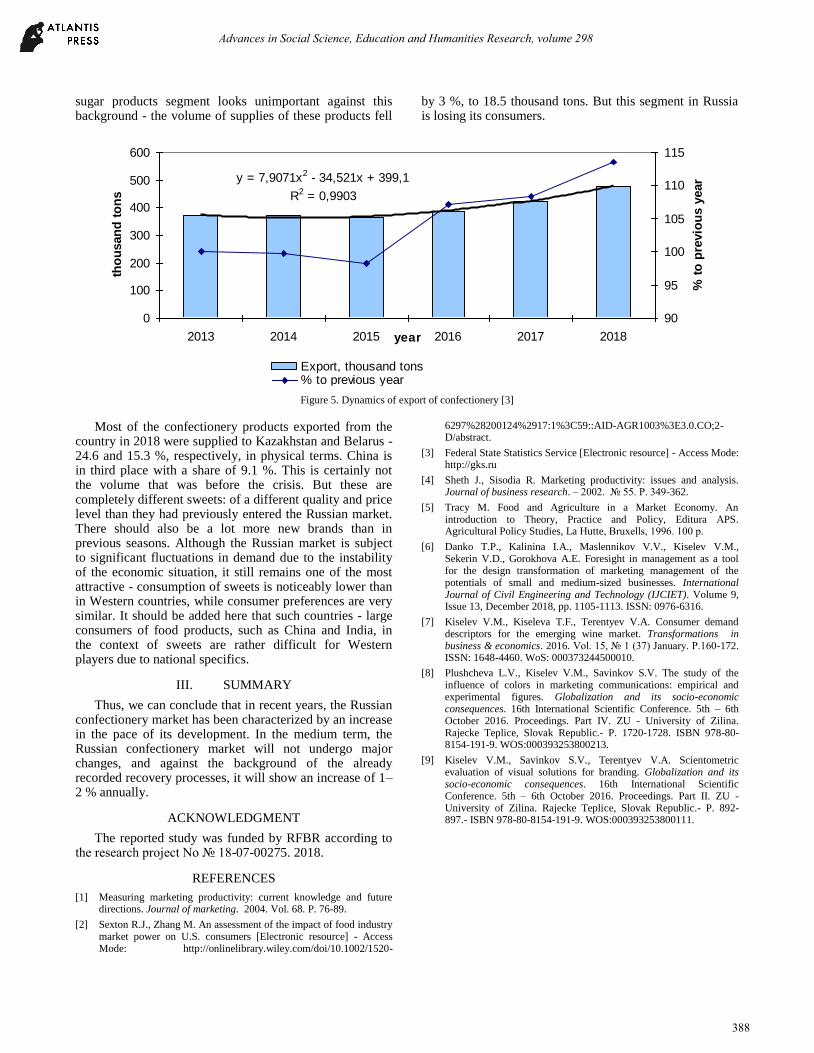
The volume of imports of confectionery in 2017 amounted to 241.5 thousand tons, which is 25.5 % higher than the same indicator in 2016 (refer with: Fig. 4).
The main reason for the increase in imports is due to the low base effect of 2015–2016, when the volume of imports decreased by half compared to 2014, amid the devaluation of the ruble. Further, the positive dynamics of the course influenced the restoration of imports. There was also an adaptation of the imported range of confectionery products to the changed financial capabilities of consumers: the presence of cheaper products increased in the import structure. In 2018, there was also a positive trend: import volumes were 18.4% more than in 2017.
y = 24,091x2 - 190,04x + 568,31
R2 = 0,9336
0
100
200
300
400
500
2013 2014 2015 2016 2017 2018year
tho
usan
d t
on
s
0
20
40
60
80
100
120
140
% t
o p
revio
us y
ear
Import, thousand tons
% to previous year
Полиномиальный (Import, thousand tons)
Figure 4. Dynamics of imports of confectionery [3]
The main share of confectionery products imported in Russia in 2017 was imported from Germany and Belarus - the shares of these countries were, respectively, 18.3 and 14.8 %. Kazakh and Italian products accounted for, respectively, 10.7 and 10.3% of the confectionery products supplied to the Russian market.
There was a decline in exports in 2014–2015, which was associated with a rise in prices for Russian products due to rising prices for raw materials required for the manufacture of confectionery products.
In 2017, due to the increase in production and opening for the Russian manufacturers of the Chinese market, the volume of export deliveries increased by 8.3 % (refer with: Fig. 5). In 2018, exports amounted to 478.6 thousand tons, which is 13.6% more than in 2017. The cost rose to $ 1.1 billion.
In Russia, in 2018, the supply of chocolate confectionery increased first of all - in the first half of the year, they increased by 35.3 % to 37.2 thousand tons. The import of flour confectionery products also grew at a very impressive pace - by 35 %, to 73.3 thousand tons. The
Advances in Social Science, Education and Humanities Research, volume 298
387
sugar products segment looks unimportant against this background - the volume of supplies of these products fell
by 3 %, to 18.5 thousand tons. But this segment in Russia is losing its consumers.
y = 7,9071x2 - 34,521x + 399,1
R2 = 0,9903
0
100
200
300
400
500
600
2013 2014 2015 2016 2017 2018year
tho
usan
d t
on
s
90
95
100
105
110
115
% t
o p
revio
us y
ear
Export, thousand tons% to previous yearПолиномиальный (Export, thousand tons)
Figure 5. Dynamics of export of confectionery [3]
Most of the confectionery products exported from the country in 2018 were supplied to Kazakhstan and Belarus - 24.6 and 15.3 %, respectively, in physical terms. China is in third place with a share of 9.1 %. This is certainly not the volume that was before the crisis. But these are completely different sweets: of a different quality and price level than they had previously entered the Russian market. There should also be a lot more new brands than in previous seasons. Although the Russian market is subject to significant fluctuations in demand due to the instability of the economic situation, it still remains one of the most attractive - consumption of sweets is noticeably lower than in Western countries, while consumer preferences are very similar. It should be added here that such countries - large consumers of food products, such as China and India, in the context of sweets are rather difficult for Western players due to national specifics.
III. SUMMARY
Thus, we can conclude that in recent years, the Russian confectionery market has been characterized by an increase in the pace of its development. In the medium term, the Russian confectionery market will not undergo major changes, and against the background of the already recorded recovery processes, it will show an increase of 1–2 % annually.
ACKNOWLEDGMENT
The reported study was funded by RFBR according to the research project No № 18-07-00275. 2018.
REFERENCES
[1] Measuring marketing productivity: current knowledge and future directions. Journal of marketing. 2004. Vol. 68. P. 76-89.
[2] Sexton R.J., Zhang M. An assessment of the impact of food industry market power on U.S. consumers [Electronic resource] - Access Mode: http://onlinelibrary.wiley.com/doi/10.1002/1520-
6297%28200124%2917:1%3C59::AID-AGR1003%3E3.0.CO;2-D/abstract.
[3] Federal State Statistics Service [Electronic resource] - Access Mode: http://gks.ru
[4] Sheth J., Sisodia R. Marketing productivity: issues and analysis. Journal of business research. – 2002. № 55. P. 349-362.
[5] Tracy M. Food and Agriculture in a Market Economy. An introduction to Theory, Practice and Policy, Editura APS. Agricultural Policy Studies, La Hutte, Bruxells, 1996. 100 р.
[6] Danko T.P., Kalinina I.A., Maslennikov V.V., Kiselev V.M., Sekerin V.D., Gorokhova A.E. Foresight in management as a tool for the design transformation of marketing management of the potentials of small and medium-sized businesses. International Journal of Civil Engineering and Technology (IJCIET). Volume 9, Issue 13, December 2018, pp. 1105-1113. ISSN: 0976-6316.
[7] Kiselev V.M., Kiseleva T.F., Terentyev V.A. Consumer demand descriptors for the emerging wine market. Transformations in business & economics. 2016. Vol. 15, № 1 (37) January. P.160-172. ISSN: 1648-4460. WoS: 000373244500010.
[8] Plushcheva L.V., Kiselev V.M., Savinkov S.V. The study of the influence of colors in marketing communications: empirical and experimental figures. Globalization and its socio-economic consequences. 16th International Scientific Conference. 5th – 6th October 2016. Proceedings. Part IV. ZU - University of Zilina. Rajecke Teplice, Slovak Republic.- P. 1720-1728. ISBN 978-80-8154-191-9. WOS:000393253800213.
[9] Kiselev V.M., Savinkov S.V., Terentyev V.A. Scientometric evaluation of visual solutions for branding. Globalization and its socio-economic consequences. 16th International Scientific Conference. 5th – 6th October 2016. Proceedings. Part II. ZU - University of Zilina. Rajecke Teplice, Slovak Republic.- P. 892-897.- ISBN 978-80-8154-191-9. WOS:000393253800111.
Advances in Social Science, Education and Humanities Research, volume 298
388


