
The Dark Side of Decentralized Banks: Market
Power and Credit Rationing in SME Lending ∗
Rodrigo Canales
Yale School of Management
Ramana Nanda
Harvard Business School
February 15, 2010
Abstract
Using loan-level data from Mexico, we study the relationship between the organiza-
tional structure of banks and the terms of lending to small businesses. We find that
banks with decentralized lending structures – where branch managers have autonomy
over the terms of lending – give larger loans to small firms and those with more "soft
information". However, decentralized banks are also more responsive to the competitive
environment when setting loan terms. They are more likely to cherry pick customers and
restrict credit when they have market power, even more so to smaller firms that have
fewer outside options for external finance. These findings highlight a ‘darker side’ to de-
centralized banks and suggest that the relative benefit of a decentralized bank structure
for small business lending depends critically on the nature of the competitive environment
in which banks are located.
JEL Classification: G21, H81, L22, L26.
Key Words: Banks, Organizational Structure, Small Business, Entrepreneurship
∗We are extremely grateful to the Mexican Ministry of the Economy as well as to Elfid Torres from FUNDESfor sharing the data used for this paper. We are grateful to Lamont Black, Jessica Goldberg, William Kerr,
David McKenzie, Mitchell Petersen, David Robinson, Olav Sorenson, Costas Stephanou, Tavneet Suri, Gregory
Udell, Chris Woodruff and the participants on the World Bank Conference on Small Business Finance, HBS
International Business Conference and NEUDC for their feedback on this paper. All errors are our own.
Please send your comments to [email protected] or [email protected].
1

1 Introduction
Small banks are believed to play a critical role in financing young and small businesses
in the economy. In addition to their ability to engage in relationship banking (Petersen
and Rajan, 1994; Berger and Udell, 1995), it is suggested that the decentralized structure
inherent in small banks gives them an important advantage when lending to small firms.
The decentralized structure implies that branch managers in small banks have far greater
autonomy over adjudication and lending decisions than in large banks, thereby giving them
an incentive to collect and use “soft information” when setting the loan terms (Stein, 2002).
Since much of the information used in lending to small businesses may be "soft", decentralized
banks have an advantage in small-business lending compared with the centralized decision
making structure in large banks.
These differences in the organizational structure of banks can have important conse-
quences for the real economy. For example, Berger et al (2005) show that small businesses
located in US MSAs with a majority of large banks were more likely to face credit constraints
than firms located close to small, decentralized banks. Likewise, Mian (2008) shows that de-
centralized banks consistently engage in more lending activity to small firms in markets with
weak contract enforceability. The general image that emerges from this literature, therefore,
is that decentralized banks are the better answer for credit-constrained small firms that may
otherwise be excluded from bank finance.
Using a loan-level dataset on SME lending in Mexico, we find that this positive picture
of decentralized banks does not always hold true. While our results are consistent with
prior work in this literature, we show that the same discretion that allows branch managers
of decentralized banks to act on soft information also allows them to be more responsive to
their own competitive environment when setting loan terms. This can be beneficial for small
businesses in competitive banking markets where decentralized banks can help alleviate credit
constraints. But it also implies that decentralized banks might better-exploit their market
power in concentrated banking markets by restricting credit or charging higher interest rates
to small businesses.
Our empirical analyses are based on a comprehensive, loan-level panel dataset on small
2
and medium enterprise (SME) loans in Mexico, covering the period 2002 to 2006. We find
that small firms and those that tend to rely more on ‘soft information’ get larger loans from
decentralized banks. These results were even stronger when using instrumental variables,
indicating that the differences across banks lie not just in the terms of lending, but also in
the types of firms that get approved for a loan. In concentrated banking markets, however,
decentralized banks were more likely than centralized banks to cherry pick the best firms and
give them smaller loans. This was particularly true for smaller firms and firms in the services
sector, that provide less “hard information” to banks, have less collateral, and hence tend to
have fewer outside options for external finance.
Our results highlight that decentralized banks indeed have access to soft information that
provides them with a greater sensitivity to local institutional environments. However, we
show that this can have both positive and negative consequences for small firms. While some
of our results complement prior findings by showing the benefits of decentralized banks, the
results also highlight that there may be a darker side to decentralized bank lending. Put
differently, the relative benefit of decentralized bank structures for small business lending
may depend on the institutional and competitive environment in which banks are located.
A novel feature of our analysis is that it allows us to get direct measures of organizational
structure without relying on the size of the banks. Since our results are based on banks that
have large, national presences but differ in their organizational structure, we can also show
that it is in fact the organizational structure of banks that drives the observed patterns in our
data as opposed to some other factor that may be correlated with bank size (e.g. Brickley et
al 2003).
This paper therefore ties together two literatures related to small business lending. On
the one hand, it is related to studies examining how competition in the banking industry
impacts credit constraints of small, constrained startups (Black and Strahan 2002; Cetorelli
and Strahan 2006; Kerr and Nanda, 2009). On the other, it is related to studies examining
how bank structure affects lending outcomes (Stein 2002; Berger et al 2005). In tying
together these two literatures, our findings may also explain why entrepreneurship increased
significantly following the cross state US banking deregulations from the late 1970s through
the early 1990s, despite the fact that the deregulations led to a wave of M&A activity where
3

the number small banks fell dramatically . The increase in entry following the deregulation
is seen as a puzzle by some, as a fall in small banks is usually associated with a decline in
entrepreneurship. Our result highlights that the increase in entrepreneurship in this instance
may thus have occurred precisely because small banks had been effective in exploiting their
monopoly power in the period before the deregulation, leading the competition between
large banks — still a second best outcome — to still be a better outcome for entrepreneurs
than monopolist small banks.
The rest of the paper is structured as follows: In section 2, we outline the theoretical
considerations for the paper. In Section 3, we outline our estimation design and the series of
institutional features we exploit in our analysis. Section 4 provides an overview of the Data
and the descriptive statistics. Section 5 outlines our regression results. Finally, in Section 6
we have a brief discussion of our results, and conclusions.
2 Theoretical Considerations
Bank credit is the most important source of external finance for young firms and small and
medium enterprises (SMEs). Still, given that these ventures are associated with high degrees
of asymmetric information, otherwise viable small businesses may face credit constraints that
prevent them from growing or force them to prematurely shut down.
The vast majority of firms in the economy are small1, highlighting the extent to which
this is an important concern. Accordingly, a large literature on bank lending to small firms
has focused on how the organizational structure or the competitive environment of banks
may affect small firms’ access to credit (Petersen and Rajan 1994, 1995; Berger and Udell,
1996; 2002; Black and Strahan, 2000).
While much of the literature on bank structure has focused on the ability for smaller banks
to maintain lending relationships with small businesses, more recent papers have argued that
in addition, small banks may be better at alleviating credit constraints for small businesses
because they are more effective at processing the "soft information" of young and small
firms (Stein, 2002). According to this view, a key distinguishing factor of small business
1For example, of the 6 million firms in the US with at least one employee, 5.3 million (89%) have less than
20 employees (US Small Business Administration, 1996)
4

lending is that it relies heavily on information that cannot be easily verified by others. For
that reason, branch managers of decentralized banks, who have more autonomy over lending
decisions, will invest more energy ex ante in processing the ‘soft information’ available for
small firms. Given that these managers bear full responsibility over lending choices, they
have higher powered incentives to gather —and react to— soft information from their clients.
Branch managers in centralized banks, in contrast, rely more heavily on ‘hard information’
such as credit scoring models. As a result, banks with a decentralized lending structures will
have a comparative advantage in lending to young and small businesses with predominantly
unverifiable information, even if larger banks can recreate some of the benefits of lending
relationships that small banks have.
In this paper, we build on the same intuition, but also examine the interaction between
bank structure and the competitive environment in which the banks are located. We hypoth-
esize that branch managers in decentralized banks should also be more responsive to their
own competitive environment when setting deal terms, as they have greater incentives to do
so compared with managers of centralized banks. In some instances, this may be beneficial
to small businesses because branch managers can set terms based on the actual (rather than
expected) propensity to pay back the loan. However, in other instances —such as when banks
have market power— decentralized banks may be able to extract more of the surplus from
small firms than centralized banks, by charging higher rates or restricting access to credit.
3 Estimation Design
Empirically testing the hypothesis that banks with different organizational structures have
different lending terms — that also vary by the institutional environment — poses several
challenges. First, we need a measure of bank organizational structure that allows us to dis-
tinguish between banks that use a centralized vs. a decentralized lending model. Second, we
need to account for the fact that the observed lending terms are endogenous, since they are
a function of lending terms conditional on selection of firms by banks. Since decentralized
banks may lend to different types of firms than centralized banks, comparing lending terms
across the bank types without accounting for this selection will lead to biased results. In
addition, we need to account for the fact that the distribution of bank branches for central-
5

ized and decentralized banks may vary systematically across competitive environments in
relation to the SME lending opportunity. Comparing lending terms across the institutional
environment for banks may again conflate this selection of markets by banks with the lending
terms conditional on entering that market.
In order to get an accurate measure of the banks’ organizational structure, one of the
authors conducted extensive interviews in each of the major banks in Mexico, at both the
corporate and the branch-level, to gain an insight into the degree of autonomy that branch
managers had over adjudication and lending process. In particular, during interviews with
branch managers and especially with the SME credit managers for each bank, we asked them
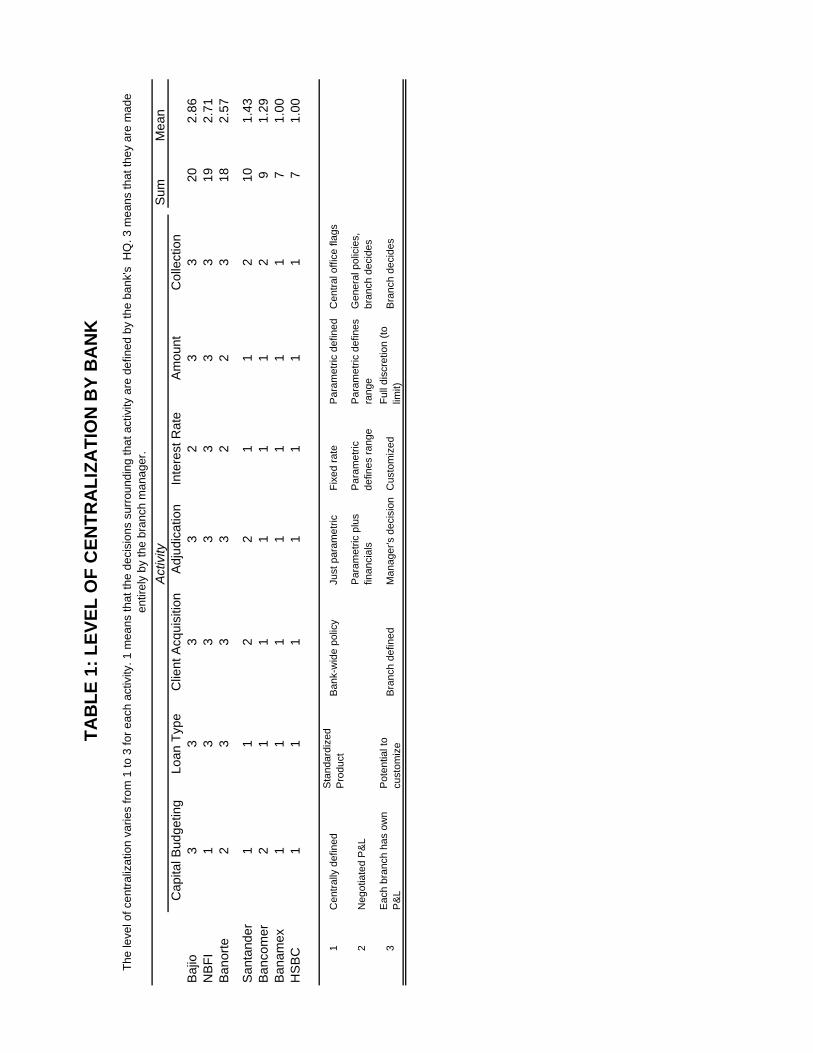
to describe the loan approval process. Based on those interviews, we created an index that
reflects the extent to which lending decisions are taken at the bank’s central offices or at
the branch level. We include capital budgeting, loan adjudication, client acquisition, loan
amount, loan size, interest rate, and collection decisions. Table 1 shows that the index varies
from a minimum of 7 for HSBC (the most centralized) to a maximum of 20 for Bajio (the most
decentralized). It also shows that there is a clear split between Santander and Banorte, which
allows us to use a dummy variable to group the two sets of banks into distinct categories for
our analysis, where those banks with a score of 10 or below are coded as being centralized.
We rely on important historical features of the Mexican banking industry to address the
issues of selection outlined above. As we outline in greater detail below, a series of factors
impacting the Mexican banking market effectively wiped out SME lending across all the
major banks over the decade prior to our study. In 2002, there was a renewed push from
the government to initiate lending to SMEs in Mexico, which led to the re-emergence of a
small business lending market subsequent to that period. We argue that the complete lack of
SME lending in the decade prior to our study implies that the distribution of centralized and
decentralized bank branches across markets was not driven by selection into better or worse
SME markets but by other factors such as the need to collect deposits. Given this fact, we
use the pre-existing distribution of bank branches in 2002 as plausibly exogenous and hence
also use the share of decentralized banks in the firm’s local banking market to instrument for
the selection between bank types and firms.
Since our identification strategy relies critically on showing that banks did not select into
6
markets, we provide both a historical account of the Mexican banking sector as well as some
checks on the validity of our identification strategy in the section below.
3.1 The Mexican Banking Sector and SME Lending: 1990-2002
The Mexican banking industry has had a tumultuous history marked by a consistent re-
striction of credit. From its origins, Mexican banks have been at the center of the Mexican
political system, and have monopolized the country’s financial resources. Their relative lack
of competitiveness only worsened when severe macroeconomic mismanagement led López
Portillo’s government to expropriate all private banks in 19812 (Haber 2004).
Accordingly, when the government decided to privatize banks as part of its broader pri-
vatization strategy in 1991, there still remained a fear of expropriation among investors.
Given the government’s desperate need for resources due to aggressive expansionary policies,
it sought to auction the existing banks at the highest possible price. To attract investors,
the government granted them a protected oligopoly shielded from internal and external com-
petition (Haber 2004) and sold the banks to the highest bidder irrespective of managerial
experience (Unal and Navarro 1999). As a result, Mexican banks sold with a premium of 45
percent over the value of their equity (Unal and Navarro 1999). An impenetrable oligopoly
ran by less experienced managers was created which, due to moral hazard, pervasive tun-
neling, and mis-reporting of non-performing loans was highly volatile (Haber 2004).3 The
natural end result was the collapse of the banking sector in 1994 that continued the protracted
years of restricted lending and Mexico’s distinction as a poor financing environment.
Aside from the resultant crisis, the institutional setup had other practical implications.
Between the nationalization of 1981, the privatization of 1991, and the years leading up
to the 1994 crisis, most banks lost their credit analysis capabilities and the incentive to
engage in commercial lending. As the banks were first expropriated and later re-privatized,
their administration was increasingly centralized. What little discretion was still available to
branch managers was lost when the 1994 crisis led to a complete restriction of lending, an
2This was in fact the third time that banks were expropriated since 1915. The two previous times, however,
occurred during the highly turbulent times that followed the Mexican Revolution and preceded the creation
of the national economic and political pact that gave rise to Mexican corporatism and the PRI’s hegemony3Most of these managers did not have previous banking experience. Rather, they emerged out of trading
companies and investment banks that developed during the stock exchange boom.
7

expensive governmental bailout of all banks, and a desperate need for capitalization of the
system. Mexican banks were opened to foreign investment in 1997 and foreign ownership
increased from 16 percent in 1997 to 83 percent by 2004 (Haber and Musacchio 2005). The
market was also further concentrated, where the five largest banks gained control of around
70 percent of the market. While the capital injection increased the centralization of practices,
it did not increase lending; in fact, the opposite occurred (Haber 2004; Haber and Musacchio
2005).
At the same time, the privatization of the early 1990s led to the emergence of new re-
gional banks which, given that they were in their emergence stage during the crisis, did
not suffer from the mismanagement associated with the bidding wars of the larger financial
groups. Banks such as Banco Mercantil del Norte –which later became Banorte—and Banco
del Bajío emerged as new, private, regional operations during the privatization era. As other
banks collapsed during 1995 and were sold to foreign owners, these regional operations found
themselves as the sole providers of credit to the government and grew vertiginously through-
out the country to national or quasi-national operations. This also shielded them from the
aggressive entrance of international capital during the 1997 wave, and they thus retained the
decentralized structures that they grew with.
The period from 1997 to 2000 was one of greater stability, where both centralized and
decentralized banks were able to maintain high levels of profitability without engaging in
much commercial lending — by lending to the government, their own shareholders, and by
charging extremely high fees and commissions to account holders (Haber and Musacchio
2005). That commercial lending was not a priority for banks is reflected in the continued
downward trend in the activity, with private sector lending as a percentage of GDP falling
from 14.5% in 1997 to 9.2% in 2001.
The retraction of credit affected Mexican SMEs disproportionately. Up to 1985, devel-
opment banks in Mexico such as NAFINSA and Banrural played a central role in business
financing through several government-sponsored funds. While their aim was to complement
the role of commercial banks, in most cases they actually substituted all SME financing. Due
to several structural and contextual factors (including the repeated financial and macroeco-
nomic crises) these agencies lowered their activity considerably during the decades of the 80s
8

and 90s. During the privatization of the early 1990s, some credit did reach SMEs, but given
the organizational factors described above, loans were mostly given with aggressive prop-
erty collateral requirements and were often denominated in dollars. As a result, the credit
crunch combined with the currency crisis affected SMEs –especially those in nontradable
sectors—disproportionately, further decreasing their already scant access to credit (Krueger
and Tornell 1999; Tornell and Westermann 2003). Mexican businesses thus perfected the art
of survival without financing. Around seventy percent of Mexican businesses finance their
operations through trade and supplier credit, which carries costs of 60 to 150 percent per year
(Banco de México, 2007). An extra 15 percent of business financing comes from alternative
credit sources (sometimes coded in surveys as SME loans) such as personal credit cards or
personal mortgage loans, which are equally inefficient.
In sum, SME credit has historically not been a priority for any bank in Mexico. Rather,
banks have based their profitability on extremely high commissions for retail banking and on
government lending. Accordingly, branching decisions have been based on opportunities for
retail banking. Mexican banks basically entered the new millennium with little lending to the
commercial sector, but with two different — and equally successful— organizational structures
for retail banking: fully centralized and decentralized. In Appendix 1, we show that the share
of branches of centralized and decentralized banks remain stable across the entire period with
respect to the SME lending opportunity, and moreover are also similar in more versus less
concentrated banking markets.
4 Data
The data for this study is drawn from a proprietary loan-level database maintained by the
ministry of the economy of Mexico. In 2002, there was a renewed push from the government
to initiate lending to SMEs in Mexico. The Ministry of the Economy was reformed to include
a sub-ministry for the development of SMEs, which determined SME access to bank credit
as one of the main priorities of the ministry. The initiatives to bring credit to SMEs were
grouped under the National SME Financing System (SINAFIN, for its initials in Spanish).
While the program evolved and changed considerably from its inception in 2001 and its initial
implementation in 2002, its initial incarnation consisted of a government-funded guarantee
9
system that covered banks’ SME loan losses. The program included both a first-losses product
that covered a set percentage of a bank’s SME loan portfolio, and a traditional guarantee
that covered up to 75 percent of each loan that defaulted, but that had a cost of around two
percent of the guaranteed amount.
The SINAFIN program provided an incentive for the banks to experiment with a segment
that they had traditionally overlooked while they focused on less risky but still profitable
investments. As the banks developed pilot products for SMEs and started testing the segment,
they discovered that there was a much larger demand for loans, at much better repayment
rates, than they had anticipated. During its first five years of operation, and even though
it is a relatively small program (US$150 million were invested between 2001 and 2006) it
generated very positive results.
Over the period that we study, all SME loans given by private-sector banks through the
program are included in this database. It is important to note that, given that this was the
first effort by the banks at creating a SME-specific product, in fact the database is a good
approximation on all loans granted to SMEs in the period.4 The database includes unique
firm- and bank- identifiers, basic firm-level information such as the firm size, industry, and
location as well as a set of loan-level characteristics such as the purpose of the loan (working
capital vs. fixed asset investment), the amount of the loan and the interest rate that was
charged. A separate database also maintains whether a firm defaulted on its loan.
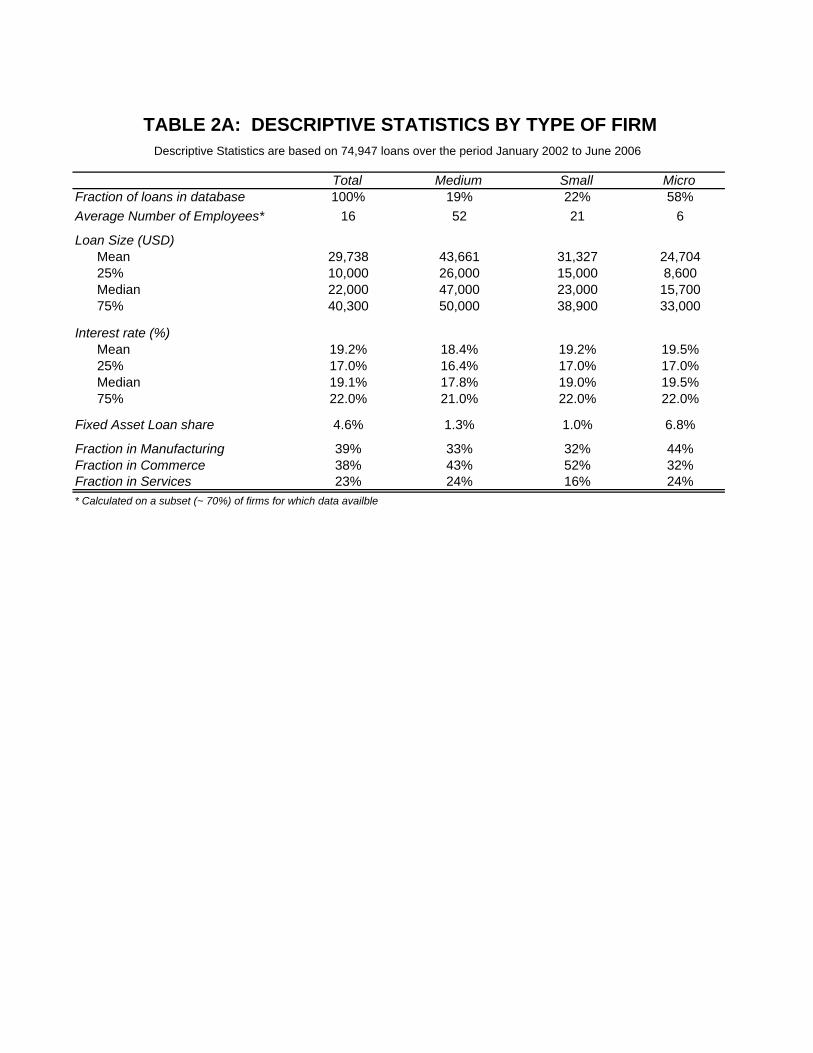
We use the information on firm size to bucket firms into one of three categories – firms
with less than 15 employees are classified as "Micro", those with more than 15 but less than
30 employees are classified as "Small", and those with more than 30 employees are classified
as "Medium".5 Table 2A provides descriptive statistics on the firms in our sample. As can be
4Starting in 2007, the rules around the guarantee program and SME lending operations of some banks
changed, so that not all loans for each bank were included in the data. However, interviews with both the
ministry of the economy and officials at each of the major banks have confirmed that over the period we
study, the database is comprehensive for all SME-specific credit products. Other loans were surely granted
to SMEs, but they would have taken the form of mortgage loans or personal consumer loans received by the
entrepreneurs and funneled to their business.These personal loans are often coded as SME loans in survey
data.5As defined by the Ministry of the Economy. Not all firms in the database have an estimate of the number
of employees, but branch managers were required to provide an estimate of the firm size when giving the loan.
Our categorization maps onto this logic, and hence we use the branch managers’ estimate of the category for
the firm in instances where we do not have the data to calculate it ourselves.
10
seen from Table 2A, almost 60% of the firms in this sample are Micro firms, with an average
size of 6 employees. A further 23% are Small firms with an average size of 21 employees
and the remaining 19% are classified as Medium firms with an average size of 52 employees.
Table 1A also highlights differences in the share of loans each type of firm takes for fixed
asset loans, compared to working capital; and differences in the industry composition across
different types of firms.
In table 2B, we provide descriptive statistics by banks’ lending structure. As outlined
in the section above, the large national banks in Mexico vary in the lending structure they
followed for retail lending prior to 2002, where some used centralized and some decentral-
ized structures. When the SINAFIN program was implemented, banks ported this lending
technology to the SME sector.
The descriptive evidence in table 2B is consistent with the hypothesis that decentralized
banks are better at processing "soft information". Although 19% of all the loans in the
database are given by decentralized banks, they account for 44% of the loans given to firms
in the service sector – which tends to be associated much more with soft information than
firms that are engaged in either manufacturing or in trading/ commerce. Moreover, while less
than half a percent of centralized banks’ loans are given for fixed asset investments, nearly
a quarter of decentralized banks’ loans are used for this purpose. While it may seem that
fixed asset loans may involve less soft information as part of the approval decision, they often
tend to be more risky in this context because the liquidation value of collateral that SMEs
can post is usually of little value to the banks.6 Further, as can be seen from Table 1A, the
vast majority of these loans are given to Micro firms which tend to be less established, less
structured, and have less solid financial information.
5 Regression Results
5.1 Bank Lending Structure and Deal Terms
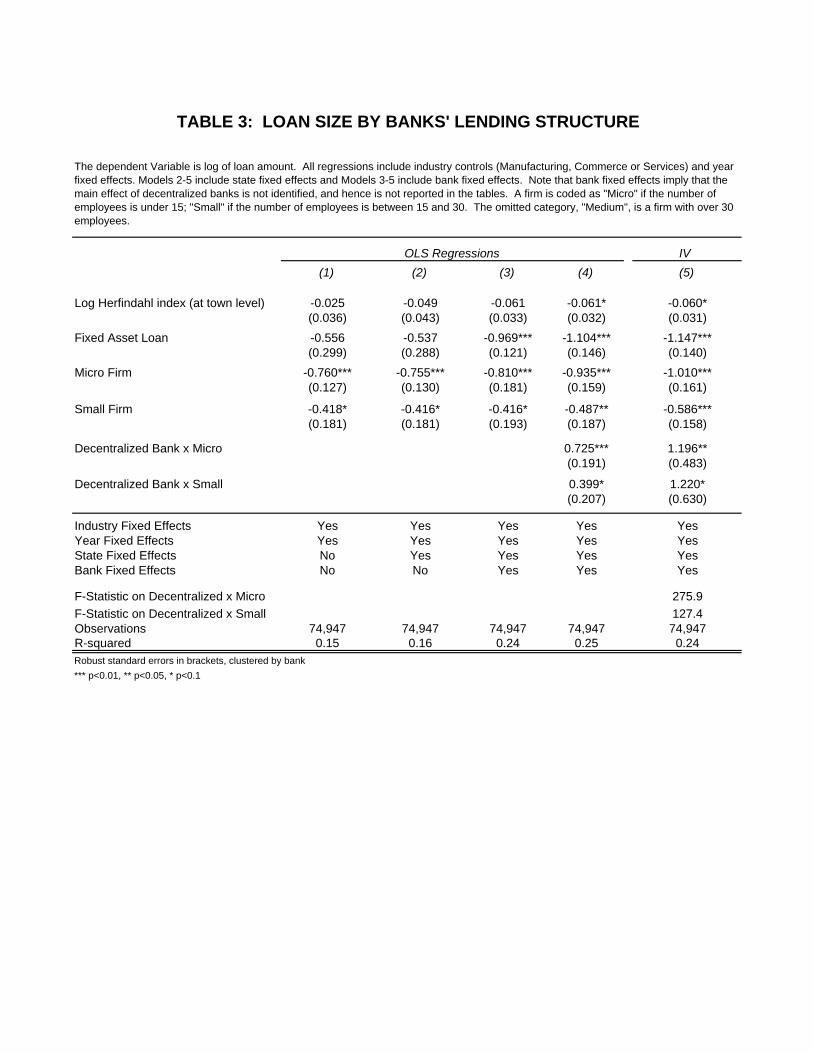
In Table 3, we report estimates from loan-level regressions where the dependent variable is
the size of loans to small businesses. The estimations take the form:
6This is especially true for small manufacturing firms. There is very little a bank can do, for example, with
a specialized plastic injection machine.
11

ln() = + + + + 01X (1)
+02+ 03
+03 ∗ + 04 ∗ +
In these regressions, refer to state, year, bank and industry fixed effects.
State fixed effects capture systematic differences in the lending environment across states
(such as bankruptcy laws) that may affect loan sizes. Bank fixed effects account for fixed
differences in the lending policies and practices across banks. Similarly year fixed effects
and industry fixed effects (controlling for manufacturing, commerce and retail firms) control
for systematic differences in loan characteristics across these industry types, or across years.
and refer to dummy variables indicating the type of firm receiving the
loan, and ∗ and ∗ refer to the interaction between the dummy
variable for decentralized banks with the dummy variables of firm type. Note that the main
effect of dummy of decentralized banks is absorbed by the bank fixed effects and hence is not
reported. The matrix X refers to other characteristics of the loan, such as whether it was a
fixed asset or working capital loan as well as the HHI index of bank concentration associated
with the municipality in the which the firm is located.
Columns 1-3 of Table 3 show that even after controlling for covariates, Micro and Small
firms continue to get smaller loans. These differences are robust to including the full range
of fixed effects. Column 4 includes the interaction with the decentralized bank dummy and
shows that, consistent with the descriptive statistics, decentralized banks give larger loans to
small and micro firms. T-tests for the difference in the loan amount are significant at the 5%
level of significance.
Naturally, these results could simply reflect that the different lending technologies of
decentralized and centralized banks lead to systematic differences in the types of firms that
are granted credit. We therefore interpret the results of Model 4 with caution, since they are
likely to be biased by these selection effects.
To address potential selection biases we need to instrument for whether a firm gets a
loan from a decentralized bank. As we outline in the section above, we use the share
12

of decentralized banks in the municipality where the firm is located as an instrument for
whether the firm actually receives a loan from a decentralized bank. In other words, in
a municipality where decentralized banks have a very high proportion of the total bank
branches, firms are much more likely to have been served by a decentralized bank, regardless
of their characteristics. We argue that this identification strategy is valid because as we
discussed in Section 3, the branching patterns across municipalities was driven by retail
banking (deposits, checking accounts, credit cards), and not SME lending. Moreover, since
the lending structures across the two different types of banks were driven by factors unrelated
to the emergence of the SINAFIN program, the share of decentralized banks should proxy for
the probability that a firm was matched with a decentralized bank, but should be unrelated
to systematic differences in the quality of firms and the terms that a given firm would expect
to receive.7 Tables A1 and A2 in Appendix 1 test these assumptions empirically and find
them to be valid. Table A1 compares the proportion of all centralized and decentralized bank
activity —measured as bank branches–that is concentrated in states that have a population
of SME firms above the median. Table A2 shows that the proportion of decentralized to
centralized bank branches in the total market, as well as within more competitive or more
concentrated markets, has remained constant through time. This is true even though the
total number of branches in these different markets has increased. The results indicate that
both types of banks have followed similar branching strategies. All these analyses show that
there does not seem to be a significant and systematic difference in how centralized and
decentralized banks allocate their activity to particular states or local banking markets, with
respect to the SME lending opportunity.
We report the results of these IV regressions in Column 5 of Table 3. Comparing column
4 and column 5 of Table 3 highlights that after controlling for the selection bias, decentralized
banks are seen to give even larger loans to Small and Micro firms. The direction of the bias
suggests that decentralized banks are more likely to give loans to smaller firms within a given
size category, consistent with the view that decentralized banks are better are processing
soft information. In unreported regressions, we also find that this selection bias tends to be
7We also verify empirically that the share of decentralized banks across the different types of markets does
not vary in ways that are statistically signficantly different from variations in the share of centralized banks.
13

stronger for small and micro firms in the service sector (with more soft information) compared
to firms engaged in manufacturing or commerce.
Further evidence of this selection bias is evident when looking at the OLS and IV regres-
sions in Table 4, where we examine the interest rates charged to small and micro firms. The
first 3 models in Table 3 highlight that small and micro firms tend to face higher interest
rates than medium firms. In model 4, the OLS results show that decentralized banks charge
more to small and micro firms. It is possible, however, that the higher interest rates may be
driven by the smaller, ‘riskier’ firms that decentralized banks might be lending to (as noticed
by results in Table 3). Comparing column 4 and column 5 of Table 3 shows that this is indeed
the case. What model 5 suggests is that once we control for the selection bias in the types of
firms that decentralized banks lend to, there is no meaningful difference in the interest rates
that centralized and decentralized banks charge.
Our results in this section map closely to prior findings (e.g. Berger et al, 2005) that
decentralized banks are far more effective at processing soft information, and hence better-
able to alleviate financing constraints for small firms. Previous research has typically relied
on bank size as a proxy for decentralized lending structures. Since we are comparing banks
that have national presence but have a direct measures of their organizational structure, we
can confirm that it is decentralization —and not a different mechanism correlated with bank
size–that accounts for our results. Interviews with credit brokers,8, branch managers, credit
directors, and national product managers of the different banks confirmed these findings.
Interviewees consistently referred to the comparative advantage for decentralized banks to
provide more customized loans or to evaluate firms whose information was not as clear. In
contrast, they suggested that centralized banks have an advantage in the standardization of
their product and the speed with which their credit scoring system can determine lending
decisions.
8Credit brokers —or “extension agents”–help firms structure their loan applications and advise them
through the application process. They are, in most cases, financed by the state and are paid a small commis-
sion for loan applications submitted at banks and a larger commission for approved loans. They can take a
prospective client to any bank.
14

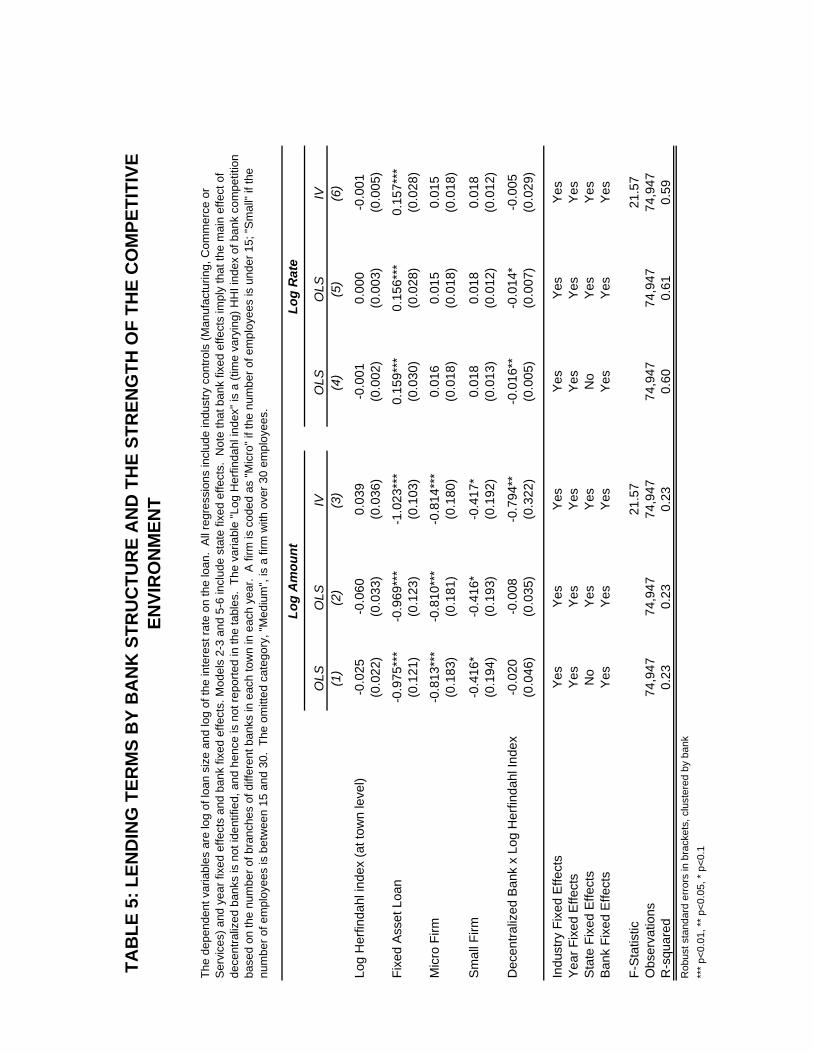
5.2 Lending Terms by Bank Structure and the Institutional Environment
We now turn to the ability of banks to respond to the local environment in which they are
located. Given the added discretion that branch managers of decentralized banks have, we
might expect them to be more responsive to the local institutional environment compared
to branch managers in centralized banks. In order to examine this further, we look at the
competitive environment in each municipality to see if the deal terms offered by decentralized
banks are systematically different from those offered by centralized banks across different
environments. In order to do so we, estimate the following specifications:
ln() = + + + + 01+ 02 (2)
+03 + 04 ∗ +
We measure bank competition using the log of the HHI concentration index calculated
using the share of each bank’s branches in a given municipality and year. The municipality-
level regressions provide a measure of the concentration in the "local" banking market in
which the firm is located and go beyond measures of concentration at the state-level (which
may not be a good proxy of the actual choices that firms face in their local markets).
We now include an interaction between decentralized banks and our measure of local
banking competition, captured by the variable ∗ As can be seen from Table 5,
the coefficient on ∗ in columns 1 and 2 suggest that there is no difference in the
lending practices between centralized and decentralized banks across market concentration.
However, comparing the results from the IV regressions Column 3 to Column 2 again
shows the selection present in decentralized-bank lending across markets. Decentralized
banks give significantly smaller loans in concentrated markets than centralized banks and
moreover, the nature of selection suggests that they are lending to larger, "safer firms" in
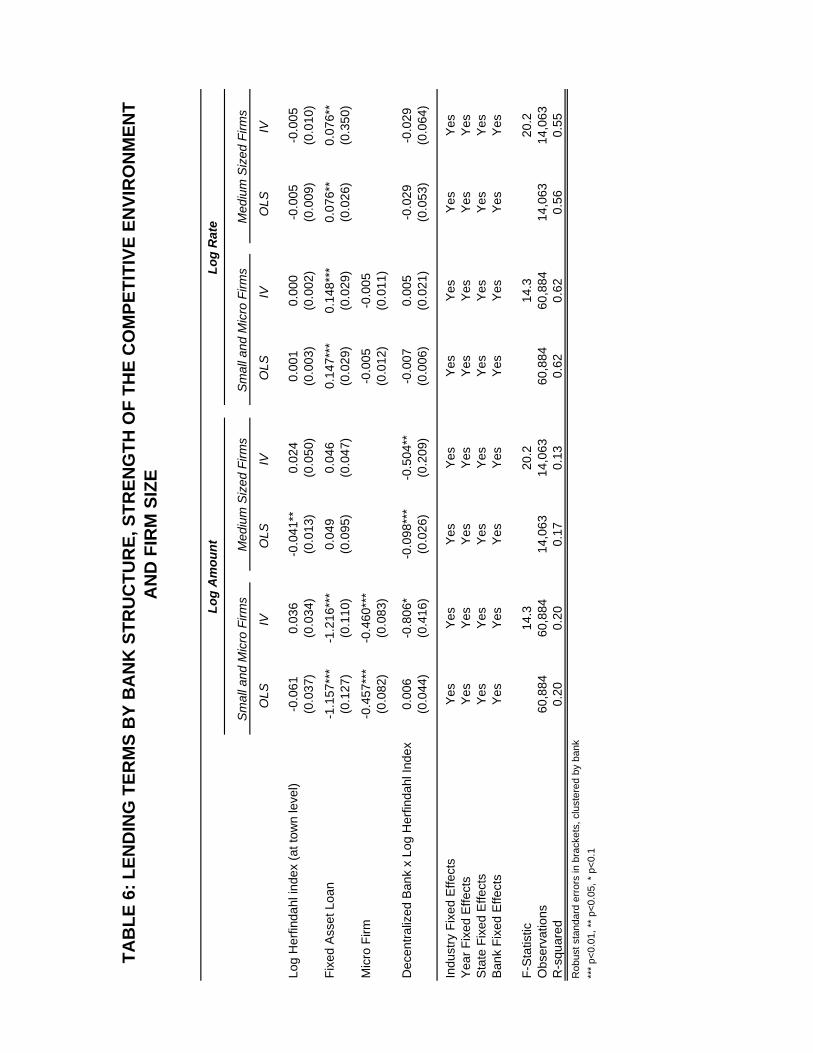
concentrated markets. This hypothesis is corroborated by looking at the interest rates
charged by banks. Although it seems as if decentralized banks charge less in concentrated
markets, this is in fact driven by selection. IV regressions show no difference in the rates
charged, once selection is accounted for. As can be seen in Table 6, this is particularly
true for small and micro firms. In fact, for some specifications, we also find evidence that
15

decentralized banks charge higher interest rates to these small and micro firms.
We provide further descriptive evidence of cherry picking in Table 7. Since our hypothesis
is that decentralized bank managers are more reactive to the institutional environment than
those in centralized banks, we should find that measures of lending activity should be more
constant across markets in centralized banks than in decentralized banks. In Table 7, we
show the share of lending activity for the different types of banks, broken down by firm
type and market concentration. We segment markets by those that are the 25% most
concentrated, the 25% most competitive and those in the middle 50% of concentration. Table
7 shows that for centralized banks, the share of their loans across these market types track
closely to the share of branches and moreover, are very similar for medium, small and micro
firms. On the other hand, decentralized firms are more likely to be aggressive in lending in
competitive markets, but to restrict credit access in concentrated markets. This is most true
of micro firms (whereas for medium firms the pattern looks much more similar to the pattern
in centralized banks). This "differences-in-differences" descriptive evidence where medium
firms look similar but micro firms do not, suggests that this pattern for decentralized banks
is not driven by a different relative share in branches for decentralized and centralized banks,
but rather by the conscious actions by branch managers.
5.3 Robustness Checks
One concern with our results is that they may just reflect a differential tolerance for risk
rather than a fundamental difference in the lending technology of different types of banks—
even if this cannot be reconciled with the systematic differences observed across competitive
environments.
To examine this further, we look at the default rates of firms across the different types of
banks. One limitation with our default data is that it has patchy information on the bank
associated with the default. That is, the database informs us whether a firm defaulted on a
loan, but for firms holding several loans we do not know which particular loan they defaulted
on. We therefore restrict our sample to firms that received a loan from only one bank. These
constitute 92% of the firms in our sample. The results from these regressions are reported in
Table 8.
16

In order to facilitate comparisons with the IV regressions, we first run linear probability
models where the dependent variable is a dummy variable that takes the value of 1 if the firm
defaulted on its loan. As can be seen from Table 8, small and micro firms tend to have higher
default rates, highlighting the fact that they are more risky. However, the results also show
that there are no differences in the propensity for loans given by type of bank to go default.
These results suggest that the differences in the lending terms being observed across banks
are a function of their lending technologies rather than differences in overall risk tolerance or
actual risk. Moreover, they would seem to suggest that, holding firm characteristics and risk
preferences stable, decentralized banks actually grant larger loans and manage to keep their
default rates at lower levels in competitive markets. The fact that loan size is associated
with higher default rates also suggests why decentralized banks seem to restrict credit in
un-competitive environments in addition to cherry picking their loans.
A second concern may be that banks of one type are inherently “better” at all they do
and, accordingly, our results only reflect these systematic performance differences. To rule
this out, we compare performance metrics for centralized vs. decentralized banks. Figures
2A, 2B, and 2C in the Appendix show quarterly ROE, delinquency,9 and efficiency metrics
for several banks as well as the weighted average of centralized and decentralized banks. It
can be seen that there is no clear pattern that indicates a systematic difference between the
two types of banks.10
Finally, one possible explanation for this may be the distinction between "foreign" and
"domestic" banks as opposed to the lending structure per se. While we cannot rule out this
possibility since foreign banks tend to have centralized lending structures while most of the
domestic banks do not, we believe that our results point to a specific mechanism related to
the organizational structure of foreign versus domestic banks (distinct from risk preferences)
that might explain the differential results related to bank lending that have been found in
prior work looking at bank lending in emerging markets (Mian, 2006; Detragiache et al 2008).
9Overal delinquency rates (of all lending activities) as reported to the National Banking Commission
(CNBV).10Comparisons of other metrics such as ROA, credit placement, default rates as well as performance by
activity (retail vs. commercial banking, etc.) yielded similar results.
17

6 Discussion and Conclusions
Small firms are especially dependent on external financing for their survival. The vast ma-
jority of their financing—especially in developed markets–tends to come from banks. Given
the size of such businesses, credit is often concentrated at a single intermediary where the
borrower has a lending relationship (Petersen and Rajan, 1994; Fluck et al, 1998). Since
small businesses, and particularly young small businesses, have little internal cash flow to
finance their operations, but are also associated with significant asymmetric information, a
potential concern for policy makers is that these businesses face credit constraints. This is
certainly the case in Mexico, where smaller firms mostly have to rely on expensive trade
credit or personal credit cards to finance their operations.
A large body of academic research has therefore focused on how the structure of the
banking industry – both in terms of the competitive environment for banks and in terms
of the organizational structure of banks themselves – is associated with product market
outcomes for small businesses.
However, the two streams of study – one focused on banking competition and the other
on bank structure – have remained largely independent of each other, and in fact, generated
contradictory findings. On the one hand, research on the organizational structure of banks has
focused on the benefits of a decentralized banking structure in the context of small business
lending. On the other hand, research looking at the small business lending suggests that
banking deregulation led to a widespread increase in entrepreneurial activity despite the wave
of mergers that led small, decentralized banks to fall significantly following the deregulations
(Black and Strahan 2000; Kerr and Nanda 2009). Viewed in the context of our findings,
however, these apparently contradictory findings make sense: while decentralized banks are
indeed better than centralized banks at alleviating credit constraints for small businesses in
competitive markets, they are in fact worse than centralized banks in concentrated banking
markets. Thus an increase in banking competition along-side an increase in centralized
banks due to the mergers would still have had a positive impact on entrepreneurship since
the reduction in monopoly power of small decentralized banks would have led to a positive
effect on small business lending, even if it came with the presence of larger, more centralized.
18
Our findings may also shed light on the finding by Erel (2006) that the M&A activity following
the US branch banking deregulations led to a sharp fall in the interest rates for firms, and
particularly for small businesses.
Our approach in this paper brings together the literature related to the organizational
structure of banks with the one looking at banking competition to look at how the interaction
between these two factors impacts the deal terms offered to small businesses. Our results
show that branch managers in decentralized banks are more sensitive to the local environment
than branch managers in centralized banks. They give more attractive terms to firms in
competitive banking markets, but are more likely to cherry pick firms and restrict credit in
areas where they have market power. Thus the extent to which decentralized banks alleviate
credit constraints depends critically on the competitive environment for banks.
Our results build on the empirical work of Berger et al (2005) who find that the orga-
nizational structure of banks can have important consequences for the small businesses that
seek credit in a given market. While they proxy for the decentralized nature of the lend-
ing technology using bank size, our in-depth qualitative interviews with the major banks in
Mexico allowed us to identify large banks with decentralized lending structures. Our results
therefore also speak to the hypothesis that Berger et al (2005) raise in their conclusion that
"a large organization might, at least to a degree, be able to enjoy the best of both worlds if
it sets up the internal structure that achieves the right level of decentralization." We are also
able to look at the rates of default for the different types of banks, so that we can show more
directly that the differences in deal terms seem to be driven more by the lending technology
of banks rather than other factors such as their inherent risk preferences.
Our findings have clear implications for public policy. Prior work has identified the relative
benefit of decentralized (small) banks in alleviating credit constraints among small businesses
– in the context of more competitive environments. It has thus has argued that the key issue
from a public policy standpoint may not be market power in the traditional Herfindahl-index
sense, but more about the choice of banks that firms have access to. Our results suggest
that both the organizational structure and the localized market power of a bank are relevant
for SME lending, and they should not be considered independently. This implication is also
related to other work looking a the importance of examining organizational structure within
19

the context of the institutional environment and not treating it in isolation (e.g. Raith 2003).
References
[1] Banerjee, A. V., S. Cole and E. Duflo (2003). “Bank Financing in India” , MIT Working
Paper.
[2] Banerjee, A. V. and E. Duflo (2004). What do Banks (not) do?, MIT Working Paper.
[3] Berger, A. N., L. F. Klapper, and G. F. Udell. 2001. “The ability of banks to lend
to informationally opaque small businesses.” Journal of Banking & Finance, 25:12, pp.
2127-67.
[4] Berger, A. N., N. H. Miller, M. A. Petersen, R. G. Rajan, and J. C. Stein. 2005. “Does
function follow organizational form? Evidence from the lending practices of large and
small banks.” Journal of Financial Economics, 76:2, pp. 237-69.
[5] Berger, A. N. and G. F. Udell. 1995. “Relationship lending and lines of credit in small
firm finance.” Journal of Business, 68:3, pp. 351-81.
[6] Berger, A. N. and G. F. Udell. 2002. “Small business credit availability and relationship
lending: The importance of bank organisational structure.” Economic Journal, 112:477,
pp. F32-F53.
[7] Bertrand, M., A. Schoar, and D. Thesmar. 2007. “Banking deregulation and industry
structure: Evidence from the French banking reforms of 1985.” Journal of Finance, 62:2,
pp. 597-628.
[8] Black, S. E. and P. E. Strahan. 2002. “Entrepreneurship and bank credit availability.”
The Journal of Finance, 57:6, pp. 2807-33.
[9] Cetorelli, N. 2004. “Real effects of bank competition.” Journal of Money, Credit and
Banking, 36:3, pp. 543-58.
[10] Cetorelli, N. and P. E. Strahan. 2006. “Finance as a barrier to entry: Bank competition
and industry structure in local U.S. markets.” The Journal of Finance, 61:1, pp. 437-61.
20

[11] Detragiache, E, T. Tressel, and P Gupta. “Foreign Banks in Poor Countries: Theory
and Evidence”. The Journal of Finance, 63:5, pp 2123-2159
[12] Erel, I. 2006. “The effect of bank mergers on loan prices: Evidence from the U.S.” Fisher
College of Business Working Paper No. 2006-03-002.
[13] Fluck, Z., D. Holtz-Eakin, and H. S. Rosen. 1998. “Where does the money come from?
The financing of small entrepreneurial enterprises.” NYU Stern Working Paper.
[14] Haber, S. 2004. "Mexico’s Experiments with Bank Privatization and Liberalization"
1991-2003, Stanford University Working Paper.
[15] Haber, S. and A. Musacchio. 2005. "Foreign Banks and the Mexican Economy," 1997-
2004, Stanford Center for International Development Working Paper.
[16] Kerr, W. R. and R. Nanda. 2009 "Democratizing Entry: Banking Deregulations, Financ-
ing Constraints, and Entrepreneurship". Journal of Financial Economics, 94:1, pp124-
149.
[17] King, R. G. and R. Levine. 1993b. “Finance, entrepreneurship, and growth - Theory and
evidence.” Journal of Monetary Economics, 32:3, pp. 513-42.
[18] Laeven, L. and C. Woodruff. 2007. “The Quality of the Legal System, Firm Ownership,
and Firm Size.” The Review of Economics and Statistics, 89:4, pp 601-614.
[19] Liberti, J. 2003 “Initiatives, Incentives and Soft Information. How does Delegation
Impact the Role of Bank Relationship Managers?” LBS Working paper.
[20] Mian, A. "Distance Constraints: The Limits of Foreign Lending in Poor Economies"
Journal of Finance, 61:3. pp1465-1505.
[21] Paravisini, D. 2005. “Constrained banks and constrained borrowers: The effect of bank
liquidity on the availability of credit.” Working Paper.
[22] Petersen, M. A. and R. G. Rajan. 1994. “The benefits of lending relationships - Evidence
from small business data.” Journal of Finance, 49:1, pp. 3-37.
21
[23] Petersen, M. A. and R. G. Rajan. 1995. “The effect of credit market competition on
lending relationships.” Quarterly Journal of Economics, 110:2, pp. 407-43.
[24] Stein, J. C. 2002. “Information production and capital allocation: Decentralized versus
hierarchical firms.” Journal of Finance, 57:5, pp. 1891-921.
[25] Unal, H. and M. Navarro 1999. "The Technical Process of Bank Privatization in Mexico."
Journal of Financial Services Research 16(Sept): 61-83.
[26] Zarutskie, R. 2006. “Evidence on the effects of bank competition on firm borrowing and
investment.” Journal of Financial Economics, 81, 503-37.
22
Sum
Mea
nC
apita
l Bud
getin
gLo
an T
ype
Clie
nt A
cqui
sitio
nA
djud
icat
ion
Inte
rest
Rat
eA
mou
ntC
olle
ctio
nB
ajio
33
33
23
320
2.86
NB
FI1
33
33
33
192.
71B
anor
te2
33
32
23
182.
57
San
tand
er1
12
21
12
101.
43B
anco
mer
21
11
11
29
1.29
Ban
amex
11
11
11
17
1.00
HS
BC
11
11
11
17
1.00
1C
entra
lly d
efin
edS
tand
ardi
zed
Pro
duct
Ban
k-w
ide
polic
yJu
st p
aram
etric
Fixe
d ra
teP
aram
etric
def
ined
Cen
tral o
ffice
flag
s
2N
egot
iate
d P
&L
Par
amet
ric p
lus
finan
cial
sP
aram
etric
de
fines
rang
eP
aram
etric
def
ines
ra
nge
Gen
eral
pol
icie
s,
bran
ch d
ecid
es
3E
ach
bran
ch h
as o
wn
P&
LP
oten
tial t
o cu
stom
ize
Bra
nch
defin
edM
anag
er's
dec
isio
nC
usto
miz
edFu
ll di
scre
tion
(to
limit)
Bra
nch
deci
des
Act
ivity
The
leve
l of c
entra
lizat
ion
varie
s fro
m 1
to 3
for e
ach
activ
ity. 1
mea
ns th
at th
e de
cisi
ons
surr
ound
ing
that
act
ivity
are
def
ined
by
the
bank
's H
Q. 3
mea
ns th
at th
ey a
re m
ade
entir
ely
by th
e br
anch
man
ager
.
TAB
LE 1
: LEV
EL O
F C
ENTR
ALI
ZATI
ON
BY
BA
NK
Total Medium Small MicroFraction of loans in database 100% 19% 22% 58%Average Number of Employees* 16 52 21 6
Loan Size (USD)Mean 29,738 43,661 31,327 24,70425% 10,000 26,000 15,000 8,600Median 22,000 47,000 23,000 15,70075% 40,300 50,000 38,900 33,000
Interest rate (%)Mean 19.2% 18.4% 19.2% 19.5%25% 17.0% 16.4% 17.0% 17.0%Median 19.1% 17.8% 19.0% 19.5%75% 22.0% 21.0% 22.0% 22.0%
Fixed Asset Loan share 4.6% 1.3% 1.0% 6.8%
Fraction in Manufacturing 39% 33% 32% 44%Fraction in Commerce 38% 43% 52% 32%Fraction in Services 23% 24% 16% 24%* Calculated on a subset (~ 70%) of firms for which data availble
TABLE 2A: DESCRIPTIVE STATISTICS BY TYPE OF FIRMDescriptive Statistics are based on 74,947 loans over the period January 2002 to June 2006

Total Decentralized Banks Centralized Banks
Fraction of loans in database 100% 16% 84%
Fraction in Manufacturing 100% 13.7% 86.3%Fraction in Commerce 100% 9.0% 91.0%Fraction in Services 100% 44.6% 55.4%
Fixed Asset Loan Share 4.6% 23.0% 0.4%
Average Loan Size (USD)All Firms 30,739 42,031 28,755Medium Firms 44,718 49,714 43,825Small Firms 31,054 45,019 29,537Micro Firms 25,778 38,946 23,073
Interest rate Mean 19.0% 15.8% 19.6%25% 17.0% 13.1% 17.0%Median 19.0% 16.0% 19.2%75% 21.9% 18.5% 22.0%
TABLE 2B: DESCRIPTIVE STATISTICS BY BANKS' LENDING STRUCTURE
Descriptive Statistics are based on 74,947 loans over the period January 2002 to June 2006
IV (1) (2) (3) (4) (5)
Log Herfindahl index (at town level) -0.025 -0.049 -0.061 -0.061* -0.060*(0.036) (0.043) (0.033) (0.032) (0.031)
Fixed Asset Loan -0.556 -0.537 -0.969*** -1.104*** -1.147***(0.299) (0.288) (0.121) (0.146) (0.140)
Micro Firm -0.760*** -0.755*** -0.810*** -0.935*** -1.010***(0.127) (0.130) (0.181) (0.159) (0.161)
Small Firm -0.418* -0.416* -0.416* -0.487** -0.586***(0.181) (0.181) (0.193) (0.187) (0.158)
Decentralized Bank x Micro 0.725*** 1.196**(0.191) (0.483)
Decentralized Bank x Small 0.399* 1.220*(0.207) (0.630)
Industry Fixed Effects Yes Yes Yes Yes YesYear Fixed Effects Yes Yes Yes Yes YesState Fixed Effects No Yes Yes Yes YesBank Fixed Effects No No Yes Yes Yes
F-Statistic on Decentralized x Micro 275.9F-Statistic on Decentralized x Small 127.4Observations 74,947 74,947 74,947 74,947 74,947R-squared 0.15 0.16 0.24 0.25 0.24Robust standard errors in brackets, clustered by bank*** p<0.01, ** p<0.05, * p<0.1
OLS Regressions
TABLE 3: LOAN SIZE BY BANKS' LENDING STRUCTURE
The dependent Variable is log of loan amount. All regressions include industry controls (Manufacturing, Commerce or Services) and year fixed effects. Models 2-5 include state fixed effects and Models 3-5 include bank fixed effects. Note that bank fixed effects imply that the main effect of decentralized banks is not identified, and hence is not reported in the tables. A firm is coded as "Micro" if the number of employees is under 15; "Small" if the number of employees is between 15 and 30. The omitted category, "Medium", is a firm with over 30 employees.

IV (1) (2) (3) (4) (5)
Log Herfindahl index (at town level) 0.016* 0.024** -0.001 -0.001 -0.001(0.008) (0.008) (0.002) (0.002) (0.002)
Fixed Asset Loan 0.077 0.073 0.157*** 0.137*** 0.142***(0.071) (0.067) (0.028) (0.026) (0.034)
Micro Firm 0.055** 0.054** 0.015 -0.003 0.001(0.017) (0.016) (0.018) (0.006) (0.010)
Small Firm 0.034** 0.033** 0.018 0.007 0.011(0.012) (0.011) (0.012) (0.011) (0.013)
Decentralized Bank x Micro 0.107*** 0.081(0.021) (0.056)
Decentralized Bank x Small 0.063* 0.040(0.031) (0.092)
Industry Fixed Effects Yes Yes Yes Yes YesYear Fixed Effects Yes Yes Yes Yes YesState Fixed Effects No Yes Yes Yes YesBank Fixed Effects No No Yes Yes Yes
F-Statistic on Decentralized x Micro 275.9F-Statistic on Decentralized x Small 127.4Observations 74,947 74,947 74,947 74,947 74,947R-squared 0.11 0.12 0.59 0.59 0.61Robust standard errors in brackets, clustered by bank*** p<0.01, ** p<0.05, * p<0.1
OLS Regressions
TABLE 4: INTEREST RATES BY BANKS' LENDING STRUCTURE
The dependent Variable is log of the interest rate on the loan. All regressions include industry controls (Manufacturing, Commerce or Services) and year fixed effects. Models 2-5 include state fixed effects and Models 3-5 include bank fixed effects. Note that bank fixed effects imply that the main effect of decentralized banks is not identified, and hence is not reported in the tables. A firm is coded as "Micro" if the number of employees is under 15; "Small" if the number of employees is between 15 and 30. The omitted category, "Medium", is a firm with over 30 employees.
OLS
OLS
IVO
LSO
LSIV
(1)
(2)
(3)
(4)
(5)
(6)
Log
Her
finda
hl in
dex
(at t
own
leve
l)-0
.025
-0.0
600.
039
-0.0
010.
000
-0.0
01(0
.022
)(0
.033
)(0
.036
)(0
.002
)(0
.003
)(0
.005
)
Fixe
d A
sset
Loa
n-0
.975
***
-0.9
69**
*-1
.023
***
0.15
9***
0.15
6***
0.15
7***
(0.1
21)
(0.1
23)
(0.1
03)
(0.0
30)
(0.0
28)
(0.0
28)
Mic
ro F
irm-0
.813
***
-0.8
10**
*-0
.814
***
0.01
60.
015
0.01
5(0
.183
)(0
.181
)(0
.180
)(0
.018
)(0
.018
)(0
.018
)
Sm
all F
irm-0
.416
*-0
.416
*-0
.417
*0.
018
0.01
80.
018
(0.1
94)
(0.1
93)
(0.1
92)
(0.0
13)
(0.0
12)
(0.0
12)
Dec
entra
lized
Ban
k x
Log
Her
finda
hl In
dex
-0.0
20-0
.008
-0.7
94**
-0.0
16**
-0.0
14*
-0.0
05(0
.046
)(0
.035
)(0
.322
)(0
.005
)(0
.007
)(0
.029
)
Indu
stry
Fix
ed E
ffect
sY
esY
esY
esY
esY
esY
esY
ear F
ixed
Effe
cts
Yes
Yes
Yes
Yes
Yes
Yes
Sta
te F
ixed
Effe
cts
No
Yes
Yes
No
Yes
Yes
Ban
k Fi
xed
Effe
cts
Yes
Yes
Yes
Yes
Yes
Yes
F-S
tatis
tic21
.57
21.5
7O
bser
vatio
ns74
,947
74,9
4774
,947
74,9
4774
,947
74,9
47R
-squ
ared
0.23
0.23
0.23
0.60
0.61
0.59
Rob
ust s
tand
ard
erro
rs in
bra
cket
s, c
lust
ered
by
bank
***
p<0.
01, *
* p<
0.05
, * p
<0.1
Log
Am
ount
Log
Rat
e
TAB
LE 5
: LEN
DIN
G T
ERM
S B
Y B
AN
K S
TRU
CTU
RE
AN
D T
HE
STR
ENG
TH O
F TH
E C
OM
PETI
TIVE
EN
VIR
ON
MEN
T
The
depe
nden
t var
iabl
es a
re lo
g of
loan
siz
e an
d lo
g of
the
inte
rest
rate
on
the
loan
. A
ll re
gres
sion
s in
clud
e in
dust
ry c
ontro
ls (M
anuf
actu
ring,
Com
mer
ce o
r S
ervi
ces)
and
yea
r fix
ed e
ffect
s an
d ba
nk fi
xed
effe
cts.
Mod
els
2-3
and
5-6
incl
ude
stat
e fix
ed e
ffect
s. N
ote
that
ban
k fix
ed e
ffect
s im
ply
that
the
mai
n ef
fect
of
dece
ntra
lized
ban
ks is
not
iden
tifie
d, a
nd h
ence
is n
ot re
porte
d in
the
tabl
es.
The
varia
ble
"Log
Her
finda
hl in
dex"
is a
(tim
e va
ryin
g) H
HI i
ndex
of b
ank
com
petit
ion
base
d on
the
num
ber o
f bra
nche
s of
diff
eren
t ban
ks in
eac
h to
wn
in e
ach
year
. A
firm
is c
oded
as
"Mic
ro" i
f the
num
ber o
f em
ploy
ees
is u
nder
15;
"Sm
all"
if th
e nu
mbe
r of e
mpl
oyee
s is
bet
wee
n 15
and
30.
The
om
itted
cat
egor
y, "M
ediu
m",
is a
firm
with
ove
r 30
empl
oyee
s.
OLS
IVO
LSIV
OLS
IVO
LSIV
Log
Her
finda
hl in
dex
(at t
own
leve
l)-0
.061
0.03
6-0
.041
**0.
024
0.00
10.
000
-0.0
05-0
.005
(0.0
37)
(0.0
34)
(0.0
13)
(0.0
50)
(0.0
03)
(0.0
02)
(0.0
09)
(0.0
10)
Fixe
d A
sset
Loa
n-1
.157
***
-1.2
16**
*0.
049
0.04
60.
147*
**0.
148*
**0.
076*
*0.
076*
*(0
.127
)(0
.110
)(0
.095
)(0
.047
)(0
.029
)(0
.029
)(0
.026
)(0
.350
)
Mic
ro F
irm-0
.457
***
-0.4
60**
*-0
.005
-0.0
05(0
.082
)(0
.083
)(0
.012
)(0
.011
)
Dec
entra
lized
Ban
k x
Log
Her
finda
hl In
dex
0.00
6-0
.806
*-0
.098
***
-0.5
04**
-0.0
070.
005
-0.0
29-0
.029
(0.0
44)
(0.4
16)
(0.0
26)
(0.2
09)
(0.0
06)
(0.0
21)
(0.0
53)
(0.0
64)
Indu
stry
Fix
ed E
ffect
sY
esY
esY
esY
esY
esY
esY
esY
esY
ear F
ixed
Effe
cts
Yes
Yes
Yes
Yes
Yes
Yes
Yes
Yes
Sta
te F
ixed
Effe
cts
Yes
Yes
Yes
Yes
Yes
Yes
Yes
Yes
Ban
k Fi
xed
Effe
cts
Yes
Yes
Yes
Yes
Yes
Yes
Yes
Yes
F-S
tatis
tic14
.320
.214
.320
.2O
bser
vatio
ns60
,884
60,8
8414
,063
14,0
6360
,884
60,8
8414
,063
14,0
63R
-squ
ared
0.20
0.20
0.17
0.13
0.62
0.62
0.56
0.55
Rob
ust s
tand
ard
erro
rs in
bra
cket
s, c
lust
ered
by
bank
***
p<0.
01, *
* p<
0.05
, * p
<0.1
Sm
all a
nd M
icro
Firm
sM
ediu
m S
ized
Firm
sS
mal
l and
Mic
ro F
irms
Med
ium
Siz
ed F
irms
TAB
LE 6
: LEN
DIN
G T
ERM
S B
Y B
AN
K S
TRU
CTU
RE,
STR
ENG
TH O
F TH
E C
OM
PETI
TIVE
EN
VIR
ON
MEN
T A
ND
FIR
M S
IZE
Log
Am
ount
Log
Rat
e

25%
mos
t co
ncen
trate
d m
arke
tsIn
term
edia
te
mar
kets
25 %
mos
t co
mpe
titiv
e m
arke
tsTo
tal
25%
mos
t co
ncen
trate
d m
arke
tsIn
term
edia
te
mar
kets
25 %
mos
t co
mpe
titiv
e m
arke
tsTo
tal
Sha
re o
f loa
ns to
Med
ium
firm
s24
%49
%27
%10
0%25
%46
%28
%10
0%
Sha
re o
f loa
ns to
Sm
all f
irms
24%
50%
26%
100%
24%
47%
29%
100%
Sha
re o
f loa
ns to
Mic
ro fi
rms
27%
51%
22%
100%
21%
39%
40%
100%
Cen
tral
ized
Ban
ksD
ecen
tral
ized
Ban
ks
TAB
LE 7
: SH
AR
E O
F TO
TAL
LOA
NS
BY
MA
RK
ET C
ON
CEN
TRA
TIO
N A
ND
BA
NK
ST
RU
CTU
RE

(2) (3) (5) (6)
Log Herfindahl index (at town level) 0.003 0.003 0.003 -0.002-0.002 (0.002) (0.002) (0.008)
Fixed Asset Loan -0.014 -0.012 -0.025 -0.009(0.011) (0.010) (0.027) (0.005)
Log amount 0.003* 0.003* 0.002 0.003*(0.001) (0.001) (0.001) (0.002)
Log rate -0.011 -0.01 -0.017 -0.009(0.008) (0.008) (0.014) (0.006)
Micro Firm 0.004** 0.005** (0.003) 0.006*(0.002) (0.002) (0.004) (0.002)
Small Firm 0.003 0.004* 0.004 0.004*(0.002) (0.002) (0.003) (0.002)
Decentralized Bank x Micro 0.008 0.043(0.005) (0.046)
Decentralized Bank x Small 0.006 -0.024(0.004) (0.059)
Decentralized Bank x Log Herfindahl Index 0.000 0.044(0.002) (0.097)
Industry Fixed Effects Yes Yes Yes YesYear Fixed Effects Yes Yes Yes YesState Fixed Effects Yes Yes Yes YesBank Fixed Effects Yes Yes Yes Yes
F-Statistic on Decentralized x Micro 255.7F-Statistic on Decentralized x Small 120.2F-Statistic on Decentralized x HHI 20.3Observations 69,344 69,344 69,344 69,344R-squared 0.02 0.02 0.02 0.02Robust standard errors in brackets, clustered at the bank level*** p<0.01, ** p<0.05, * p<0.1
OLS Regressions IV Regressions
TABLE 8: LOAN DEFAULTS BY BANK STRUCTURE
The dependent variable takes a value of 1 if the firm defaulted on the loan. All regressions include industry controls (Manufacturing, Commerce or Services) and year fixed effects, state fixed effects and bank fixed effects. Note that bank fixed effects imply that the main effect of decentralized banks is not identified, and hence is not reported in the tables. The number of observations in these regressions are lower because the default database does not have consistent data on the bank associated with the default. We therefore restrict these regressions to those firms that only took a loan from a single bank. This constitutes the vast majority of firms, although a few firms are seen to take multiple loans from different banks.

year Decentralized Centralized2002 76.20% 73.80%2003 73.90% 73.70%2004 81.70% 80.80%2005 81.90% 81.10%2006 82.30% 80.90%
year All municipalitiesMunicipalities with above median HHI
2002 23.74% 20.96%2003 24.10% 17.13%2004 23.83% 15.96%2005 24.42% 16.18%2006 24.33% 15.51%
Appendix 1
TABLE A1: Share of branches in states with above median SME businesses per capita, by type of bank organization
structure
TABLE A2: Ratio of the number of decentralized to centralized bank branches


