NPL Management Ltd - Internal
The Application of Differential
Absorption Lidar (DIAL) for Pollutant
Emissions Monitoring
Rod Robinson
Jan 2015
Environmental Measurements Group - Analytical Science Division
National Physical Laboratory
Teddington
www.npl.co.uk/environment
NPL Management Ltd - Internal
Outline of Presentation
Introduction and brief background
Fugitive emissions – requirement for monitoring
The Differential Absorption Lidar (DIAL) Technique
Examples of Measurement and Applications
NPL Management Ltd - Internal
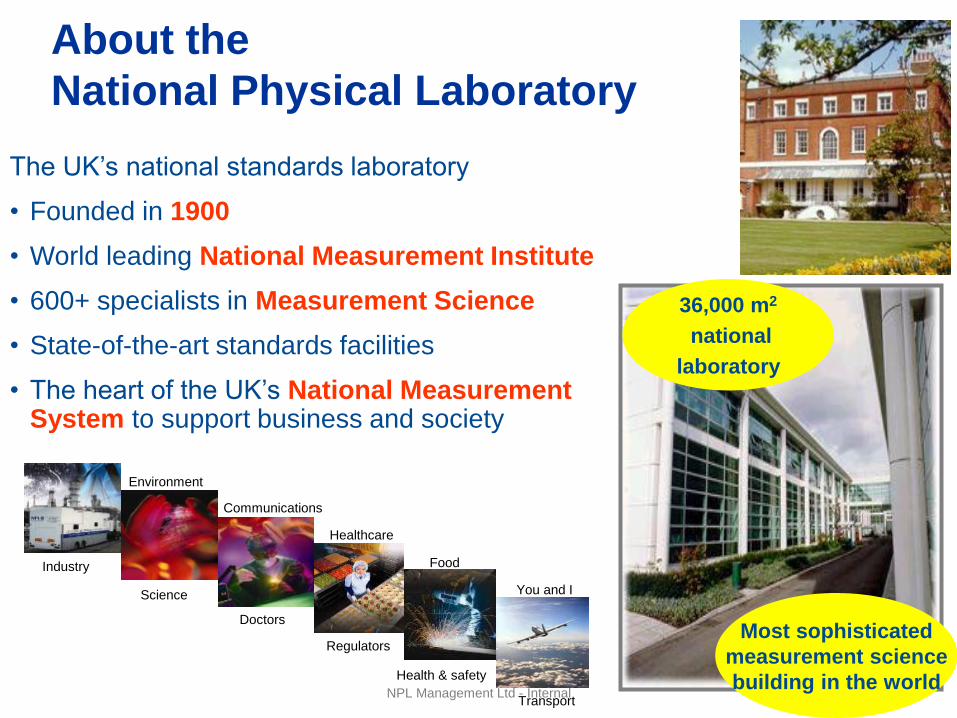
About the
National Physical Laboratory
The UK’s national standards laboratory
• Founded in 1900
• World leading National Measurement Institute
• 600+ specialists in Measurement Science
• State-of-the-art standards facilities
• The heart of the UK’s National Measurement System to support business and society
36,000 m2
national
laboratory
Most sophisticated
measurement science
building in the world
You and I
Regulators
Doctors
Science
Industry
Communications
Environment
Healthcare
Food
Health & safety
Transport
NPL Management Ltd - Internal
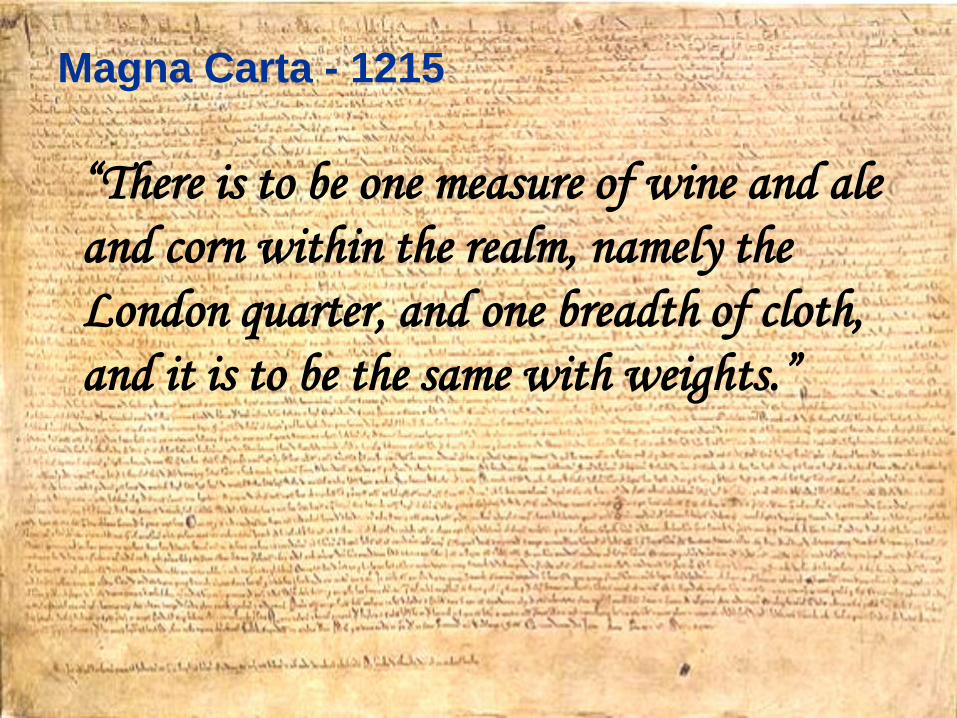
“There is to be one measure of wine and ale
and corn within the realm, namely the
London quarter, and one breadth of cloth,
and it is to be the same with weights.”
Magna Carta - 1215

NPL Management Ltd - Internal
The invention of Radar 1935

NPL Management Ltd - Internal
Environmental Measurements
Group
Measurements of pollutants and Greenhouse Gases in ambient air, point source and fugitive emissions
Data management, QA/QC and consultancy services for industry, government and universities
Underpinned by UK National Measurement System research on the metrology of gases and particulates
All our measurements are directly traceable to NPL gas standards
NPL Management Ltd - Internal
What are Fugitive Emissions?
Fugitive emissions are those emissions which are not controlled
Generally leaks from seals, valves, or other components
Emissions estimated from leak detection and repair programmes
99% of emissions from 0.1 % leaks
Methods require ~ 10-20 % of components to be assessed
Models
Landfill model – GasSim
AP 42 - TANKS – based on emissions factors
Regulations are currently based on modelled
and calculated emissions
Various studies have shown measured total-site emissions from refineries could be as much as a factor of 10 higher than calculated
There have also been observed mismatches between ambient concentrations and source terms

NPL Management Ltd - Internal
Refinery Emissions
Data from A. Cuclis, HARC, 2008
Typical Estimated
Emission
12 barrels
per 100,000
NPL Management Ltd - Internal
(An old) example – Houston Air
Quality
Studies in Houston –TEXAQS 2000, TEXAQS II have shown
predicted Non Methane Volatile Hydrocarbon concentrations
(NMVOC) were an order of magnitude too low
Ozone formation critical issue
Benzene ambient levels also exceeding limits
Improved measurements required to identify sources of VOCs
and benzene
“The latest available emission inventories underestimate ethene
emissions by approximately an order of magnitude”
Final Rapid Science Synthesis Report: Findings from the
Second Texas Air Quality Study (TexAQS II)
NPL Management Ltd - Internal
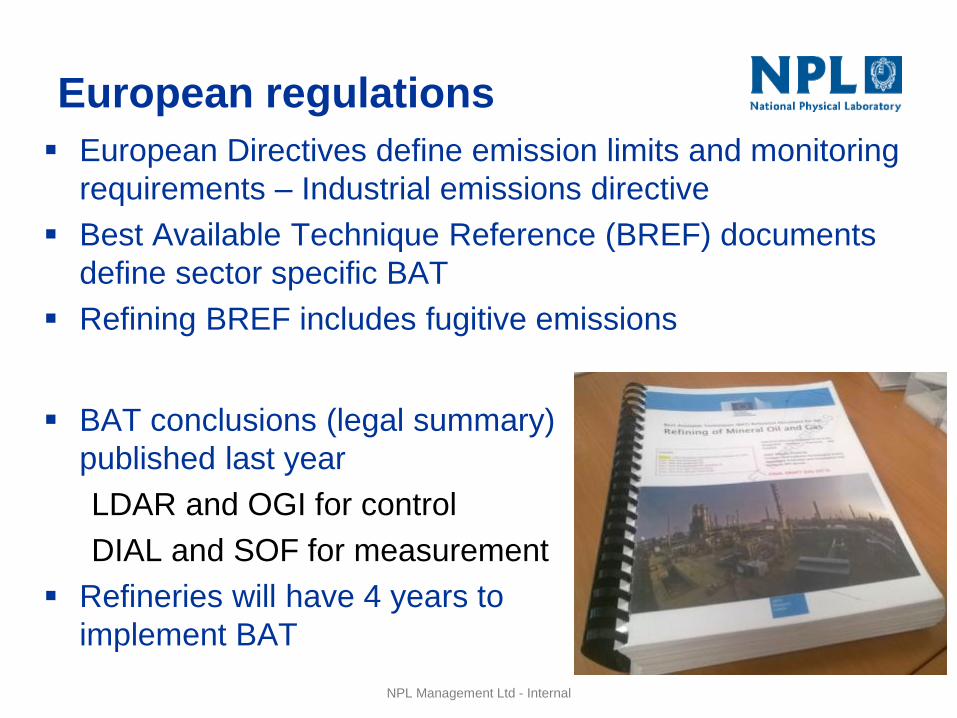
European regulations
European Directives define emission limits and monitoring
requirements – Industrial emissions directive
Best Available Technique Reference (BREF) documents
define sector specific BAT
Refining BREF includes fugitive emissions
BAT conclusions (legal summary)
published last year
LDAR and OGI for control
DIAL and SOF for measurement
Refineries will have 4 years to
implement BAT

NPL Management Ltd - Internal
European Standard Development
Development of European standard to cover methods in refinery
BREF
Determine Fugitive and Diffuse emissions
DIAL, SOF, OGI, Tracer, Sniffing (EN 15446), Flux box,
Calculations
Standard currently being developed
I am chairing this committee (TC 264, WG38)
Intention is to validate the standard with 2 field campaigns
Structure is a framework enabling user to select correct
measurement tool and methods/ QA/QC to carry out each
technique
DIAL will be validated and standardised as a method
for fugitive VOC measurement
NPL Management Ltd - Internal
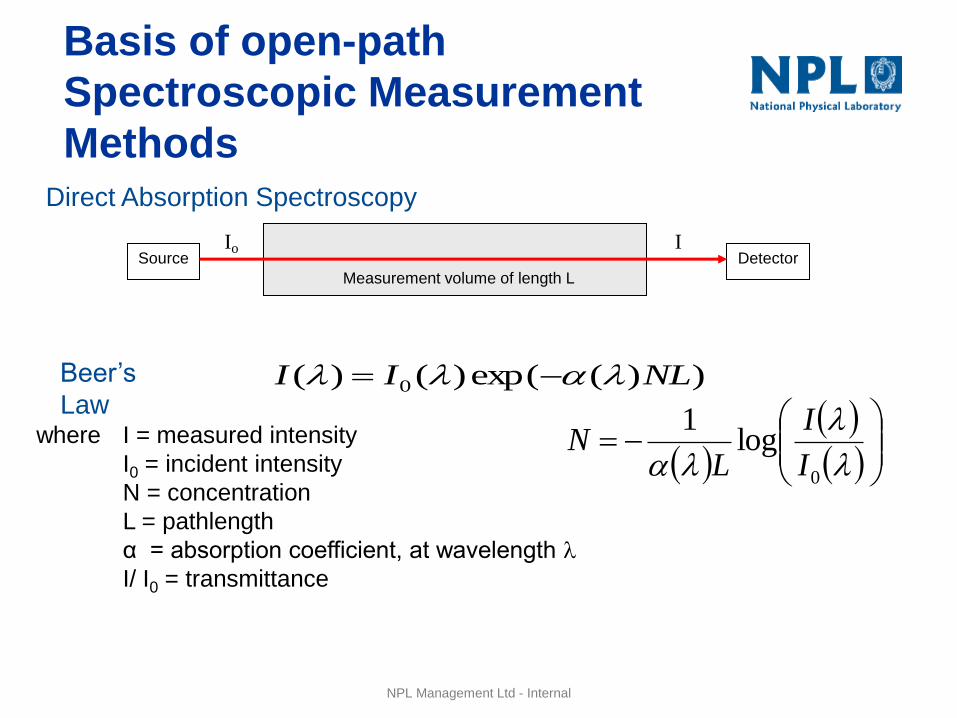
Basis of open-path
Spectroscopic Measurement
Methods
Source Detector
Resonant cavity with HR mirrors Measurement volume of length L
Direct Absorption Spectroscopy
0
log1
I
I
LN
Beer’s
Law ))(exp()()( 0 NLII
where I = measured intensity
I0 = incident intensity
N = concentration
L = pathlength
α = absorption coefficient, at wavelength
I/ I0 = transmittance
Io I
NPL Management Ltd - Internal
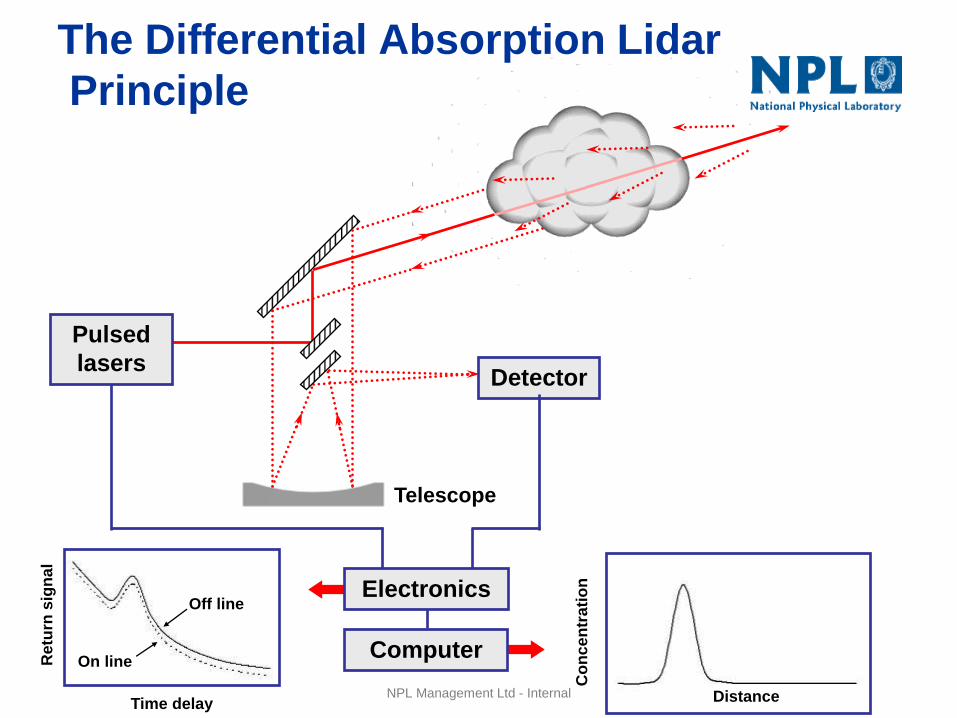
The Differential Absorption Lidar
Principle
Co
nc
en
tra
tio
n
Re
turn
sig
na
l
Time delay Distance
Detector
Telescope
Off line
On line
Pulsed
lasers
Electronics
Computer

NPL Management Ltd - Internal
NPL Differential Absorption
LIDAR (DIAL)
• Optical Radar
• Range resolved concentration
• Able to measure wide range of species
VOCs including methane, ethene, methanol, and general hydrocarbons
SO2, NO2, NO, Hg, HCl
Benzene, Toluene, Xylenes
• Spatial resolution <8 metres
• Range up to 3 km
• Measurement sensitivity typically 50 ppb
NPL Management Ltd - Internal
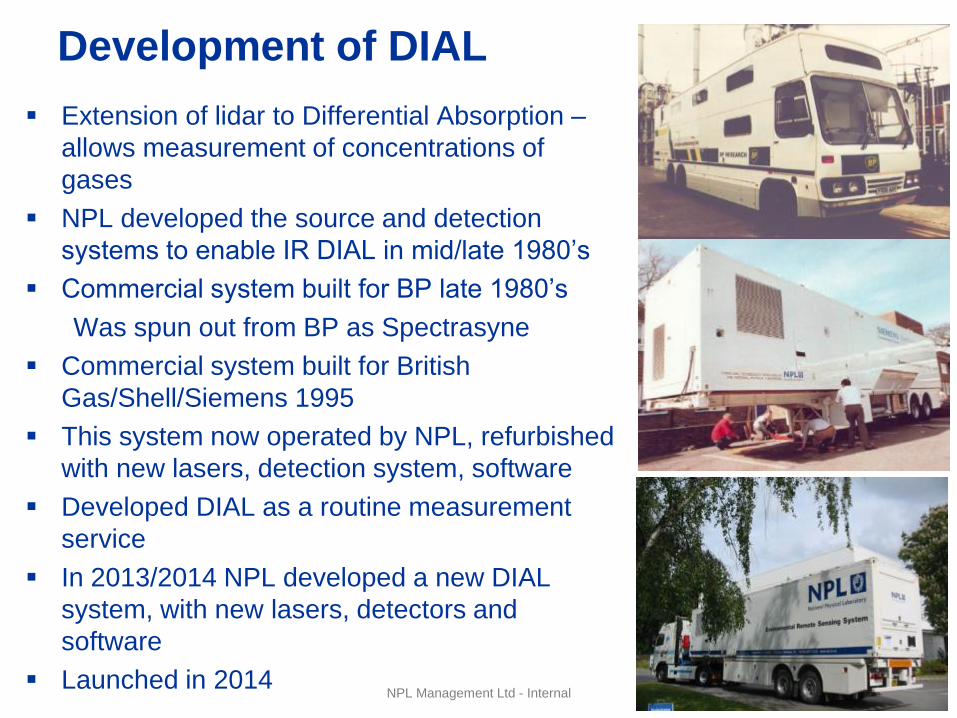
Development of DIAL
Extension of lidar to Differential Absorption –
allows measurement of concentrations of
gases
NPL developed the source and detection
systems to enable IR DIAL in mid/late 1980’s
Commercial system built for BP late 1980’s
Was spun out from BP as Spectrasyne
Commercial system built for British
Gas/Shell/Siemens 1995
This system now operated by NPL, refurbished
with new lasers, detection system, software
Developed DIAL as a routine measurement
service
In 2013/2014 NPL developed a new DIAL
system, with new lasers, detectors and
software
Launched in 2014
NPL Management Ltd - Internal
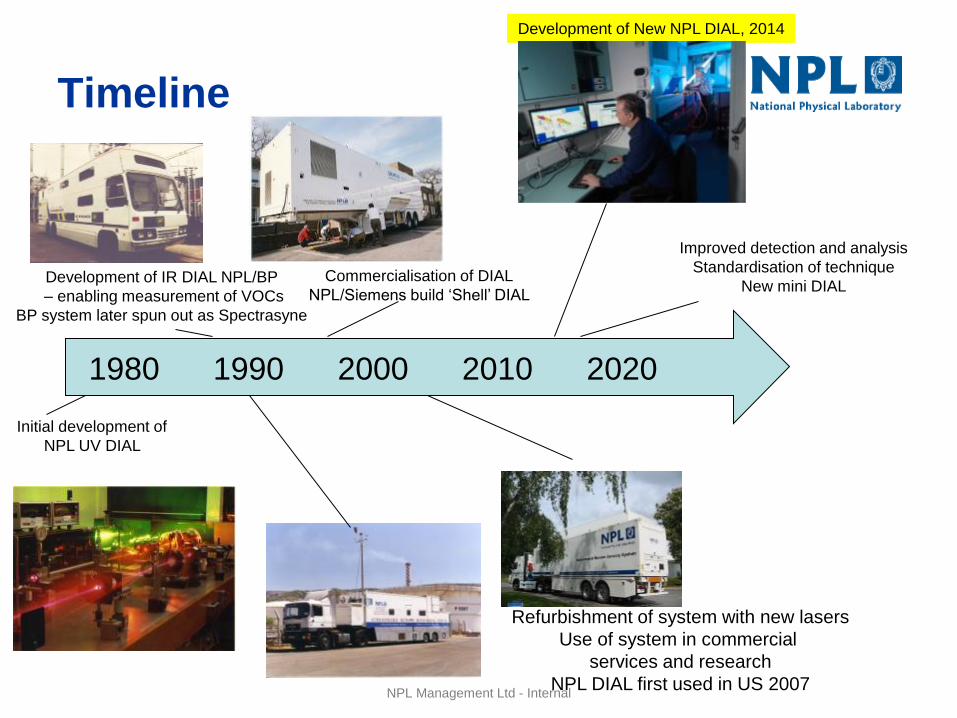
Timeline
1980 1990 2000 2010 2020
Improved detection and analysis
Standardisation of technique
New mini DIAL
Refurbishment of system with new lasers
Use of system in commercial
services and research
NPL DIAL first used in US 2007
Development of New NPL DIAL, 2014
Initial development of
NPL UV DIAL
Development of IR DIAL NPL/BP
– enabling measurement of VOCs
BP system later spun out as Spectrasyne
Commercialisation of DIAL
NPL/Siemens build ‘Shell’ DIAL
NPL Management Ltd - Internal
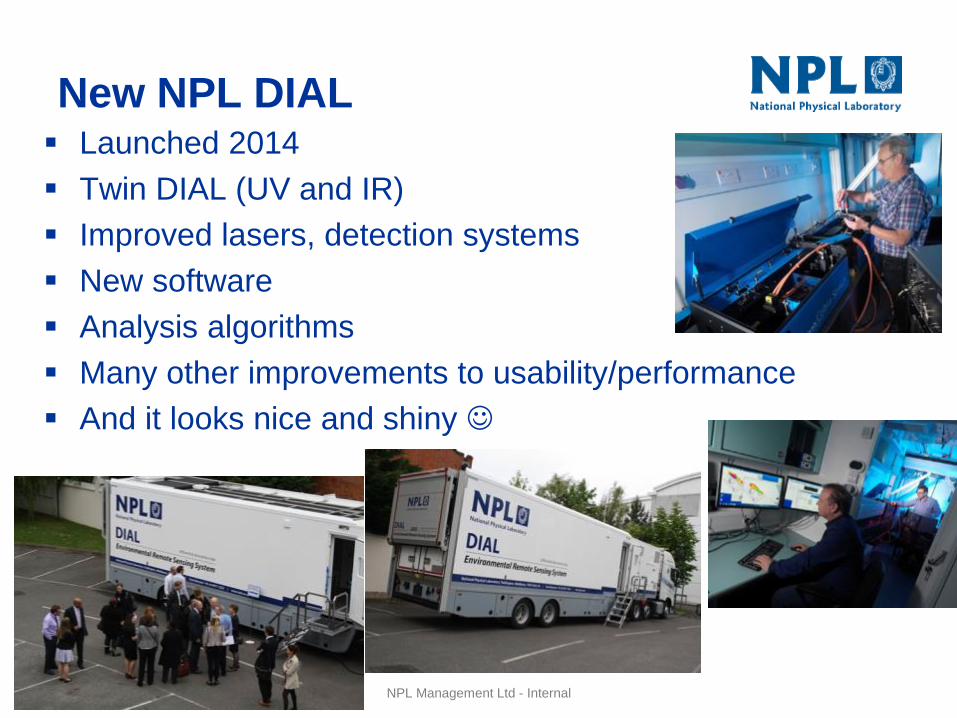
New NPL DIAL Launched 2014
Twin DIAL (UV and IR)
Improved lasers, detection systems
New software
Analysis algorithms
Many other improvements to usability/performance
And it looks nice and shiny
NPL Management Ltd - Internal
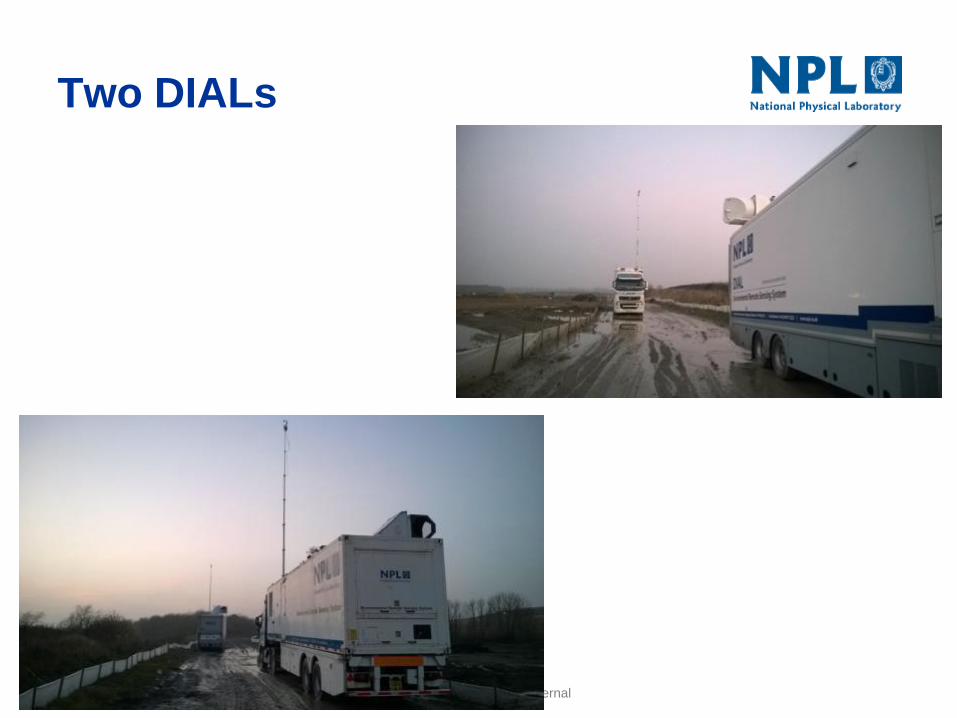
Two DIALs

NPL Management Ltd - Internal
Flux
Uncertainty(2)
Nitric oxide 5 ppbv 7.0% 500 m
Sulphur dioxide 10 ppbv 7.2% 3 km
Ozone 5 ppbv 7.0% 2 km
Benzene 10 ppbv 7.2% 800 m
Toluene 10 ppbv 7.2% 800 m
Species Sensitivity(1)
Maximum
range(3)
Flux
Uncertainty(2)
Methane 50 ppbv 12.3% 1 km
Ethane 20 ppbv 8.0% 800 m
Ethene 10 ppbv 7.2% 800 m
Ethyne 40 ppbv 10.7% 800 m
General
hydrocarbons 40 ppbv
10.7%
800 m
Hydrogen
chloride 20 ppbv
8.0%
1 km
Methanol 200 ppbv 41.4% 500 m
Nitrous oxide 100 ppbv 21.5% 800 m
Species Sensitivity(1)
Maximum
range(3)
Typical NPL DIAL Performance
(older system)
Note 1. 50m wide plume, 200m from DIAL
Note 2. Expanded uncertainty, based on typical sensitivity, with an assigned flux of 50 kg/hr, wind speed of 4 m/s with an uncertainty of 1% and wind direction uncertainty of 5 degrees
Note 3. The range value represents the typical working maximum range for the NPL DIAL system.
NPL Management Ltd - Internal
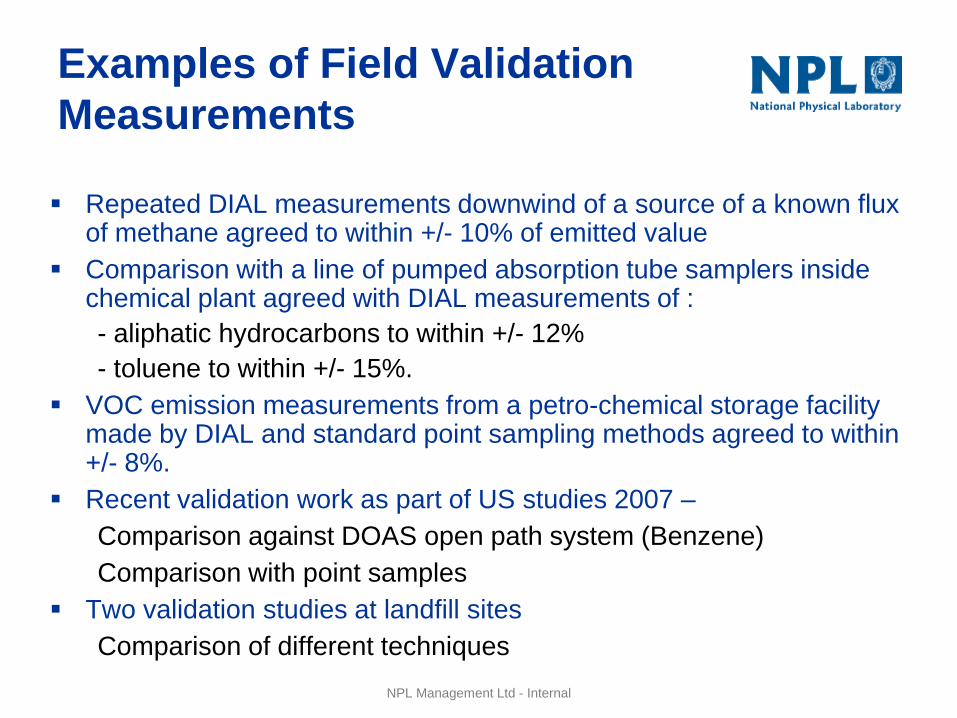
Examples of Field Validation
Measurements
Repeated DIAL measurements downwind of a source of a known flux of methane agreed to within +/- 10% of emitted value
Comparison with a line of pumped absorption tube samplers inside chemical plant agreed with DIAL measurements of :
- aliphatic hydrocarbons to within +/- 12%
- toluene to within +/- 15%.
VOC emission measurements from a petro-chemical storage facility made by DIAL and standard point sampling methods agreed to within +/- 8%.
Recent validation work as part of US studies 2007 –
Comparison against DOAS open path system (Benzene)
Comparison with point samples
Two validation studies at landfill sites
Comparison of different techniques
NPL Management Ltd - Internal
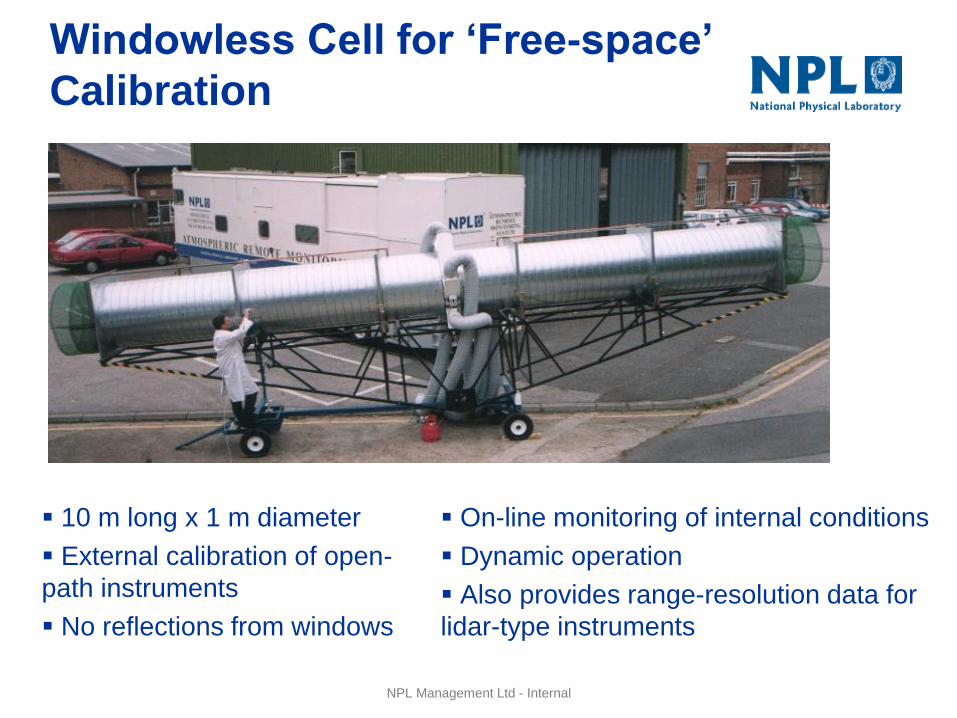
Windowless Cell for ‘Free-space’
Calibration
10 m long x 1 m diameter
External calibration of open-
path instruments
No reflections from windows
On-line monitoring of internal conditions
Dynamic operation
Also provides range-resolution data for
lidar-type instruments

NPL Management Ltd - Internal
Vertical scans
enable plume
mapping and flux
calculation
Combine
integrated
concentration with
simple wind field
to give flux
Can measure
away from source
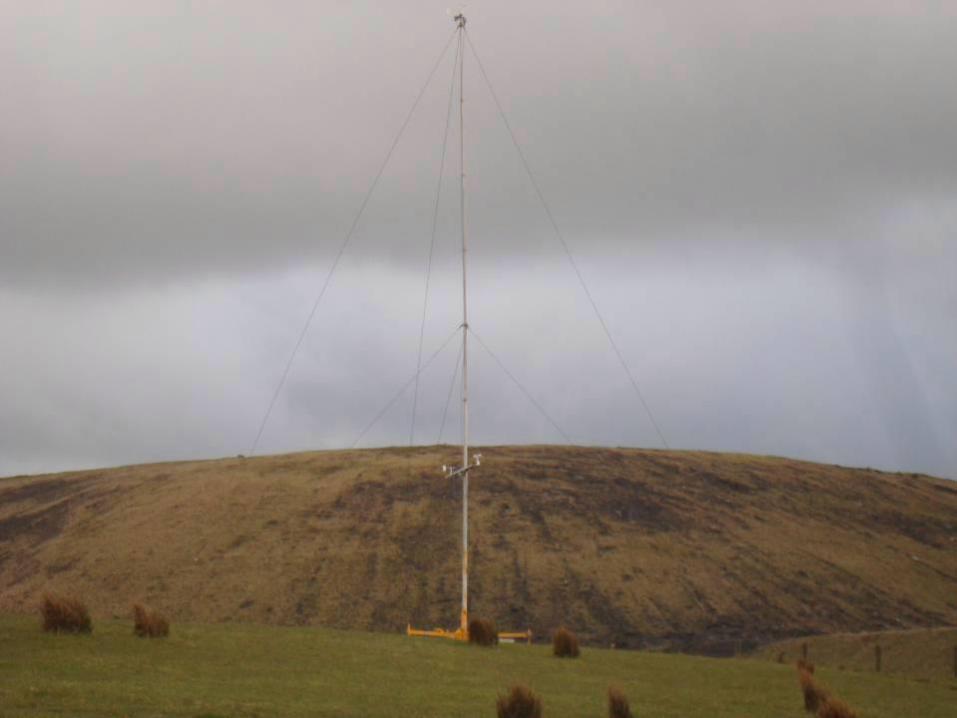
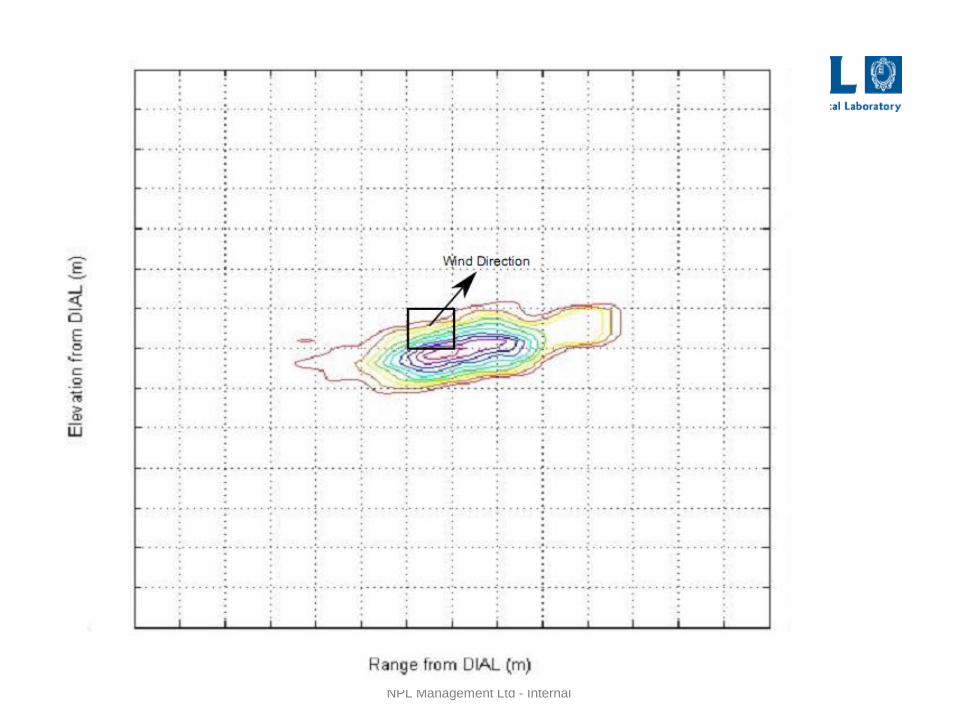
DIAL Measurement Configuration
for Emission Rate (Flux)
Measurement
NPL Management Ltd - Internal
NPL Management Ltd - Internal
NPL Management Ltd - Internal

NPL Management Ltd - Internal
Flux calculation
Concentration profile measured in vertical plane
Wind speed and direction measured on mast at two heights
(11m and 3m) plus portable (tripod) and DIAL sensors
Wind averaged over period of DIAL scan (vector average)
Vertical wind profile determined from simple neutral condition
model (u(z)=a.ln(z)-b)
Component of wind normal to measurement plane used and
calculated at each ‘cell’ (3.75m x 3.75m)
Flux determined for each cell (conc * perpendicular wind)
Total flux determined from sum all cells

NPL Management Ltd - Internal
Typical DIAL measurement
benzene
ppm

NPL Management Ltd - Internal
DIAL Can Identify and Quantify
Emissions from an Industrial Plant
wind

NPL Management Ltd - Internal
DIAL Can Identify and Quantify
Emissions from an Industrial Plant
wind
NPL Management Ltd - Internal
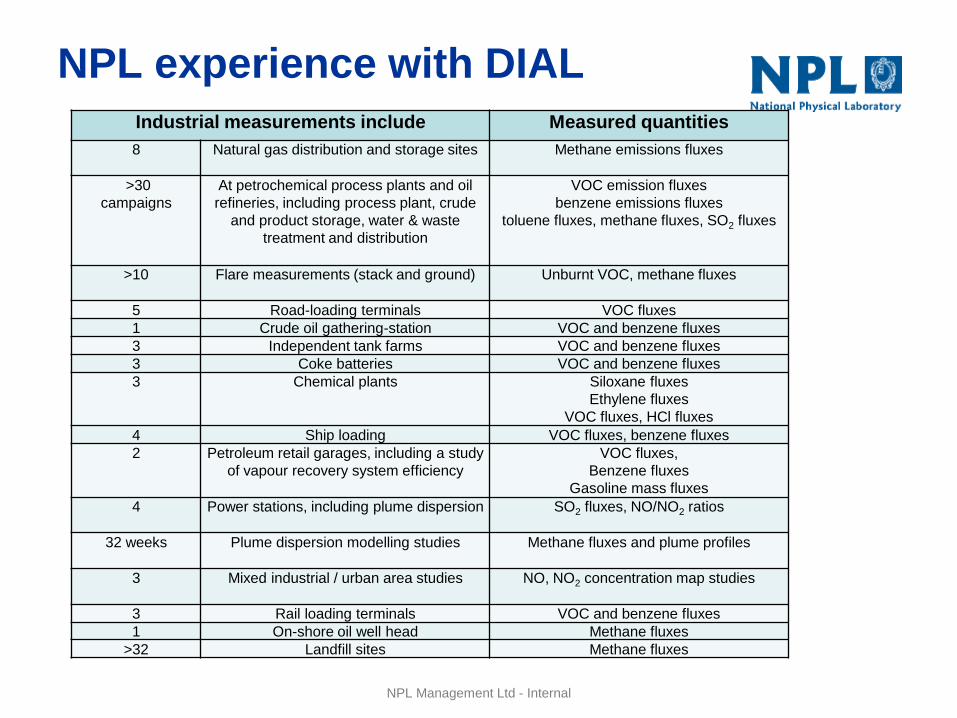
NPL experience with DIAL
Industrial measurements include Measured quantities
8 Natural gas distribution and storage sites Methane emissions fluxes
>30
campaigns
At petrochemical process plants and oil
refineries, including process plant, crude
and product storage, water & waste
treatment and distribution
VOC emission fluxes
benzene emissions fluxes
toluene fluxes, methane fluxes, SO2 fluxes
>10 Flare measurements (stack and ground) Unburnt VOC, methane fluxes
5 Road-loading terminals VOC fluxes
1 Crude oil gathering-station VOC and benzene fluxes
3 Independent tank farms VOC and benzene fluxes
3 Coke batteries VOC and benzene fluxes
3 Chemical plants Siloxane fluxes
Ethylene fluxes
VOC fluxes, HCl fluxes
4 Ship loading VOC fluxes, benzene fluxes
2 Petroleum retail garages, including a study
of vapour recovery system efficiency
VOC fluxes,
Benzene fluxes
Gasoline mass fluxes
4 Power stations, including plume dispersion SO2 fluxes, NO/NO2 ratios
32 weeks Plume dispersion modelling studies Methane fluxes and plume profiles
3 Mixed industrial / urban area studies NO, NO2 concentration map studies
3 Rail loading terminals VOC and benzene fluxes
1 On-shore oil well head Methane fluxes
>32 Landfill sites Methane fluxes

NPL Management Ltd - Internal
Area source simulator
Development of a portable facility to test and validate techniques used for
fugitive emissions monitoring
Will be able to reproduce a wide range of emission characteristics
Range of pure or mixed ratio gases
Traceable emission rates up to 55 kg/hr
Different emission nodes (line, point, area sources) can be combined
Developing validation protocols
Including a specific project on shale gas

NPL Management Ltd - Internal
EXAMPLES OF NPL DIAL
MEASUREMENTS
NPL Management Ltd - Internal
DIAL Measurements at
Cement Works
NPL Management Ltd - Internal
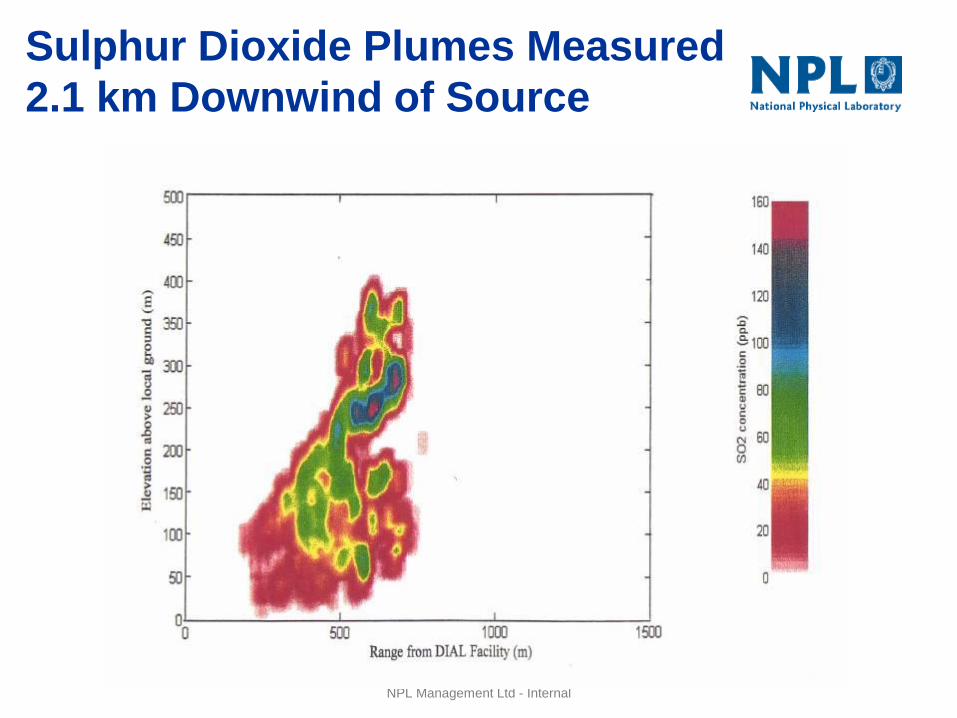
Sulphur Dioxide Plumes Measured
2.1 km Downwind of Source
NPL Management Ltd - Internal
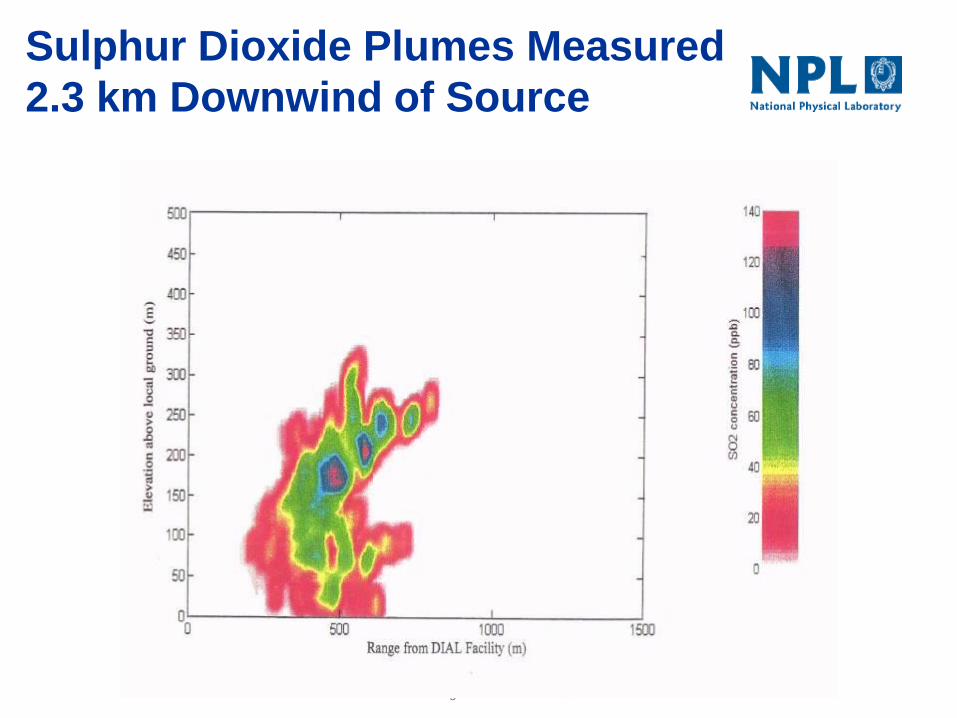
Sulphur Dioxide Plumes Measured
2.3 km Downwind of Source
NPL Management Ltd - Internal
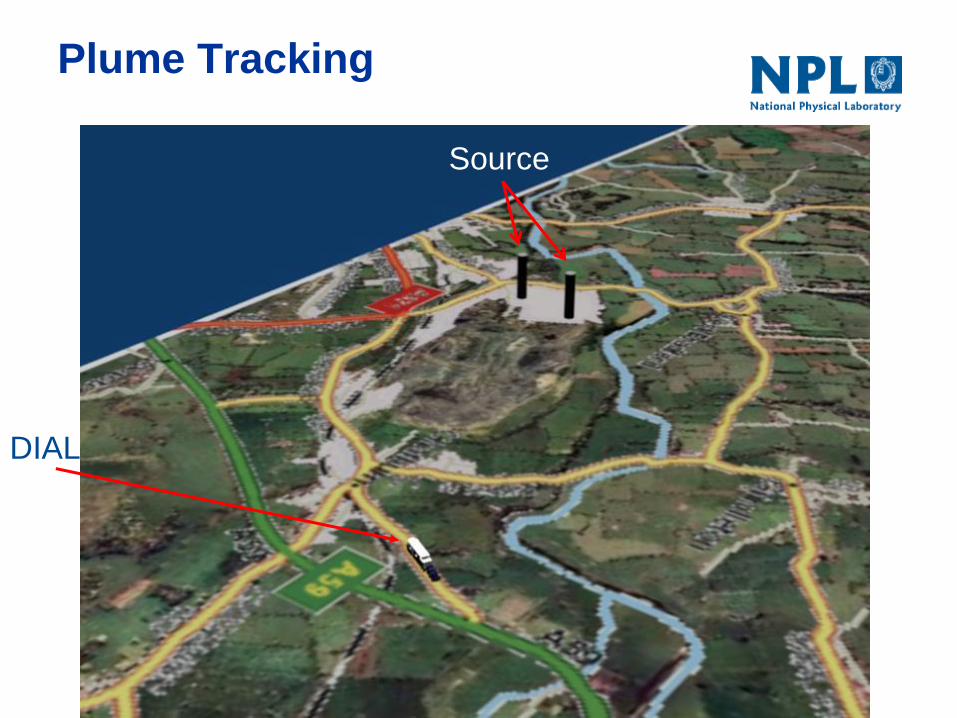
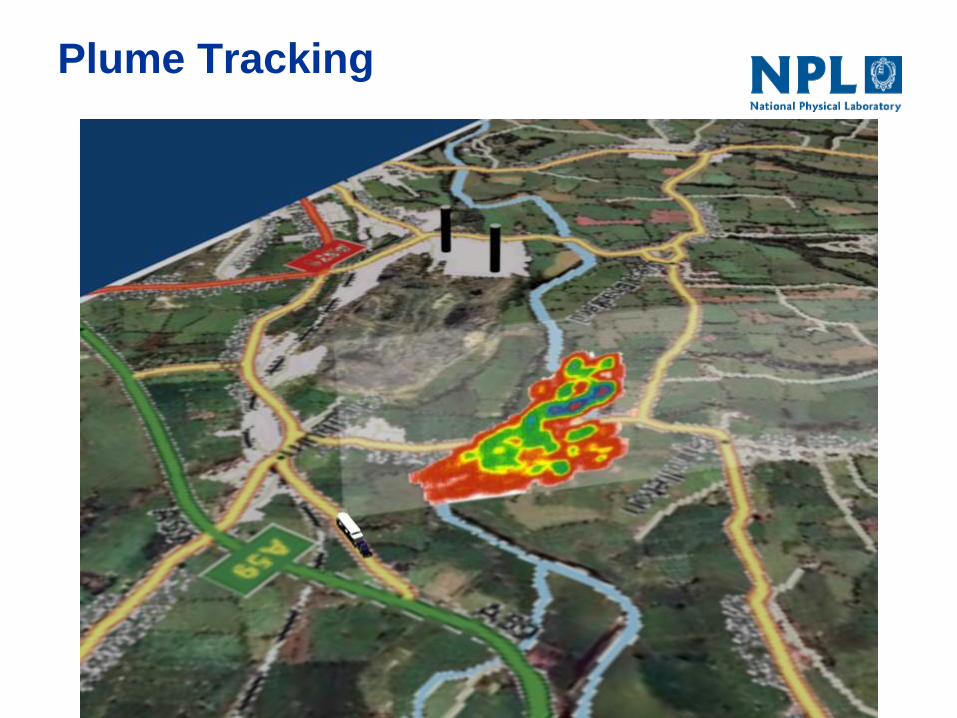
Plume Tracking
DIAL
Source
NPL Management Ltd - Internal
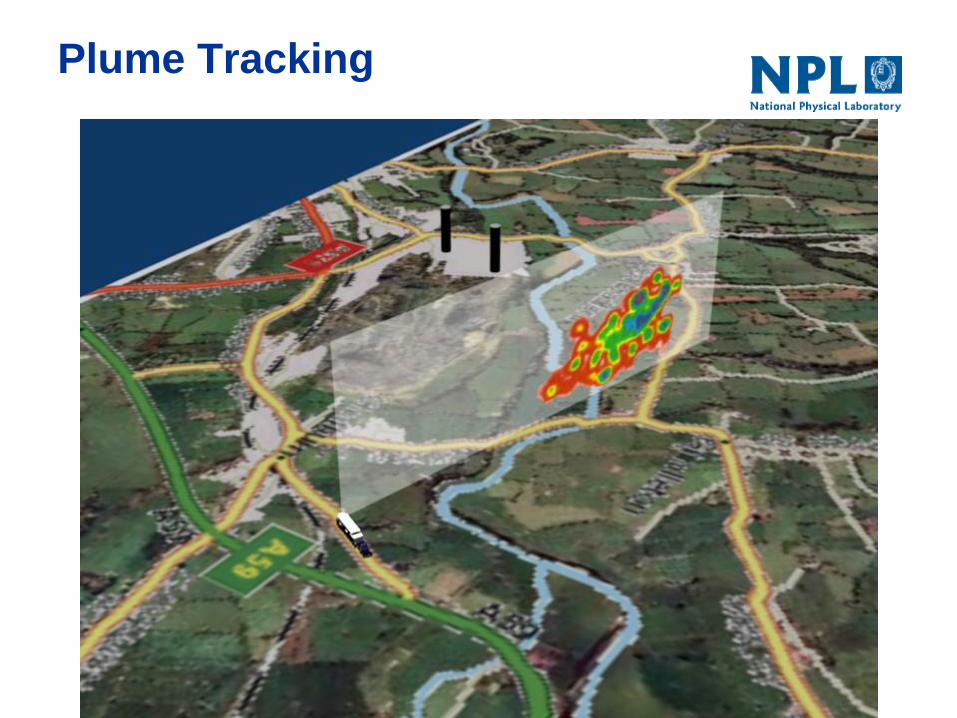
Plume Tracking
NPL Management Ltd - Internal
Plume Tracking
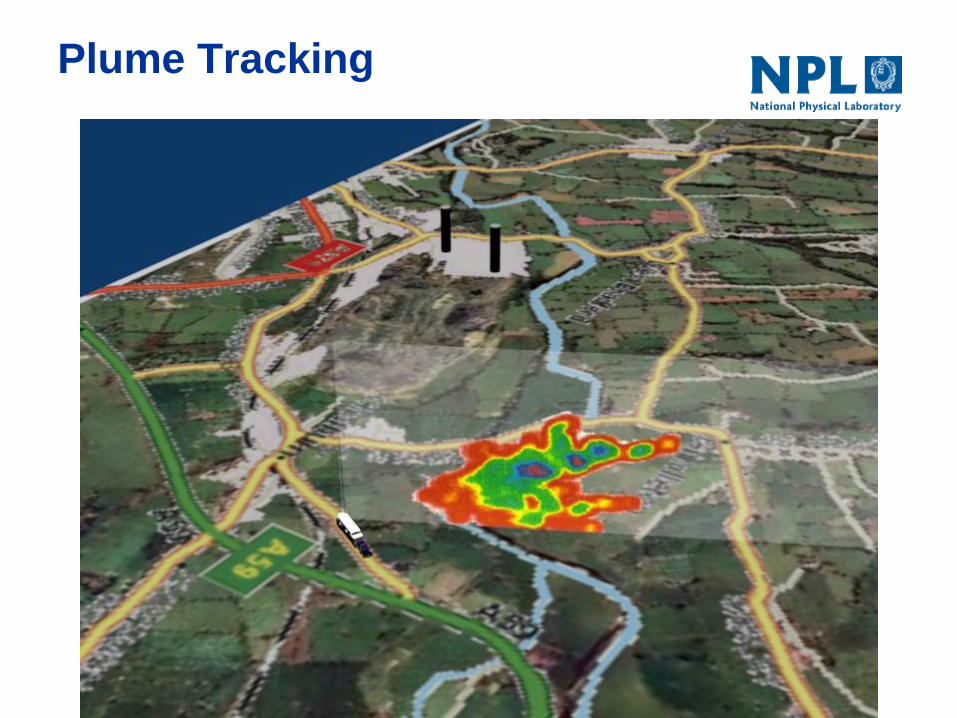
NPL Management Ltd - Internal
Plume Tracking
NPL Management Ltd - Internal
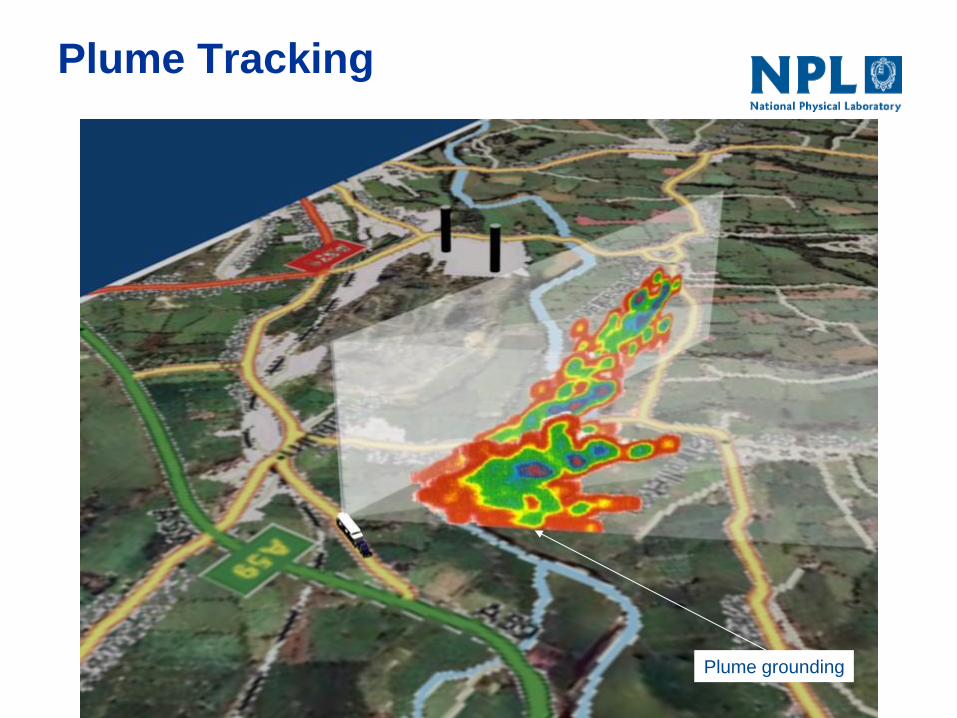
Plume Tracking
Plume grounding
NPL Management Ltd - Internal
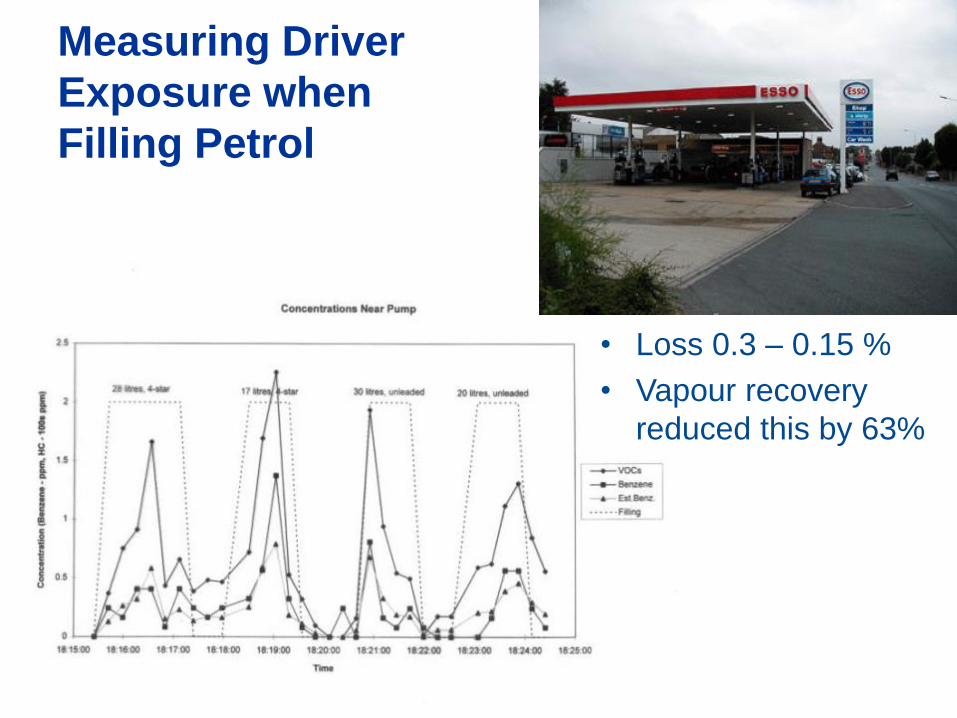
Measuring Driver
Exposure when
Filling Petrol
• Loss 0.3 – 0.15 %
• Vapour recovery
reduced this by 63%
NPL Management Ltd - Internal
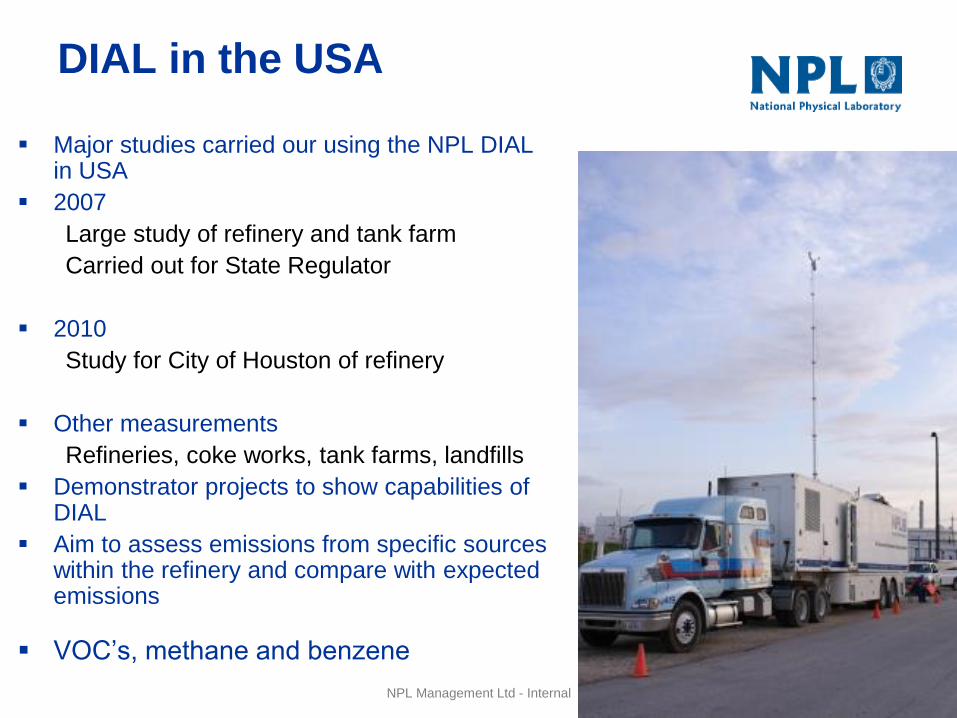
DIAL in the USA
Major studies carried our using the NPL DIAL in USA
2007
Large study of refinery and tank farm
Carried out for State Regulator
2010
Study for City of Houston of refinery
Other measurements
Refineries, coke works, tank farms, landfills
Demonstrator projects to show capabilities of DIAL
Aim to assess emissions from specific sources within the refinery and compare with expected emissions
VOC’s, methane and benzene

NPL Management Ltd - Internal
Texas DIAL study 2007
Looked at specific sources
for comparison with
emissions estimates
Day and night time
measurements
Comparisons made with
FLIR imaging infrared
camera
EPA Open path DOAS
system for benzene
concentration
NPL Management Ltd - Internal
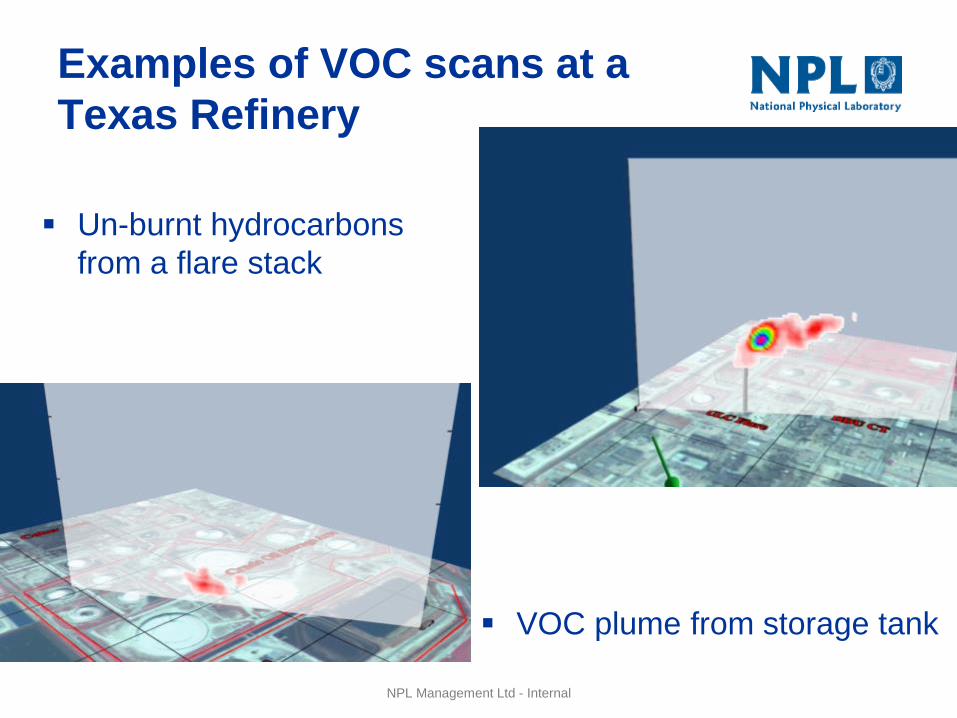
Examples of VOC scans at a
Texas Refinery
Un-burnt hydrocarbons
from a flare stack
VOC plume from storage tank

NPL Management Ltd - Internal
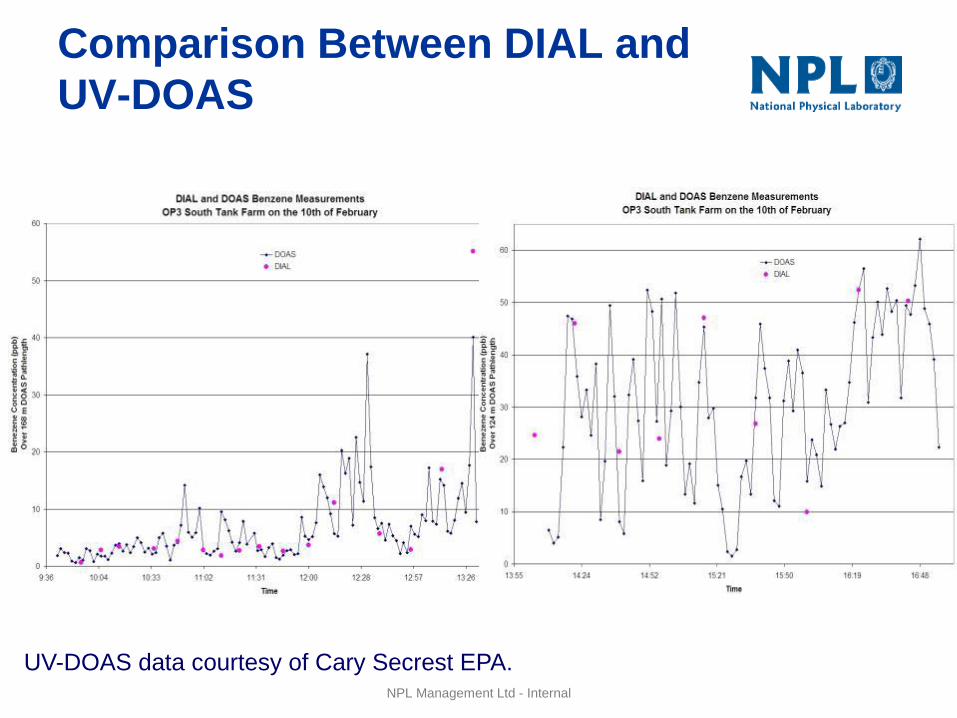
Comparison Between DIAL and
UV-DOAS
UV-DOAS data courtesy of Cary Secrest EPA.
• DIAL
1.6 ppb to 26.3 ppbv
• UV-DOAS
5 ppb to 10 ppbv
• Tube and canister
1.44 ppb to 20.52 ppbv

NPL Management Ltd - Internal
Initial Conclusions from
Texas Study
Tanks
Day and night time measurements gave similar emissions
Crude oil and heated oil tank emissions measured by DIAL were 5-10 times
higher than estimated by TANKS
Gasoline tank emissions measured by DIAL were similar to those estimated by
TANKS
Flares
Temporary flare gave efficiency ~ 99.7 %
Ultra cracker unit (ULC) process flare
gave efficiencies < 85%
NPL Management Ltd - Internal
Comparison Between DIAL and
UV-DOAS
UV-DOAS data courtesy of Cary Secrest EPA.

NPL Management Ltd - Internal
Recent work in Europe
Regulatory monitoring of onshore gas in Norway
‘Routine’ monitoring
Process, storage, flares
Periodic monitoring
Enables check and control of fugitive emissions
Results generally consistent with previous
measurements (undertaken by Spectrasyne)
NPL Management Ltd - Internal
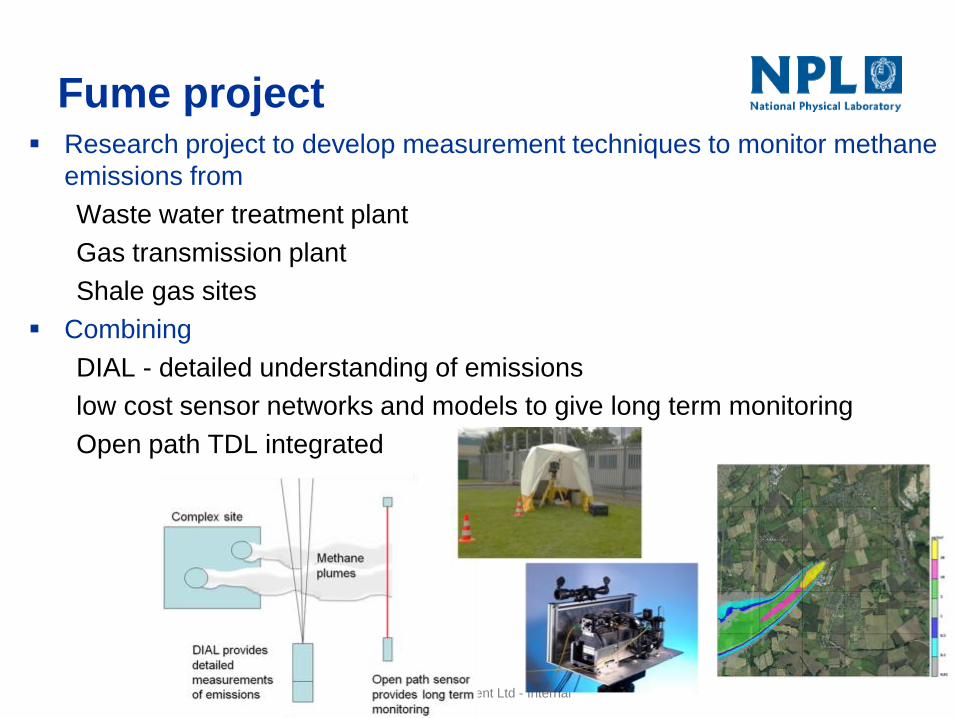
Fume project Research project to develop measurement techniques to monitor methane
emissions from
Waste water treatment plant
Gas transmission plant
Shale gas sites
Combining
DIAL - detailed understanding of emissions
low cost sensor networks and models to give long term monitoring
Open path TDL integrated
NPL Management Ltd - Internal
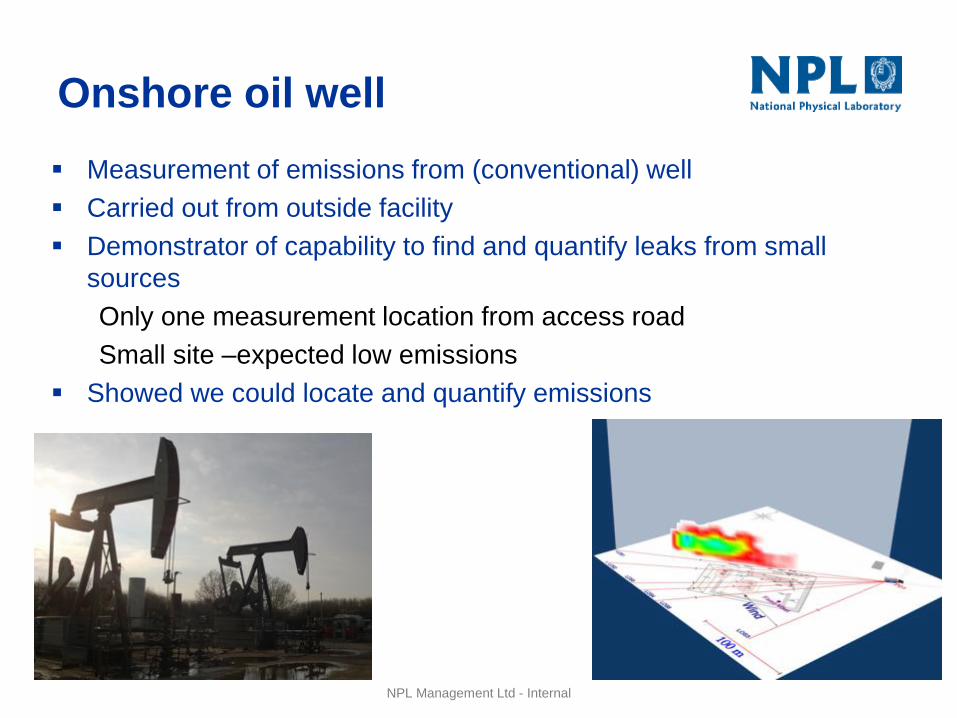
Onshore oil well
Measurement of emissions from (conventional) well
Carried out from outside facility
Demonstrator of capability to find and quantify leaks from small
sources
Only one measurement location from access road
Small site –expected low emissions
Showed we could locate and quantify emissions
NPL Management Ltd - Internal
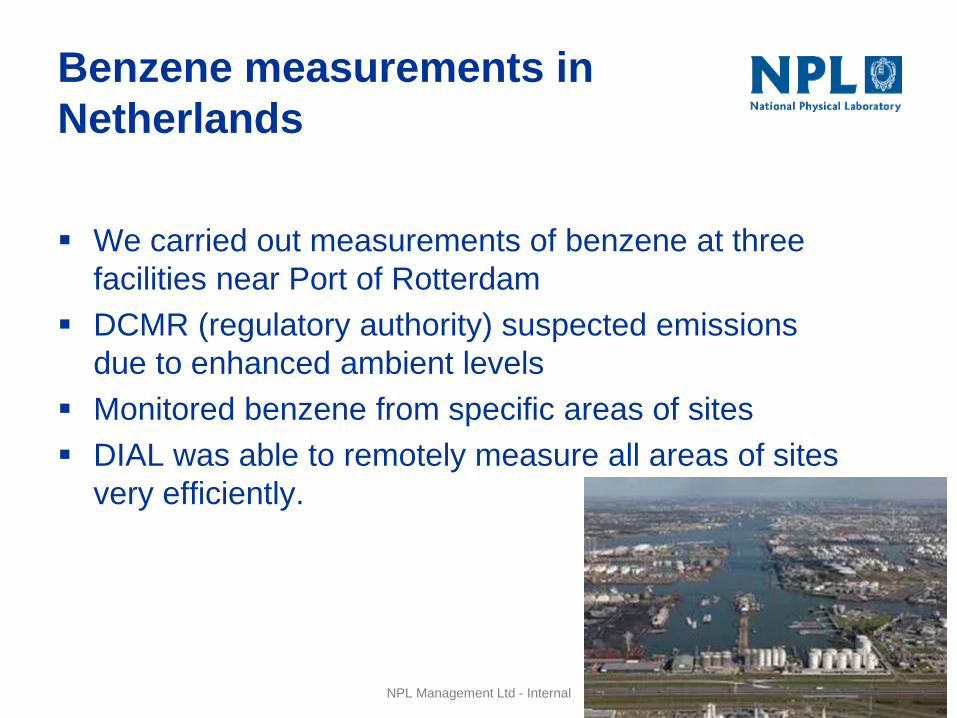
Benzene measurements in
Netherlands
We carried out measurements of benzene at three
facilities near Port of Rotterdam
DCMR (regulatory authority) suspected emissions
due to enhanced ambient levels
Monitored benzene from specific areas of sites
DIAL was able to remotely measure all areas of sites
very efficiently.

NPL Management Ltd - Internal
Results of benzene study
Identified significant benzene emissions
DIAL able to show where plume was, and quantify
emission
Led to further investigations
Significant leaks identified

NPL Management Ltd - Internal
Measurement of Methane
Methane is an important greenhouse gas
28 times greater effect than CO2
IPCC fifth assessment
Major source in UK GHG emissions inventory
Total CH4 50 Mt CO2 equivalent
~10% of CO2
Landfill is an important source
~20 Mt CO2 equivalent
NPL Management Ltd - Internal
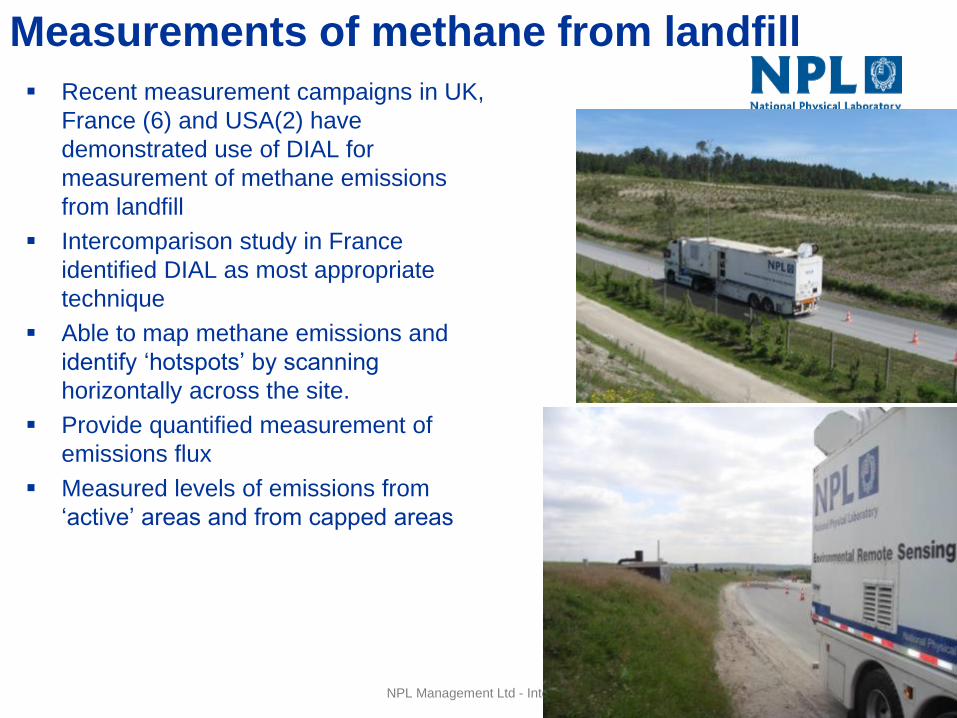
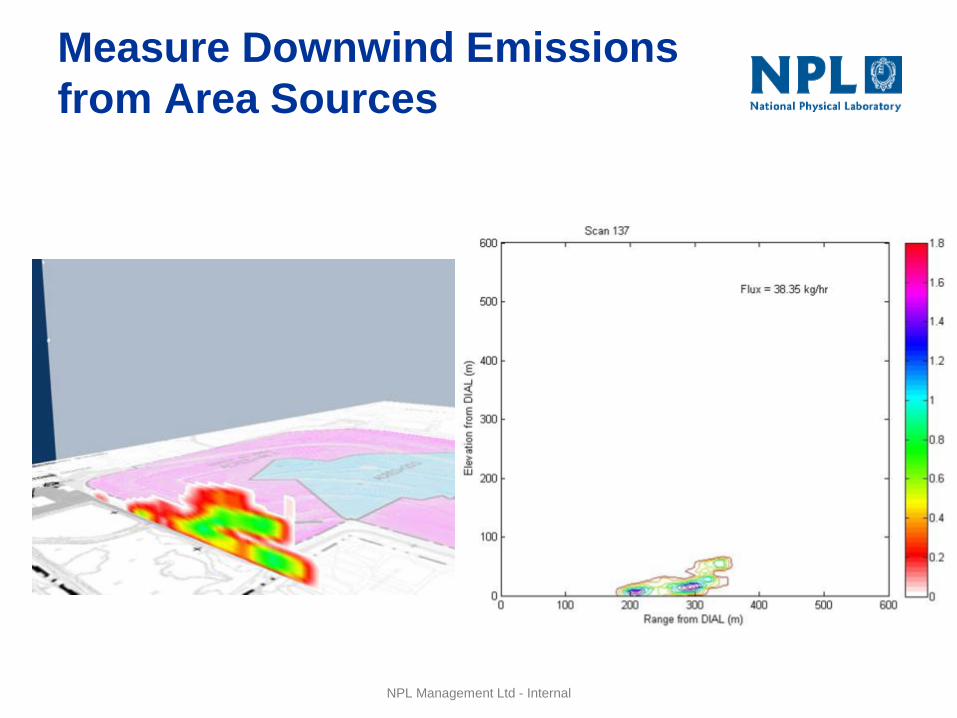
Measurements of methane from landfill
Recent measurement campaigns in UK,
France (6) and USA(2) have
demonstrated use of DIAL for
measurement of methane emissions
from landfill
Intercomparison study in France
identified DIAL as most appropriate
technique
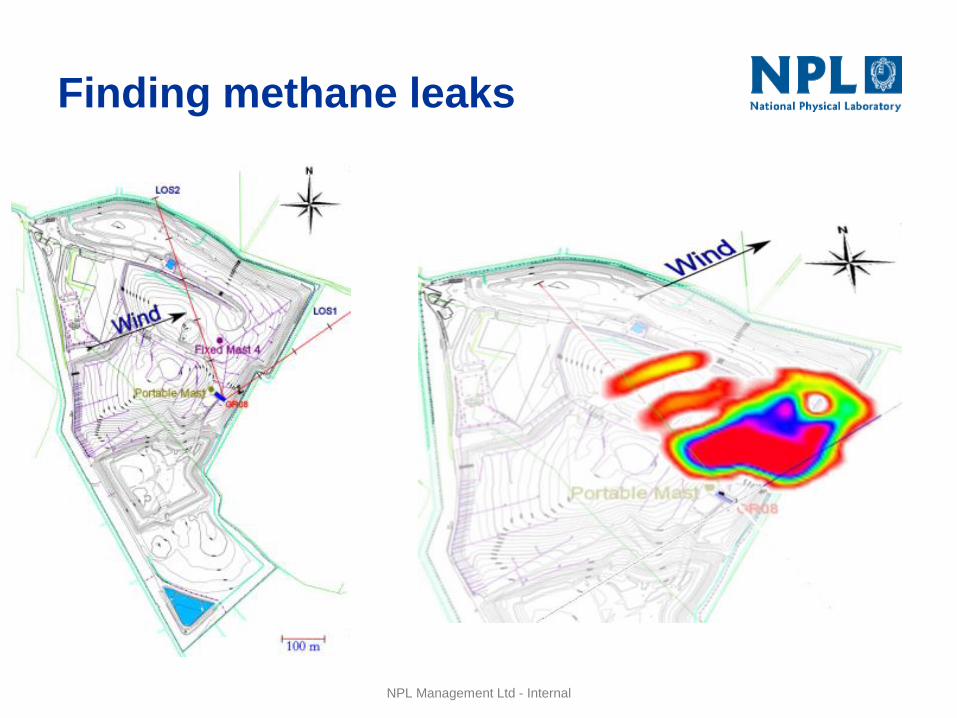
Able to map methane emissions and
identify ‘hotspots’ by scanning
horizontally across the site.
Provide quantified measurement of
emissions flux
Measured levels of emissions from
‘active’ areas and from capped areas
NPL Management Ltd - Internal
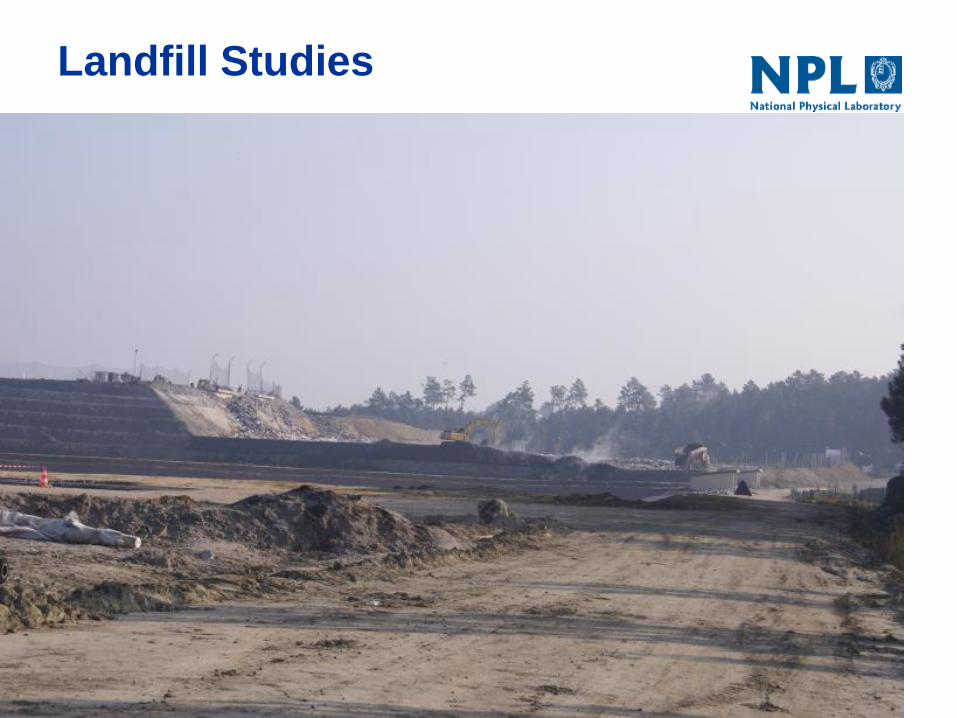
Landfill Studies
NPL Management Ltd - Internal
Measure Downwind Emissions
from Area Sources
NPL Management Ltd - Internal
Finding methane leaks

NPL Management Ltd - Internal
Future development of DIAL at NPL
Improved ‘NPL DIAL’
Better sensitivity – new components
Extension to CO2 and other GHGs
Field demonstration at power plant
Current research programme investigating development of compact DIAL
Less flexible than current DIAL
Different systems focussed on specific roles
Method development
Improved analysis algorithms
Meteorology
Uncertainty determination
Flux measurement in complex environment
NPL Management Ltd - Internal
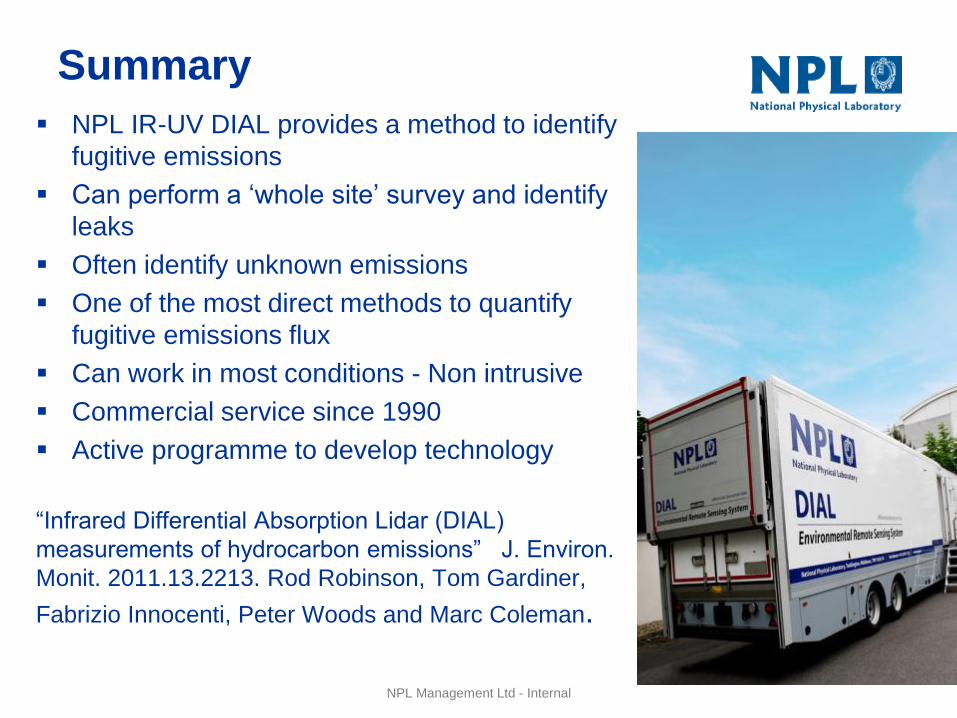
Summary
NPL IR-UV DIAL provides a method to identify
fugitive emissions
Can perform a ‘whole site’ survey and identify
leaks
Often identify unknown emissions
One of the most direct methods to quantify
fugitive emissions flux
Can work in most conditions - Non intrusive
Commercial service since 1990
Active programme to develop technology
“Infrared Differential Absorption Lidar (DIAL)
measurements of hydrocarbon emissions” J. Environ.
Monit. 2011.13.2213. Rod Robinson, Tom Gardiner,
Fabrizio Innocenti, Peter Woods and Marc Coleman.

NPL Management Ltd - Internal
Development of CO2
measurement capability
based on NPL DIAL
This is a world first remote measurement of
CO2 from an industrial source
Other research groups are working on this
eg NIST
Next slides will present what was needed
to be done to achieve the measurements
Choice of wavelength region
Modifications to system
• Source
• Detector
• Diagnostics
Field measurement demonstration
Objective to see if we can observe a
CO2 plume from a power station
under real conditions

NPL Management Ltd - Internal
Summary of CO2 measurements
We have shown that DIAL is capable of making measurements
of CO2 emissions from power stations
To best of our knowledge this is first time remote emission
measurements have been made of an individual facility
Could do this from outside facility
Paper currently being submitted to Atmospheric Environment on
this work
"First measurements of a carbon dioxide plume from an
industrial source using a ground based mobile differential
absorption lidar " R. A. Robinson,T. D. Gardiner, F. Innocenti,
A. Finlayson, P. T. Woods and J. F. M. Few . Environ. Sci.:
Processes Impacts, 2014,16, 1957-1966
NPL Management Ltd - Internal
Average plume observed by DIAL
Scans 10-17
LOS 2
CO2 ppm

NPL Management Ltd - Internal
Thank You
Any Questions?

NPL Management Ltd - Internal
OTHER SLIDES

NPL Management Ltd - Internal
UK Landfill Study
Study at a UK landfill for Environment Agency
Compared
DIAL
FID point measurement
Aircraft based short wavelength IR passive technique
GasSim – monte carlo based model
Flux box survey

NPL Management Ltd - Internal
Landfill study
NPL Management Ltd - Internal
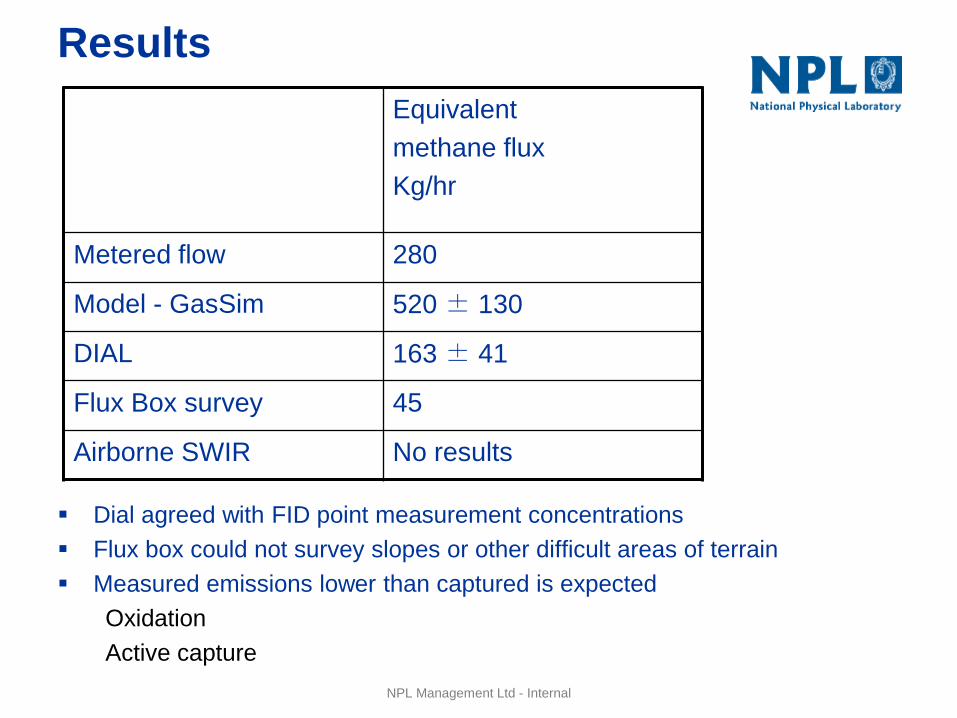
Results
Equivalent
methane flux
Kg/hr
Metered flow 280
Model - GasSim 520 ± 130
DIAL 163 ± 41
Flux Box survey 45
Airborne SWIR No results
Dial agreed with FID point measurement concentrations
Flux box could not survey slopes or other difficult areas of terrain
Measured emissions lower than captured is expected
Oxidation
Active capture

NPL Management Ltd - Internal
Horizontal Scan Across
Tipping Zone
Can identify leaks points and hot spots
NPL Management Ltd - Internal
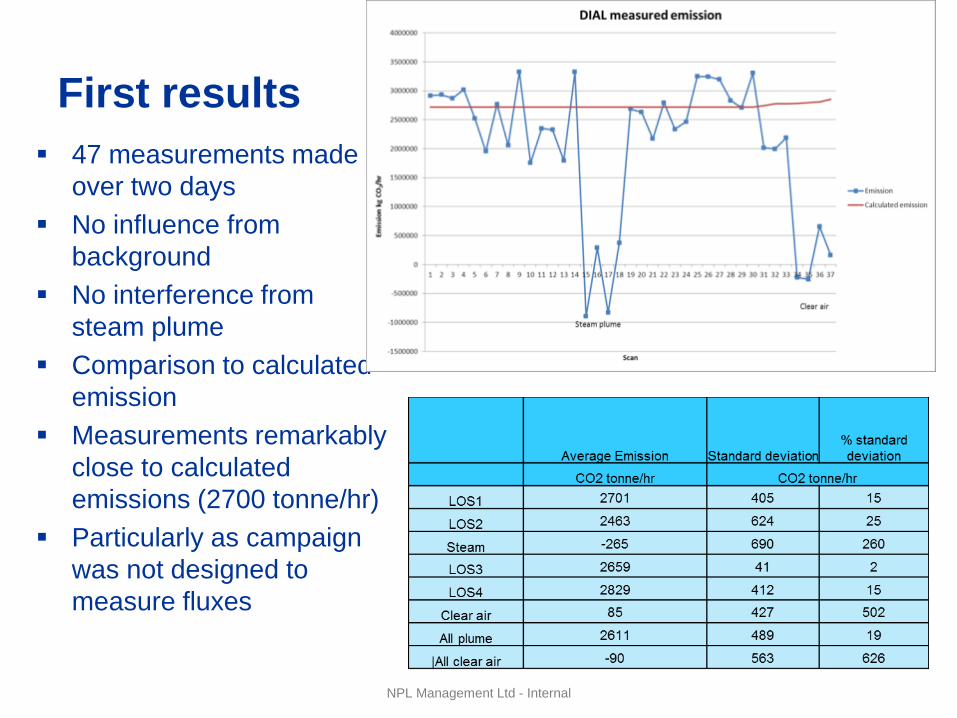
First results
47 measurements made
over two days
No influence from
background
No interference from
steam plume
Comparison to calculated
emission
Measurements remarkably
close to calculated
emissions (2700 tonne/hr)
Particularly as campaign
was not designed to
measure fluxes


