
The Advanced Biofuel and
Biochemical Overview June 2012
Silicon Valley Bank Cleantech Practice
Table of Contents
I. Introduction
I. Biofuel/Biochemicals Outlook – Macro Observations 3
II. Biofuel/Biochemicals Outlook – Micro Observations 4
III. The Cleantech Ecosystem 5
IV. Market Snapshot: Global Ethanol Production 6
V. Market Snapshot: Global Biodiesel Production 7
VI. Market Snapshot: Ethanol and Biodiesel Production Landscape in the U.S.
8
VII. Market Snapshot: Global Biochemical Production 9
II. Biofuels/Biochemicals Overview
I. What are Biofuels/Biochemicals? 11
II. Types of Biofuels 15
III. Biofuel Feedstocks 16
IV. Comparative Yields 18
V. Petroleum Replacement Overview 21
VI. Conversion Technologies 22
III. The Importance of Biofuels/Biochemicals
I. Compelling Market Opportunity 28
II. Drivers of Biofuels/Biochemicals Growth 29
III. Liquid Demand Statistics 32
IV. Energy Market Growth 34
The Biofuels and Biochem Industry 2
III. The Importance of Biofuels/Biochemicals (Cont.)
V. Liquid Demand Growth from Non-OECD Countries 36
VI. Biofuels for Transportation 38
VII. Increasing Marginal Cost of Production 39
VIII. Oil Market Price and Saudi Breakeven Threshold 42
IX. U.S. Renewable Fuel Standards 43
X. Biofuel Blending Mandates by Country 46
XI. Cellulosic Ethanol Pricing Model 47
IV. Biofuel/Biochemicals Landscape
I. Advanced Biofuel and Biochemicals Value Chain 49
V. Where Are They in Development?
I. Investments in Biofuels/Biochemicals 52
II. Global Players – Milestone Update 54
III. Biofuel/Biochemical IPOs in Pipeline 56
IV. Strategic Partnerships 57
V. Projects to Watch in 2012–2013 58
VI. Appendix 61
VII. Selected Due Diligence Questions 69
VIII. Silicon Valley Bank Cleantech Team 70

Biofuel/Biochemicals Outlook – Macro Observations
• Multiple very large and growing markets
— Total markets will top $1+ trillion. Beyond the well-known fossil-fuel replacement markets is growing demand for non-fuel products like
food supplements, personal care products, and packaging.
• Positive supply/demand dynamics around crude
— The fundamental underlying demand is exacerbated by oil exporting countries’ economic reliance on oil revenue. Meanwhile, the cost of
crude production continues to increase. Biofuels/biochemicals will play an increasingly important role to fill that need.
• Demand drivers – mandates and markets
— Mandate: Primarily for fuels, government mandated goals proliferate with varying degrees of adherence and enforcement. Subsidies of
all types remain important in attracting capital and shifts in policy could alter business plan direction between fuels or chemicals.
— Markets: Growing economic justifications are intersecting with other market demand factors. For example, the U..S Navy’s goal of 50%
energy consumption from alternative sources by 2020 or the Air Force’s initiative to acquire 50% of aviation fuel from alternative blends
by 2016 are policy influencers that also have purchasing power.
• The role of strategic corporate investors
— Always important, corporates from a variety of industries (and led by big energy, chemicals/materials, and consumer products) have
become critical parties in the development and scale-up of the sector. Taking multiple forms of straight investment, joint venture, and
collaboration, investors search for innovation, growth, and information.
• Commodity markets
— Fuels in particular are ultimately commodities. Without policy enhancements, the impact of commodity cycles will continue to challenge
scaling of new technologies.
• Business life cycle
— While the underlying trends and fundamentals may be inexorable, development of the industry and market dynamics is a very long term
process and investment cycle.
OBSERVATIONS
The Biofuels and Biochem Industry 3 TABLE OF CONTENTS
Biofuel/Biochemicals Outlook – Micro Observations
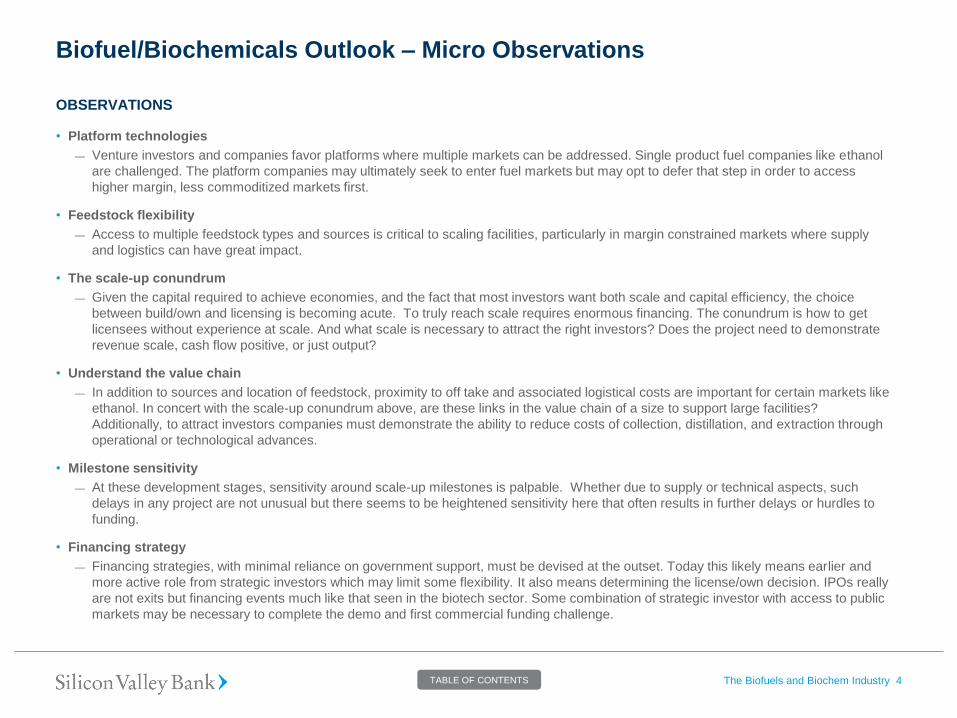
• Platform technologies
— Venture investors and companies favor platforms where multiple markets can be addressed. Single product fuel companies like ethanol
are challenged. The platform companies may ultimately seek to enter fuel markets but may opt to defer that step in order to access
higher margin, less commoditized markets first.
• Feedstock flexibility
— Access to multiple feedstock types and sources is critical to scaling facilities, particularly in margin constrained markets where supply
and logistics can have great impact.
• The scale-up conundrum
— Given the capital required to achieve economies, and the fact that most investors want both scale and capital efficiency, the choice
between build/own and licensing is becoming acute. To truly reach scale requires enormous financing. The conundrum is how to get
licensees without experience at scale. And what scale is necessary to attract the right investors? Does the project need to demonstrate
revenue scale, cash flow positive, or just output?
• Understand the value chain
— In addition to sources and location of feedstock, proximity to off take and associated logistical costs are important for certain markets like
ethanol. In concert with the scale-up conundrum above, are these links in the value chain of a size to support large facilities?
Additionally, to attract investors companies must demonstrate the ability to reduce costs of collection, distillation, and extraction through
operational or technological advances.
• Milestone sensitivity
— At these development stages, sensitivity around scale-up milestones is palpable. Whether due to supply or technical aspects, such
delays in any project are not unusual but there seems to be heightened sensitivity here that often results in further delays or hurdles to
funding.
• Financing strategy
— Financing strategies, with minimal reliance on government support, must be devised at the outset. Today this likely means earlier and
more active role from strategic investors which may limit some flexibility. It also means determining the license/own decision. IPOs really
are not exits but financing events much like that seen in the biotech sector. Some combination of strategic investor with access to public
markets may be necessary to complete the demo and first commercial funding challenge.
OBSERVATIONS
The Biofuels and Biochem Industry 4 TABLE OF CONTENTS
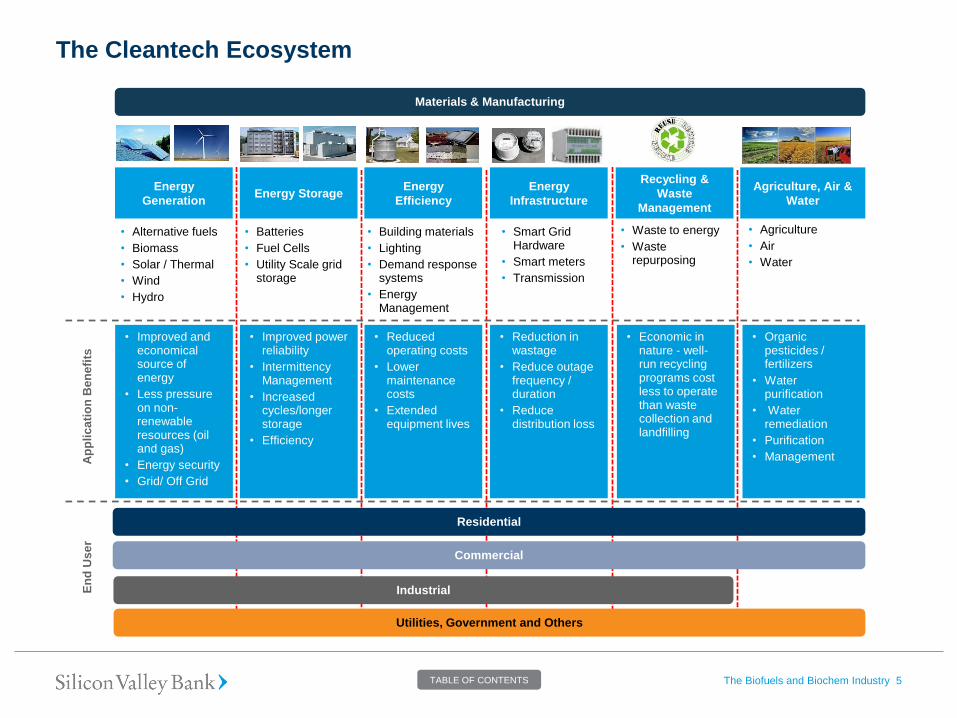
The Cleantech Ecosystem
The Biofuels and Biochem Industry 5
Ap
pli
ca
tio
n B
en
efi
ts
Commercial
Industrial
Utilities, Government and Others
• Batteries
• Fuel Cells
• Utility Scale grid storage
Materials and Manufacturing E
nd
Use
r
• Building materials
• Lighting
• Demand response systems
• Energy Management
• Smart Grid Hardware
• Smart meters
• Transmission
• Agriculture
• Air
• Water
• Improved and economical source of energy
• Less pressure on non-renewable resources (oil and gas)
• Energy security
• Grid/ Off Grid
• Improved power reliability
• Intermittency Management
• Increased cycles/longer storage
• Efficiency
• Reduced operating costs
• Lower maintenance costs
• Extended equipment lives
• Reduction in wastage
• Reduce outage frequency / duration
• Reduce distribution loss
• Economic in nature - well-run recycling programs cost less to operate than waste collection and landfilling
• Organic pesticides / fertilizers
• Water purification
• Water remediation
• Purification
• Management
Residential
• Alternative fuels
• Biomass
• Solar / Thermal
• Wind
• Hydro
Energy
Generation Energy Storage
Energy
Efficiency
Energy
Infrastructure
Recycling &
Waste
Management
Agriculture, Air &
Water
Materials & Manufacturing
• Waste to energy
• Waste repurposing
TABLE OF CONTENTS

Master Layout:
Large Graph
Market Snapshot: Global Ethanol Production
Top Five Countries (2010) Ethanol Production (millions of gallons/year)1
The Biofuels and Biochem Industry 6
Source: 1NREL (National Renewable Energy Laboratory) Data Book, 2011.
Note: Gallons to Liters conversion ratio at 1:3.78.
The Global Renewable
Fuels Alliance (GRFA)
forecasts ethanol
production to hit 88.7
billion litres in 2011
TABLE OF CONTENTS
Master Layout:
Large Graph
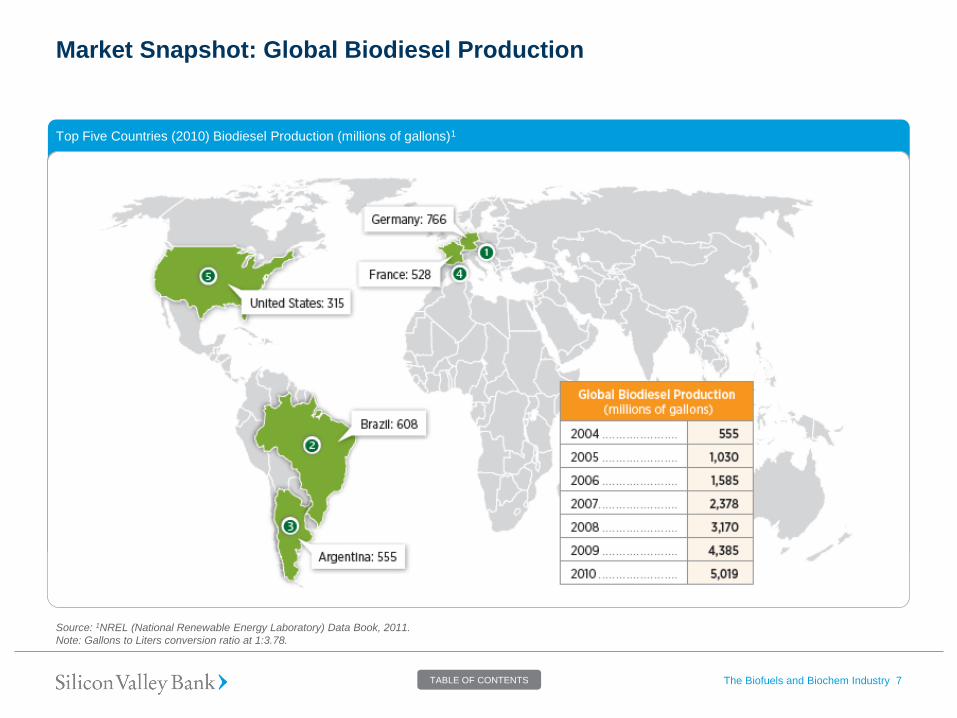
Market Snapshot: Global Biodiesel Production
Top Five Countries (2010) Biodiesel Production (millions of gallons)1
The Biofuels and Biochem Industry 7
Source: 1NREL (National Renewable Energy Laboratory) Data Book, 2011.
Note: Gallons to Liters conversion ratio at 1:3.78.
TABLE OF CONTENTS
Market Snapshot: Ethanol and Biodiesel Production Landscape in the U.S.
U.S. Ethanol Production1 U.S. Alternative Fueling Stations2
The Biofuels and Biochem Industry 8
Source: 1,2NREL (National Renewable Energy Laboratory) Data Book, 2011.
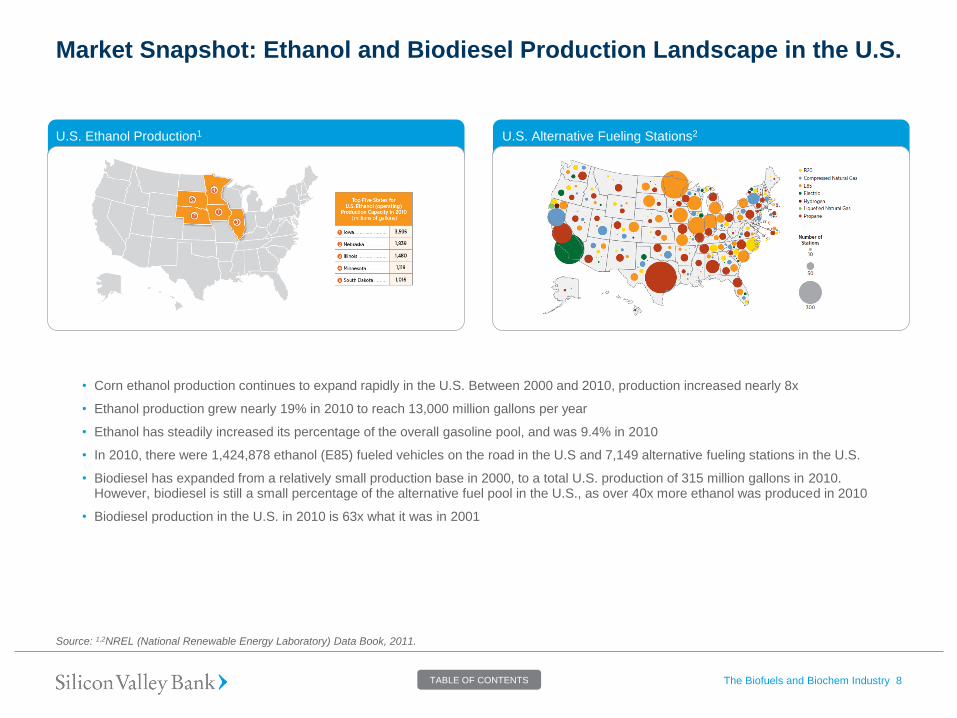
• Corn ethanol production continues to expand rapidly in the U.S. Between 2000 and 2010, production increased nearly 8x
• Ethanol production grew nearly 19% in 2010 to reach 13,000 million gallons per year
• Ethanol has steadily increased its percentage of the overall gasoline pool, and was 9.4% in 2010
• In 2010, there were 1,424,878 ethanol (E85) fueled vehicles on the road in the U.S and 7,149 alternative fueling stations in the U.S.
• Biodiesel has expanded from a relatively small production base in 2000, to a total U.S. production of 315 million gallons in 2010. However, biodiesel is still a small percentage of the alternative fuel pool in the U.S., as over 40x more ethanol was produced in 2010
• Biodiesel production in the U.S. in 2010 is 63x what it was in 2001
TABLE OF CONTENTS

Master Layout:
Large Graph
Market Snapshot: Global Biochemical Production
Overview of Biochemicals
• Like the biofuels industry, the biochemical industry uses bioprocesses and biomass to replace petroleum as the important building block for a number of products including plastics, lubricants, waxes and cosmetics.
• According to the American Chemistry Council dated July 2011, the market size of the global chemical industry (Basic Chemicals, Intermediate Chemicals, Finished Chemical Products)1 was approximately $3.0 trillion as of July 2011
• Specialty chemicals compete more on desired effect than cost and as a result present less price‐sensitive, higher ASP markets for renewable chemical firms to target
• In the U.S. ~200,000 barrels of oil per day are required to fulfill demand for plastic packaging
Specialty Biochemicals
The Biofuels and Biochem Industry 9
Source: Elevance Renewable Sciences Filings.
Note: 1Basic Chemicals include Butadiene, Propylene, Ethylene, Benzene; Intermediate Chemicals include Butanediol, Acrylic acid, Ethlyene glycol; Finished Products include
BR, PBT, SBR, Polyacrylics, PE, PET, Nylon-6.
Name Characteristics Uses
Adhesives Liquid or semi-liquid compound that bonds items together
via drying, heat or pressure
Paper products, labeling, packaging, plastic bags,
stamps, lamination
Cationic Surfactants Organic compound consisting of phospholipids and
proteins with positively charged heads that lower the
surface tension between liquids and other surfaces
Soaps, detergents, shampoos, toothpastes
Geraniol Clear to pale yellow that is insoluble in water Commonly used in perfumes or fruit flavoring
Industrial Lubricants Oil-based compound that reduces friction between moving
surfaces
Used in operation of manufacturing, mining and
transportation equipment and more
Linalool Naturally occurring alcohol found in flowers and spice
plants
Scents for perfumes and cleaning agents, insecticides,
used to make Vitamin E
Nonionic Surfactant Organic compound consisting of phospholipids and
proteins with non-charged heads
Lower the surface tension of liquids or between liquids
and another surface
O2 Scavenger Compounds that inhibit oxidation or other molecules Used to prevent the corrosion metal by oxygen
Plasticizer Additives that increase the workability, flexibility and
fluidity of a substance allowing for easier changing of
shape
Used for plastics, concrete and dry wall
Specialty Emollients Lipids that attract water and retain moisture Used in lotions and make-ups to prevent dry skin
Squalane Saturated form of squalene making it less susceptible to
oxidation
Used in personal care products such as moisturizers
Consumer
Products
Polymers
and
Coatings
Lubricants
and Additives
4.6 MM
tonnes/yr
4.0 MM
tonnes/yr
73.0 MM
tonnes/yr
• Specialty surfactants
• Soy petrolatum
• Performance waxes
• Candles
• Base oils
• Fuel additives
Building blocks for
• Specialty polymideds, polyols, polyesters
• Epoxies and polyurethanes
• Coatings and cross linkers
TABLE OF CONTENTS

Biofuels/Biochemicals Overview
The Biofuels and Biochem Industry 10 TABLE OF CONTENTS

What are Biofuels/Biochemicals? – Summary
• The Biofuels and Biochemicals industry refers to the set of companies focused on developing fuels and chemicals from Biomass rather than
from fossil fuels
• In 2010, approximately 700 million barrels of biofuels were produced globally. Over 45% of this was corn‐based ethanol in the U.S. and
>25% produced was sugarcane‐based ethanol in Brazil
• Biofuels/ Biochemicals are distinguished as either first , second or third generation. Focus is more on second generation and beyond as first
generation is a mature technology
— Corn and sugarcane will continue to be the most abundant feedstock for biofuels and biochemicals in the near term
— Companies utilizing food‐competitive feedstock (e.g., corn, soy, wheat) face higher price volatility and potential for societal push‐back
— Cellulosic feedstock does not face the “food‐vs.‐fuel” argument but requires more specialized and expensive enzymes that are yet to be
completely commercialized
— Waste is a unique feedstock and companies that can successfully convert the biomass to fuels and chemicals will benefit significantly
— “Energy‐dedicated” crops are emerging and will be vital to the growth of cellulosic biofuel and biochemical production
— Algae offer the highest oil yields of any biofuel feedstock, but challenges around cost have created challenges for commercial use
• Due to the importance of feedstock to the overall value chain, several companies are developing business models and technologies focused
on the “upstream” segment of the value chain
• Numerous conversion technologies exist each with distinct advantages and disadvantages
• The United States and Brazil currently produce and consume the vast proportion of global biofuels due to size of ethanol industries, and is
expected to remain the most important countries for biofuel production/consumption in the near‐term
• Biofuel and Biochemical companies are aiming to compete in large established markets in fuels and specialty chemicals
The Biofuels and Biochem Industry 11 TABLE OF CONTENTS

Master Layout:
Large Graph
What are Biofuels/Biochemicals?
Renewable Energy Share of Global Final Energy Consumption, 2010
The Biofuels and Biochem Industry 12
• A biofuel/ biochemical is a product made from biomass – organic material with stored chemical energy.
Biofuels/Biochemicals can be made from plant materials such as sugarcane, corn, wheat, vegetable oils,
agriculture residues, grass, wood and algae.
• Biofuels/Biochemicals currently comprise only a small part of today’s global energy consumption. Liquid
biofuels accounted for a modest 2.7% of global road-transport fuels in 2010 and only 0.6% of the global
final energy consumption. However, by 2030, this is forecast to increase to 9%, equivalent to 6.5 million
barrels of oil a day.
• Renewable energy overall (bio-energy, hydro, solar, etc) represented 16.0% of total energy demand in 2010.
Source: Renewables 2011, Global Status Report.
Note: 1Traditional biomass means unprocessed biomass, including agricultural waste, forest products waste, collected fuel wood, and animal dung, that is burned in stoves or
furnaces to provide heat energy for cooking, heating, and agricultural and industrial processing, typically in rural areas.2Modern bioenergy comprises biofuels for transport,
and processed biomass for heat and electricity production.
While traditional
biomass1 constitutes an
important part of the
energy mix, so far
modern biomass2 use
makes up only a small
share of total global
energy consumption
Several economical,
political, technological,
and environmental
factors will drive growth
in the Biofuels/
Chemicals industry
Nuclear 2.8%
Fossil
Fuels 81%
Renewable 16.2%
Wind/Solar/Biomass/Geothermal Power Generation 0.7%
Transport Biofuels 0.6%
Biomass/Solar/Geothermal/
Hot Water/Heating 1.5%
Hydropower 3.4% Traditional
Biomass 10%
16.2%
TABLE OF CONTENTS

Global Average Annual Growth Rates of Renewable Energy Capacity and Biofuels Production, 2005–2010
Biofuels/Biochemicals Growth Rates
The Biofuels and Biochem Industry 13
• Global energy consumption rebounded strongly in 2010 after an overall downturn in 2009, with annual growth of 5.4%. Renewable energy, which had no
downturn in 2009, continued its strong growth in 2010 as well.
• During the period from the end of 2005 through 2010, total global capacity of many renewable energy technologies – including solar photovoltaic (PV), wind
concentrating solar power (CSP), solar water heating systems, and biofuels – grew at average rates ranging from around 15% to nearly 50% annually.
• Solar PV increased the fastest of all renewables technologies during this period, followed by biodiesel and wind. For solar power technologies, growth
accelerated during 2010 relative to the previous four years.
• At the same time, growth in total capacity of wind power held steady in 2010, and the growth rates of biofuels have declined in recent years, although ethanol
was up again in 2010.
• Hydropower, biomass power and heat, and geothermal heat and power are growing at more ordinary rates of 3–9% per year, making them more comparable
with global growth rates for fossil fuels (1–4%, although higher in some developing countries). In several countries, however, the growth in these renewable
technologies far exceeds the global average.
Source: 1Renewables 2011, Global Status Report.
72%
81%
25%
77%
3%
3%
16%
17%
7%
49%
60%
27%
25%
4%
3%
16%
23%
38%
Solar PV
Solar PV(grid -connected only)
Wind Power
Concentrating Solar Thermal Power
Geothermal power
Hyderopower
Solar hot water/heating
Ethanol production
Biodiesel production
Year-end 2005-2010(5-year Period)
2010
In 2010, approximately
700 million barrels of
biofuels were produced.
Over 45% of this was
corn‐based ethanol in
the U.S. and >25%
produced was
sugarcane‐based
ethanol in Brazil
TABLE OF CONTENTS

Main Feedstock Sources
Crops used for Biofuels/Biochemicals
Biofuel Vehicle and Pumps
Feedstock is typically the largest component of biofuel &
biochemical production cost. Feedstock cost is estimated to
represent >30%‐50% of the operating costs of most projects.
The main sources of biofuels are:
1. Oil-seed crops: Oil –seed crops include soybean, rapeseed and
sunflower. These go through a process called “transesterification” and
the oils of these oilseeds are converted into methyl esters. Methyl
esters are liquid fuel that can either be blended with petro-diesel or
used as pure biodiesel.
2. Grains, cereals and starches: These come from corn, wheat, sugar
cane, sugar beet and cassava, which undergo a fermentation process
to produce bio-ethanol.
3. Non oilseed crops: Oil from the Jatropha fruit shows most promise.
The fruit is poisonous, so it is not affected by the “food-or-fuel” tug of
war; and it grows well on arid soils which means it does not need felling
of forests. It is very resilient and needs less fertilizer and it can be
developed into plantations like any oilseed crop.
4. Organic waste: Waste cooking oil, animal manure and household
waste. Waste cooking oils can be converted into biodiesel while the rest
are converted to biogas methane.
5. Cellulosic materials: These are grasses, crop waste, municipal waste
and wood chips that are converted to ethanol. The conversion process
is more complex than the two process aforementioned. There is also
the option of converting these to gases such as methane or hydrogen
for vehicle use or to power generators.
The Biofuels and Biochem Industry 14
Source: Broker Research and websites.
TABLE OF CONTENTS

Types of Biofuels
Biofuels/Biochemicals are
distinguished as either first, second
or third generation.
Most of the Biofuels today come from
corn-based ethanol and sugar-based
ethanol.
The current debate over biofuels/
biochemicals produced from food
crops has pinned a lot of hope on
"2nd-generation processes"
produced from crop and forest
residues and from non-food energy
crops.
Second generation conversion
technologies are key to progress and
sustainability.
The Biofuels and Biochem Industry 15
Source: UNEP Assessing Biofuels Report.
Note: Litre: Gallon = 1:0.26; Gallon: Barrel = 1: 0.0322; Tonne of Oil Equivalent (toe): Barrel of Oil Equivalent (boe) = 1: 7.4.
First generation: Commercially produced using conventional technology. The basic feedstock are seeds, grains, or whole plants
from crops such as corn, sugar cane, rapeseed, wheat, sunflower seeds or oil palm. These plants were originally selected as food or
fodder and most are still mainly used to feed people. The most common first-generation biofuels are bioethanol (currently over 80%
of liquid biofuels production by energy content), followed by biodiesel, vegetable oil, and biogas.
Second generation: Produced from a variety of non-food sources. These include waste biomass,
the stalks of wheat, corn stover, wood, and special energy or biomass crops (e.g. Miscanthus).
Second-generation biofuels/biochemicals use biomass to liquid (BTL) technology, by
thermochemical conversion (mainly to produce biodiesel) or fermentation (e.g. to produce
cellulosic ethanol). Many second-generation biofuels/biochemicals are under development such
as biohydrogen, biomethanol, Fischer-Tropsch diesel, biohydrogen diesel, and mixed alcohols.
The commercial-scale production costs of 2nd-generation biofuels have been estimated by the
IEA to be in the range of US $0.80 - 1.00/liter of gasoline equivalent (lge) [US $3.02-$3.79 per
gallon] for ethanol and at least US $1.00/liter [$3.79 per gallon] of diesel equivalent for synthetic
diesel. This range broadly relates to gasoline or diesel wholesale prices (measured in USD /lge)
when the crude oil price is between US $100-130 /bbl . (However, many companies within SVB’s
universe are estimating crude oil parity without subsidy of between US$60 -80/bbl or $1.50 to
$2.00/gal at scale).
Third generation: Algae fuel, also called oilgae, is a biofuel/biochemical from algae and
addressed as a third-generation petroleum replacement. Algae is a feedstock from aquatic
cultivation for production of triglycerides (from algal oil) to produce petroleum replacement
products. The processing technology is basically the same as for biodiesel from second-
generation feedstock. Other third-generation biofuels include alcohols like bio-propanol or bio-
butanol, which due to lack of production experience are usually not considered to be relevant as
fuels on the market before 2050.
TABLE OF CONTENTS

First Generation Feedstocks
The Biofuels and Biochem Industry 16
Source: Clean Tech Energy Report by Robert Baird.
Note: Litre: Gallon = 1:0.26; Gallon: Barrel = 1: 0.0322; Tonne of Oil Equivalent (toe): Barrel of Oil Equivalent (boe) = 1: 7.4.
Sugar cane has been used to produce bioethanol in Brazil since the 1970s. It is a perennial plant that needs few inputs, such as fertilizers, and has long root systems
that can store carbon in the soil. It has a good net Greenhouse Gases (GHG) balance (up to 90% reduction in GHGs from ethanol produced from sugar cane,
compared with conventional gasoline). Sugar Cane is one of the most heavily utilized feedstock for biofuels production and the highly developed infrastructure of the
sugarcane industry in Brazil will continue to make the country a hot‐spot for Biofuel/BioChemical firms. According to the U.S. Department of Energy, Brazilian
Sugarcane is not only the most abundant, but the cheapest available feedstock for ethanol production. Brazilian sugarcane offers several economic advantages to corn,
which in the Unites States is the principal ethanol crop. Sugarcane produces around 15 dry tons per acre per year yielding roughly 600 gallons of ethanol per acre.
Corn is a cereal grain that was domesticated in Central America. Corn can be used as a feedstock to make biobutanol and bioethanol. Corn is the most abundant crop
grown in the U.S. and the backbone of the current U.S. Biofuel industry. Approximately 80 million acres of land in the U.S. are dedicated to growing corn, and the U.S.
accounts for ~20% of global corn exports. For 2010, the USDA estimates the national corn crop to yield 154.3 bushel/acre, which corresponds to a dry weight of ~3.7
t/acre. Currently, one bushel of corn produces around 2.75 gallons of ethanol equating to 400 to 500 gallons per acre. Corn yields have experienced a long term general
uptrend from 70 bushels/acre in 1970 to the current yield as a result of enhanced seed research and development following the mapping of the corn genome. Corn ears
are widely used as a feedstock for first‐generation ethanol, but corn stover, the above‐ground portion of the plant that is left in the field after harvest, is increasingly being
utilized for second generation ethanol production.
Wheat is a grass that is cultivated worldwide. Wheat grain is used to make flour for breads, biscuits, pasta and couscous; and for fermentation to make beer, alcohol or vodka.
Wheat can be used as a feedstock to make bioethanol, and it has few sustainability issues. Wheat can also be used to make biobutanol.
Sweet sorghum is one of the many varieties of sorghum which have a high sugar content. Sweet sorghum will thrive better under drier and warmer conditions than many other crops
and is grown primarily for forage, silage, and syrup production. Sorghum has a very limited breeding history and as a result there has not been the same degree of testing for yield
improvements through genetic optimization as in other major biofuel feedstocks such as corn and sugarcane. While sorghum isn’t as well‐suited as sugarcane for the production of
refined sugar, it has value for ethanol, and its high lignocellulosic biomass content opens up the potential for use in the production of additional biofuels.
Soybeans are a class of legumes native to East Asia. The crop is primarily harvested as a food source due to its exceptionally high protein content (~40% of dry weight). In
addition to their protein, soybeans are also valued for their oil content which accounts for ~20% of the dry weight of the beans. According to the USDA, approximately 17% of soy
oil is used in industrial products. These products include biodiesel, inks, paints, plasticizers and waxes, among many others. China is the world’s largest producer of soybeans oil
with more than 10M tons in 2010. Global production of soy oil exceeded 41 million metric tonnes (90 billion pounds) in the 2010/2011 season.
Rapeseed is a yellow flowering plant of the mustard family that produces a seed which yields ~40% oil. It naturally contains 45+% euracic acid which is mildly toxic to
humans. Rapeseed is often grown as a high‐protein animal feed and also used in lubricants, soaps, and plastics manufacturing. According to the USDA, approximately 30%
of rapeseed oil is used in industrial products. In Europe, Rapeseed has become a preferred feedstock for biofuels as it has higher oil yields per unit of land than other crops
including soy beans, which only contain ~18‐20% oil. According to the Agricultural Marketing Resource Center, worldwide production was 61million tons in 2011 with China
and India being the largest producers at 14.7 million and 7.3 million tons respectively. The European Union accounted for 23 million tons of rapeseed output.
TABLE OF CONTENTS

Second and Third Generation Feedstocks
The Biofuels and Biochem Industry 17
Source: Clean tech Energy Report by Robert Baird, June 2011.
Note: Litre: Gallon = 1:0.26; Gallon: Barrel = 1: 0.0322; Tonne of Oil Equivalent (toe): Barrel of Oil Equivalent (boe) = 1: 7.4.
Miscanthus is a tall perennial grass closely related to sugar cane. Though native to the tropical and subtropical climates of Africa and Southeast Asia, it is also
being grown by at least 10 countries in Europe explicitly for use as an energy feedstock. It has entered into favor due to its high expected commercial yields of
12-13 BDT/acre (as reported by Mendel Biotechnology in LA and MS) with low moisture content in the range of 15‐20% if harvested in late winter or spring.
Waste is a unique feedstock since it can often generate additional revenue from tip‐fees, but its heterogeneous characteristic makes it difficult to convert to biofuels
and chemicals. Municipal Solid Waste (MSW) and Commercial & Industrial (C&I) waste are two waste streams that several companies in the industry are working to
convert into fuels and chemicals. According to Pike Research, the market research and consulting firm that provides in-depth analysis of global clean technology
markets, the global market for thermal and biological waste-to-energy technologies is set to reach at least $6.2 billion in 2012 and grow to $29.2 billion by 2022.
Jatropha is a genus covering ~150 types of plants, shrubs, and trees which produce seeds with oil content of up to 40%. Making it even more attractive as a
feedstock is its ability to grow on poor quality land and its resistance to drought and pests. It is native to South America and typically only grows in tropical or
subtropical environments. One drawback of Jatropha is that it also contains toxic matter which necessitates it be carefully processed before use in production. It
is estimated that Jatropha nuts are capable of providing up to 2,270 liters of biodiesel per hectare, and the plant is currently the subject of several trials for use in
biodiesel applications including a collaborative effort between Archer Daniels Midland, Bayer CropScience AG, and Daimler AG.
Southern pine presents a rich biomass source in the Southeastern portion of the U.S. These trees typically reach heights of 60‐120 feet (depending on species) and
are characterized by their rounded tops, long needles, and rapid growth rates. According to the DOE, there are roughly 200 million tons of no-merchantable forest
material alone and total forestland in the US is estimated to be 750 million acres.
Switchgrass is a perennial warm season grass native to North America. It can grow to heights of almost nine feet and an established stand has a lifespan of up to 10 years.
One of its defining characteristics is its large, underground root system which can weigh as much as 6-8 tons per acre, making the plant particularly adept at accumulating
carbon dioxide .The energy efficiency of producing ethanol from switchgrass is estimated to be much higher than corn with an energy input to output rate of 1:4 vs. 1:1.3. As
reported by the USDA, various switchgrass crops yield 5-9.4 tons per acre.
Algae offer the highest oil yields of any biofuel feedstock, but issues around capital cost have created challenges for commercial use: Algae are simple‐celled
organisms capable of creating complex organic compounds from inorganic molecules through photosynthetic pathways. Interest in using algae as a feedstock for
biofuel production has increased rapidly and more than 30 U.S. based firms are now working to commercialize such technology. Algae offer attractive yields
estimated to be upward of 4,000 to 5,000 gallons per acre. The DOE considers open pond algal configurations to have the most promise estimating 2012 fuel
costs to be $9.28/ gal with a roadmap to $2.27/ gal.
Camelina is an annual flowering plant and member of the mustard family, regarded for its oil properties. It typically stands 1‐3 feet tall, is heavily branched, and produces
small seeds high in oil content. It is able to grow effectively on land of marginal quality, needs minimal water input, and can withstand cold climates. Because of its high
oil‐yield of 35‐38% (~2x that of soybeans), it is specifically being studied for use in biodiesel applications.
TABLE OF CONTENTS
Comparative Yields
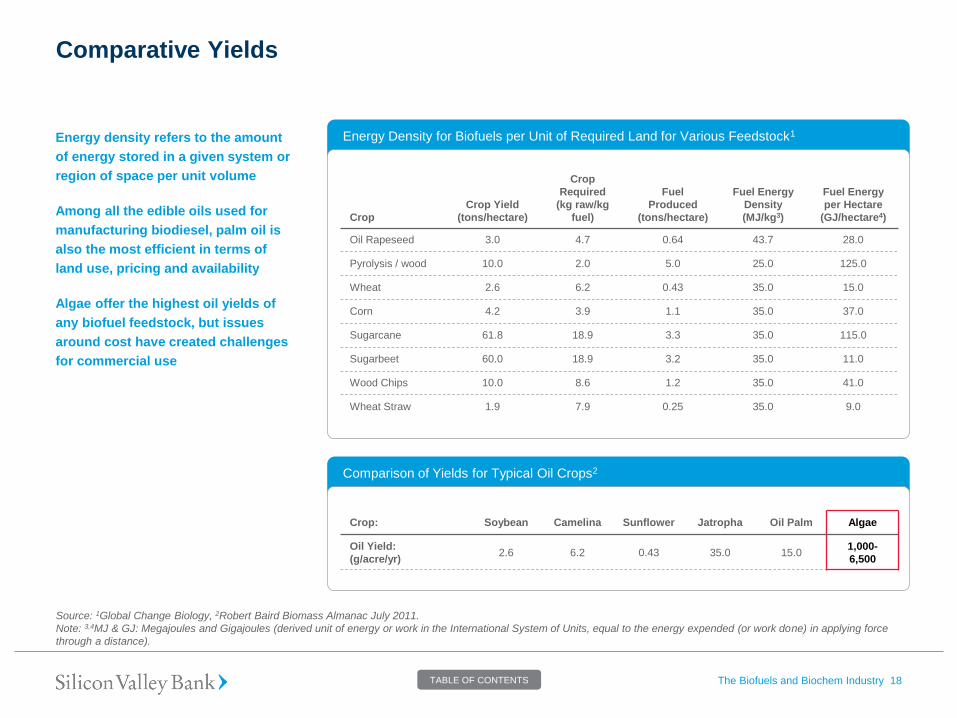
Energy density refers to the amount
of energy stored in a given system or
region of space per unit volume
Among all the edible oils used for
manufacturing biodiesel, palm oil is
also the most efficient in terms of
land use, pricing and availability
Algae offer the highest oil yields of
any biofuel feedstock, but issues
around cost have created challenges
for commercial use
The Biofuels and Biochem Industry 18
Source: 1Global Change Biology, 2Robert Baird Biomass Almanac July 2011.
Note: 3,4MJ & GJ: Megajoules and Gigajoules (derived unit of energy or work in the International System of Units, equal to the energy expended (or work done) in applying force
through a distance).
Energy Density for Biofuels per Unit of Required Land for Various Feedstock1
Crop
Crop Yield
(tons/hectare)
Crop
Required
(kg raw/kg
fuel)
Fuel
Produced
(tons/hectare)
Fuel Energy
Density
(MJ/kg3)
Fuel Energy
per Hectare
(GJ/hectare4)
Oil Rapeseed 3.0 4.7 0.64 43.7 28.0
Pyrolysis / wood 10.0 2.0 5.0 25.0 125.0
Wheat 2.6 6.2 0.43 35.0 15.0
Corn 4.2 3.9 1.1 35.0 37.0
Sugarcane 61.8 18.9 3.3 35.0 115.0
Sugarbeet 60.0 18.9 3.2 35.0 11.0
Wood Chips 10.0 8.6 1.2 35.0 41.0
Wheat Straw 1.9 7.9 0.25 35.0 9.0
Comparison of Yields for Typical Oil Crops2
Crop: Soybean Camelina Sunflower Jatropha Oil Palm Algae
Oil Yield:
(g/acre/yr) 2.6 6.2 0.43 35.0 15.0
1,000-
6,500
TABLE OF CONTENTS

Comparative Advantages and Disadvantages of Feedstock
The Biofuels and Biochem Industry 19
Source: Robert Baird Biomass Almanac July 2011.
Corn Sweet Sorghum Sugarcane Soybean Oil Rapeseed Oil Pine Oil
P
O
S
I
T
I
V
E
S
Ethanol industry
experienced with using
corn as a feedstock
Corn stover offers
potential for use in
cellulosic fuel
applications
Annual crop – short
growth cycle (90‐120+
days) allows for multiple
cuts (2‐3) to be made in
a given year
Low water requirements
and adaptable to wide
variety of environments
Less residual waste
biomass from harvesting
Cheapest available crop
(non‐cellulosic) for
ethanol production
Does not have to be
transitioned from a
complex carbohydrate to
a simple sugar prior to
fermentation
Does not compete as a
food source
Good oil content makes it
suitable for biodiesel
production
Seeds have very high oil
content by volume at
~40%
Can be used as an
animal feed as well as in
lubricants and plastics
manufacturing
High energy density and
saturated fat content
I
S
S
U
E
S
Use for corn in biofuels
stokes the “food vs. fuel”
argument
Subject to commodity
pricing volatility
High quality land required
as well as significant
water and fertilizer needs
Lower sugar yields
compared to sugarcane
Yields mixed sugars as
opposed to pure sucrose,
making it less conducive
for production of refined
sugars
Due to harvest timelines,
average mills only
operate an average of
~185 days per year
Requires high quality
land and significant water
and fertilizer inputs
Vegetative propagation
can lead to overcrowding
Competes as a food
source
Oil content lower than
many competing crops
used as targets for
biofuels
Production of biodiesel
from soybean oil results
in a net energy loss of
~30%
Shares significant
demand with Canola oil
which could add to price
volatility
Burning of peatland to
clear room for new
plantations leading to
significant deforestation
and GHG emissions
TABLE OF CONTENTS

Switchgrass Camelina Miscanthus Municipal Solid Waste Jatropha Southern Pine
P
O
S
I
T
I
V
E
S
Reliable biomass yields
due its propensity for
accumulating CO2
Higher energy content
than corn for ethanol
production
Wide adaptability and
capable of growth in dry
climates
ESelf‐seeding, requiring
no replanting after
harvesting
Can be grown on
marginal lands, in cold
climates, and with
minimal water
Short crop that can be
rotated with wheat
High oil yields of 35‐38%
Reliable biomass yields
Capable of relatively high
yields today
Can be grown effectively
without fertilizers – less
leaching
Can generate a
significant revenue
stream from tip‐fees
Continuously generated
– no need for agriculture
and spending
Collection and hauling
logistics and
infrastructure is in place
Can be grown on low
quality land
Naturally resistant to
drought and pests –
though yields shown to
be significantly higher
when irrigated
Does not compete as a
food source as it is
non‐edible
Shuttering of paper &
processing mills in U.S.
have led to a growth
surplus
Wood waste offers an
inexpensive source of
biomass
Trees have longer
growth cycles than other
energy crops
I
S
S
U
E
S
Additional research
required before
commercially viable
Additional time/research
needed before
commercially viable
Limited adoption thus far
in North America
Studies have found it
dries up soil more than
other crops which can
reduce surface water
supplies
Heterogeneous
characteristic makes
conversion difficult
Often requires
gasification which can
carry high CAPEX
requirements
Contains toxic matter
which must be separated
before used in production
Still requires significant
yield improvements
before economically
viable at commercial
scale
Collection processes for
residual wood waste still
need development
Rising demand for pulp
globally could provide
upward pricing pressures
Cannot be utilized as
feedstock by
non‐cellulosic conversion
technologies
Comparative Advantages and Disadvantages of Feedstock (con’t)
The Biofuels and Biochem Industry 20
Source: Robert Baird Biomass Almanac July 2011.
TABLE OF CONTENTS

Petroleum Replacement Overview
The Biofuels and Biochem Industry 21
Source: ZeaChem,, Inc..
Market Size Customers
Conversion
Technology
Propionic
C3 Propanol Propylene
Butyric
C4
Acetic
C2
Butanol Butene
Alkylate/
Polygas
Poly-
propylene
Acrylics
Alkylate
Acetic
Sales
Ethanol Ethylene
Drop-in
Gasoline/Alkylate
Automative/
Packaging
Rayon/Filters
VAM
Acetic
Anhydride
Paint/Adhesives
Packaging
PET
Rubber/Plastics
Drop-in Gasoline
Gasoline Blending
Jet/Diesel
Cellulosic
Acetate
Ethylene glycol
Linear a-
olefins
EVA
Poly-ethylene
Super-Absorbents
$485 billion Refiners
$110 billion
Consumer
Products
Chemical
Companies
$180 billion
Consumer
Products
Paint Companies
Chemical
Companies
$245 billion
$60 billion
$1 billion
Airlines/Dod
Refiners
Refiners
Consumer
Products
TABLE OF CONTENTS

Conversion Technologies – Fermentation and Fluid Catalytic Cracking
The Biofuels and Biochem Industry 22
Fermentation Fluid Catalytic Cracking
TECHNOLOGY
Definition: Fermentation is the process by which bacteria such
as yeast, convert simple sugars to alcohol and carbon dioxide
through their metabolic pathways. The most common input for
fermentation in the United States is corn, but in warmer climates
sugarcane or sugar beet are the principal types of feedstock.
Resulting alcohols such as ethanol and butanol can be utilized
as blendstock with gasoline or in the case of butanol, can act as
a gallon for gallon replacement
Feedstock: Simple sugars – corn and sugarcane are most
commonly used today in the production of ethanol
Output : Alcohols including ethanol and butanol, and distiller’s
grains
Definition: Fluid Catalytic Cracking (FCC) is a proven process
in the petroleum industry used to convert crude oil into higher
value products such as gasoline and naptha. FCC reactions
occur at extremely high temperatures (up to 1,000+ F°) and
use fine, powdery catalysts capable of flowing likely a liquid
which break the bonds of long‐chain hydrocarbons into smaller
carbon‐based molecules. FCC technology is applied to organic
sources of carbon such as woody biomass to convert the
cellulosic content into usable hydrocarbons with equivalence to
crude oils – this process is referred to as Biomass Fluid
Catalytic Cracking (BFCC). FCC was first commercialized in
1942, and is presently used to refine ~1/3 of the U.S.s’ total
annual crude volume
Feedstock: Feedstock agnostic – can utilize cellulosic biomass
Output: Biocrude, gases
POSITIVES
Ability to genetically modify metabolic pathways of
organisms to yield different carbon molecule outputs
(ethanol, butanol)
Process already demonstrated at commercial scale via
first‐generation ethanol production
Common outputs such as ethanol / butanol have existing
markets in both fuels and chemicals
Commercially proven technology in the petroleum industry
Can process low‐cost cellulosic biomass
ISSUES
Costly to develop/purchase enzymes to break down
cellulosic materials to make simple sugars available for
fermentation
First‐generation feedstock susceptible to commodity price
volatility
High capital costs for facilities
Proven for petroleum but limited to demonstration testing for
biomass
Source: Robert Baird, Clean Tech report July 2011.
TABLE OF CONTENTS

Conversion Technologies – Anaerobic Digestion and Gasification
The Biofuels and Biochem Industry 23
Source: Robert Baird, Clean Tech report July 2011.
Anaerobic Digestion Gasification
TECHNOLOGY
Definition: Anaerobic digestion is the process by which
bacteria decompose wet organic matter in the absence of
oxygen. The result is a byproduct known as biogas which
consists of ~60% methane and ~40% carbon dioxide. Biogas
can then be combusted in the presence of oxygen to generate
energy. Effectively any feedstock can be converted to biogas
via digestion including human and animal wastes, crop
residues, industrial byproducts, and municipal solid waste.
Anaerobic digestion is the same process that created natural
gas reserves found throughout the world today
Feedstock: Starches, celluloses, municipal solid waste, food
greases, animal waste, and sewage
Output: Biogas
Definition: Gasification is a process by which carbon‐based
materials such as coal, petroleum coke, and biomass are
separated into their molecular components by a combination of
heat and steam, forming a gaseous compound known as
synthesis gas or syngas as it is commonly called
Feedstock flexibility: Feedstock flexible including use of
municipal solid waste
Output: Syngas which has the capacity to be used in a variety
of applications including the production of transportation fuels,
electricity, and heat. Other byproducts include sulphur and slag
POSITIVES
Commercially proven technology
Can be used to process wet organic matter
Resulting materials can be processed into valuable fertilizer
Utilization of methane to produce biogas reduces impact of
GHG emissions from landfill gas
Low capital and costs and potential for low operating cost
Input flexibility allows costs to be reduced through lower cost
feedstock
Energy conversion ratio potentially higher than competing
technologies because biomass‐to‐liquid (BTL) gasification
can convert all of the cellulosic material into transportation
fuels
Lower emission levels than traditional power production
ISSUES
Slower process than many alternatives
Cannot be used to convert lignin
Accumulates heavy metals and contaminants in the
resulting sludge
Gas clean‐up has disrupted projects in the past
Gas quality suffers from irregularity due to challenges in
removing tar content– energy density ~50% of natural gas
High capital and operating costs – this could be reduced in
future by co‐location next to feedstock sources
TABLE OF CONTENTS

Conversion Technologies – Pyrolysis and Transesterification
The Biofuels and Biochem Industry 24
Source: Robert Baird, Clean Tech report July 2011.
Pyrolysis Transesterification
TECHNOLOGY
Definition: Pyrolysis is the process by which organic materials
are decomposed by the application of intense heat in the
absence of oxygen to form gaseous vapors which when cooled
form charcoal and/or bio‐oil can potentially be used as a direct
fuel substitute or an input for the manufacture of transportation
fuels
Feedstock: Capable of using a wide variety of feedstock
including agriculture crops, solid waste, and woody biomass
(currently most common)
Output: Bio‐oil (energy density of ~16.6 megajoules/liter) which
must be processed further before it can be utilized as a
transportation fuel. It also yields syngas and biochar
Definition: Transesterification is the process by which a
triglyceride is chemically reacted with an alcohol to create
biodiesel and glycerin. While there are a few variants, the
predominance of biodiesel is created through base catalyzed
transterification because of its high conversion yields and
comparatively low pressure and temperature requirement.
Transesterification is necessary because vegetable oils/animal
fats cannot be used directly to run in combustion engines
because of their high levels of viscosity
Feedstock: Soybean oil, palm oil, jatropha oil, rapeseed oil,
animal fats, food grease, etc.
Outputs: Biodiesel and glycerol
POSITIVES
Flexibility of feedstock diversifies risk related to feedstock
supply/demand pressures
Marketable biochar output provides secondary revenue
stream from production
Results in lower‐viscosity biodiesel allowing it to replace
petroleum in diesel engines
Glycerin byproduct can be sold to generate secondary
revenue stream
Low cost and high availability of methanol and sodium
hydroxide reduces input costs
Relatively low reaction temperature of 60 degrees C keeps
utility costs down
ISSUES
Potentially corrosive characteristics requiring specialized
components in fuel systems to adequately house it
Viscosity increases during storage meaning it must be used
more frequently than traditional fossil fuels
Requires separation/recovery of base catalyst / glycerin from
solution
Free fatty acid and water contamination can result in
negative reactions
TABLE OF CONTENTS

Conversion Technologies – Syngas Fermentation
The Biofuels and Biochem Industry 25
Source: Coskata Inc, LanzaTech Inc, Advanced Biofuels USA “Syngas Fermentation, The Third Pathway for Cellulosic Ethanol.
Syngas Fermentation
TECHNOLOGY
Definition: Syngas Fermentation is the process by which
gasification breaks the carbon bonds in the feedstock and
converts the organic matter into synthesis gas. The syngas is
sent to bioreactor where microorganisms directly convert the
syngas to a fuels and/or chemicals
Feedstock: Capable of using a wide variety carbon containing
feedstocks including agricultural crops, solid waste, woody
biomass and fossil fuels such as coal and natural gas
Output: Ethanol, 2.3-BDO, Acetic Acid, Acetone, Propanol,
Butanol, MEK, Isoprene, Acrylic Acid, Butadiene, Succinic Acid
POSITIVES
Process does not rely on expensive enzymes or
pretreatment chemicals thus operating costs should be lower
than non-gasification based technology
Ability to convert nearly all feedstock into energy with
minimal by-products. Microorganisms are able to produce
only one fuel/chemical under low temperature and pressure
ISSUES
Imperative to keep the right nutrient and chemical balance in
order to keep the microorganisms alive and productive. Any
contaminants could spread quickly through the bioreactor
Reliability and Continuous Operations: Since the organisms
live off the energy contained in the synthesis gas, it is critical
that they continue to be through a well operating system
design
TABLE OF CONTENTS

The Importance of Biofuels/Biochemicals
The Biofuels and Biochem Industry 26 TABLE OF CONTENTS

Biofuels/Biochemicals Growth – Summary
• The sector has received increasing attention from both public and private investors due to several growth drivers including the desire for
energy independence, the increasing demand for liquid fuels for transportation especially in emerging markets, technological advances
across the industry’s value chain and environmental concerns (Green house gas (GHG) emissions). The most important driver, however,
spurring investment in the industry is the continued volatility and high price of crude oil.
• Biofuels/Biochemicals constitute a 3% share in the total global chemicals & fuels market in 2010 and is expected to touch 17% in 2025.
• As “easy“ conventional oil resources continue to decline and more expensive nonconventional liquid sources make up the difference,
biofuels/ biochemicals will play an increasing role in diversifying the liquid energy landscape.
• Liquids demand is growing mainly driven by rapidly-growing non- Organization for Economic Co-operation and Development (OECD)
economies and will be met by supply growth from Organization of the Petroleum Exporting Countries (OPEC) and the Americas. China (+8
million barrels per day), India (+3.5 million barrels per day), and the Middle East (+4 million barrels per day) account for nearly all of the net
global increases.
• Liquid biofuels accounted for a modest 2.7% of global road-transport fuels in 2010 , but will play an expanded role of meeting liquid demand.
• OPEC’s critical position in the oil market grows given its oil reserve position while the Americas also play an expanding role by utilization of
new recovery technologies in tight oil formations and Canadian oil sands.
• Exporting oil producing nations, “petro-states”, rely heavily on oil revenues to support their economies (50-90% of GDP). Oil price decreases
can cause major deficits, budget cuts, considerable social turmoil, and political change creating an incentive for petro states to keep
production in line with demand.
• Government legislation is driving the adoption of renewable fuels
— In February 2010, the US Environmental Protection Agency (EPA) submitted its final rule for Renewable Fuels Standard 2 (RFS-2),
setting forth volume targets of 36 billion gallons of renewable fuels produced in the U.S. by 2022 with 21 billion being advanced biofuels.
— The EU is targeting 10% of transport energy from renewables by 2020, counting both sustainable biofuels and electric vehicles.
The Biofuels and Biochem Industry 27 TABLE OF CONTENTS
Master Layout:
Call Out Text Left, Table Right
Compelling Market Opportunity
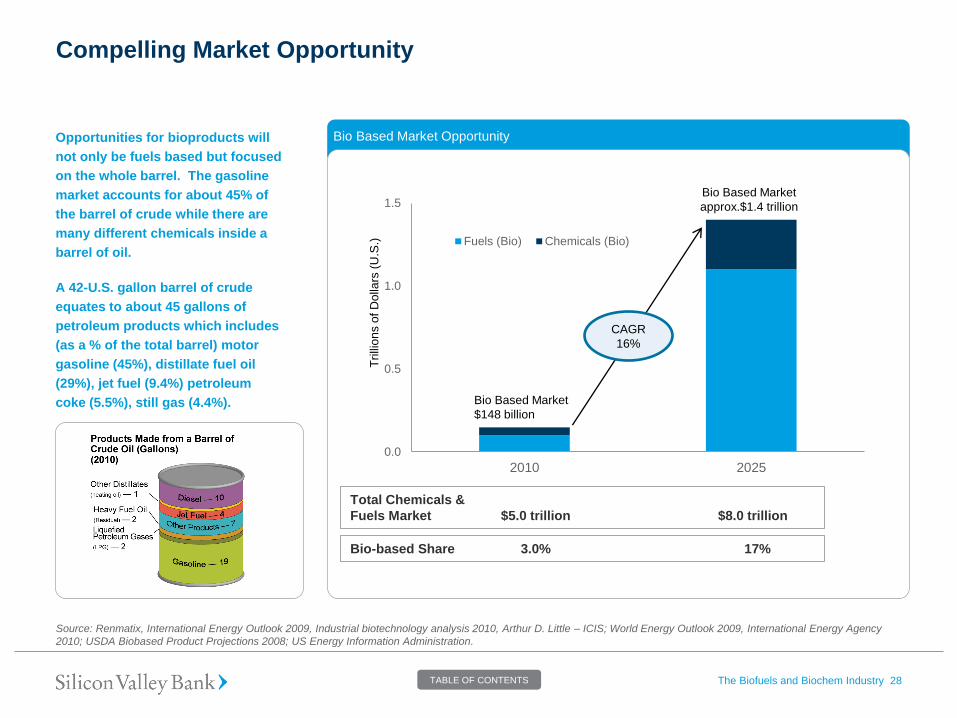
Bio Based Market Opportunity Opportunities for bioproducts will
not only be fuels based but focused
on the whole barrel. The gasoline
market accounts for about 45% of
the barrel of crude while there are
many different chemicals inside a
barrel of oil.
A 42-U.S. gallon barrel of crude
equates to about 45 gallons of
petroleum products which includes
(as a % of the total barrel) motor
gasoline (45%), distillate fuel oil
(29%), jet fuel (9.4%) petroleum
coke (5.5%), still gas (4.4%).
The Biofuels and Biochem Industry 28
Source: Renmatix, International Energy Outlook 2009, Industrial biotechnology analysis 2010, Arthur D. Little – ICIS; World Energy Outlook 2009, International Energy Agency
2010; USDA Biobased Product Projections 2008; US Energy Information Administration.
Total Chemicals &
Fuels Market $5.0 trillion $8.0 trillion
Bio-based Share 3.0% 17%
0.0
0.5
1.0
1.5
2010 2025
Fuels (Bio) Chemicals (Bio)
CAGR
16%
Tri
llio
ns o
f D
olla
rs (
U.S
.)
Bio Based Market
$148 billion
Bio Based Market
approx.$1.4 trillion
TABLE OF CONTENTS

Drivers of Biofuels/Biochemicals Growth
The rising cost of oil will create an
incentive for producers of
petroleum‐derived products to seek
renewable alternatives that provide
greater stability in pricing.
Strong public sentiment for the U.S.
to reduce its dependence on foreign
petroleum reserves is thus one of the
major drivers of the renewable fuel
industry.
U.S. oil imports drop due to rising
domestic output & improved
transport efficiency; EU imports to
overtake those of U.S. around 2015
and China expected to be the largest
importer by 2020.
The Biofuels and Biochem Industry 29
Source: 1Bloomberg, 2World Energy Outlook 2011.
Crude Oil Monthly spot prices ($ per barrel)1
$0.0
$20.0
$40.0
$60.0
$80.0
$100.0
$120.0
$140.0
$160.0 The volatility and price increases of oil are
the most significant drivers in the growth of
the Biofuel/Biochemical Industry: The
increasing demand for petroleum products,
supply shocks, and other factors have led to
volatile and high oil prices over the past
decade. In January 2000, European Brent
Crude spot prices were below $24/barrel
before peaking at over $140/barrel in 2008.
After some price relief in the midst of the global
economic downturn, Brent Crude is
~$97/barrel currently, representing a CAGR of
~13.5% from 2000‐2011.
Net Imports of Oil2
Biofuels and Biochemicals help reduce U.S.
dependence on foreign oil: U.S. reliance on
foreign imports has increased significantly
since the mid‐1980’s. It can be argued that as
the world’s current economic superpower and
the largest consumer of petroleum, the U.S.
will continue to command a reliable oil supply
from producing nations. However, with the
emergence of rapidly growing and
industrializing economies in China and India,
the global supply of oil may be spread
increasingly thin putting additional upward
pressure on energy prices 0.0
2.0
4.0
6.0
8.0
10.0
12.0
14.0
China India EU U.S. Japan
2000 2010 2035
Million barrels/day
TABLE OF CONTENTS

Drivers of Biofuels/Biochemicals Growth (con’t)
By 2035, the EIA projects that
transportation sector will account for
73% of all liquid fuels consumption.
Key drivers of transportation growth
include population expansion and
rising real disposable income which
leads to more frequent travel .
The global passenger vehicle fleet
doubles to 1.7 billion in 2035; most
cars are sold outside the OECD by
2020, making non-OECD policies key
to global oil demand.
The development and subsequent
scale‐up of cellulosic technologies
offers a clear advantage to reducing
price volatility of biofuel feedstock
and will play major role in driving
down the costs of renewable
fuels/chemicals.
The Biofuels and Biochem Industry 30
Source: 1World Energy Outlook 2011, 2Bloomberg, 3EIA, DOE, Timber Mart-South.
Note: OECD- Organization for Economic Co-operation and Development.
Vehicles per 1000 people in Selected Markets1
Increase in transportation applications driving
growth in liquid fuels consumption: The Energy
Information Administration (EIA) projects that U.S.
consumption of liquid fuels will increase from 19.1 million
barrels per day in 2009 to more than 21.9 million gallons
per day by 2035. The increase is expected to be driven
almost entirely by an increase in the use of liquid fuels for
transportation applications which is forecasted to grow
from 13.6 million barrels per day in 2009 to 16.1 million
barrels per day by 2035 .
Cellulosic biofuel technologies unlock non‐food
feedstock and reduce input cost volatility: Cellulose (corn
stover, switchgrass, miscanthus, woodchips etc) is not used
for food and can be grown in all parts of the world. The entire
plant can be used when producing cellulosic products. While
the U.S. is the world’s largest producer of the crop, corn
competes as a food source and is subject to significantly
more price volatility than residual waste biomass. Over the
past decade the value of the IMF’s Commodity Food Price
Index increased at a CAGR of 8.7% annually. This is ~3.6x
faster than the rate of inflation as measured by the
Consumer Price Index which had a CAGR of 2.4% annually
over the same period. From 2000 to 2011, the maximum 12-
month price increase was 18% for pine woodchips versus
50% for corn, 46% for sugar and 51% for West Texas
Intermediate crude according to average quarterly data from
Timber Mart-South, the USDA and the EIA.
Million barrels/day
0
100
200
300
400
500
600
700
800
UnitedStates
EuropeanUnion
China India Middle East
2010 2035
Commodity Food Price Index vs. CPI2
Million barrels/day
Relative Prices of Wood, Sugar, Soy Oil,
Corn, Nat Gas and Crude Oil Since 20003
0
50
100
150
200
250
300
350
400
450
500
2001 2002 2003 2004 2005 2006 2007 2008 2009 2010 2011
Ind
ex
(Q
1 2
00
0=
10
0)
World raw sugar (No.11, spot) Corn (No.2 yellow, Chicago spot)
US Nat Gas Industrial Price WTI Crude (Spot, FOB Cushing, OK)
Pine Pulpwood (Delivered AL)
0.0
50.0
100.0
150.0
200.0
250.0
300.0
350.0
400.0
Commodity Food Price Index CPI
TABLE OF CONTENTS

Drivers of Biofuels/Biochemicals Growth (con’t)
While in the near term proven
reserves are expected to increase
with new exploration efforts and
technological developments that
increase certainty of quantity, in the
long term, new sources of energy
must be discovered to satisfy global
energy demands.
Lifecycle GHG emissions are the
aggregate quantity of GHGs related
to the full fuel cycle, including all
stages of fuel and feedstock
production and distribution, from
feedstock generation and extraction
through distribution and delivery and
use of the finished fuel. The lifecycle
GHG emissions of the renewable fuel
are compared to the lifecycle GHG
emissions for gasoline or diesel.
The Biofuels and Biochem Industry 31
Source: 1BP Website, 2EPA.
Note: GHG - Greenhouse Gas.
Biofuels in Transportation1
Petroleum is a finite resource and
substitutes must be found: Petroleum is
naturally formed by the anaerobic decay of
organic matter in the presence of intense heat
and pressure which is thought to occur over
hundreds of thousands or even millions of
years. With such a long formation cycle, the
earth is not capable of regenerating its
reserves of oil at the same rate to which
humanity draws upon them for energy use.
Biofuel Lifecycle GHG Impact Relative to Gasoline2
Environmental concerns, particularly with
regard to global warming driving adoption
of “cleaner and greener” alternatives: The
EIA projects that CO2 emissions from the
combustion of liquid fuels will grow by ~28%
from 2007 to 2035. China is the largest
contributor to the rising pollution levels with
CO2 emissions growth estimated to be 2.9%
annually driven by its rapidly expanding
demand for liquid fuels in its industrial and
transportation sectors. The U.S., however, is
expected to remain the world’s largest polluter
with ~2.6 billion metric tons of emission in
2035. A wider push to renewable fuel sources
is viewed as a major step towards reversing
the pattern of global warming.
100%105%
82%
134%
82% 74%104%
20%
74%
-24% -16%
-40.0%
0.0%
40.0%
80.0%
120.0%
160.0%
Gaso
line
Co
rn E
thanol(N
at. g
as d
ry
mill)
Co
rn E
thanol(B
est C
ase
Nat.g
as d
ry m
ill)
Co
rn E
thanol (
Coal d
ry
mill)
Co
rn E
thanol (
Bio
mass D
ry
Mill)
Co
rn E
thanol (
Bio
mass D
ry
Mill w
ith
CH
P)
So
y-b
ased B
iodie
sel
Waste
Gre
ase B
iodie
sel
Sug
arc
an
e E
thanol
Sw
itch
gra
ss E
thanol
Co
rn S
tover E
thanol
2010 2035
Other fuels:
91.0% Other fuels:
97.3%
Biofuels: 2.7% Biofuels: 9.0%
TABLE OF CONTENTS

Master Layout:
Call Out Text Left, Table Right
0.0
500.0
1000.0
1500.0
2000.0
2500.0
3000.0
3500.0
4000.0
4500.0
5000.0
1990 1995 2000 2005 2010 2015 2020 2025 2030
North America South & Central America Europe & Eurasia Middle East Africa Asia Pacific
Liquid Demand Statistics
Total Liquids Consumption by Region1 Liquids demand growth from non-
OECD countries will be met by
supply growth from OPEC and the
Americas
Liquids demand growth is driven by
non-OECD transport while OECD
demand falls across all sectors
Overall consumption growth will be
constrained by stronger crude oil
prices seen in recent years,
technological advances, a range of
new policies, and the continued,
gradual reduction of non-OECD
subsidies
The Biofuels and Biochem Industry 32
Source: 1BP Energy Outlook 2030: January 2012.
Note: OECD- Organization for Economic Co-operation and Development.
Note: Litre: Gallon = 1:0.26; Gallon: Barrel = 1: 0.0322; Tonne of Oil Equivalent (toe): Barrel of Oil Equivalent (boe) = 1: 7.4.
3,148 3,271 3,571 3,908 4,028 4,166 4,378 4,562 4,719 Total Liquids
Consumption
(MTOE)
Million tones of oil equivalent
(MTOE)
7.1
153.2
9.2
90.0
8.5
116.8
19.9 59.3
188.0 of which
biofuels
TABLE OF CONTENTS

Master Layout:
Call Out Text Left, Table Right
Liquid Supply Statistics
Total Liquids Production by Region1 Rising supply to meet expected
demand growth should come
primarily from OPEC, where output is
projected to rise by nearly 12 Mb/d.
The largest increments of new OPEC
supply will come from NGLs2, as well
as conventional crude in Iraq and
Saudi Arabia
OPEC’s critical position in the oil
market grows while the Americas
also play an expanding role
Non-OPEC supply will continue to
rise, growing by 5 Mb/d, due to
strong growth in the Americas from
U.S. and Brazilian biofuels, Canadian
oil sands, Brazilian deepwater, and
U.S. shale oil, offsetting continued
declines in a number of mature
provinces
The Biofuels and Biochem Industry 33
Source: 1BP Energy Outlook 2030: January 2012, 2Natural Gas Liquids.
Note: OPEC- Organization of the Petroleum Exporting Countries. Mb/d – Million Barrels per Day.
Note: Litre: Gallon = 1:0.26; Gallon: Barrel = 1: 0.0322; Tonne of Oil Equivalent (toe): Barrel of Oil Equivalent (boe) = 1: 7.4.
0.0
500.0
1000.0
1500.0
2000.0
2500.0
3000.0
3500.0
4000.0
4500.0
5000.0
1990 1995 2000 2005 2010 2015 2020 2025 2030
North America South & Central America Europe & Eurasia Middle East Africa Asia Pacific
3,172 3,284 3,612 3,907 3,914 4,089 4,263 4,398 4,512 Total Oil
Production
(MTOE)
Million tones of oil equivalent
(MTOE)
7.1
153.2
9.2
90.0
8.5
116.8
19.9 59.3
188.0 of which
biofuels
TABLE OF CONTENTS
Energy Market Growth
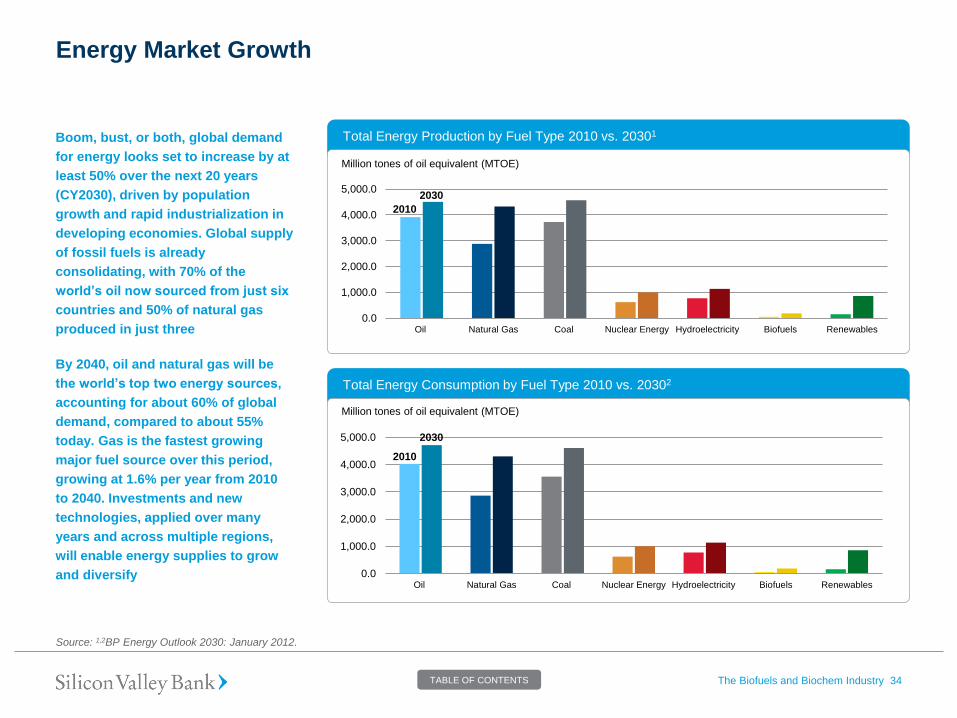
Boom, bust, or both, global demand
for energy looks set to increase by at
least 50% over the next 20 years
(CY2030), driven by population
growth and rapid industrialization in
developing economies. Global supply
of fossil fuels is already
consolidating, with 70% of the
world’s oil now sourced from just six
countries and 50% of natural gas
produced in just three
By 2040, oil and natural gas will be
the world’s top two energy sources,
accounting for about 60% of global
demand, compared to about 55%
today. Gas is the fastest growing
major fuel source over this period,
growing at 1.6% per year from 2010
to 2040. Investments and new
technologies, applied over many
years and across multiple regions,
will enable energy supplies to grow
and diversify
The Biofuels and Biochem Industry 34
Source: 1,2BP Energy Outlook 2030: January 2012.
Total Energy Production by Fuel Type 2010 vs. 20301
Total Energy Consumption by Fuel Type 2010 vs. 20302
Million tones of oil equivalent (MTOE)
Million tones of oil equivalent (MTOE)
0.0
1,000.0
2,000.0
3,000.0
4,000.0
5,000.0
Oil Natural Gas Coal Nuclear Energy Hydroelectricity Biofuels Renewables
0.0
1,000.0
2,000.0
3,000.0
4,000.0
5,000.0
Oil Natural Gas Coal Nuclear Energy Hydroelectricity Biofuels Renewables
2010
2030
2010
2030
TABLE OF CONTENTS

Energy Market Growth (con’t)
The Biofuels and Biochem Industry 35
Source: 1,3BP Energy Outlook 2030: January 2012, 2World Energy Outlook 2011.
Note: Litre: Gallon = 1:0.26; Gallon: Barrel = 1: 0.0322; Tonne of Oil Equivalent (toe): Barrel of Oil Equivalent (boe) = 1: 7.4.
Total Energy Consumption by Region1 Shares of Energy Sources in World Primary Energy Demand2
0.0
5,000.0
10,000.0
15,000.0
20,000.0
25,000.0
30,000.0
OECD Non-OECD European Union Europe Former Soviet Union US China
Total Growth of Energy Consumption to 20303
Million tones of oil equivalent (MTOE)
Total energy consumption will increase from 12,002.4 mtoe in 2010 to 16,631.6 MTOE
in 2030. Global energy demand is expected to increase by one-third from 2010 to 2035,
with China & India accounting for 50% of the growth
0%
10%
20%
30%
40%
50%
Oil Coal Gas
Biomass & waste Nuclear Other Renewables
Hydro
Total Growth of Energy Consumption to 20303
0.0
0.5
1.0
1.5
2.0
2.5
Transport Industry Other
Coal Oil Biofuels Gas Electricity
-0.5
0.0
0.5
1.0
1.5
2.0
Transport Industry Other
China & India OECD Middle East ROW
Billion tones of oil
equivalent (BTOE)
Billion tones of oil
equivalent (BTOE) Final Energy Use Final Energy Use By Sector & Region By Sector & Fuel
TABLE OF CONTENTS
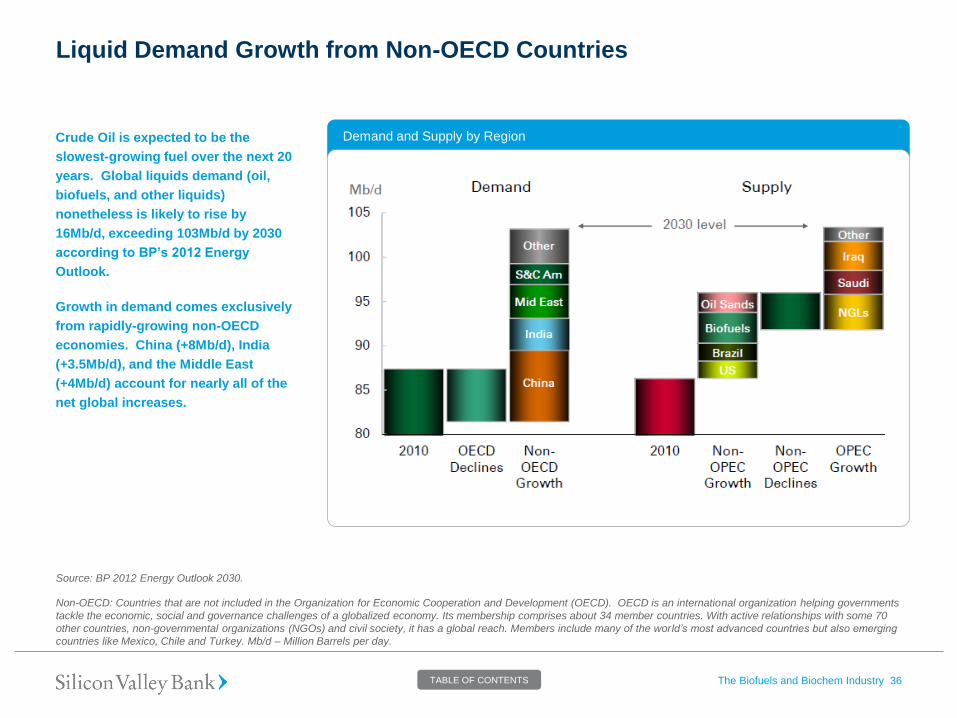
Liquid Demand Growth from Non-OECD Countries
Crude Oil is expected to be the
slowest-growing fuel over the next 20
years. Global liquids demand (oil,
biofuels, and other liquids)
nonetheless is likely to rise by
16Mb/d, exceeding 103Mb/d by 2030
according to BP’s 2012 Energy
Outlook.
Growth in demand comes exclusively
from rapidly-growing non-OECD
economies. China (+8Mb/d), India
(+3.5Mb/d), and the Middle East
(+4Mb/d) account for nearly all of the
net global increases.
The Biofuels and Biochem Industry 36
Source: BP 2012 Energy Outlook 2030.
Non-OECD: Countries that are not included in the Organization for Economic Cooperation and Development (OECD). OECD is an international organization helping governments
tackle the economic, social and governance challenges of a globalized economy. Its membership comprises about 34 member countries. With active relationships with some 70
other countries, non-governmental organizations (NGOs) and civil society, it has a global reach. Members include many of the world’s most advanced countries but also emerging
countries like Mexico, Chile and Turkey. Mb/d – Million Barrels per day.
Demand and Supply by Region
TABLE OF CONTENTS
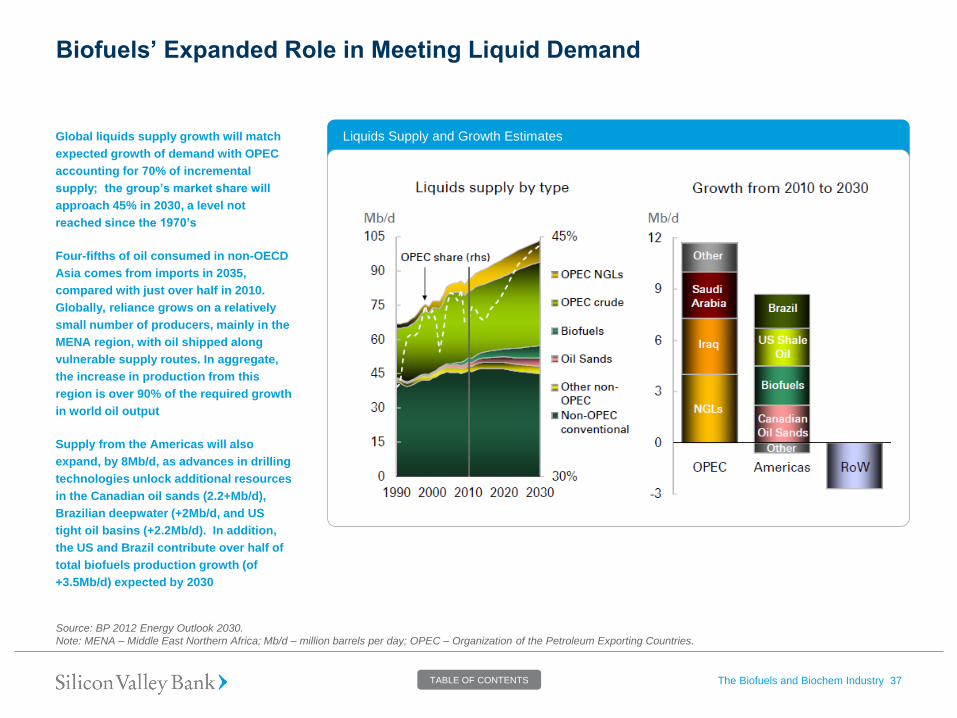
Biofuels’ Expanded Role in Meeting Liquid Demand
Global liquids supply growth will match
expected growth of demand with OPEC
accounting for 70% of incremental
supply; the group’s market share will
approach 45% in 2030, a level not
reached since the 1970’s
Four-fifths of oil consumed in non-OECD
Asia comes from imports in 2035,
compared with just over half in 2010.
Globally, reliance grows on a relatively
small number of producers, mainly in the
MENA region, with oil shipped along
vulnerable supply routes. In aggregate,
the increase in production from this
region is over 90% of the required growth
in world oil output
Supply from the Americas will also
expand, by 8Mb/d, as advances in drilling
technologies unlock additional resources
in the Canadian oil sands (2.2+Mb/d),
Brazilian deepwater (+2Mb/d, and US
tight oil basins (+2.2Mb/d). In addition,
the US and Brazil contribute over half of
total biofuels production growth (of
+3.5Mb/d) expected by 2030
The Biofuels and Biochem Industry 37
Source: BP 2012 Energy Outlook 2030.
Note: MENA – Middle East Northern Africa; Mb/d – million barrels per day; OPEC – Organization of the Petroleum Exporting Countries.
Liquids Supply and Growth Estimates
TABLE OF CONTENTS

Biofuels for Transportation
• Demand for liquid transport fuels is expected to increase by 2 million
barrels per day over the next two decades and nearly 40% of the growth
will be supplied by biofuels, the first time that non-fossil fuels will be the
major source of supply growth.
• Liquid biofuels make a small but growing contribution to fuel usage
worldwide.
— Provided about 2.7% of global road transport fuels in 2010
— Accounted for higher shares in some countries (e.g., 4% in the U.S.)
and regions (3% in the EU) and provided a very large contribution in
Brazil, where ethanol from sugar cane accounted for 41.5% of light
duty transport fuel during 2010
• The U.S. was the world’s largest producer of biofuels, followed by Brazil
and the EU. Despite continued increases in production, growth rates for
biodiesel slowed again in 2010, whereas ethanol production growth
picked up new momentum.
• In 2010, global production of fuel ethanol reached an estimated 86 billion liters, an increase of 17% over 2009
— The U.S. and Brazil accounted for 88% of ethanol production in 2010, with the U.S. alone producing 57% of the world’s total
— Long the world’s leading ethanol exporter, Brazil continued to lose international market share to the U.S, particularly in its traditional markets in Europe
— Adverse weather conditions hampered global harvesting of sugar cane, pushing up prices. As a result, U.S. corn-based ethanol became relatively
cheaper in international markets (although it was subsidized, unlike Brazilian ethanol)
• Global biodiesel production increased 7.5% in 2010, to nearly 19 billion liters, a five-year average (end-2005 through 2010) growth of 38%
— Biodiesel production is far less concentrated than ethanol, with the top 10 countries accounting for just under 75% of total production in 2010
— Germany remains the world’s top biodiesel producer at 2.9 billion liters in 2010, followed by Brazil, Argentina, France, and the U.S.
— The EU remained the center of biodiesel production, but due to increased competition with relatively cheap imports, growth in the region continued to
slow. The diversity of players in the advanced biofuels industry continued to increase with the participation of young, rapidly growing firms, major
aviation companies, and traditional oil companies
The Biofuels and Biochem Industry 38
Ethanol and Biodiesel Production, 2000–20101
17.0 19.0
21.0
24.0 29.0 31.0
39.0
52.0
66.0 73.0
86.0
0.8 1.0 1.4 1.9 2.4 3.7 6.6
11.0
16.0
17.0
19.0
0.0
10.0
20.0
30.0
40.0
50.0
60.0
70.0
80.0
90.0
100.0
2000 2001 2002 2003 2004 2005 2006 2007 2008 2009 2010
Ethanol Biodiesel
Billion liters
World ethanol production for transport fuel tripled between 2000 and 2007 from 17
billion liters to more than 52 billion liters, while biodiesel expanded eleven-fold
from less than 1 billion liters to almost 11 billion liters
Source: 1F.O. Licht (world-renowned renewable fuels research agency).
Note: Litre: Gallon = 1:0.26; Gallon: Barrel = 1: 0.0322; Tonne of Oil Equivalent (toe): Barrel of Oil Equivalent (boe) = 1: 7.4.
TABLE OF CONTENTS

Increasing Marginal Cost of Production
Advanced biofuel and chemical
companies are projecting crude oil parity
un-subsidized at $60-$80/ barrel at scale1.
The cost of bringing oil to market rises as
oil companies are forced to turn to more
difficult and costly sources to replace
lost capacity and meet rising demand.
Oil Shale, better known as “tight oil”, is
expected to continue to increase
domestic oil production. Well costs
alone have doubled in the last 5 years to
$8-10MM per well with steep reservoir
decline curves (<5yrs) requiring more
wells drilled each year to sustain existing
production.
The U.S. EIA projects world oil
production to grow 1.0% per year from
2008 to 2035 reaching 112.2 mbpd in
2035. Total non-conventional resources
and specifically biofuels are projected to
make up 13.1mbpd and 4.7mbdp,
respectively.
The Biofuels and Biochem Industry 39
Source: Booz Allen Hamilton analysis based on information from IEA, DOE and interviews with super-majors. 1Vinod Khosla 1/27/11 “What Matters in Biofuels & where are we?”, Company estimates, SVB estimates.
Note: EOR - Enhanced Oil Recovery is a generic term for techniques for increasing the amount of crude oil that can be extracted from an oil field, GtL – Gas to Liquids, CtL – Coal
to Liquids, FSU – Former Soviet Union.
Total Production Costs ($/Bbl)
Conventional oil: Crude oil that is produced by a well drilled into a geologic formation in which the reservoir and fluid characteristics permi t the oil
and natural gas to readily flow to the wellbore.
Non-conventional liquid sources: include biofuels, gas-to-liquids, coal-to-liquids, and unconventional petroleum products (extra-heavy oils, oil
shale, and bitumen) but do not include compressed natural gas (CNG), liquefied natural gas (LNG), or hydrogen.
TABLE OF CONTENTS

Ethanol Operating Margins2
Cost of Production Analysis
Conversion yields for cellulosic
production can range from 70 gal/ BDT to
160 gal/BDT depending on technology
and feedstock1.
Despite favorable projected conversion
yields, advanced fuels/chemicals will
need to show economies of scale in
regards to operating and capital costs.
Corn prices have risen in the past few
years further increasing the cost of
ethanol. According to the IMF, a
combination of low inventories, volatile
weather, rising China demand and
increased corn use in biofuels raises the
prospect of further corn price spikes over
2012-2013.
The USDA estimates CBOT corn prices to
average around $5.00/ bushel out to 2022.
Analyst predict energy crops (such as
timber) are poised to drop in price, which
are in the $50-$65/ton range in the US, as
biomass crops, agronomy and logistics
ecosystem evolve, more competition
develops and yields per acre improve.
The Biofuels and Biochem Industry 40
Source: 1Estimates based on private and publicly announced projects, 2International Monetary Fund 2011 World Economic Outlook.
Note: Bone Dry Ton (“BDT”).
Biofuel/Biochemical Cost of Production
Corn vs. Biomass Delta
Corn Cost of Production
Corn $ Bushel ("Bu") $5.00
Ethanol Conversion (gal/Bu) 2.8x
Assumed Corn Ethanol $ $1.79
Cellulosic Cost of Production
Biomass $ Bone Dry Ton ("BDT") $55.00
Conversion (gal/BDT) 100.0x
Assumed Cellulosic Fuel/Chemical $ $0.55
Corn vs Biomass Delta 3.3x
$ Bu
$4.50 $5.00 $5.50 $6.00 $6.50 $7.00 $7.50
$
BDT
$50 3.2x 3.6x 3.9x 4.3x 4.7x 5.0x 5.4x
$55 2.9x 3.3x 3.6x 3.9x 4.2x 4.6x 4.9x
$60 2.7x 3.0x 3.3x 3.6x 3.9x 4.2x 4.5x
$65 2.5x 2.8x 3.0x 3.3x 3.6x 3.9x 4.1x
$70 2.3x 2.6x 2.8x 3.1x 3.3x 3.6x 3.8x
$75 2.2x 2.4x 2.6x 2.9x 3.1x 3.3x 3.6x
$80 2.0x 2.2x 2.5x 2.7x 2.9x 3.1x 3.4x
Price in U.S. Dollars a Gallon
1) Current price of corn is $6.95 Bu; Prices have ranged from $2.00 to $7.00/ Bu over the last 10 years; Source: USDA.
2) According to Timber Mart South, Timber prices over the last 10 years have ranged from $40.00-$60.00 a BDT delivered depending on cut
and quality.
TABLE OF CONTENTS

Gasoline Price Influencers
High crude oil prices are the most
important long-term demand growth
driver for substitutes (drop-ins) such as
biomass derived gasoline and ethanol.
Researchers at Iowa State found that US
ethanol production reduced wholesale
gasoline prices by an average of $1.09
per gallon in 2011 amounting to over
$143.0 billion in consumer savings.
Essentially, gasoline in 2011 could have
topped out at over $6 a gallon1.
The Biofuels and Biochem Industry 41
Source: 1Iowa State University Working Paper, 2SVB estimates, 3Bloomberg, 4The Annual Energy Outlook 2011 prepared by the U.S. Energy Information Administration (EIA),
Sensitivity Petroleum Gasoline Conversion2
Crude Oil vs. Gasoline vs. Ethanol4 Crude Oil vs. World GDP vs. U.S. GDP3
WTI Price BBL $90.00
WTI Price gal (42x) $2.14
Refining Margina 16.0%
Refined Gasoline before Transportation Costs and
Taxes $2.49
National Average Taxesb $0.49
Refined Gasoline before Transportation Costs $2.97
Oil Price Refined Gasoline*
$100.00 $2.76
$110.00 $3.04
$120.00 $3.31
$130.00 $3.59
$140.00 $3.87
*before transportation cost and taxes.
aNational average wholesale gasoline prices / WTI crude oil since 2000 as
reported by EIA bJanuary 2012 American Petroleum Institute - taxes vary by state.
Note: Litre: Gallon = 1:0.26; Gallon: Barrel = 1: 0.0322; Tonne of Oil
Equivalent (toe): Barrel of Oil Equivalent (boe) = 1: 7.4.
-6.0%
-4.0%
-2.0%
0.0%
2.0%
4.0%
6.0%
$0.0
$20.0
$40.0
$60.0
$80.0
$100.0
$120.0
$140.0
$160.0
Crude Oil World GDP US GDP
$0.0
$1.0
$2.0
$3.0
$4.0
$5.0
$6.0
$7.0
$0.0
$50.0
$100.0
$150.0
$200.0
$250.0
2008 2009 2015 2020 2025 2030 2035
Imported Crude Oil Ethanol Wholesale Price Motor Gasoline
TABLE OF CONTENTS

Master Layout:
Call Out Text Left, Table Right Oil Market Price and Saudi Breakeven Threshold
Prices are expected to reach USD 200 per barrel by 2030 but fall well below Saudi Arabia’s breakeven price, threatening
oil market stability
Oil Market Price and Saudi Breakeven Threshold In the Middle East, oil exports account for
a substantial portion of GDP growth for
the region’s key economies. For example,
Saudi Arabia relies on oil revenue for
fully 80% of their budget. A sharp decline
in world oil prices from their peak in mid-
July 2008 had a significant impact on the
region in 2009.
Since then, oil prices have continued to
rise—in part because of the recovering
demand for liquids but also as a result of
the political unrest that began with
protests in the African countries of
Tunisia and Egypt and then spread to
Libya and to the Middle Eastern countries
Bahrain, Yemen, Iran, and Syria.
For oil-importing countries, an oil price
collapse is a boon for consumers.
However for oil exporting countries
(“petro-states”), it is a crisis as oil
revenues support their economy.
The Biofuels and Biochem Industry 42
Source: U.S. Energy Information Agency, Annual Energy Outlook 2012 Early Release; Jadwa Investment, 2011; “The Quest,” by Daniel Yergin.
Saudi Arabia breakeven price EIA reference Historical
0
50
100
150
200
250
300
350
2030 2025 2020 2015 2010 2005 2002
USD per barrel (nominal)
There are two possible responses if Saudi breakeven is far
above market price
• Saudi debt increases massively, threatening fiscal stability
• Saudi spending is severely cut, threatening political stability
Both options could be cataclysmic for global oil markets and
economies
TABLE OF CONTENTS

U.S. Renewable Fuel Standards (RFS)
The Renewable Fuel Standard (RFS,
also referred to as RFS-1) is a
provision of the US Energy Policy Act
(EPA) of 2005 that mandated 7.5
billion gallons of renewable fuels
production by 2012.
The Biofuels and Biochem Industry 43
Source: www.epa.gov.
History Activity
2005
• RFS program was created
under the Energy Policy
Act (EPA) of 2005
• Went in to effect in
September 2007
• Also called the RFS-1
program
Under the Energy Independence and Security Act (EISA) of 2007, the RFS
program was expanded in several key ways:
• Expansion of the RFS program to include diesel, in addition to gasoline
• EISA increased the volume of renewable fuel required to be blended into
transportation fuel from 9 billion gallons in 2008 to 36 billion gallons by 2022
• Established new categories of renewable fuel, and set separate volume
requirements for each one
• EISA required EPA to apply lifecycle greenhouse gas performance threshold
standards to ensure that each category of renewable fuel emits fewer
greenhouse gases than the petroleum fuel it replaces
2010
• RFS-2 final rule
submission
RFS-2 lays the foundation for achieving significant reductions of greenhouse gas
emissions from the use of renewable fuels, for reducing imported petroleum, and
encouraging the development and expansion of the nation's renewable fuels
sector
• In February 2010, the EPA submitted its final rule for RFS-2, its revision to the
previous renewable fuel standards (RFS-1)
• The ruling set forth volume targets of 36 billion gallons of renewable fuels
produced in the U.S. by 2022 with 21 billion being advanced biofuels (non‐ corn based ethanol)
In order to qualify for eligibility under RFS-2, the various categories of biofuels
must meet specified Greenhouse Gas (GHG) reduction thresholds
• These targets are not just a function of the gases emitted during burning, but
apply to the entire lifecycle of the fuel including feedstock production,
distribution, and end‐use
• The EPA estimates that by 2022, the RFS will reduce GHG emissions by up to
138 million metric tons
Cellulosic biofuels and Biomass‐based diesel both fall under the overarching
umbrella of advanced biofuels which is essentially anything other than corn
ethanol. Renewable fuels in turn cover the entire scope of fuels derived from
renewable sources which in turn encompasses advanced biofuels
U.S. – Renewable Fuel Standards (RFS)
TABLE OF CONTENTS
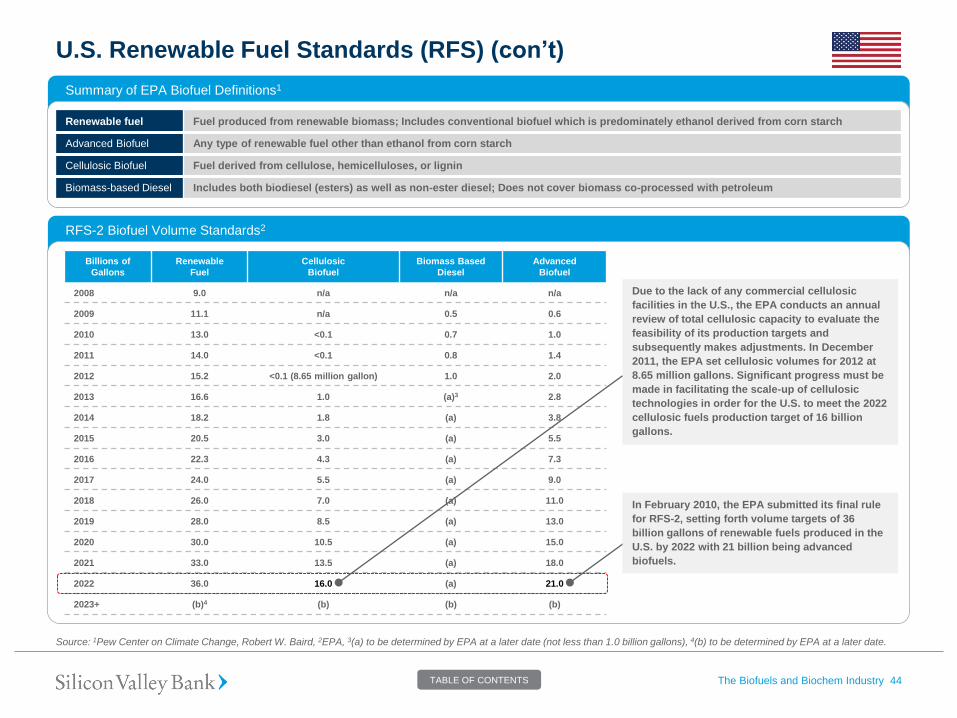
U.S. Renewable Fuel Standards (RFS) (con’t)
The Biofuels and Biochem Industry 44
RFS-2 Biofuel Volume Standards2
Billions of
Gallons
Renewable
Fuel
Cellulosic
Biofuel
Biomass Based
Diesel
Advanced
Biofuel
2008 9.0 n/a n/a n/a
2009 11.1 n/a 0.5 0.6
2010 13.0 <0.1 0.7 1.0
2011 14.0 <0.1 0.8 1.4
2012 15.2 <0.1 (8.65 million gallon) 1.0 2.0
2013 16.6 1.0 (a)3 2.8
2014 18.2 1.8 (a) 3.8
2015 20.5 3.0 (a) 5.5
2016 22.3 4.3 (a) 7.3
2017 24.0 5.5 (a) 9.0
2018 26.0 7.0 (a) 11.0
2019 28.0 8.5 (a) 13.0
2020 30.0 10.5 (a) 15.0
2021 33.0 13.5 (a) 18.0
2022 36.0 16.0 (a) 21.0
2023+ (b)4 (b) (b) (b)
Source: 1Pew Center on Climate Change, Robert W. Baird, 2EPA, 3(a) to be determined by EPA at a later date (not less than 1.0 billion gallons), 4(b) to be determined by EPA at a later date.
Summary of EPA Biofuel Definitions1
Renewable fuel Fuel produced from renewable biomass; Includes conventional biofuel which is predominately ethanol derived from corn starch
Advanced Biofuel Any type of renewable fuel other than ethanol from corn starch
Cellulosic Biofuel Fuel derived from cellulose, hemicelluloses, or lignin
Biomass-based Diesel Includes both biodiesel (esters) as well as non-ester diesel; Does not cover biomass co-processed with petroleum
Due to the lack of any commercial cellulosic
facilities in the U.S., the EPA conducts an annual
review of total cellulosic capacity to evaluate the
feasibility of its production targets and
subsequently makes adjustments. In December
2011, the EPA set cellulosic volumes for 2012 at
8.65 million gallons. Significant progress must be
made in facilitating the scale‐up of cellulosic
technologies in order for the U.S. to meet the 2022
cellulosic fuels production target of 16 billion
gallons.
In February 2010, the EPA submitted its final rule
for RFS-2, setting forth volume targets of 36
billion gallons of renewable fuels produced in the
U.S. by 2022 with 21 billion being advanced
biofuels.
TABLE OF CONTENTS

U.S. Renewable Identification Number (RIN)
Renewable Identification Number (RIN) is
a renewable fuel credit. A RIN credit is a
serial number assigned to each gallon of
renewable fuel as it is introduced into
U.S. commerce
RINs essentially act as credits for
“obligated parties” to meet requirements
under the RFS. An obligated party is any
company that provides a finished
gasoline or diesel fuel product to the
retail marketplace
The EPA assigned RIN values to
renewable fuels based on both energy
content in relation to ethanol as well as
renewable characteristics. As a result,
one gallon of one fuel is not necessarily
equivalent in terms of the RINs it
generates in relation to another. Corn
ethanol serves as the base and has a RIN
value of 1.0 on a per-gallon basis.
Biomass-based diesel, however, has RIN
value of 1.5, due to its higher energy
content and improved carbon footprint
The Biofuels and Biochem Industry 45
Source: www.epa.gov, www.rinbroker.com.
RIN credits were created by the EPA as part of the Renewable Fuel Standard (RFS) to track U.S.s’ progress toward
reaching the energy independence goals established by the U.S. Congress. RIN credits are the currency used by
obligated parties to certify compliance they are meeting mandated renewable fuel volumes. All gasoline produced for
U.S. consumption must contain either adequate renewable fuel in the blend or the equivalent in RIN credits. EPA
regulations require that the RIN be tracked throughout each link in the supply chain, as title is transferred from one
party to the next. RINs are assigned and travel with renewable fuel until the point in time where the biofuel is blended
with petroleum products to produce gasoline. Once the renewable fuel is in the gasoline, the RIN is separated and is
then eligible to trade as an environmental credit.
Transportation Cost • The cost to transport ethanol and other bio fuels plays a key role in the
overall RIN value
RFS Mandate • The mandated level of renewable fuel (the Renewable Fuel Standard) for the
specific year establishes the demand and drives price
Blend Properties • The physical properties of bio fuels, such as octane, vapor pressure, etc.,
compared with that of petroleum products is a consideration
Petroleum Product Prices • The price of bio fuels compared with the price of petroleum products is a factor
in the RIN value
Sustainability Purchases • RINs purchased and then retired as a mechanism to support a sustainability
initiative result in higher overall RIN prices
Year-end Deadlines
• The year end deadline and the overall readiness by industry can result in last
hour panic and a resulting price increase. RIN prices have seen a dramatic
increase from when the RFS program originally started in September 2007
Factors Influencing Price of RIN Credits
TABLE OF CONTENTS

Biofuels Blending Mandates by Country
The Biofuels and Biochem Industry 46
Source: Renewables 2011 Global Status Report.
Note: “E“ denotes ethanol, “B“ denotes biodiesel; “E5“ is a blend of 5% ethanol and 95% regular gasoline. Where no target date is provided, the mandate is already in place. List
shows binding obligations on fuel suppliers; there are other countries with future indicative targets that are not shown here, example - Chile has voluntary guidelines for E5 and
B5. Bolivia has an indicative mandate under the 2005 Biodiesel Act. Ecuador has instituted an E5 pilot program in the province of Guadalajara. South Africa has proposed
mandates of B2 and E8 by 2013. Mozambique has an approved but unspecified blend mandate.
U.K. U.S. India Italy Netherlands
Mandate
B3.25 National biofuels blending
mandate of 13.95 billion
gallons (53 billion liters) for
2011 and 36 billion gallons
(136 billion liters) annually by
2022
B10 and E10 as of 2008; B20
and E20 by 2017
4% for 2011;
4.5% for 2012;
5% by 2014
Renewable fuel share 4%
Belgium Brazil Canada China Germany
Mandate
As of mid-2009, all registered
fossil fuel companies in
Belgium must incorporate 4%
of biofuels in fossil fuels that
are made available in the
Belgian market
B5 by 2013; E20–E25 currently National: E5 by 2010 and B2
by 2012
Provincial: E5 and B3
currently, and B5 by 2012 in
British Columbia; E5 and B2
in Alberta; E7.5 in
Saskatchewan; E8.5 and B2 in
Manitoba; E5 in Ontario
E10 in nine provinces Biofuels share of 6.75% by
2010 and 7.25% by 2012;
biodiesel 4.4%; ethanol 2.8%
increasing to 3.6% by 2015
Spain Argentina Thailand Columbia
Mandate
Biofuels share of 6.2%
currently; 6.5% for 2012;
biodiesel 6% currently,
increasing to 7% by 2012
E5 and B5 B3 and E10 B7; B20 by 2012; E8 by 2010
TABLE OF CONTENTS
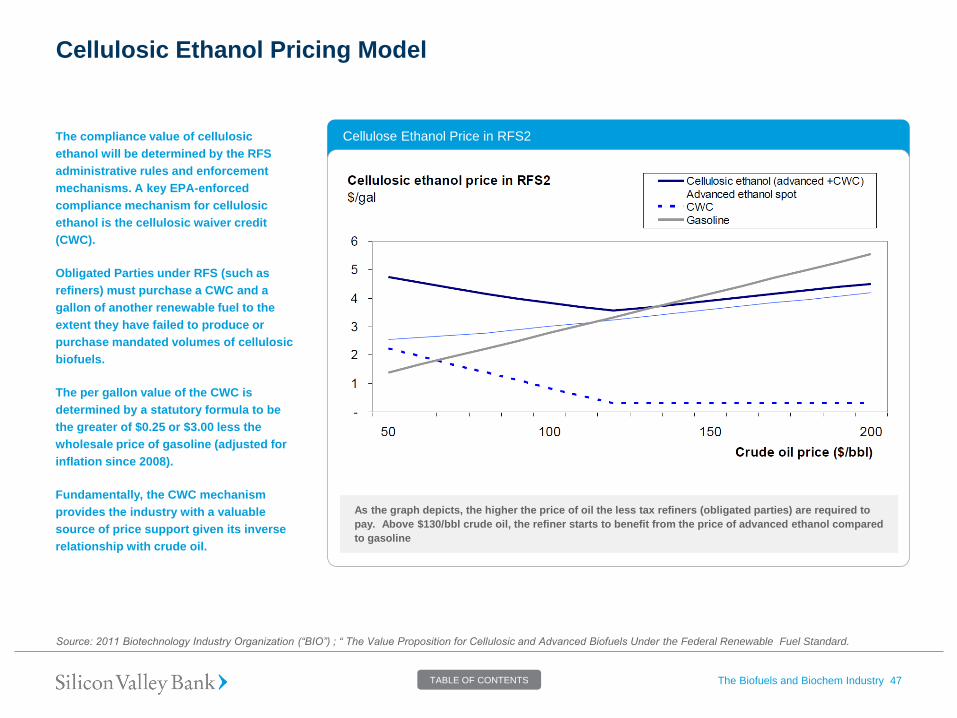
Cellulosic Ethanol Pricing Model
The compliance value of cellulosic
ethanol will be determined by the RFS
administrative rules and enforcement
mechanisms. A key EPA-enforced
compliance mechanism for cellulosic
ethanol is the cellulosic waiver credit
(CWC).
Obligated Parties under RFS (such as
refiners) must purchase a CWC and a
gallon of another renewable fuel to the
extent they have failed to produce or
purchase mandated volumes of cellulosic
biofuels.
The per gallon value of the CWC is
determined by a statutory formula to be
the greater of $0.25 or $3.00 less the
wholesale price of gasoline (adjusted for
inflation since 2008).
Fundamentally, the CWC mechanism
provides the industry with a valuable
source of price support given its inverse
relationship with crude oil.
The Biofuels and Biochem Industry 47
Source: 2011 Biotechnology Industry Organization (“BIO”) ; “ The Value Proposition for Cellulosic and Advanced Biofuels Under the Federal Renewable Fuel Standard.
Cellulose Ethanol Price in RFS2
As the graph depicts, the higher the price of oil the less tax refiners (obligated parties) are required to
pay. Above $130/bbl crude oil, the refiner starts to benefit from the price of advanced ethanol compared
to gasoline
TABLE OF CONTENTS
Biofuels/Biochemicals Landscape
The Biofuels and Biochem Industry 48 TABLE OF CONTENTS

Advanced Biofuel and Biochemicals Value Chain
The Biofuels and Biochem Industry 49
Seeds/Crops
Genetics
Feedstock
Providers Sugar Fermentation
Syngas
Fermentation
Gas-Phase
Thermo
chemical
Pyrolysis
Transesterfication Solar to Fuel
precursors
Marketing,
Distribution and
Blending
Refining
(Obligated
Parties)
Retailing Chemical
Companies
Consumer
Product
Companies
Upstream Midstream Downstream
Diamond
Green Diesel
Source: SVB and Bloomberg New Energy Finance.
Venture Backed
TABLE OF CONTENTS

Key Players –
Where Are They in Development?
The Biofuels and Biochem Industry 50 TABLE OF CONTENTS
Where Are They in Development? – Summary
• Public and private financing activity within the Biofuels and Biochemicals industry has increased significantly over the last two years and the
momentum is expected to continue.
• In addition to significant investment in private companies by private equity, venture capital investors, and strategic investors, there have been
six IPOs within the industry, over the last two years: Codexis (CDXS )in April 2010; Amyris (AMRS) in September 2010, Gevo (GEVO) in
February 2011, Solazyme (SZYM) in May 2011, and Kior (KIOR) in June 2011, and Renewable energy group (REG) in Jan 2012.
• The success of those who have gone public (i.e. meeting or exceeding development milestones) will be vital for continued investment in the
industry
• IPOs currently on file focus predominately on the chemical markets given the higher valued end products.
• In 2011, biofuels and biomaterials companies raised a total of $1.04 billion across 53 venture capital deals, a slight increase over 2010’s
$964 million.
• Many of the major integrated oil companies, including BP, Chevron, Petrobras, Statoil, Shell, Total, Valero, have made early investments or
entered into partnership positions in biofuels/biochemical companies.
• The biofuel/biochemical industry itself is still in its early growth stage, and the value chain has yet to be fully defined and constructed. With
such fragmentation in the value chain, the market looks prime for deep pocketed strategics and corporates to capitalize on inefficiencies.
• Based on a reference capacity of 50 million U.S. gallons, it is expected that 1,300 Biorefineries requiring between $325-650 billion in capital
will be needed to meet existing international targets.
The Biofuels and Biochem Industry 51 TABLE OF CONTENTS

Investments in Biofuels/Biochemicals
2011 Sector Share by Amount1 2011 Number of VC Deals by Sector2
Global Cleantech VC Investment in Biofuels and Biomaterials3 2011 HIGHLIGHTS
• In 2011, biofuels and biomaterials companies raised a total of
$1.04 billion across 53 deals, a slight increase over 2010’s $964
million.
• Several notable companies in the sector priced or filed for IPO in
2011, including venture-backed Solazyme, Gevo, KiOR.
• Waste-to-energy technologies played a big role in the sector;
corporations like Waste Management were more willing to invest
in 2011.
The Biofuels and Biochem Industry 52
Source: 1,2,3Cleantech Group’s i3 Platform.
Solar Energy Efficiency Transportation Biofuels & Biomaterials
Energy Storage Materials Recycling & Waste Other
Wind Water & Wastewater Smart Grid Air & Environment
Agriculture
$1.82 Billion 20%
$1.46Billion 16%
$1.24Billion 14%
$1.04Billion
11%$1.01Billion 11%
$630 million 7%
$630 million 7%
$520 million 6%
153
114
62
55
53
53
50
42
40
31
29
27
18
0 20 40 60 80 100 120 140 160 180
Energy Efficiency
Solar
Transportation
Materials
Biofuels & Biomaterials
Energy Storage
Other
Water & Wastewater
Recycling & Waste
Smart Grid
Wind
Air & Environment
Agriculture
$966
$993 $969
$543
$964 $1,041
50
71
54
49
54 53
0.0
10.0
20.0
30.0
40.0
50.0
60.0
70.0
80.0
$0.0
$200.0
$400.0
$600.0
$800.0
$1000.0
$1200.0
2006 2007 2008 2009 2010 2011
Mill
ions
Num
ber
of
Deals
TABLE OF CONTENTS

Crop Development Phases Leading up to Market Launch
• Advances in seed technologies are vital to cost reductions and the development of “energy dedicated” crops. Increasing crop productivity, is
essential to the reduction of feedstock costs.
— Since the 1930’s, advancements in genetics have resulted in significant improvements to crop yields
— New biotechnologies capable of more targeted trait improvements including disease resistance, and biomass accumulation will be major
drivers of the next leg of yield growth as well as the development of crops exclusively dedicated to the production of renewable
fuels/chemicals
The Biofuels and Biochem Industry 53
Source: Monsanto and Robert Baird Biomass Almanac July 2011.
Pre-launch (Duration 12-36 months)
Probability of Success: 90%
# of Candidates: 1
Activities
• Regulatory submission
• Seed bulk-up
• Pre-marketing
Gene/Trait Identification (Duration 24-48 months)
Probability of Success: 5%
# of Candidates: 10,000+
Activities
• High-throughput screening
• Model crop testing
Proof of Concept (Duration 12-24 months)
Probability of Success: 25%
# of Candidates: 1,000+
Activities
• Gene optimization
• Crop transformation
Advanced Development (Duration 12-24 months)
Probability of Success: 75%
# of Candidates: <5
Activities
• Trait integration
• Field testing
• Regulatory data generation Early Development (Duration 12-24 months)
Probability of Success: 50%
# of Candidates: 10+
Activities
• Trait development
• Pre-regulatory data
• Large scale transformation
TABLE OF CONTENTS

Global Players – Milestone Update
The Biofuels and Biochem Industry 54
2011 2012 Ongoing
Amyris produces specialty chemical
and fuel products through its
proprietary technology platform which
uses genetic engineering to modify the
metabolic pathways by which
organisms process sugars
• First renewable product sale and
finishing operations online (1Q)
• Biomin contract manufacturing online
(2Q)
• Antibiotics S.A. and Tate & Lyle
contract manufacturing online (3Q)
• Closing of U.S. Ventures JV (Target
3Q)
• Announcement of first Novivi
customer (Target 4Q)
• First Lubricant sale (Target 4Q)
• Complete construction of Sao Martinho
Plant (Target 2Q target - could be
pushed to 2013)
• Parasio facility complete (Target 2H12)
• First product sales under take-off with
Proctor & Gamble (Target 4Q)
• Analyst project farnesene sales of 7
million liters and 51 million liters in 2012
and 2013, respectively
• New off-take agreements
• New supply agreements for feedstock
access
• New partners announced for bolt-on
facilities
• Conversion of Letter of Intent (LOI’s) for
both feedstock supply and product off-
take to signed contacts
• Introduction of new products (C-10,
C-5, molecules)
Biotechnology company focusing on
the development of catalytic enzymes to
optimize industrial processes
• 20K liter scale-up of cellulase
enzymes(Complete)
• 150K liter scale-up with Logen
(Complete)
• Launch CodeXymes (Complete)
• Achieve Shell technical milestones
(Complete)
• First-gen ethanol agreement with
Raizen (Complete)
• Extend Shell R&D agreement which
expires in November 2012
• 10MT bagasse pilot with Chemtex
• First–gen ethanol pilot with Raizen
• Cellulosic ethanol pilot
• 650L detergent alcohol pilot
• Provide commercial samples of
CodeXyme to chemicals industry
• Commercial CodeXyme production
• First–gen ethanol commercialization
• Demonstration-scale detergent alcohol
production
• Cellulosic ethanol demonstration
(Target 2014)
• First 60,000MT detergent alcohol
facility online (Target 2015)
Gevo is focused on the development of
fuel and petrochemical alternatives
using isobutanol through its proprietary
Gevo Integrated Fermentation
Technology
• Begin Luverne plant retrofit (Complete)
• First JV with ethanol plant- Redfield
(Complete)
• Convert first LOIs to signed contacts
(Complete)
• Begin retrofits at Redfield (Complete)
• First sales from Luverne plant (Target
1H12), currently shipping product to
Sasol.
• Add new plants via JV or acquisition
(Target 1H12)
• Commercial sales from Redfield JV
plant (Target 2H12)
• First sales of advanced biofuels
• Production using cellulosic feedstock
• 58 million gallons of annual isobutanol
sales (Target 2015)
• Full-year profitability (Estimated 2014)
China Integrated Energy is a leading
non-state-owned company in China
engaged in wholesale distribution of
finished oil and heavy oil products,
production and sale of biodiesel, and
operation of retail gas stations
• 50K ton production facility in
Tongchuan (Complete)
• Production scheduled to commence at
Tongchuan Phase 2 plant (3Q)
• Upgrade Chongqing production line
(2Q)
• Complete construction of 200,000-ton
Tongchuan Phase 2 (4Q)
• NA
Source: Company reports and Robert Baird Biomass Almanac July 2011.
TABLE OF CONTENTS

Global Players – Milestone Update (con’t)
The Biofuels and Biochem Industry 55
2011 2012 Ongoing
KiOR is an alternative fuels company
that uses Fluid Catalytic Cracking
technology, commonly deployed in the
petroleum industry, to convert non‐food
biomass to renewable crude. Its "drop-
in” biocrude can be refined into
gasoline and/or diesel using current
refineries and transported using
existing infrastructure
• Construction of Columbus plant
(Complete)
• 500 BDT1 / day Columbus plant online
(Target 2H12)
• Break ground on 1,500 BDT / day
Newton plant (Target 2H11)
• First material product sales from
Columbus
• Complete construction of Newton plant
(Target 2H13)
• Break ground on third plant (Target
2H13)
Ongoing
• Sign feedstock agreements for Newton
• Additional off-take agreements for first
cluster
Solazyme uses microalgae to convert
abundant plant sugars into oils. The
company’s technology platform allows
it to tailor its oils to meet the required
specifications of its end markets and its
products are “drop‐in” oil alternatives,
meaning they are compatible with
existing infrastructure for refining,
finishing, and distribution
• Manufacturing partnership for fuels
• 300 MT facility online under Roquette
JV (Complete)
• New products as part of Algenist line
(Complete)
• Announcement of JV with Bunge
(framework signed in 3Q11 - official
formation in 1H12)
• DOE biorefinery online
• Begin construction on 100K MT plant
• 5,000 KMT facility at Roquette JV
• Launch of algalin flour
• 100K MT fuels & chemicals facility
operational
• EBITDA positive in fuels and chemicals
by year-end
• Begin construction on 50K MT facility
under Roquette JV
Ongoing
• Conversion of LOI’s into firm contracts
Renewable Energy Group is the largest
producer of biodiesel in the U.S.
As a fully integrated producer,
Renewable Energy’s
capabilities include feedstock
acquisition, facility construction
management, facility
operations and biodiesel marketing
• Acquired SoyMor cooperative and
SoyMor Biodiesel
• Renewable Energy is the largest
domestic producer of biodiesel with ~
15% market share in ‘11
• Upgrade the Albert Lea plant to run on
crude and high free fatty acid oils and
fats over the next 12+ months
• Has three plants with a nameplate
capacity of 135M GPY. Management
estimates it will cost ~$130-140M to
complete construction on all three
plants, with current plans calling for
75M GPY of capacity on line in H2/13,
with the remaining 60M GPY of
capacity online in H1/15
• New capacity online through ’15
Source: Company reports.
Note: 1One bone dry ton (BDT) is a volume of wood chips (or other bulk material) that would weigh one ton (2000 pounds, or 0.9072 metric tons) if all the moisture
content is removed.
TABLE OF CONTENTS

Selected Biofuel/Biochemical IPOs in the Pipeline
The Biofuels and Biochem Industry 56
Business Description Investment Highlights
PROPOSED OFFERING:
$150 MILLION
• Produces renewable succinic acid from
agricultural feedstock using an organism
developed by and exclusively licensed
from the U.S. Department of Energy
• Has signed a JV agreement with Mitsui for construction of a commercial plant in Sarnia, Ontario with construction to begin in 2012 and initial
production in 2013
• Signed supply agreements in place for more than 84,000MT of bio-succinic acid and its derivatives over the next five years (BioAmber’s
process requires 50% less sugar to produce a pound of succinic acid than a pound of ethanol)
PROPOSED OFFERING:
$100 MILLION
• Modifies the metabolic pathways of
organisms to produce intermediate and
basic chemicals from renewable feedstock
• First two target products will be bio-BDO1
and butadiene
• Process reduces capital costs of BDO plants. Genomatica estimates that its processes will allow for the construction and operation of a
commercial-scale BDO facility at 30%-60% of the costs a plant using incumbent petroleum-based routes
• Partnered with M&G’s Chemtex to produce BDO from cellulosic biomass
• Partnership strategy for scale-up - Genomatica’s first commercial-scale production plant will be a 35 million lb/year facility owned and
operated by Novamont with operations targeted for year-end 2012
PROPOSED OFFERING:
$125 MILLION
• Developed an anaerobic fermentation
platform to produce drop-in chemicals
from renewable feedstock
• Agreements with process technology and engineering firms could help facilitate adoption of biosuccinic process
• Off-take agreements in place to meet substantially all production from first phase of Louisiana plant
• Constructing a 30 million lb succinic acid plant in Louisiana with start-up slated for 1Q13, and intentions to expand the plant’s capacity to 170
million lbs by 1Q14
PROPOSED OFFERING:
$100 MILLION
• Uses olefin metathesis to produce
specialty chemicals and materials from
renewable oils addressing three principal
markets - Consumer Ingredients &
Intermediates, Engineered Polymers &
Coatings and Lubricants, Fuels &
Additives
• First facility full-funded and under construction – in process of retrofitting second plant
• Cost advantages over incumbent processes to allow operation without subsidies or green premium
• Metathesis technology capable of creating specialty chemicals with unique characteristics
PROPOSED OFFERING:
$100 MILLION
IPO CLOSED FEB 2012
• Developer of seeds for energy crops used
as feedstock in the production of
alternative fuels
• Sweet sorghum has been the company’s
first commercial-scale product
• Commercialized seed products offer attractive cost structure
• Focused on the Brazilian opportunity
• Collaborations with industry participants to drive adoption
PROPOSED OFFERING:
N.A.
• Utilizes a multi-step gasification and
fermentation process to produce ethanol
and other chemicals from biomass,
agricultural residues, natural gas, and
municipal waste
• Gasification technology is feedstock agnostic, reducing input costs – proprietary organisms also offer cost advantages over chemical
alternatives
• Based on its demonstration plant, Coskata estimates it could be a leader in the industry in terms of conversion efficiency
• Flagship, Coskata’s first commercial plant, will produce fuel-grade ethanol
Source: Robert Baird Biomass Almanac December 2011.
Note: 1BDO – Butanediol, a chemical used to make everything from the plastics in consumer electronics to cars.
TABLE OF CONTENTS

Strategic
Partnerships
2010 and 2011 were years that
showed a bevy of blue chip
partners that have a desire to
enter the sector (P&G, Total,
Shell, etc.). Many of the major oil
companies, including BP,
Chevron, Petrobras, Statoil,
Shell, Total, Valero, have made
early investments or entered into
partnership positions in biofuels
companies.
The Biofuels and Biochem Industry 57
Source: Company Reports.
( Cosan JV)
TABLE OF CONTENTS

Projects to Watch in 2012-13 – U.S.
The Biofuels and Biochem Industry 58
Year >>
Capacity (Mg/y)>>
Feedstock >>
Technology >>
Product(s) >>
2012
8
MSW, ag waste
Syngas Fermentation
Ethanol
2012
16
Corn starch
Fermentation
Isobutanol
2012
12
Wood
Pyrolysis
Diesel, jet
2012
137
Animal residue
Hydrotreating
Diesel, jet
2013
36
Mixed Cellulosic
Enzymatic hydrolysis
Ethanol
2013
25
Mixed Cellulosic
Enzymatic hydrolysis
Ethanol
2013
25
Mixed Cellulosic
Enzymatic hydrolysis
Ethanol
2013
25
Mixed Cellulosic
Enzymatic hydrolysis
Ethanol
2013
6
Mixed Veggie Oil
Olefin Metathesis
Specialty Chemicals
2013
37
Corn Starch
Fermentation
Isobutanol
2013
10
MSW
Thermocatalytic
Ethanol
2013
2
Sugar
Fermentation
Diesel, fatty alcohols
2013
20
Wood
Consolidate Bioprocess
Ethanol
2013
16
Wood
Syngas Fermentation
Ethanol
2013
18
CO2, Water
Helioconversion
Ethanol, diesel
Nevada Florida Michigan Alabama New Mexico
Florida Minnesota Mississippi Louisiana Florida
Iowa Iowa Kansas South Dakota Mississippi
2013
6
Mixed Cellulosic
Enzymatic hydrolysis
Ethanol
2013
2
Miscanthus
Biomass Fractionation
Gasoline
California
Year >>
Capacity (Mg/y)>>
Feedstock >>
Technology >>
Product(s) >>
Year >>
Capacity (Mg/y)>>
Feedstock >>
Technology >>
Product(s) >>
Iowa
Diamond Green
Diesel
Source: Biofuels Digest, Broker Research, Company SEC filings.
Note: Mg/y- million gallons per year.
TABLE OF CONTENTS
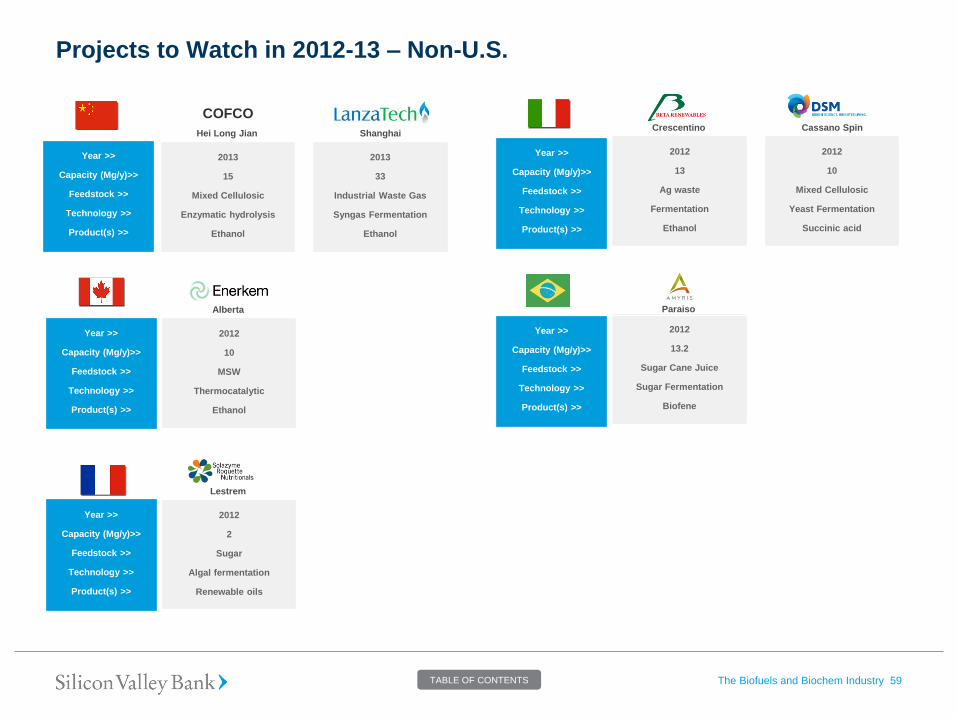
Year >>
Capacity (Mg/y)>>
Feedstock >>
Technology >>
Product(s) >>
2012
10
MSW
Thermocatalytic
Ethanol
Alberta
Year >>
Capacity (Mg/y)>>
Feedstock >>
Technology >>
Product(s) >>
Year >>
Capacity (Mg/y)>>
Feedstock >>
Technology >>
Product(s) >>
2012
13
Ag waste
Fermentation
Ethanol
2012
10
Mixed Cellulosic
Yeast Fermentation
Succinic acid
Crescentino Cassano Spin
2013
15
Mixed Cellulosic
Enzymatic hydrolysis
Ethanol
2013
33
Industrial Waste Gas
Syngas Fermentation
Ethanol
Hei Long Jian Shanghai
2012
2
Sugar
Algal fermentation
Renewable oils
Lestrem
Year >>
Capacity (Mg/y)>>
Feedstock >>
Technology >>
Product(s) >>
COFCO
Year >>
Capacity (Mg/y)>>
Feedstock >>
Technology >>
Product(s) >>
2012
13.2
Sugar Cane Juice
Sugar Fermentation
Biofene
Paraiso
Projects to Watch in 2012-13 – Non-U.S.
The Biofuels and Biochem Industry 59 TABLE OF CONTENTS

Projected Biorefineries by Country
1300+ Projected Biorefineries by 2025
Based on a reference capacity of 50
million US gallons, it is expected that
1,300 Biorefineries will be needed to
meet existing international targets.
Given the complexities and
specialized nature associated with
first of its kind technology, advanced
biofuel and chemical facilities
currently have a capital costs 3 to 5
times greater than conventional corn
and sugarcane facilities which cost
around $2/gal of capacity. With
maturity, it is expected that the costs
will normalize.
The Biofuels and Biochem Industry 60
Source: Biofuels Digest : “Biofuels mandates around the world” July 2011. SVB estimates.
700
200
130
135
60
40 60
40
U.S.
Brazil
EU
India
China
Other EMEA
Other Asia-Pacific
Other Americas
Capital Requirement
# of Biorefineries 1,300
Capital Cost/gal $10.00
Avg Capacity (mgy) 50
Total Capital Cost ($B) $650
*before transportation cost and taxes.
Capital Cost
Capital Cost/gal Total Capital Cost ($B)
$5.00 $325
$7.50 $488
$10.00 $650
TABLE OF CONTENTS

Appendix
The Biofuels and Biochem Industry 61 TABLE OF CONTENTS
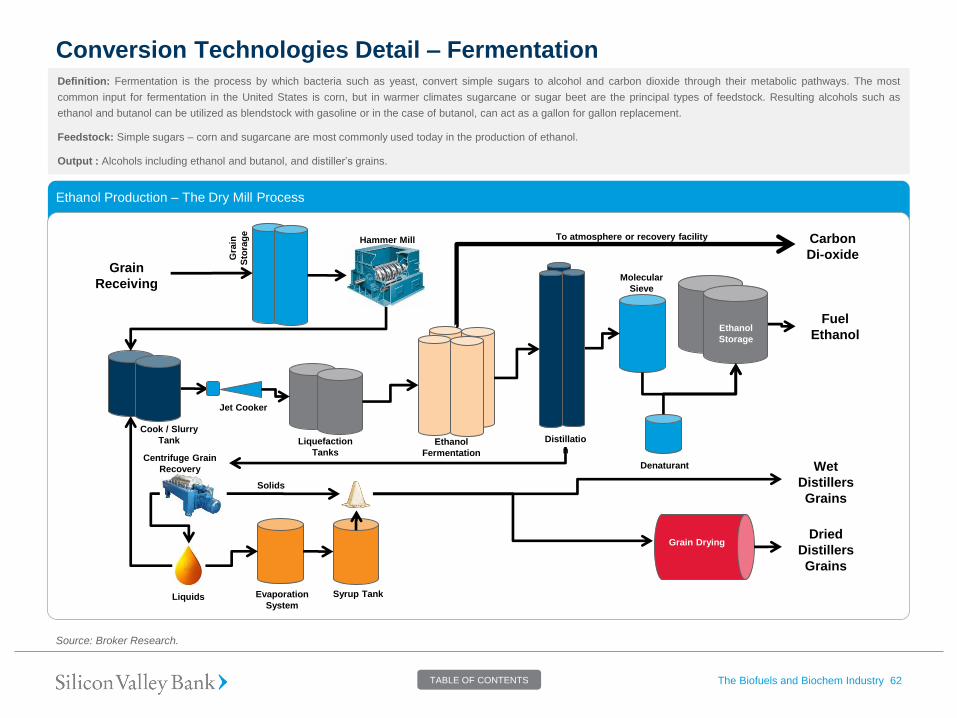
Ethanol Production – The Dry Mill Process
Conversion Technologies Detail – Fermentation
The Biofuels and Biochem Industry 62
Grain
Receiving
Carbon
Di-oxide
Fuel
Ethanol
Wet
Distillers
Grains
Dried
Distillers
Grains
Hammer Mill
Cook / Slurry
Tank
Jet Cooker
Liquefaction
Tanks Ethanol
Fermentation
Solids
Centrifuge Grain
Recovery
Liquids Evaporation
System
Syrup Tank
Grain Drying
Denaturant
Ethanol
Storage
Distillatio
n
Molecular
Sieve
Gra
in
Sto
rag
e
To atmosphere or recovery facility
Definition: Fermentation is the process by which bacteria such as yeast, convert simple sugars to alcohol and carbon dioxide through their metabolic pathways. The most
common input for fermentation in the United States is corn, but in warmer climates sugarcane or sugar beet are the principal types of feedstock. Resulting alcohols such as
ethanol and butanol can be utilized as blendstock with gasoline or in the case of butanol, can act as a gallon for gallon replacement.
Feedstock: Simple sugars – corn and sugarcane are most commonly used today in the production of ethanol.
Output : Alcohols including ethanol and butanol, and distiller’s grains.
Source: Broker Research.
TABLE OF CONTENTS

Conversion Technologies Detail – Fluid Catalytic Cracking
The Biofuels and Biochem Industry 63
Definition: Fluid Catalytic Cracking (FCC) is a proven process in the petroleum industry used to convert crude oil into higher value products such as gasoline and naptha. FCC
reactions occur at extremely high temperatures (up to 1,000+ F°) and use fine, powdery catalysts capable of flowing likely a liquid which break the bonds of long‐chain
hydrocarbons into smaller carbon‐based molecules. FCC technology is applied to organic sources of carbon such as woody biomass to convert the cellulosic content into usable
hydrocarbons with equivalence to crude oils – this process is referred to as Biomass Fluid Catalytic Cracking (BFCC). FCC was first commercialized in 1942, and is presently
used to refine ~1/3 of the U.S.s’ total annual crude volume.
Feedstock: Feedstock agnostic – can utilize cellulosic biomass
Output: Biocrude, gases
Source: KiOR (founded by Khosla Ventures and a select group of scientists) and Robert Baird Research.
Fluid Catalytic Cracking Process
TABLE OF CONTENTS

Conversion Technologies Detail – Anaerobic Digestion
The Biofuels and Biochem Industry 64
Definition: Anaerobic digestion is the process by which bacteria decompose wet organic matter in the absence of oxygen. The result is a byproduct known as biogas which
consists of ~60% methane and ~40% carbon dioxide. Biogas can then be combusted in the presence of oxygen to generate energy. Effectively any feedstock can be converted
to biogas via digestion including human and animal wastes, crop residues, industrial byproducts, and municipal solid waste. Anaerobic digestion is the same process that created
natural gas reserves found throughout the world today.
Feedstock: Starches, celluloses, municipal solid waste, food greases, animal waste, and sewage
Output: Biogas
Source: KiOR (founded by Khosla Ventures and a select group of scientists) and Robert Baird Research.
Anaerobic Digester Mechanism
Engine Generator Heat Recovery
Anaerobic
Digester
Auxiliary Use
Liquid Effluent
Biogas
Manure
Electricity Hot Water
Plants
TABLE OF CONTENTS
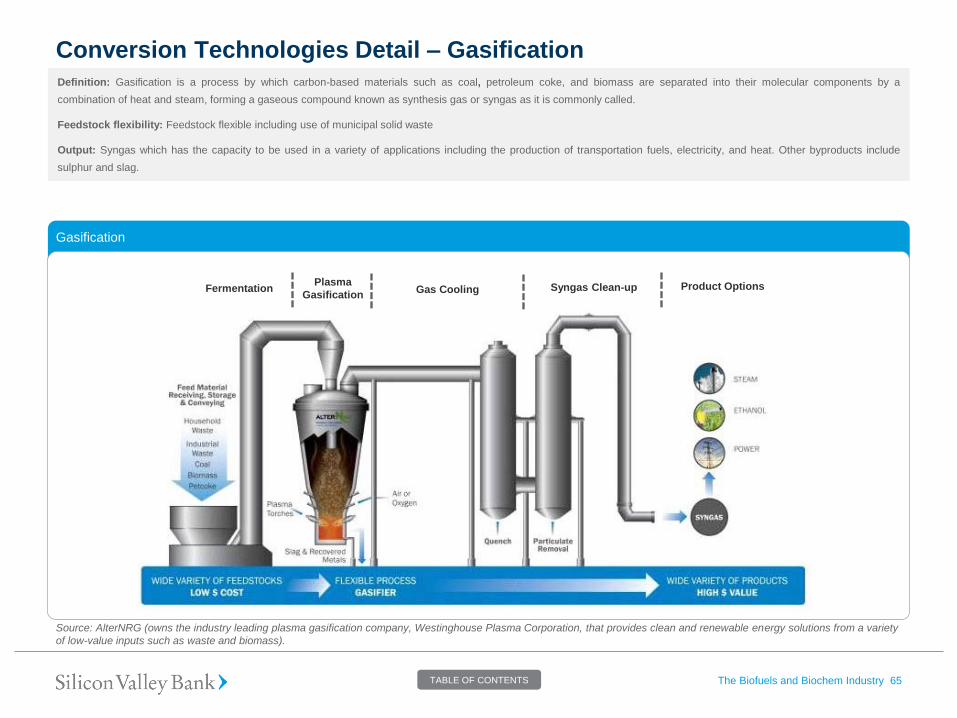
Conversion Technologies Detail – Gasification
The Biofuels and Biochem Industry 65
Definition: Gasification is a process by which carbon‐based materials such as coal, petroleum coke, and biomass are separated into their molecular components by a
combination of heat and steam, forming a gaseous compound known as synthesis gas or syngas as it is commonly called.
Feedstock flexibility: Feedstock flexible including use of municipal solid waste
Output: Syngas which has the capacity to be used in a variety of applications including the production of transportation fuels, electricity, and heat. Other byproducts include
sulphur and slag.
Source: AlterNRG (owns the industry leading plasma gasification company, Westinghouse Plasma Corporation, that provides clean and renewable energy solutions from a variety
of low-value inputs such as waste and biomass).
Gasification
Fermentation Plasma
Gasification Gas Cooling Syngas Clean-up Product Options
TABLE OF CONTENTS

Conversion Technologies Details – Pyrolysis
The Biofuels and Biochem Industry 66
Definition: Pyrolysis is the process by which organic materials are decomposed by the application of intense heat in the absence of oxygen to form gaseous vapors which when
cooled form charcoal and/or bio‐oil can potentially be used as a direct fuel substitute or an input for the manufacture of transportation fuels.
Feedstock: Capable of using a wide variety of feedstock including agriculture crops, solid waste, and woody biomass (currently most common)
Output: Bio‐oil (energy density of ~16.6MJ/liter) which must be processed further before it can be utilized as a transportation fuel. It also yields syngas and biochar.
Source: Biomass Technology Group (www.btgworld.com).
Pyrolysis Process
TABLE OF CONTENTS
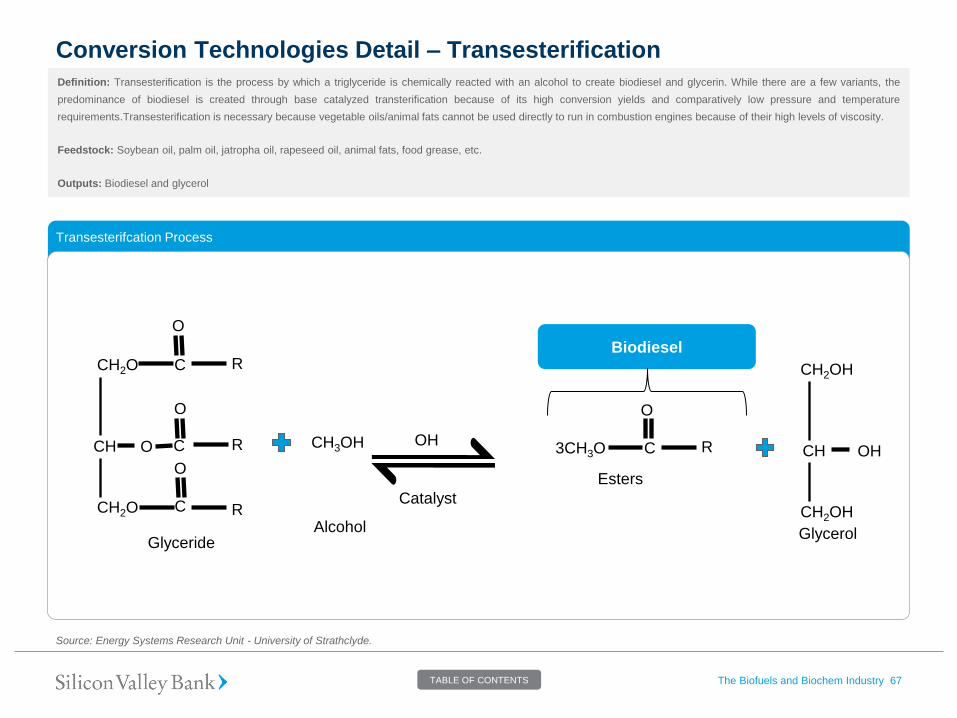
Conversion Technologies Detail – Transesterification
The Biofuels and Biochem Industry 67
Definition: Transesterification is the process by which a triglyceride is chemically reacted with an alcohol to create biodiesel and glycerin. While there are a few variants, the
predominance of biodiesel is created through base catalyzed transterification because of its high conversion yields and comparatively low pressure and temperature
requirements.Transesterification is necessary because vegetable oils/animal fats cannot be used directly to run in combustion engines because of their high levels of viscosity.
Feedstock: Soybean oil, palm oil, jatropha oil, rapeseed oil, animal fats, food grease, etc.
Outputs: Biodiesel and glycerol
Source: Energy Systems Research Unit - University of Strathclyde.
Transesterifcation Process
OH
R Biodiesel
CH2O
CH
CH2O
C
O
O
C
O
C R
R CH3OH OH O R 3CH3O C
O
CH2OH
CH
CH2OH
Glycerol
Esters
Catalyst
Alcohol Glyceride
TABLE OF CONTENTS

Conversion Technologies Detail – Syngas Fermentation
The Biofuels and Biochem Industry 68
Definition: Syngas Fermentation is the process by which gasification breaks the carbon bonds in the feedstock and converts the organic matter into synthesis gas. The syngas is
sent to bioreactor where microorganisms directly convert the syngas to a fuels and/or chemicals.
Feedstock: Capable of using a wide variety carbon containing feedstocks including agricultural crops, solid waste, woody biomass and fossil fuels such as coal and natural gas.
Output: Ethanol, 2.3-BDO, Acetic Acid, Acetone, Propanol, Butanol, MEK, Isoprene, Acrylic Acid, Butadiene, Succinic Acid
Source: Coskata, Inc.
Syngas Fermentation Process
TABLE OF CONTENTS
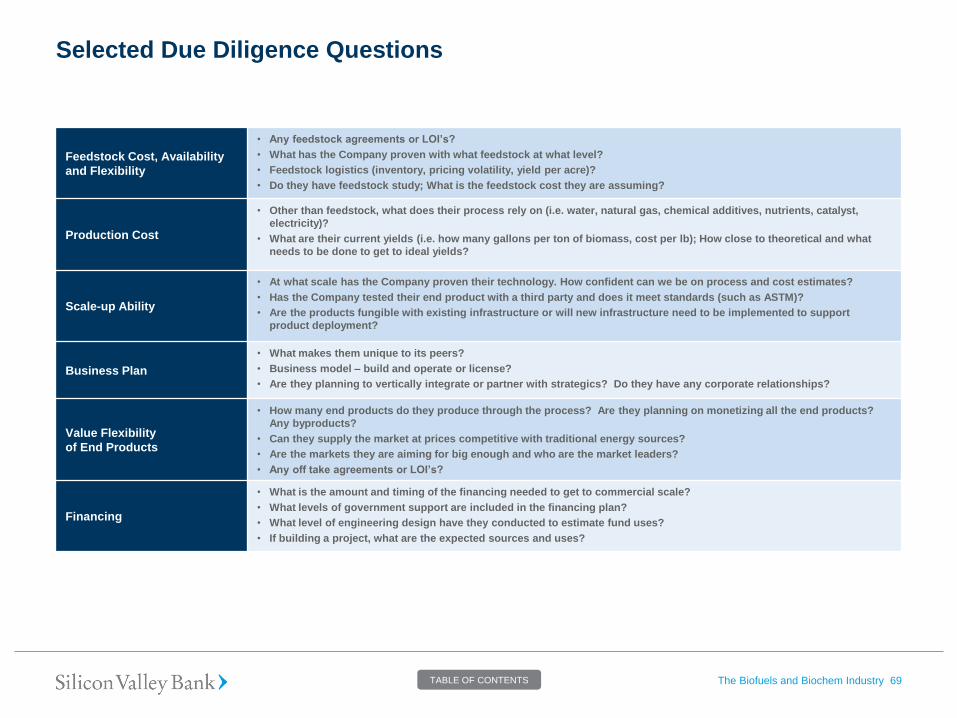
Selected Due Diligence Questions
The Biofuels and Biochem Industry 69
Feedstock Cost, Availability
and Flexibility
• Any feedstock agreements or LOI’s?
• What has the Company proven with what feedstock at what level?
• Feedstock logistics (inventory, pricing volatility, yield per acre)?
• Do they have feedstock study; What is the feedstock cost they are assuming?
Production Cost
• Other than feedstock, what does their process rely on (i.e. water, natural gas, chemical additives, nutrients, catalyst,
electricity)?
• What are their current yields (i.e. how many gallons per ton of biomass, cost per lb); How close to theoretical and what
needs to be done to get to ideal yields?
Scale-up Ability
• At what scale has the Company proven their technology. How confident can we be on process and cost estimates?
• Has the Company tested their end product with a third party and does it meet standards (such as ASTM)?
• Are the products fungible with existing infrastructure or will new infrastructure need to be implemented to support
product deployment?
Business Plan
• What makes them unique to its peers?
• Business model – build and operate or license?
• Are they planning to vertically integrate or partner with strategics? Do they have any corporate relationships?
Value Flexibility
of End Products
• How many end products do they produce through the process? Are they planning on monetizing all the end products?
Any byproducts?
• Can they supply the market at prices competitive with traditional energy sources?
• Are the markets they are aiming for big enough and who are the market leaders?
• Any off take agreements or LOI’s?
Financing
• What is the amount and timing of the financing needed to get to commercial scale?
• What levels of government support are included in the financing plan?
• What level of engineering design have they conducted to estimate fund uses?
• If building a project, what are the expected sources and uses?
TABLE OF CONTENTS

Silicon Valley Bank Cleantech Team
Matt Maloney
Head of Cleantech
Practice
Silicon Valley Bank
Matt Maloney is Head of Silicon Valley Bank’s national Cleantech Practice. He has over 20 years of experience investing in and
lending to the technology industry. Prior to joining Silicon Valley Bank in 2002, Maloney co-founded Enflexion Capital, a specialty
debt provider for alternative communications companies. From 1989 to 2000, Maloney held several business development and
senior management positions in GATX Capital’s Technology Services group that grew from zero to more than $500 million during his
tenure. Among other roles, he developed, structured and managed numerous technology investment joint ventures, spearheaded
strategic acquisitions and founded the company’s Telecom Investments group.
Prior work experience includes investment banking and money center commercial banking. Maloney earned a bachelor’s degree
from Guilford College and a master’s of business administration from Kellogg Graduate School of Management.
Quentin Falconer
National Cleantech
Coordinator
Silicon Valley Bank
Northern California
As National Cleantech Coordinator, Quentin Falconer leads the business development efforts for the cleantech industry at Silicon
Valley Bank. Formerly an engineer with Bechtel Corporation, Falconer began his commercial banking career in 1990 and has been
with Silicon Valley Bank since 1999 working with emerging and mid-stage technology companies. He provides and oversees
commercial and merchant banking, investment management and global treasury services for his portfolio of clients.
Falconer sits on the Advisory Council for the Berkeley Entrepreneurs Forum and is a member of Financial Executives International.
He earned bachelor’s degrees in mechanical engineering and music from Tufts University and a master’s of business administrat ion
from UC Berkeley’s Haas School of Business. He is also a Chartered Financial Analyst (CFA).
Frank Amoroso
Senior Relationship
Manager
Silicon Valley Bank
Rocky Mountain U.S.
Frank Amoroso is a senior relationship manager with Silicon Valley Bank. In this role, Amoroso is responsible for Cleantech business
development in the Northwest, Southwest and Midwest regions of the United States. Amoroso has twenty years of banking
experience with Silicon Valley Bank, working with emerging technology, bioscience and cleantech companies nationwide. Amoroso
joined Silicon Valley Bank in 1992 to handle financial analysis and loan underwriting for clients on the East Coast, in the Pacific
Northwest, and in California. He helped found SVB’s Colorado office in 1996, and was named the Central Division Cleantech
Coordinator for the company’s nationwide Cleantech Practice in 2006.
Prior to his current position, Amoroso was responsible for new business development and ongoing portfolio management of early
stage, hightech, bioscience, and cleantech companies in Colorado. Amoroso holds a bachelor’s degree in finance from Santa Clara
University.
Bret Turner
Relationship Manager
Silicon Valley Bank
Rocky Mountain U.S.
Bret Turner is a relationship manager in Silicon Valley Bank’s Cleantech Practice and is SVB’s National Petroleum Replacement
Expert. In these roles, Turner is mainly focused on project-related financings, advancing clients from demonstration scale to first
commercial. Turner has been with Silicon Valley Bank since 2007 working with emerging and mid-stage technology , life science,
and cleantech companies in Colorado. Prior to joining SVB, Turner worked as a research analyst for Sterne, Agee, and Leach with
published research reports on exploration and production companies in the oil and gas industry. Prior to that, Turner worked for a
private equity firm in New Orleans investing in numerous companies in the oil and gas, shipping, transportation and gaming
industries. Turner started his career as a sales trader in Credit Suisse First Boston’s stock lending and prime brokerage pract ices in
London.
Professional security certifications held include Series 7, 86, and 87. Turner earned a bachelor’s degree in business and a master’s
in finance from Louisiana State University.
TABLE OF CONTENTS

Silicon Valley Bank Headquarters
3003 Tasman Drive
Santa Clara, California 95054
408.654.7400
svb.com
This material, including without limitation the statistical information herein, is provided for informational purposes only. The material is based in part upon information from third-party
sources that we believe to be reliable, but which has not been independently verified by us and, as such, we do not represent that the information is accurate or complete. The
information should not be viewed as tax, investment, legal or other advice nor is it to be relied on in making an investment or other decision. You should obtain relevant and specific
professional advice before making any investment decision. Nothing relating to the material should be construed as a solicitation or offer, or recommendation, to acquire or dispose of
any investment or to engage in any other transaction.
©2012 SVB Financial Group. All rights reserved. Silicon Valley Bank is a member of FDIC and Federal Reserve System. SVB>, SVB>Find a way, SVB Financial Group, and Silicon
Valley Bank are registered trademarks. B-12-12170 Rev. 07-02-12


