
Effects of Intensive Glucose Lowering in Type 2 Diabetes
The Action to Control Cardiovascular Risk in Diabetes Study Group*
Abstract
Background—Epidemiologic studies have shown a relationship between glycated hemoglobin
levels and cardiovascular events in patients with type 2 diabetes. We investigated whether
intensive therapy to target normal glycated hemoglobin levels would reduce cardiovascular events
in patients with type 2 diabetes who had either established cardiovascular disease or additional
cardiovascular risk factors.
Methods—In this randomized study, 10,251 patients (mean age, 62.2 years) with a median
glycated hemoglobin level of 8.1% were assigned to receive intensive therapy (targeting a
glycated hemoglobin level below 6.0%) or standard therapy (targeting a level from 7.0 to 7.9%).
Of these patients, 38% were women, and 35% had had a previous cardiovascular event. The
primary outcome was a composite of nonfatal myocardial infarction, nonfatal stroke, or death
from cardiovascular causes. The finding higher mortality in the intensive-therapy group led to a
discontinuation of intensive therapy after a mean of 3.5 years of follow-up.
Results—At 1 year, stable median glycated hemoglobin levels of 6.4% and 7.5% were achieved
in the intensive-therapy group and the standard-therapy group, respectively. During follow-up, the
primary outcome occurred in 352 patients in the intensive-therapy group, as compared with 371 in
the standard-therapy group (hazard ratio, 0.90; 95% confidence interval [CI], 0.78 to 1.04; P =
0.16). At the same time, 257 patients in the intensive-therapy group died, as compared with 203
patients in the standard-therapy group (hazard ratio, 1.22; 95% CI, 1.01 to 1.46; P = 0.04).
Hypoglycemia requiring assistance and weight gain of more than 10 kg were more frequent in the
intensive-therapy group (P<0.001).
Conclusions—As compared with standard therapy, the use of intensive therapy to target normal
glycated hemoglobin levels for 3.5 years increased mortality and did not significantly reduce
major cardiovascular events. These findings identify a previously unrecognized harm of intensive
glucose lowering in high-risk patients with type 2 diabetes. (ClinicalTrials.gov number,
NCT00000620.)
Address reprint requests to Dr. Byington at the Division of Public Health Sciences, Wake Forest University School of Medicine, Medical Center Blvd., Winston-Salem, NC 27157, or at [email protected]..*Members of the Action to Control Cardiovascular Risk in Diabetes (ACCORD) Study Group are listed in the Appendix.The members of the writing group (Hertzel C. Gerstein, M.D., M.Sc., McMaster University and Hamilton Health Sciences, Population Health Research Institute, Hamilton, ON, Canada; Michael E. Miller, Ph.D., Robert P. Byington, Ph.D., and David C. Goff, Jr., M.D., Ph.D., Wake Forest University School of Medicine, Winston-Salem, NC; J. Thomas Bigger, M.D., Columbia University College of Physicians and Surgeons, New York; John B. Buse, M.D., Ph.D., University of North Carolina School of Medicine, Chapel Hill; William C. Cushman, M.D., Memphis Veterans Affairs Medical Center, Memphis, TN; Saul Genuth, M.D., and Faramarz Ismail-Beigi, M.D., Ph.D., Case Western Reserve University, Cleveland; Richard H. Grimm, Jr., M.D., Ph.D., Berman Center for Outcomes and Clinical Research, Minneapolis; Jeffrey L. Probstfield, M.D., University of Washington, Seattle; Denise G. Simons-Morton, M.D., Ph.D., National Heart, Lung, and Blood Institute, Bethesda, MD; and William T. Friedewald, M.D., Columbia University Mailman School of Public Health, New York) assume responsibility for the overall content and integrity of this article.
No other potential conflict of interest relevant to this article was reported.
HHS Public AccessAuthor manuscriptN Engl J Med. Author manuscript; available in PMC 2015 August 27.
Published in final edited form as:N Engl J Med. 2008 June 12; 358(24): 2545–2559. doi:10.1056/NEJMoa0802743.
Author M
anuscriptA
uthor Manuscript
Author M
anuscriptA
uthor Manuscript

TYPE 2 DIABETES MELLITUS IS A METABOLIC disease that is diagnosed on the basis
of sustained hyperglycemia. People with type 2 diabetes are at elevated risk for a number of
serious health problems, including cardiovascular disease, premature death, blindness,
kidney failure, amputations, fractures, frailty, depression, and cognitive decline.1 In
prospective epidemiologic studies, the incidence of many of these outcomes is directly
associated with the degree of hyperglycemia, as measured by the plasma glucose or the
glycated hemoglobin level, a measure of the mean blood glucose level during the previous 2
to 3 months. Thus, after adjustment for other risk factors, an increase of 1% in the glycated
hemoglobin level is associated with an increase of 18% in the risk of cardiovascular events,2
an increase of 12 to 14% in the risk of death,3,4 and an increase of 37% in the risk of
retinopathy or renal failure.4
The graded relationship between the glycated hemoglobin level and cardiovascular events
and death suggested that a therapeutic strategy lower glycated hemoglobin levels might
reduce these outcomes. This hypothesis was supported by findings from some but not all
previous clinical trials.1 However, the hypothesis was not explicitly tested in adequately
powered, randomized trials focusing on cardiovascular outcomes. Nevertheless, data from
basic science, epidemiologic analysis, and limited trials have been used to support guideline
recommendations to target near-normal levels of glycated hemoglobin and glucose in
selected patients with type 2 diabetes mellitus,5-8 despite a paucity of evidence regarding the
risks and benefits of doing so with currently available therapies.
The Action to Control Cardiovascular Risk in Diabetes (ACCORD) trial was specifically
designed to determine whether a therapeutic strategy targeting normal glycated hemoglobin
levels (i.e., below 6.0%) would reduce the rate of cardiovascular events, as compared with a
strategy targeting glycated hemoglobin levels from 7.0 to 7.9% in middle-aged and older
people with type 2 diabetes mellitus and either established cardiovascular disease or
additional cardiovascular risk factors. The finding of higher mortality in the intensive-
therapy group led to a decision to terminate the intensive regimen in February 2008, 17
months before the scheduled end of the study. We report the effects of the intensive
intervention on mortality and the primary composite outcome of major cardiovascular events
in all patients and in prespecified subgroups.
METHODS
ELIGIBILITY AND STUDY DESIGN
The rationale and design of the trial and a description of the glycemia intervention have been
reported previously.9,10 Briefly, the ongoing multi-center clinical study, which is sponsored
by the National Heart, Lung, and Blood Institute (NHLBI), is being conducted in 77 clinical
centers (aggregated within seven networks) across the United States and Canada. We
recruited volunteers who had type 2 diabetes mellitus and a glycated hemoglobin level of
7.5% or more and who either were between the ages of 40 and 79 years and had
cardiovascular disease or were between the ages of 55 and 79 years and had anatomical
evidence of significant atherosclerosis, albuminuria, left ventricular hypertrophy, or at least
two additional risk factors for cardiovascular disease (dyslipidemia, hypertension, current
status as a smoker, or obesity).9 Key exclusion criteria included frequent or recent serious
Page 2
N Engl J Med. Author manuscript; available in PMC 2015 August 27.
Author M
anuscriptA
uthor Manuscript
Author M
anuscriptA
uthor Manuscript

hypoglycemic events, unwillingness to do home glucose monitoring or inject insulin, a
body-mass index (the weight in kilograms divided by the square of the height in meters) of
more than 45, a serum creatinine level of more than 1.5 mg per deciliter (133 μmol per liter),
or other serious illness.
All 10,251 patients were randomly assigned to receive comprehensive intensive therapy
targeting a glycated hemoglobin level of less than 6.0% or to receive standard therapy
targeting a level of 7.0 to 7.9%. With the use of a double two-by-two factorial design, 4733
patients were randomly assigned to lower their blood pressure by receiving either intensive
therapy (systolic blood-pressure target, <120 mm Hg) or standard therapy (systolic blood-
pressure target, <140 mm Hg). In addition, 5518 patients were randomly assigned to receive
either fenofibrate or placebo while maintaining good control of low-density lipoprotein
cholesterol with simvastatin.11 These blood-pressure and lipid trials are continuing, and
results regarding them remain masked. The study protocol was approved by the institutional
review board or ethics committee at each center, as well as by a review panel at the NHLBI.
All patients provided written informed consent.
Patients received instructional materials and behavioral counseling regarding diabetes care
and were provided with glucose-lowering medications (from a study-supervised formulary)
and glucose-monitoring supplies. Any marketed anti-hyperglycemic therapy that was not
provided by the formulary could also be prescribed to any patient but was not provided by
study investigators. Therapeutic regimens were individualized at the discretion of the
investigators and patients on the basis of study-group assignment and the response to
therapy. Adverse effects of therapy were carefully audited both locally and centrally to
ensure the safety of the patients.12
Patients in the intensive-therapy group attended monthly visits for the first 4 months and
then every 2 months thereafter, with at least one interim phone call, with the aim of rapidly
and safely reducing glycated hemoglobin levels to below 6.0%. Additional visits were
scheduled as needed to achieve glycemic goals, as described previously.9,10 Patients in the
standard-therapy group had glycemic-management visits every 4 months.
PRIMARY AND SECONDARY OUTCOMES
The prespecified primary outcome was the first occurrence of nonfatal myocardial infarction
or nonfatal stroke or death from cardiovascular causes. The latter included death from
myocardial infarction, heart failure, arrhythmia, invasive cardiovascular interventions,
cardiovascular causes after noncardiovascular surgery, stroke, unexpected death presumed to
be from ischemic cardiovascular disease occurring within 24 hours after the onset of
symptoms, and death from other vascular diseases.9 Death from any cause was one of
several prespecified secondary outcomes. Study investigators also measured the effect of the
intervention on microvascular disease, hypoglycemia, cognition, and quality of life,
although these outcomes are not reported here. Key outcomes were adjudicated by a central
committee whose members were unaware of study-group assignments on the basis of
predefined criteria.13 A central laboratory that was unaware of study-group assignments
analyzed blood for glycated hemoglobin levels. Study investigators outside the coordinating
center and NHLBI project office were unaware of the accumulating rates of study outcomes.
Page 3
N Engl J Med. Author manuscript; available in PMC 2015 August 27.
Author M
anuscriptA
uthor Manuscript
Author M
anuscriptA
uthor Manuscript
SAFETY AND EFFICACY ANALYSES
An independent, 10-member data and safety monitoring committee that was appointed by
the NHLBI reviewed the interim results approximately every 6 months. The committee’s
role was to monitor the primary outcome and deaths from any cause, ensure the safety of
patients, make recommendations to continue or alter the study design, and advise the
NHLBI if there was clear evidence of benefit or harm. After reviewing mortality trends for
several months (and as part of a preplanned safety analysis), on January 8, 2008, the
committee concluded that the harm associated with the increased rate of death from any
cause in the intensive-therapy group, as compared with that in the standard-therapy group,
out-weighed any potential benefits and recommended that the intensive regimen be
discontinued for safety reasons. This recommendation was accepted by the NHLBI. Patients
were informed of this decision on February 5, 2008, and were subsequently switched to
standard glycemic therapy. The public was informed of the decision in a press release on
February 6, 2008. This report is based on data that were submitted to the coordinating center
through December 10, 2007, and that were used by the data and safety monitoring
committee to make its recommendation. Some of the adjudications of the causes of death
were completed after that date.
STATISTICAL ANALYSIS
The study was designed to have a power of 89% to detect a 15% reduction in the rate of the
primary outcome for patients in the intensive-therapy group, as compared with the standard-
therapy group, assuming a two-sided alpha level of 0.05, a primary-outcome rate of 2.9%
per year in the standard-therapy group, and a planned average follow-up of approximately
5.6 years. The original number of patients and power determinations for each study group
were made under the assumption that the blood-pressure and lipid interventions would
produce the effect sizes for which they were designed.9
All statistical analyses were conducted at the coordinating center with the use of S-Plus
software, version 8.0 (Insightful) or SAS software, version 9.1 (SAS Institute). Baseline
characteristics were compared in the two study groups with the use of chi-square tests and
two-sample t-tests. At each assessment visit, glycated hemoglobin levels were summarized
with the use of medians and interquartile ranges. Exposure to glucose-lowering drugs was
summarized according to study group as the number of patients who received a prescription
for a medication and the total person-years of prescriptions. The incidence of key safety
outcomes — including severe hypoglycemia, heart failure, motor vehicle accidents in which
the patient was the driver, fluid retention, elevated aminotransferase levels, and weight gain
— were compared with the use of Fisher’s exact test.
Analyses of primary and secondary outcomes were performed with the use of time-to-event
methods according to the intention-to-treat principle, and occurrences of these outcomes in
the two study groups were compared with the use of hazard ratios and 95% confidence
intervals. Two-sided P values were obtained from likelihood-ratio tests from Cox
proportional-hazards regression analyses. Our inspection of plots of survival estimates
versus follow-up time indicated that the assumption of proportional hazards for the glycemia
intervention appeared to be valid. The Cox models contained a term representing study-
Page 4
N Engl J Med. Author manuscript; available in PMC 2015 August 27.
Author M
anuscriptA
uthor Manuscript
Author M
anuscriptA
uthor Manuscript

group assignments plus terms accounting for the following prespecified stratifying variables:
assignment to either the blood-pressure trial or the lipid trial, assignment to the intensive
blood-pressure intervention in the blood-pressure trial, assignment to receive fibrate in the
lipid trial, the seven clinical-center networks, and the presence or absence of a previous
cardiovascular event. An analysis of how sensitive the results were to inclusion of these
variables as stratifying factors rather than as covariates in the Cox model was also
performed. Event rates are expressed as the percentage of events per follow-up year, taking
into account censoring of follow-up data. Kaplan–Meier estimates were used to obtain the
proportion of patients who had an event during follow-up.
We assessed the consistency of the effect of study-group assignment on total mortality and
the primary outcome among prespecified subgroups using statistical tests of interaction
between the treatment effect and the subgroup within the Cox model. We report all nominal
P values, un-adjusted for the multiplicity associated with the various tests performed for this
study or monitoring of the primary and mortality end points by the data and safety
monitoring committee. Since we conducted 15 statistical tests of hypotheses related to
secondary end points and subgroups, there was a 54% chance (i.e., 1 – [1 – 0.05]15) that at
least one of these tests would be statistically significant at an alpha level of 0.05, assuming
independence between tests.
Post hoc exploratory analyses to identify factors associated with higher mortality in the
intensive-therapy group examined baseline characteristics, hypoglycemic events, risk factors
for hypoglycemic events, single medications prescribed, combinations of medications
prescribed, cointerventions, changes in weight, achieved blood pressure, achieved glycated
hemoglobin levels, and occurrence of a cardiovascular event during follow-up. Detailed
analyses of these and other potential causal factors or mechanisms will be reported
separately.
RESULTS
PATIENTS
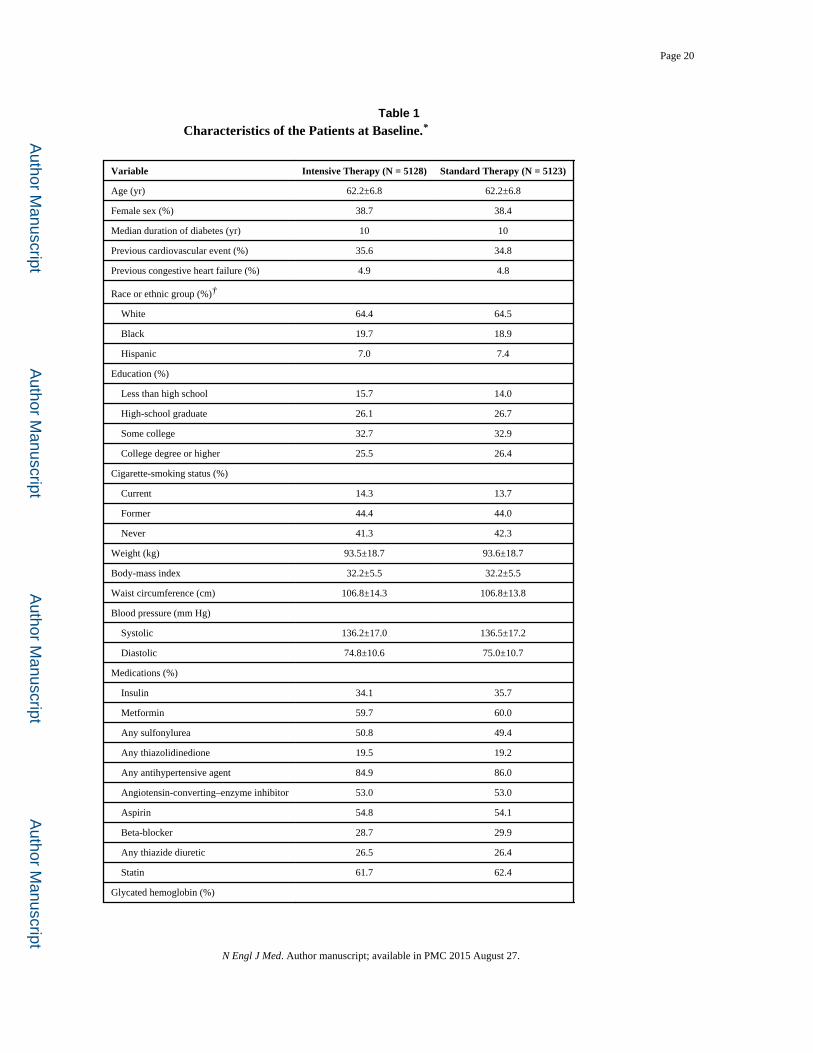
A total of 10,251 men and women with a mean (±SD) age of 62.2±6.8 years and a median
glycated hemoglobin level of 8.1% (interquartile range, 7.6 to 8.9) were randomly assigned
to either the intensive-therapy group or the standard-therapy group (see the figure in the
Supplementary Appendix, available with the full text of this article at www.nejm.org).
Approximately 38% of the entire cohort of patients were women. Recruitment occurred in
two phases: 1174 patients were recruited during a 20-week period from January to June
2001, and 9077 patients were recruited from February 2003 to October 2005.14 Key baseline
characteristics were similar in the two study groups (Table 1). The mean duration of follow-
up at the time the data and safety monitoring committee recommended the discontinuation
of the intensive regimen was 3.5 years (median, 3.4).
The two therapeutic strategies rapidly achieved different glycated hemoglobin levels (Fig.
1). Within 4 months after randomization, the median glycated hemoglobin level had fallen
from 8.1% at baseline to 6.7% (interquartile range, 6.2 to 7.2) in the intensive-therapy group
and to 7.5% (interquartile range, 7.0 to 8.2) in the standard-therapy group. Stable median
Page 5
N Engl J Med. Author manuscript; available in PMC 2015 August 27.
Author M
anuscriptA
uthor Manuscript
Author M
anuscriptA
uthor Manuscript

levels of 6.4% (interquartile range, 6.1 to 7.0) and 7.5% (interquartile range, 7.0 to 8.1),
respectively, were achieved in the two groups at 1 year and were maintained throughout the
follow-up period.
The lower glycated hemoglobin levels in the intensive-therapy group were associated with a
greater exposure to drugs from every class (Table 2). There were also more frequent changes
in the dose or the number of drugs used. The glucose-lowering regimen was modified by
adding or removing a drug or by increasing or decreasing the dose of an oral agent or insulin
(by ≥10% of the previous dose) a mean number of 4.4 times per year in the intensive-
therapy group and 2.0 times per year in the standard-therapy group.
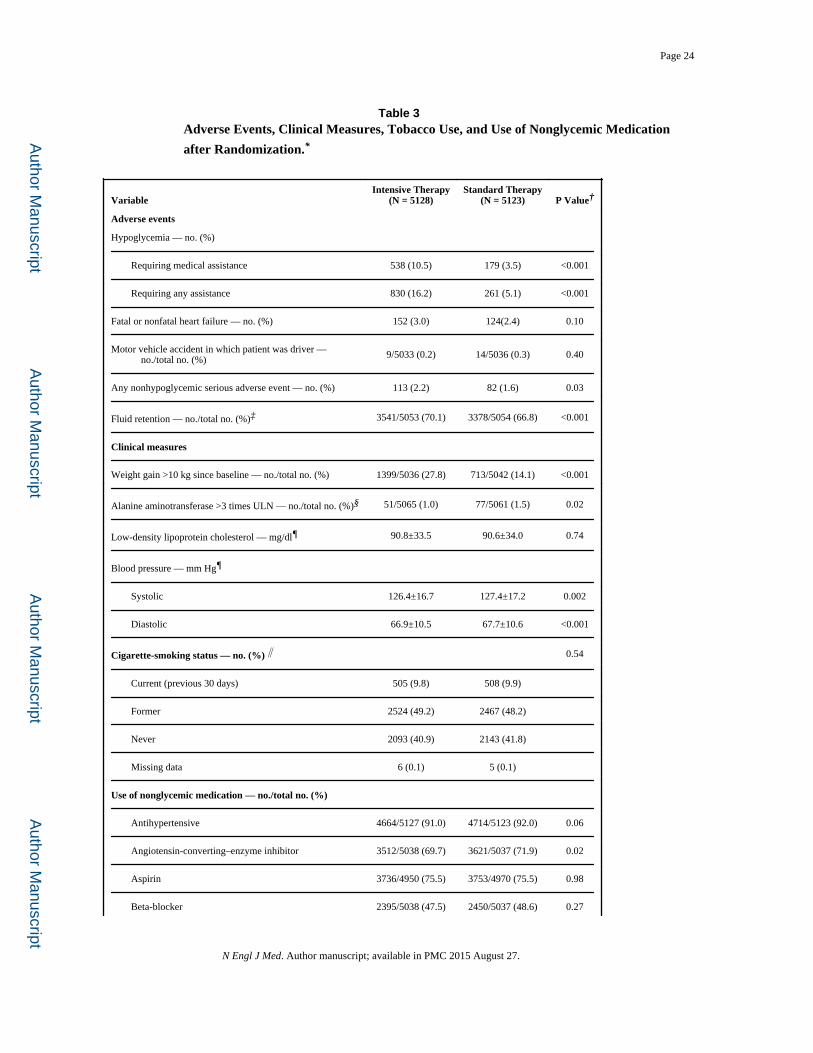
As compared with the standard-therapy group, the intensive-therapy group had significantly
higher rates of hypoglycemia, weight gain, and fluid retention (Table 3). The annualized rate
of hypoglycemic episodes requiring medical assistance was 3.1% in the intensive-therapy
group and 1.0% in the standard-therapy group, and the mean weight gain at 3 years was 3.5
kg and 0.4 kg in the two groups, respectively. One death in each group was classified as
probably related to hypoglycemia, according to the adjudicated analysis of causes of death.
Patients in the two groups had similar exposure to cardiovascular protective interventions
and had similar changes in non-glycemic characteristics associated with cardiovascular
events (Table 3). Significantly fewer patients in the intensive-therapy group received an
angiotensin-converting–enzyme inhibitor than in the standard-therapy group (69.7% vs.
71.9%, P = 0.02). However, blood-pressure levels were slightly lower in the intensive-
therapy group.
During the intervention period, the primary composite outcome of nonfatal myocardial
infarction, nonfatal stroke, or death from cardiovascular causes occurred in 723 patients, and
there were 460 deaths from any cause. In the data reviewed by the data and safety
monitoring committee, vital status was ascertained in 97.8% of patients within the previous
12 months; 50 patients (0.5%, including 26 patients in the intensive-therapy group and 24 in
the standard-therapy group) were lost to follow-up, and 162 patients (1.6%, including 84 in
the intensive-therapy group and 78 in the standard-therapy group) withdrew consent. The
mean follow-up time for patients who either withdrew consent or were lost to follow-up was
1.2 years in the intensive-therapy group and 1.0 year in the standard-therapy group (P =
0.22). There were fewer occurrences of the composite primary outcome in the intensive-
therapy group, with rates of the primary outcome beginning to separate in the two study
groups after 3 years (Table 4 and Fig. 2A). This trend was not significant, with rates of 6.9%
in the intensive-therapy group and 7.2% in the standard-therapy group (hazard ratio, 0.90;
95% confidence interval [CI], 0.78 to 1.04; P = 0.16). In the intensive-therapy group, the
rate of nonfatal myocardial infarction was lower than in the standard-therapy group (3.6%
vs. 4.6%; hazard ratio, 0.76; 95% CI, 0.62 to 0.92; P = 0.004), and the rate of death from
cardiovascular causes was higher (2.6% vs. 1.8%; hazard ratio, 1.35; 95% CI, 1.04 to 1.76; P
= 0.02); there was no significant difference in the rate of nonfatal stroke (1.3% vs. 1.2%;
hazard ratio, 1.06; 95% CI, 0.75 to 1.50; P = 0.74).
The rate of death from any cause was higher in the intensive-therapy group than in the
standard-therapy group (5.0% vs. 4.0%; hazard ratio, 1.22; 95% CI, 1.01 to 1.46; P = 0.04).
Page 6
N Engl J Med. Author manuscript; available in PMC 2015 August 27.
Author M
anuscriptA
uthor Manuscript
Author M
anuscriptA
uthor Manuscript

In sensitivity analyses of the Cox model for death from any cause that included variables as
stratifying factors rather than as covariates, the estimated hazard ratio for mortality in the
intensive-therapy group, as compared with that in the standard-therapy group, was stable to
the second decimal place. Rates of death in the two study groups began to separate after 1
year, and the differences persisted throughout the follow-up period (Fig. 2B). The effect on
mortality was consistent within the subgroups with no evidence of heterogeneity (Fig. 3) and
persisted in models adjusting for differences in the receipt of medications for blood pressure
and lipids.
For the primary outcome, there was some evidence of heterogeneity among prespecified
subgroups, which suggested that patients in the intensive-therapy group who had not had a
cardiovascular event before randomization (P for interaction = 0.04) or whose baseline
glycated hemoglobin level was 8.0% or less (P for interaction = 0.03) may have had fewer
fatal or nonfatal cardiovascular events than did patients in the standard-therapy group (Fig.
3). Preliminary nonprespecified exploratory analyses of episodes of severe hypoglycemia
after randomization and differences in the use of drugs (including rosiglita-zone), weight
change, and other factors did not identify an explanation for the mortality finding.
DISCUSSION
We conducted this study because previous clinical trials had not established the effects of
intensive glucose lowering on cardiovascular events or mortality in patients with type 2
diabetes mellitus. For example, in the United Kingdom Prospective Diabetes Study,15 an
intensive glucose-lowering regimen significantly reduced a composite outcome of seven
diabetes-related events, as compared with conventional therapy. However, the effects on
cardiovascular events and mortality were not significant. Conversely, in the Veterans Affairs
Diabetes Feasibility Trial,16 intensive glucose lowering was associated with a nonsignificant
increase in cardiovascular events and no difference in mortality, and in the University Group
Diabetes Program,17,18 the group that received a sulfonylurea (tolbutamide) had higher
mortality.
Our findings indicate that a comprehensive, customized, therapeutic strategy targeting
glycated hemoglobin levels below 6.0% increased the rate of death from any cause after a
mean of 3.5 years, as compared with a strategy targeting levels of 7.0 to 7.9% in patients
with a median glycated hemoglobin level of 8.1% and either previous cardiovascular events
or multiple cardiovascular risk factors. Patients in both groups had lower mortality than
reported in epidemiologic studies of similar patients.19,20 However, as compared with the
standard-therapy group, the intensive-therapy group had a relative increase in mortality of
22% and an absolute increase of 1.0% during this follow-up period, with similar differences
in death from cardiovascular causes. This increase in mortality is equivalent to one extra
death for every 95 patients who were treated for 3.5 years.
This study was not designed to test the components of the intervention strategy. Analyses
that we have performed to date have not identified and clear explanation for this higher
mortality. In the intensive-therapy group, a median glycated hemoglobin level of 6.4% was
rapidly achieved and maintained by a combination of behavioral and pharmacologic
Page 7
N Engl J Med. Author manuscript; available in PMC 2015 August 27.
Author M
anuscriptA
uthor Manuscript
Author M
anuscriptA
uthor Manuscript

approaches. The standard-therapy group had fewer study visits and used fewer drugs and
drug combinations. Thus, the higher rate of death in the intensive-therapy group may be
related to factors associated with the various strategies. These factors include but are not
limited to differences in the achieved glycated hemoglobin level of 6.4% in the intensive-
therapy group, as compared with 7.5% in the standard-therapy group; in the magnitude of
the reduction in glycated hemoglobin levels in the two study groups; in the speed of the
reduction in glycated hemoglobin levels, with reductions of approximately 1.4% in the
intensive-therapy group and 0.6% in the standard-therapy group within the first 4 months
after randomization; in changes in drug regimens and in the rate of hypoglycemia; in
adverse effects due to an undetected interaction of the various drug classes used at high
doses; or in some combination of these or many other possibilities, perhaps in combination
with the clinical characteristics of the patients in the study.
Differences in mortality emerged 1 year to 2 years after randomization. It is notable that
after about 3 years, a nonsignificant decrease in the rate of the primary outcome emerged in
the intensive-therapy group (Fig. 2A), due to significantly fewer nonfatal myocardial
infarctions, despite more deaths from cardiovascular causes and a similar number of strokes
(Table 4). These patterns with respect to mortality and the primary outcome suggest that if
there is any benefit associated with intensive glucose lowering, it may take several years to
emerge, during which time there is an increased risk of death. This intriguing possibility can
be answered only by further research.
The strengths of our study include the random assignment of patients to study groups and
follow-up of a large number of high-risk patients according to a common protocol, a high
rate of follow-up, achievement and maintenance of an absolute difference in glycated
hemoglobin levels of 1.1% for 3.5 years, implementation within clinics that routinely treat
patients in the community, adjudication of outcomes by a committee unaware of study-
group assignment, a factorial design in which blood-pressure and lipid interventions
continue to be tested, and safety auditing by an independent committee. However, our study
did not address the risks and benefits of various approaches to lowering glycated
hemoglobin levels (including what rate of glucose lowering is optimal), the prevention of
increased glycated hemoglobin levels in patients with type 2 diabetes mellitus who have
glycated hemoglobin levels below 7.5%, the prevention of diabetes altogether, and the
lowering of glycated hemoglobin levels in people who do not have cardio-vascular disease
or additional cardiovascular risk factors. Indeed, the suggestion of a greater benefit in the
primary outcome for patients with a lower glycated hemoglobin level or those without
cardiovascular disease raises the possibility that certain subgroups of patients may benefit
from intensive glucose lowering. However, our study was not designed to test these
possibilities. Finally, glucose-lowering strategies were adjusted for each patient in an open
fashion on the basis of their study-group assignment, their subsequent glycemic response to
a drug or drug combination, and the development of clinical symptoms, such as
hypoglycemia. This linkage of the study-group assignment to post-randomization exposures
means that analyses to discern which aspects of the therapeutic strategy contributed to the
observed outcomes were unlikely to clearly identify or exclude a cause. Thus,
nonprespecified analyses of possible causes of the higher mortality in the intensive-therapy
group can be only exploratory and require prospective testing.
Page 8
N Engl J Med. Author manuscript; available in PMC 2015 August 27.
Author M
anuscriptA
uthor Manuscript
Author M
anuscriptA
uthor Manuscript
Follow-up of the patients after they were switched from intensive therapy to standard
therapy may provide crucial information regarding the long-term rates of death and
cardiovascular events after a 3.5-year period of intensive therapy. Other trials investigating
the long-term outcome of intensive glucose lowering21-25 will report the effect of a variety
of therapeutic approaches on mortality and cardiovascular events in patients with type 2
diabetes mellitus and a range of clinical characteristics. Regardless of the results of these
other trials, our study has identified a previously unrecognized harm of intensive glucose
lowering in high-risk patients with type 2 diabetes mellitus and high glycated hemoglobin
levels. This harm may be due either to the approach used for rapidly lowering glycated
hemoglobin levels or to the levels that were achieved. Our findings highlight the importance
of conducting trials with sufficient statistical power to assess commonly used approaches on
clinically relevant outcomes.
Supplementary Material
Refer to Web version on PubMed Central for supplementary material.
Acknowledgments
Supported by grants (N01-HC-95178, N01-HC-95179, N01-HC-95180, N01-HC-95181, N01-HC-95182, N01-HC-95183, N01-HC-95184, IAA-Y1-HC-9035, and IAA-Y1-HC-1010) from the National Heart, Lung, and Blood Institute; by other components of the National Institutes of Health, including the National Institute of Diabetes and Digestive and Kidney Diseases, the National Institute on Aging, and the National Eye Institute; by the Centers for Disease Control and Prevention; and by General Clinical Research Centers. The following companies provided study medications, equipment, or supplies: Abbott Laboratories, Amylin Pharmaceutical, AstraZeneca, Bayer HealthCare, Closer Healthcare, GlaxoSmithKline, King Pharmaceuticals, Merck, Novartis, Novo Nordisk, Omron Healthcare, Sanofi-Aventis, and Schering-Plough.
Dr. Gerstein reports receiving consulting fees from Sanofi-Aventis, GlaxoSmithKline, Merck, Abbott, Novo Nordisk, Novartis, and Lilly, lecture fees from Sanofi-Aventis, GlaxoSmithKline, Merck, and Lilly, and grant support from Sanofi-Aventis, GlaxoSmithKline, King, and Merck and holding a patent that is completely assigned to Sanofi-Aventis, for which he receives no royalties or benefit; Dr. Goff, receiving grant support from Merck; Dr. Bigger, receiving grant support from McMaster University; Dr. Buse, having an equity interest in Insulet, MicroIslet, and dLife and receiving grant support from Bristol-Myers Squibb, Novartis, Pfizer, Novo Nordisk, Amylin, Eli Lilly, and Medtronic; Dr. Cushman, receiving consulting fees from Novartis, King, Takeda, and Sanofi-Aventis, lecture fees from Novartis, and grant support from Novartis, Hamilton Health, and Abbott; Dr. Genuth, receiving consulting fees from Merck, Mannkind, Sanofi-Aventis, and Novartis and lecture fees from Lilly and having an equity interest in Bristol-Myers Squibb; Dr. Grimm, receiving lecture fees from Merck, Pfizer, and Novartis; and Dr. Probstfield, receiving consulting fees from King and grant support from King and Sanofi-Aventis.
APPENDIX
Members of the ACCORD data and safety monitoring committee were A.M. Gotto (chair),
K. Bailey, D. Gohdes, S. Haffner, R. Hiss, K. Jamerson, K. Lee, D. Nathan, J. Sowers, L.
Walters. Members of the ACCORD study group were as follows: Steering Committee: W.T. Friedewald (chair), J.B. Buse (vice chair), J.T. Bigger, R.P. Byington, W.C. Cushman,
H.C. Gerstein, H.N. Ginsberg, D.C. Goff, Jr., R. H. Grimm, Jr., F. Ismail-Beigi, J.L.
Probstfield, D.G. Simons-Morton. Asterisks denote persons who are no longer affiliated
with the study unit, and daggers persons who are deceased. Clinical Center Networks and Clinical Sites — Canada: Population Health Research Institute, Hamilton General
Hospital, Canadian Diabetes Outcome Researchers, Hamilton, ON: H.C. Gerstein, S. Yusuf,
Z. Punthakee, R. Russo, S. Anand, B. Cracknell, T. Cukierman-Yaffe, A. Gafni, G. Guyatt,*
Page 9
N Engl J Med. Author manuscript; available in PMC 2015 August 27.
Author M
anuscriptA
uthor Manuscript
Author M
anuscriptA
uthor Manuscript

S. Hall, J. Kaszyca, E. Lonn,* D. McLeod, K. Read,* V. Reiding, N. Shehadeh,* B.
Tadeson,* K. Thompson,* M. Vallis, V. Vasudeva, I. Wilderman.* Canadian Clinical Sites: McMaster Medical Centre, Hamilton, ON: Z. Punthakee, A. Smith, I. Stanton, S.
Capes,* S. Danby, W. Harper, P. Harvey, D. Hunt, P. Manjoo,* A. Moroso, R. Otto, A.
Prebtani, T. Valla. Six Nations Health Services, Ohsweken, ON: Z. Punthakee, A. Davis, S.
Capes,* K.L. Hill, V. McCarthy. Diabetes, Hypertension and Cholesterol Centre, University
of Calgary, Calgary, AB: A.L. Edwards, D.J. Mitchell, M.A. Clearwaters, C. Dielissen, M.
Gillam, B. Hammond,* H. Jensen,* A. Kherani, D. Lau, V. Pringle, D. Rabi, R. Sigal, C.
Smith,* M. Walker,* G. Williams.* Memorial University of Newfoundland, St. John’s: C.
Joyce, M. Parsons, B. Rowe, J. Burton,* V. Chandurkar, S. Coady-McDonald,* D.
Gibbons,* C. Kovacs, B. Murphy, R. Smart, S. Varghese. University of Alberta, Edmonton:
L. Mereu, E. Ryan, P. Senior, P. Kirkland, J. Abe,* K. Dalton, W. Gendall, J. Germsheid,*
D. Hartman,* A. Jeffrys,* C. MacDonald, N. Makhani, S. Mawani,* F. Morales, B. Paty,*
M. Pick,* B. Schwanke, A. Stark, M. Tennant, S. Varma,* P. Werbiski-Wood, B.
Woloschuk, W. Zimmerman.* Centre de Recherche Clinique de Laval, Laval, QC: A.
Bélanger, S. Gauthier, G. Bahsali, C. Barbeau, E. Caponi, R. Duchesne,* R. Dumas, P.
Gauthier, J. Girouard, N. Kandalaft, M. Labbé, J. Palardy, M. Pilon, J. Raymond, A.
Schiffrin. St. Joseph’s Health Care London, London, ON: I. Hramiak, S. Tereschyn, M.
Driscoll, M. Gehring, J. Gonder, C. Lincoln, W. McBeth, C. McDonald, T. McDonald,* P.
Pauli,* T. Paul, S. Powers,* N. Ronald, V. Trinh, L. Vancer, G. Walsh.* Ottawa Hospital,
Division of Endocrinology and Metabolism, Ottawa: H. Lochnan, T.C. Ooi, J. Maranger, R.
Bate,* L. Bradley,* R. Buhrmann, M. Cyr,* C. Gilchrist, B. Hanlon, M. Harley, K. Jay,* T.
Leech, J. Malcolm, M. McLean,* E. Parker, R. Sigal,* K. Sullivan. Royal Victoria Hospital,
Montreal: J.F. Yale, S.A. Segal, N. Renouf, N. Allaire,* M.A.M.A. Alawadhi,* B. Belfer,*
D.W. Blank, F. Bouchard, S. Buoy-Phang,* J. Carter, L. Coppin,* D. Dalpe,* I. Delpech,*
P.M. Doran, F. Emmian,* S. Fortin,* N. Garfield, M. Gosselin,* S. Horan,* M. Kalergis,*
S. Koutelias,* C. Légaré, A. Lombardo, J.A. Morais, M. Quigley, N. Renouf, C. Riopel,* S.
Riopel, J.A. Rivera, G. Rochon,* M. Roy, M. Salera,* M.H. Sherman, M. Shingler, H.E.
Staples,* L. Ulyatt,* Z. Yared.* St. Michael’s Hospital, Toronto: L.A. Leiter, G. Booth, L.
Sparrow, H. Choi, D.C. Bedard, A. Berger, L.A. Berndl, A. Cheng,* V. Evalmplev,* J.
Goguen, A. Hanna, R.G. Josse, J.A. Kalas, S. Perry, M. Pike.* Vancouver General Hospital,
Vancouver, BC: T. Elliott, K. Dawson, J. Kong, M. Inducil, R. Al Amoudi,* T. Broughton,*
L. Hall,* B. Harrison,* N. Hirvi,* R. Lee,* E. Norman,* B. Paty, M. Potter, D. Stevenson,
A. Vafadaran. Health Sciences Centre Diabetes Research Group, Winnipeg, MB: V. Woo,
L. Berard, T. Anderlic, K. Austman, A. Bernard, D. Catte,* P. Darvill, D. Hak, K.
Hutchison, L. Janzen, T. Klopak, C. Mandock, M. Mathen, S. Mawani,* A. Mawani,* L.
Murphy,* G. Nyomba, B. Penner, S. Pockett, S. Russell, F. Stockl, J. Studney,* R. Sukkau.
Queen Elizabeth II Health Sciences Centre, Halifax, NS: C. Abbott, E. Ur, M. Yuille, M.
Archibald,* A. Cruess, N. Davis, H. Fong,* S. Frizzell,* B. Hanway,* A. Hoskin-Mott, A.
Imran, C. Ingraham,* G. McCarthy, H. Murdock,* T. Palmer, A.M. Patterson,* T. Ransom,
D. Shu,* J. Tuttle. Western Clinical Center Network: University of Washington, Seattle:
J.L. Probstfield, C. Kingry, A.S. Line, M.A. Corson, R. Knopp, E. Lipkin, M.D. Sullivan, J.
Johnson, C. Griswold, K. Liebert, A. Brown,* D. Juliano,* E.M. Kurashige,* S. Moberg.*
Western Clinical Sites: Northridge Hospital Medical Center, Cardiovascular Center,
Northridge, CA: K. Ariani, K. Karunaratne, M. Azizad, C. Chow, H. Gutierrez, J.
Page 10
N Engl J Med. Author manuscript; available in PMC 2015 August 27.
Author M
anuscriptA
uthor Manuscript
Author M
anuscriptA
uthor Manuscript
Partamian, J. Toven, J. Mular,* S. Sanders.* White Memorial Medical Center, Clinical
Hypertension Services, Los Angeles: L.J. Haywood, V. Kamdar, D.L. DeQuattro, L. Wang,
Z. Song, C. Miller, L. Becerra, A. Qi Cai, C. Pruitt, V. DeQuattro.† University of
Washington Medical Center at Roosevelt, Family Medical Center, Seattle: R. Failor, A.
Ellsworth, N. Jackson, C. Miller, D. Britt, S. Dobie, I. Hirsch, D. Khakpour, R. Quaempts,
W. Stoffel, T. Wilcox, W. Neighbor,* K. Cappocia.* Idaho State University, Department of
Family Medicine, Pocatello: R. Force, M. Macdonald, S. Lusk, C. Liday, E. Borzadek, S.
Koester, T. Pettinger, R. Solbrig, C. Waldron, K. Pettingill,* W. Woodhouse,* B. Hoover.*
Naval Medical Center San Diego, Cardiology Division, San Diego, CA: P.E. Linz, P.V.
Pepper, J. Kozlowski, C. Chase, D. Samuelson, P. Gutierrez, C. Gonzales, M. Engle,* J.
Coopersmith,* S. Griffin,* R. Lammers,* J. Leon.* Oregon Health & Science University,
Section of Diabetes, Portland: M.C. Riddle, K.A. Hanavan, P.A. McDaniel, R. Swift, A.J.
Ahmann, S.C. Gammell-Matthews, D.M. Karl, V. Burden, B. MacNeil, M. MacMurray, J.
Weiss, C. Carlson,* S.K. DesRochers,* D. Negreanu,* E.A. Stephens.* Washington State
University, Spokane: C. Wysham, D. Weeks, L. Kuntsmann, L. Maxwell, S. Yedinak, H.
Pena,* J. White.* Kaiser Endocrine Clinic, San Diego, CA: J. Dudl, L. Lyons, B. House, M.
Murray, P. Wu, A. Palma, S. Briere, T. Wilson, D. Becker,* K. Harden,* C. Hawley,* R.
Stevenson.* Whittier Institute for Diabetes, Clinical Trials Department, La Jolla, CA: G.
Dailey, M. Baron, A. Gianella, M. Jacobson, E. Farro, A. Philis-Tsimikas, A. Banares, A.
Bravo-Medina, J. Horne,* E. Esquer,* R. Morrissey.* Minnesota–Iowa Clinical Center Network: Berman Center for Outcomes and Clinical Research, Minneapolis: R.H. Grimm,
Jr., B.R. Kirpach, M.M. Bartkoske, C.M. Boyce,* N. Druckman,* A.M. Gillett,* J.A. Levin,
G.J. Livingston, A.M. Murray, H. Wood,* HealthPartners Research Foundation,
Minneapolis: K.L. Margolis. Minnesota–Iowa Clinical Sites: Berman Center Clinic,
Minneapolis: S. Kempainen, M. Madden, M. Tariq Fareed,* K. Hall,* R. Moor, K. Wood.
International Diabetes Center, Minneapolis: R. Bergenstal, R. Cuddihy, B. Davick, J.
Hokanson,* M. Johnson, D. Kendall,* M. Lausch, S. List, A. Monk, R. Robinson,* K.
Smith,* D. Whipple, G. Damberg, R. Hahn,* V. Koenig, M. Magadan, S. Sabin-Smith,* P.
Stewart, E. Strock, D. Peremislov, K. Gunyou, R. Passi. University of Minnesota,
Minneapolis: E.R. Seaquist, M.V. Mech, L.E. Benedict,* D.J. Demmon,* A.F. Kumar, S.M.
Martinson,* S.A. Miller, C. Pease,* J.P. Rao,* J.B. Redmon, J.E. Swanson,† J.K. Wimmer.*
University of Minnesota, Phalen Village Clinic, St. Paul: K. Peterson, L.A. Seaquist, C.
Boese,* M. Cruciani, E. Dodds, F. Parenteau Ek,* J.L. Feldman, P. Fontaine, C.J. Lange,
T.J. Mendenhall,* A.M. Peterson, A. Rudelt, T.M. Schrock,* D.P. Spielman,* S. Velasco,*
J.C. Weinhandl. Riverside Health Partners Clinic, Department of Endocrinology,
Minneapolis: J.M. Sperl-Hillen, P.J. O’Connor, M.E. Busch, A. Chung, B.K. Klein, N.
Krugen, T. Bunkers-Lawson,* H.L. Ekstrom,* H.S. Gunderson,* B.M. Johnson,* J.H.
MacIndoe,* D.J. Prewedo,* J.L. Rawl,* C.M. Roethke,* Mary Spencer. University of Iowa,
Health Care Diabetes Clinical Research and Programs, Iowa City: W.I. Sivitz, S.M.
Wayson, T.A. Lower,* L. Larson, L.A. Ahrens,* M. Bayless, S.E. Beck,* J. Chahal, C.
Chenard, G.C. Doelle, V.M. Guzman, U.M. Kabadi,* K.A. Ochs,* A. Rahhal, R.G.
Spanheimer,* L. Snetselaar,* K. Smith,* D. Wells. Ohio–Michigan Clinical Center Network: Case Western Reserve University, Division of Clinical and Molecular
Endocrinology, Cleveland: F. Ismail-Beigi, S. Genuth, M. Thibonnier,* L. Vargo,* C.
Kelly,* T. Bongorno,* A. Dolish,* L. Pavlik, M. Tiktin, S. Isteitieh. Ohio–Michigan
Page 11
N Engl J Med. Author manuscript; available in PMC 2015 August 27.
Author M
anuscriptA
uthor Manuscript
Author M
anuscriptA
uthor Manuscript
Clinical Sites: University Hospitals of Cleveland, Division of Endocrinology, and
University Hospitals Westlake Medical, Cleveland: F. Ismail-Beigi, A. Krikorian, L. Moore,
L. Richardson, E. Coles-Herman, K. Yee, J. Frankino, M. Jing, A. Sood, L. Hustak,* M.
Julius,* L. Pavlik,* T. Ross,* L. Long,* W. Schwing,* M. Tiktin,* M.K. Sullivan,* L.
Strauss,* K. Behm,* F. Eskandari,* C. Hall,* D. Hayes,* K. Horowitz, S. Isteitieh,* Z.
Madhun,* E. Seeholzer,* J. Shina,* H. Taylor,* A. Schnall,* S. Huang, M. Heeg, J. Tang, J.
Belkin,* M.S. Lee,* T. Joly.* St. Vincent Charity Hospital, Lipid Research Center,
Cleveland: L.S. Sadler, M. Griffith,* A. Hornsby,* K. Klyn, E. Ospelt, L. Long, M.
DeSmit,* P. McCann, N.P. Schmidt,* C. Gottfried, T. Kulow, J. Zaletal, M.S. Kapadia.
University Suburban Health Center, South Euclid, OH: A.M. Schnall, L. Dragmen, R.
Ellert,* J. Smith, J. Leksan, T. Sussman, S. Huang, M. Heeg, J. Tang, J. Belkin,* M.S. Lee,*
T. Joly.* Cleveland Veterans Affairs (VA) Medical Center, Department of Medicine, and
Ravenna Community Based Outpatient Clinic, Cleveland: F. Ismail-Beigi, L. Hustak, M.
Julius,* W. Schwing, M. Tiktin,* J. Anselmo,* F. Eskandari,* S. Daeumeyer,* C. Hall, D.
Hayes,* K. Horowitz, S. Isteitieh,* C. Johnson,* E. Kern, M.A. Richmond,* L. Richardson,
K. Roberts,* J. Shina,* A. Sood, P. Suhan,* H. Taylor, S. Watts,* J. Martin, L. Moore,* B.
Burtch,* S. Ober, G.J. Strauss, A. Leone, J. Belkin,* S. Huang,* K. Frank,* D. Stephens,*
M.S. Lee,* T. Joly.* The Cleveland Clinic Foundation, Cleveland: B.J. Hoogwerf, J.
Brakeman, M. Matzinger,* J. Newsome,* J. Becker,* S. Bizjack,* B. Clingman,* S. Curtas,
G. Depietro,* R. Ellert,* C. Horner, G. Bunae,* A. Hamrahian,* A. Hawkins, T. Head, S.
Iannica, L. Jones, P. Kaiser, R. McCoy, A. Mehta, L. Olansky, A. Orasko, S. Reddy,* D.
Ross,* L. Shockley,* E. Siraj,* M. Williams,* R. Zimmerman. Your Diabetes Endocrine
Nutrition Group, Mentor, OH: D. Weiss, K.A. Fagan, T.M. Hanslik, J. Farrell, P. Brys, M.
Oligny, K. Prokop, K. Lenardic, T. Karapanzcik, S. Huang, M. Heeg, J. Tang, J. Belkin,*
M.S. Lee,* T. Joly.* Medical University of Ohio, Department of Medicine, Ruppert Health
Center, Toledo: B. Akpunonu, R. Franco-Saenz,† J. Gilmore, M. Gilmore, L. Godfrey, P.
Ross, B. Bauer, M. Chrisstie,* A. Lopez, P. Mulrow, C. Peters,* R. Pop-Busui,* J. Roman,*
C. Smith,* J. Bick,* Z. Blust,* P.T. Nelsen, D. Marcus.* The Ohio State University Medical
Center, Division of Endocrinology, Diabetes and Metabolism, Columbus: K. Osei, E.A.
Dziengelewski,* H. Breedlove, D. Boland,* C. Casey Boyer, S. Cataland, P.A. Green, J.E.
Irwin, D.P. Schuster, J.L. Varga-Spangler, T. Bowles, K. Weiland, K. Arnold, T. Evans,* J.
Bouttamy, A. Letson, E. Craig, F. Davidorf. University of Cincinnati/VA Medical Center,
Research Service, Cincinnati: R.M. Cohen, K. Burton, J. Craig, B. Carter,* J. Harrer,* R.
Hurd,* D. Lopez-Stickney,* C. Pritchard,* A. Pfefferman,* B.A. Ramlo-Halsted,* C.
McCormick, C. Riley, M. Strominger,* A. Knittel, G. Groff, C. Bailey, A. Howald, N.
Anderson, J. Laver Bierschbach, M. Tyzinski,* B. Smith,* S. Krug, V. Hershberger,* R.K.
Hutchins,* L.A. Raymond.* Henry Ford Health System–New Center One, Detroit: D.M.
Kahkonen,* T. Cushman, M. Roman, A.M. Stys, A. Thomas, K. White, M. Austin,* C.
Chatterton, J.K. Francis,* C. Jones,* D. Kruger, A. McLellan,* F. Whitehouse, E. Higgins,*
S. Levy, A. Schoenherr,* P. Edwards. Grunberger Diabetes Institute, Bloomfield Hills, MI:
G. Grunberger, L.C. Aman,* A.H. Bandagi,* K.M. Russell, C. Tucker, Y. Abidova, A.
Amirikia. Northeastern Clinical Center Network: Columbia University College of
Physicians and Surgeons, New York: J.T. Bigger, C.R. Lopez-Jimenez, R. Bornholdt, L.
Busacca, H.N. Ginsberg, P. Gonzales, D. Gosh,* P. Love,† A. Kosok,* E. Robinson,* R.
Steinman, C. Watson, G. Reyes. Northeastern Clinical Sites: Jacobi Medical Center,
Page 12
N Engl J Med. Author manuscript; available in PMC 2015 August 27.
Author M
anuscriptA
uthor Manuscript
Author M
anuscriptA
uthor Manuscript
Bronx, NY: U.K. Schubart, M. Mendoza, G. Goswami, A. Laufer,* J. Russo, N. Vincenty.
Albert Einstein General Clinical Research Center, Bronx, NY: M.H. Alderman, L. Carroll,
M.J. Sanguily, J.U. Gorkin, A.C. Mayer, L. Ramos, V. Sessoms, A. Fritts Stewart.* Cornell
Internal Medicine Associates, New York: D. Brillon, J. Cordero, M.A. Richardson, E. Wei,
F. Ganz, B.R. Meyer, J. Paley,* S. Anderson,* C. Charles,* A. Dwoskin,* R. Chiong, K.
Hyams. The Diabetes Care and Information Center of New York, Flushing: D.L. Lorber, T.
Arenstein, P. Depree, A.A. Elmorsy,* J.M. Wendel, L.L. Zintl, P. August, M. Beck,* M.D.
Goldberg, M.J. Hofacker,* M. Marotta-Kollarus,* E.J.L. Ocampo, C.A. Resta, J.M. Tibaldi.
The Cooper Health System, Cherry Hill, NJ: A. Bastien,* S. Grudzinski, P. Niblack, L.
Abreu, T. Brobyn, K. Brown,* M. Casale,* D. Dougherty,* G. Haddad, K. Heintz, M.
Kelly,* D. Linneman,* C. Olivia, M.A. Salvador,* P. Zee,* D. Hyman. Great Lakes Medical
Clinic Research, Westfield, NY: D.F. Brautigam, R. Fischer, J.M. Chiarot, D.M. Scharf, B.
Nunn,* J. Carlson, C. Flanders,* M.R. Hagen, S. Newman, T.A. Gordon. Naomi Berrie
Diabetes Center, New York: R. Goland, C.H. Tuck,† P. Kringas, J. Hey-Hadavi,* J.
Montes,* J. Vargas-Jerez, J. Salas-Spiegel. Ambulatory Care Network at Columbia
University, New York: A. Getaneh, J. Ramirez,* E.F. Vasquez,* G. Kranwinkel. Irving
Diabetes Research Unit, New York: D.S. Donovan, G. Febres,* C. Hernandez,* M.A.
Jonaitis, L. Mesa. State University of New York Downstate Medical Center, Brooklyn:
M.A. Banerji, M. Norton, P. Patel, V. Daly, S. Hirsch, C. Jazmin, R. Khillan, D. Mendonca,
A. Relingado, E. Sandoval, M. Tiewala. Kings County, Brooklyn, NY: M.A. Banerji, M.
Norton, P. Patel, V. Daly, S. Hirsch, C. Jazmin, R. Khillan, D. Mendonca, A. Relingado, E.
Sandoval, M. Tiewala. Southeastern Clinical Center Network: Wake Forest University
School of Medicine, Department of Public Health Sciences, Winston-Salem, NC: D.C. Goff,
Jr., J.H. Summerson, L. Crago, C.S. Blackwell,* A. Bertoni,* R.L. Blaine, J.K. Kirk, R.L.
Spach, J. Williamson, J. Calles, J. Katula, D.B. Wishnietsky.* Southeastern Clinical Sites: Duke University Medical Center, Durham, NC: M.N. Feinglos, J. Jones, M.B. Mason, M.A.
Furst, W.J. Bean,* G. Gedon-Lipscomb, J.B. Green, T. Parham,* B.M. Satterwhite,* C.R.
Thacker. Constant Care, Inc., Valdosta, GA: D. Padhiar, R. Noel,* N. Padhiar, S. West,* J.
Braden, A. Francis.* Wake Forest University School of Medicine, Department of Geriatrics/
Gerontology, Winston-Salem, NC: H.H. Atkinson, M. Dibari,* J. Allen, J. Stanfield, T.
Delvalle-Fagan, L.J. Gordineer, L. Gordon, M. Gordon,* S.L. Smith,* H. Yates.*
Downtown Health Plaza, Winston-Salem, NC: C.F. Pedley, G. Zurek, M. Baird, B. Dunn,*
W. Kinder,* S. Mauney. University of North Carolina, Diabetes Care Center, Chapel Hill:
J.B. Buse, M.D. Duclos, R.E. Kirby,* J.F. Largay, N.M. McDermott,* A. Goley, S.S.
Braithwaite, M. Busby, J.M. Dostou, E.A. Fasy,* D.C. Kelly,* B. MacIntosh, C.E. Metz,* J.
Jeffries, D. Rubin.* Holston Medical Group, Kingsport, TN: J.L. Miller, S.M. Norton, J.
Weatherly,* S. Bishop,* B. Cross, K. Nuss, M. Surgenor, Y. Wood. Carolinas Medical
Center Family Practice, Charlotte, NC: K. Andrews,* T. Barringer, C. Hoffman,* J.
Konen,* C. Morris, P. Tochiki,* G. Reinblatt, P. Bruner.* Robeson Health Care
Corporation, Fairmont Clinic, Fairmont, NC: R. Peace, D.O. Stuart,* J. Strickland, L.
Cummings, D. Craig,* J. Stanfield.* Robeson Health Care, Julian T. Pierce Clinic,
Pembroke, NC: R. Peace, D.O. Stuart,* J. Strickland, L. Cummings, D. Craig,* J.
Stanfield.* Wake Forest University School of Medicine, Departments of Internal Medicine
and Endocrinology, Winston-Salem, NC: J.R. Crouse, L. Menon, S. Marion,* D. Davis,* B.
Cabrera,* J. Calles, T. Chandler, J. Ellis, E. Kouba, P. Riddle, E. Myers.* Tulane University
Page 13
N Engl J Med. Author manuscript; available in PMC 2015 August 27.
Author M
anuscriptA
uthor Manuscript
Author M
anuscriptA
uthor Manuscript
Health Science Center, New Orleans: V. Fonseca, R.H. McDuffie, N.O. Asafu-Adjaye, S.M.
Leger, P. Reilly, G. Afner, F. Arrey,* S. Asnani, E. Borshard,* D. Boyd,* A. Cemo, S.
Chennur,* P. Dupart, R. Garg,* G.P. Girindra,* B. Gouda,* W. Itoua-N’Ganongo,* I.
Innocent-Ituah,* C. Johnson,* N. Kuhadiya, M. Kukreja,* I. Mangan-Mbondi,* S. Mason,*
C. McLain, J. Naylyanya,* K. Nazereth,* S. Nazereth,* S. Singh, T. Thethi, K. Varnado,*
R. Williams.* Kaiser Permanente, Clinic Atlanta Crescent Medical Center, Tucker, GA: J.I.
Barzilay, M. Eley,* K. Bader, D. Curry-Ball, S. Goodman,* M. Stevens. Veterans Affairs (VA) Clinical Center Network: Memphis VA Medical Center, Memphis, TN: W.C.
Cushman, T.S. Geraci, S.M. Walsh, L.G. Coley, M.B. Elam, C.M. Huff, D.I. Pickering,* P.
Massimino.* VA Clinical Sites: Memphis VA Medical Center, Hypertension/Lipid
Research Clinic, Memphis, TN: M.B. Elam, C.W. Thompson, L. Lichtermann, S. Peeples, J.
Turner-Bates,* M. Heimberg, D. Childress, S. Solomon, J. Turner, J. Jasper, R. Pfeifer, J.
Coley. Baltimore VA Medical Center, Baltimore: B.P. Hamilton, J. Hamilton, G. Kuzbida,
D. Bannerman-Wood,* W. Hatten, Jr., A. Lancaster, H. Jang. Carl T. Hayden VA Medical
Center, Phoenix, AZ: J. Felicetta, M. Bourne-Collo, M.E. Svoboda, D. Clothier, M. Deitz,†
C. Flaugher,* P. Hayward,* T. Scheibe,* D. Heritage,* S. Velarde, S. Heritage, J.P. Nelson.
Atlanta VA Medical Service, Decatur, GA: M.E. Sweeney, D. Harrelson, S. McConnell,
C.R. Rice,* F. Watson, R. Johnson, L. Whittington, M. Nanes, M. Salles. Ralph H. Johnson
VA Medical Center, Primary Care, Charleston, SC: J. Basile, D.B. Ham, B. North-Lee, H.A.
Baig, S.U. Rehman, J. Mixson, D. Nelson.* G.V. Montgomery VA Medical Center,
Research Department, Jackson, MS: K.A. Kirchner, B.S. Ross, M. Kazi,* J. Subauste,* L.A.
Hinton, L. Mack, B. James,* A. Spencer, L. Henegar,* A. Jones. VA NY Harbor Healthcare
System, New York: L. Katz, E.A. Richardson, A.G. Goldberg,* A. Nieves, J.E. Russo,* S.A.
Sochalski, D. Hoffman. Washington VA Medical Center, Washington, DC: V.
Papademetriou, P. Narayan,* D. Wojciechowski, B. Gregory, R. Alignay,* E. Nylen, B.
Rajendran, R. Hodges, A. Ross,* A. Notargiacomo.* St. Louis VA Medical Center, St.
Louis: S. Giddings, E. Clark, A. Pittler, R. Davis, P. Harris, T. Hofmeister. Central Arkansas
Clinic Healthcare System, Little Rock: D.L. Simmons, J.J. Cooper,* K. Dishongh,* P.
Choksi,* S. Elbein, F. Faas, Z. Hamid, J. Johnson, A. Mayo,* M.S. Moriarty, D. Rani,* N.
Rasouli, K. Watson, A. Makdissi. ACCORD Steering Committee Chair: W.T.
Friedewald, Mailman School of Public Health and Columbia University College of
Physicians and Surgeons, New York. Coordinating Center: Wake Forest University
School of Medicine, Winston-Salem, NC: R.P. Byington, W.T. Ambrosius, R.T. Anderson,*
J. Barnes, J. Beal, C. Bell, D.E. Bonds, S. Burton,* C. Collins, D. Cook, B. Craven, T.
Craven, D. Dunbar, G.W. Evans, P. Feeney, C.D. Furberg, C.M. Greven, J. Griffin, L.
Harvin, J. Hepler, L. Howard,* L.T. Howard-Perdue, M. Hough, W. Hwang, A. Kimel, D.
Lefkowitz, A. Lopina,* J. Lovato, L.C. Lovato, M.E. Miller, D. Reboussin,* S. Rushing, L.
Sanders, L. Sims, C. Stowe, M. Walkup,* S. Wilmoth, K. Wilson, N. Woolard. Drug Distribution Center: Albuquerque VA Medical Center, Albuquerque, NM: D. Raisch, R.
Ringer, M. Sather, B. DelCurto, D. Garnand. ECG Reading Center: Wake Forest
University School of Medicine, Winston-Salem, NC: R. Prineas, C. Campbell, Z. Zhang, L.
Selph, S. Hall,* S. Hensley, Y. Li, M. Mills. Central Chemistry Laboratory: Northwest
Lipid Research Laboratories, Seattle: S. Marcovina, J. Chmielewski, K. Gadbois, V. Gaur,
G. Strylewicz, M. Ramirez, S. Waddell, M. Mehan.* ACCORD–MIND MRI Reading Center: University of Pennsylvania, Philadelphia: R.N. Bryan, C. Davatzkios, G. Moonis,
Page 14
N Engl J Med. Author manuscript; available in PMC 2015 August 27.
Author M
anuscriptA
uthor Manuscript
Author M
anuscriptA
uthor Manuscript
L. Desiderio, S. D’Arcy.* Fundus Photograph Reading Center: University of Wisconsin
Medical School, Madison: M. Davis, R. Danis, S. Johnson,* N. Robinson, L. Hubbard, B.
Esser, D. Thayer, M. Neider, K. Glader, M. Burger. Project Office: National Heart, Lung,
and Blood Institute, Bethesda, MD: D.G. Simons-Morton, L. Cooper,* M. Domanski, C.
Nwachuku,* Y. Rosenberg, M. Salive,* P. Savage, J.L. Fleg, J.A. Cutler, N. Geller, D.
Follmann,* M. Proschan,* C. Jennings, E. Schaeffer,* P. Mills,* J. Bittner,* R. Kirby, P.
Frommer,† L. Fine, J. Chan. National Institute of Diabetes and Digestive and Kidney
Diseases, Bethesda, MD: J. Fradkin, S. Malozowski, C. Meyers, T. Hostetter.* National
Institute on Aging, Bethesda, MD: L. Launer. National Eye Institute, Bethesda, MD: E.Y.
Chew. Centers for Disease Control and Prevention, Atlanta: A. Albright, K.M.V. Narayan,
M. Engelgau,* P. Zhang.
References
1. Goff DC Jr, Gerstein HC, Ginsberg HN, et al. Prevention of cardiovascular disease in persons with type 2 diabetes mellitus: current knowledge and rationale for the Action to Control Cardiovascular Risk in Diabetes (ACCORD) trial. Am J Cardiol. 2007; 99:4i–20i.
2. Selvin E, Marinopoulos S, Berkenblit G, et al. Meta-analysis: glycosylated hemoglobin and cardiovascular disease in diabetes mellitus. Ann Intern Med. 2004; 141:421–31. [PubMed: 15381515]
3. Gerstein HC, Pogue J, Mann JF, et al. The relationship between dysglycaemia and cardiovascular and renal risk in diabetic and non-diabetic participants in the HOPE study: a prospective epidemiological analysis. Diabetologia. 2005; 48:1749–55. [PubMed: 16059716]
4. Stratton IM, Adler AI, Neil HA, et al. Association of glycaemia with macrovascular and microvascular complications of type 2 diabetes (UKPDS 35): prospective observational study. BMJ. 2000; 321:405–12. [PubMed: 10938048]
5. American Diabetes Association. Standards of medical care in diabetes — 2008. Diabetes Care. 2008; 31(Suppl 1):S12–S54. [PubMed: 18165335]
6. Canadian Diabetes Association Clinical Practice Guidelines Expert Committee. Canadian Diabetes Association 2003 clinical practice guidelines for the prevention and management of diabetes in Canada. Can J Diabetes. 2003; 23(Suppl 2):S1–S152.
7. Rydén L, Standl E, Bartnik M, et al. Guidelines on diabetes, pre-diabetes, and cardiovascular diseases: executive summary. Eur Heart J. 2007; 28:88–136. [PubMed: 17220161]
8. AACE Diabetes Mellitus Clinical Practice Guidelines Task Force. American Association of Clinical Endocrinologists medical guidelines for clinical practice for the management of diabetes mellitus. Endocr Pract. 2007; 13(Suppl 1):1–68. [PubMed: 17613449]
9. Buse JB, Bigger JT, Byington RP, et al. Action to Control Cardiovascular Risk in Diabetes (ACCORD) trial: design and methods. Am J Cardiol. 2007; 99:21i–33i.
10. Gerstein HC, Riddle MC, Kendall DM, et al. Glycemia treatment strategies in the Action to Control Cardiovascular Risk in Diabetes (ACCORD) trial. Am J Cardiol. 2007; 99:34i–43i.
11. Ginsberg HN, Bonds DE, Lovato LC, et al. Evolution of the lipid trial protocol of the Action to Control Cardiovascular Risk in Diabetes (ACCORD) trial. Am J Cardiol. 2007; 99:56i–67i.
12. Bonds DE, Kurashige EM, Bergenstal R, et al. Severe hypoglycemia monitoring and risk management procedures in the Action to Control Cardiovascular Risk in Diabetes (ACCORD) trial. Am J Cardiol. 2007; 99:80i–89i.
13. [Accessed May 19, 2008] ACCORD Web site. at http://www.accordtrial.org
14. Kingry C, Bastien A, Booth G, et al. Recruitment strategies in the Action to Control Cardiovascular Risk in Diabetes (ACCORD) trial. Am J Cardiol. 2007; 99:68i–79i. [PubMed: 17196465]
15. UK Prospective Diabetes Study (UKPDS) Group. Intensive blood-glucose control with sulphonylureas or insulin compared with conventional treatment and risk of complications in
Page 15
N Engl J Med. Author manuscript; available in PMC 2015 August 27.
Author M
anuscriptA
uthor Manuscript
Author M
anuscriptA
uthor Manuscript

patients with type 2 diabetes (UKPDS 33). Lancet. 1998; 352:837–53. Erratum, Lancet 1999;354: 602. [PubMed: 9742976]
16. Abraira C, Colwell JA, Nuttall F, et al. Cardiovascular events and correlates in the Veterans Affairs Diabetes Feasibility Trial: Veterans Affairs Cooperative Study on Glycemic Control and Complications in Type II Diabetes. Arch Intern Med. 1997; 157:181–8. [PubMed: 9009975]
17. Meinert CL, Knatterud GL, Prout TE, Klimt CR. A study of the effects of hypoglycemic agents on vascular complications in patients with adult-onset diabetes. II. Mortality results. Diabetes. 1970; 19(Suppl):789–830. [PubMed: 4926376]
18. Genuth S. Exogenous insulin administration and cardiovascular risk in non-insulin-dependent and insulin-dependent diabetes mellitus. Ann Intern Med. 1996; 124:104–9. [PubMed: 8554200]
19. Booth GL, Kapral MK, Fung K, Tu JV. Relation between age and cardiovascular disease in men and women with diabetes compared with non-diabetic people: a population-based retrospective cohort study. Lancet. 2006; 368:29–36. [PubMed: 16815377]
20. Thomas RJ, Palumbo PJ, Melton LJ III, et al. Trends in the mortality burden associated with diabetes mellitus: a population-based study in Rochester, Minn, 1970-1994. Arch Intern Med. 2003; 163:445–51. [PubMed: 12588203]
21. Abraira C, Duckworth W, McCarren M, et al. Design of the cooperative study on glycemic control and complications in diabetes mellitus type 2: Veterans Affairs Diabetes Trial. J Diabetes Complications. 2003; 17:314–22. [PubMed: 14583175]
22. Study rationale and design of ADVANCE: action in diabetes and vascular disease — preterax and diamicron MR controlled evaluation. Diabetologia. 2001; 44:1118–20. [PubMed: 11596665]
23. Milicevic Z, Raz I, Strojek K, et al. Hyperglycemia and its effect after acute myocardial infarction on cardiovascular outcomes in patients with Type 2 diabetes mellitus (HEART2D) Study design. J Diabetes Complications. 2005; 19:80–7. [PubMed: 15745837]
24. ORIGIN Trial Investigators. Gerstein H, Yusuf S, Riddle MC, Ryden L, Bosch J. Rationale, design, and baseline characteristics for a large international trial of cardiovascular disease prevention in people with dysglycemia: the ORIGIN Trial (Outcome Reduction with an Initial Glargine Intervention). Am Heart J. 2008; 155:26–32. [PubMed: 18082485]
25. Magee MF, Isley WL. Rationale, design, and methods for glycemic control in the Bypass Angioplasty Revascularization Investigation 2 Diabetes (BARI 2D) Trial. Am J Cardiol. 2006; 97:20G–30G.
Page 16
N Engl J Med. Author manuscript; available in PMC 2015 August 27.
Author M
anuscriptA
uthor Manuscript
Author M
anuscriptA
uthor Manuscript
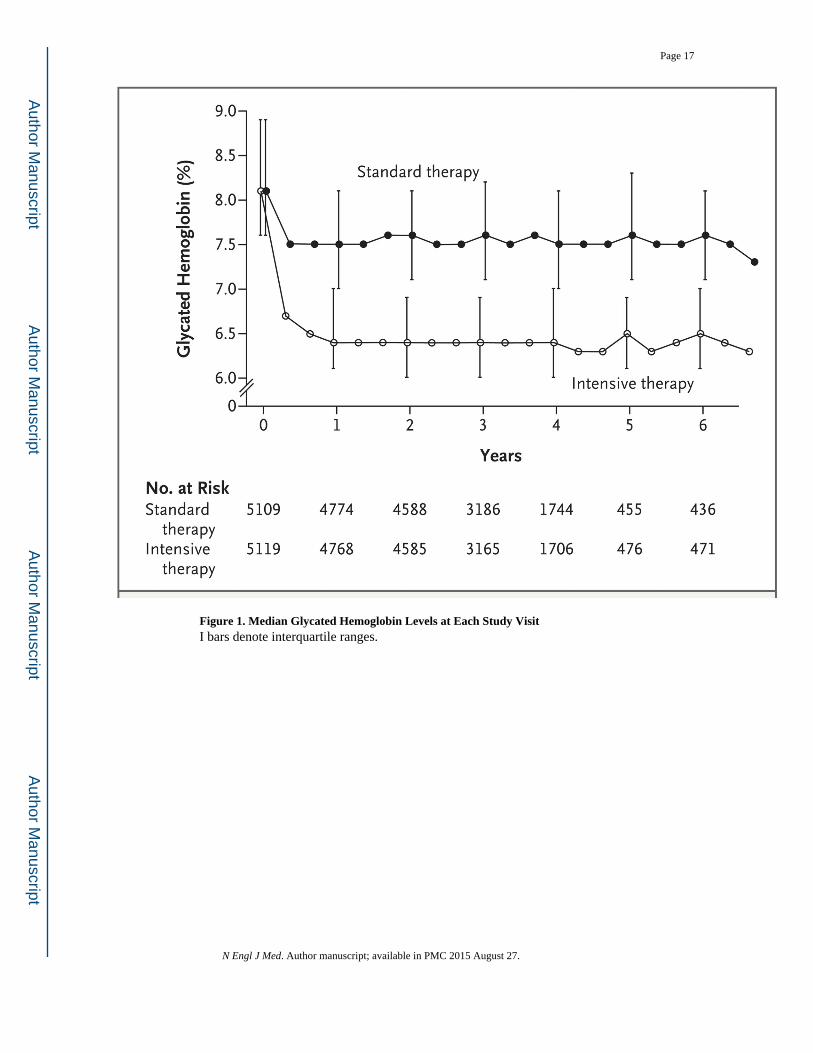
Figure 1. Median Glycated Hemoglobin Levels at Each Study VisitI bars denote interquartile ranges.
Page 17
N Engl J Med. Author manuscript; available in PMC 2015 August 27.
Author M
anuscriptA
uthor Manuscript
Author M
anuscriptA
uthor Manuscript

Figure 2. Kaplan–Meier Curves for the Primary Outcome and Death from Any Cause
Page 18
N Engl J Med. Author manuscript; available in PMC 2015 August 27.
Author M
anuscriptA
uthor Manuscript
Author M
anuscriptA
uthor Manuscript
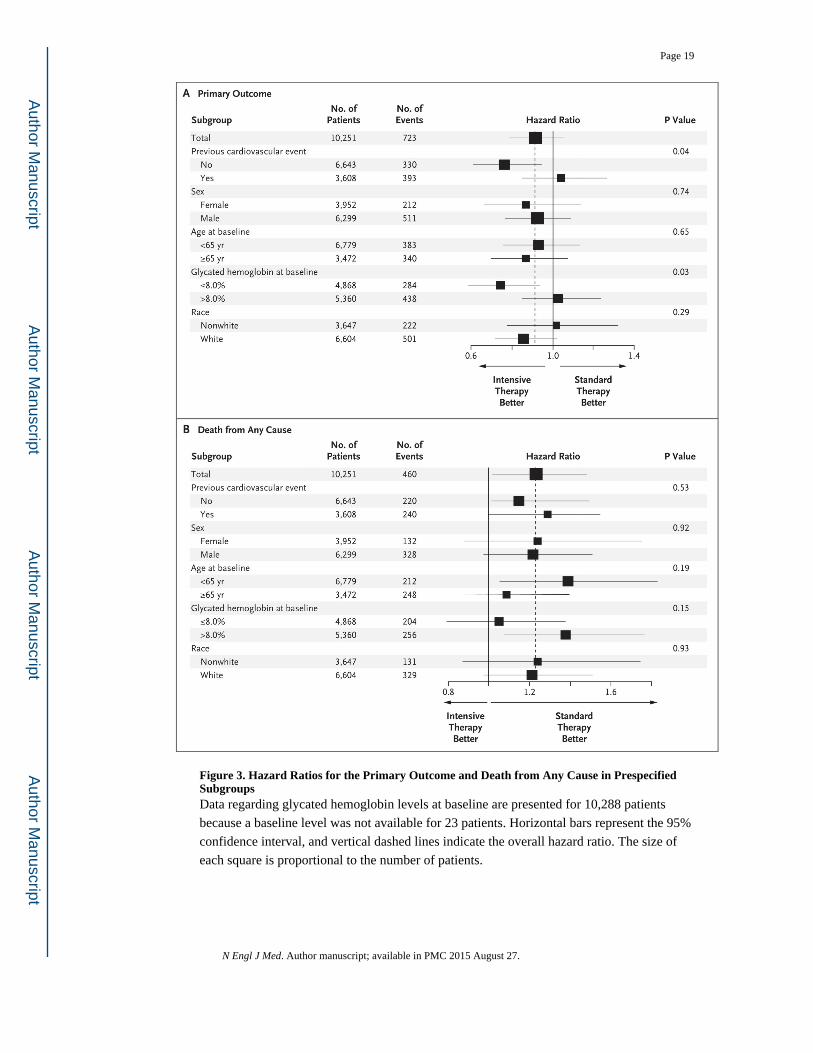
Figure 3. Hazard Ratios for the Primary Outcome and Death from Any Cause in Prespecified SubgroupsData regarding glycated hemoglobin levels at baseline are presented for 10,288 patients
because a baseline level was not available for 23 patients. Horizontal bars represent the 95%
confidence interval, and vertical dashed lines indicate the overall hazard ratio. The size of
each square is proportional to the number of patients.
Page 19
N Engl J Med. Author manuscript; available in PMC 2015 August 27.
Author M
anuscriptA
uthor Manuscript
Author M
anuscriptA
uthor Manuscript
Author M
anuscriptA
uthor Manuscript
Author M
anuscriptA
uthor Manuscript
Page 20
Table 1
Characteristics of the Patients at Baseline.*
Variable Intensive Therapy (N = 5128) Standard Therapy (N = 5123)
Age (yr) 62.2±6.8 62.2±6.8
Female sex (%) 38.7 38.4
Median duration of diabetes (yr) 10 10
Previous cardiovascular event (%) 35.6 34.8
Previous congestive heart failure (%) 4.9 4.8
Race or ethnic group (%)†
White 64.4 64.5
Black 19.7 18.9
Hispanic 7.0 7.4
Education (%)
Less than high school 15.7 14.0
High-school graduate 26.1 26.7
Some college 32.7 32.9
College degree or higher 25.5 26.4
Cigarette-smoking status (%)
Current 14.3 13.7
Former 44.4 44.0
Never 41.3 42.3
Weight (kg) 93.5±18.7 93.6±18.7
Body-mass index 32.2±5.5 32.2±5.5
Waist circumference (cm) 106.8±14.3 106.8±13.8
Blood pressure (mm Hg)
Systolic 136.2±17.0 136.5±17.2
Diastolic 74.8±10.6 75.0±10.7
Medications (%)
Insulin 34.1 35.7
Metformin 59.7 60.0
Any sulfonylurea 50.8 49.4
Any thiazolidinedione 19.5 19.2
Any antihypertensive agent 84.9 86.0
Angiotensin-converting–enzyme inhibitor 53.0 53.0
Aspirin 54.8 54.1
Beta-blocker 28.7 29.9
Any thiazide diuretic 26.5 26.4
Statin 61.7 62.4
Glycated hemoglobin (%)
N Engl J Med. Author manuscript; available in PMC 2015 August 27.
Author M
anuscriptA
uthor Manuscript
Author M
anuscriptA
uthor Manuscript
Page 21
Variable Intensive Therapy (N = 5128) Standard Therapy (N = 5123)
Mean 8.3±1.1 8.3±1.1
Median 8.1 8.1
Fasting serum glucose (mg/dl) 174.9±56.0 175.7±56.5
Cholesterol (mg/dl)
Total 183.3±42.1 183.3±41.6
Low-density lipoprotein 104.9±34.0 104.9±33.8
High-density lipoprotein
Women 47.2±13.0 46.9±12.2
Men 38.4±9.5 38.8±9.8
Median triglyceride (mg/dl) 156 154
Potassium (mg/dl) 4.5±0.4 4.5±0.7
Serum creatinine (mg/dl) 0.9±0.2 0.9±0.2
*Plus–minus values are means ±SD. There were no significant differences between the two study groups at baseline. The body-mass index is the
weight in kilograms divided by the square of the height in meters. To convert the values for glucose to millimoles per liter, multiply by 0.05551. To convert the values for cholesterol to millimoles per liter, multiply by 0.02586. To convert the values for triglycerides to millimoles per liter, multiply by 0.01129. To convert the values for potassium to millimoles per liter, multiply by 0.2558. To convert the values for creatinine to micromoles per liter, multiply by 88.4.
†Race was self-reported, and patients could check multiple categories.
N Engl J Med. Author manuscript; available in PMC 2015 August 27.
Author M
anuscriptA
uthor Manuscript
Author M
anuscriptA
uthor Manuscript
Page 22
Table 2
Prescribed Glucose-Lowering Drugs.*
Drug Class and Name Intensive Therapy (N = 5128) Standard Therapy (N = 5123)
no. of patients (%) person-years no. of patients (%) person-years
Single class
Metformin 4856 (94.7) 14,444 4452 (86.9) 12,693
Secretagogue† 4443 (86.6) 12,021 3779 (73.8) 10,059
Glimepiride 4010 (78.2) 9,142 3465 (67.6) 8,955
Repaglinide 2574 (50.2) 4,447 908 (17.7) 1,293
Thiazolidinedione‡ 4702 (91.7) 12,844 2986 (58.3) 6,719
Rosiglitazone 4677 (91.2) 12,639 2946 (57.5) 6,563
α-Glucosidase inhibitor§ 1191 (23.2) 941 263 (5.1) 200
Incretin¶ 911 (17.8) 566 251 (4.9) 175
Exenatide 622 (12.1) 415 204 (4.0) 155
Any insulin 3965 (77.3) 11,902 2837 (55.4) 7,842
Any bolus insulin 2834 (55.3) 6,806 1794 (35.0) 4,336
Combination of classes
No. of classes without insulin
1 or 2 2798 (54.6) 2,011 3224 (62.9) 6,612
3 3030 (59.1) 3,681 1681 (32.8) 2,545
4 or 5 539 (10.5) 332 109 (2.1) 67
No. of classes with insulin
0 916 (17.9) 829 892 (17.4) 1,495
1 or 2 3311 (64.6) 6,603 2375 (46.4) 5,284
3 2668 (52.0) 4,126 834 (16.3) 1,027
4 or 5 526 (10.3) 344 64 (1.2) 36
*Metformin, glimepiride, repaglinide, rosiglitazone, acarbose, and exenatide were provided by a study-supervised formulary. Patients could receive
more than one medication or combination of medications and may therefore be counted in more than one category. All individual medications that are listed were prescribed to at least 10% of patients in either group.
†Patients received glimepiride, glyburide, gliclazide, repaglinide, or nateglinide.
‡Patients received rosiglitazone or pioglitazone.
N Engl J Med. Author manuscript; available in PMC 2015 August 27.

Author M
anuscriptA
uthor Manuscript
Author M
anuscriptA
uthor Manuscript
Page 23
§All the patients in this category received acarbose except one who received miglitol.
¶Patients received exenatide or sitagliptin.
N Engl J Med. Author manuscript; available in PMC 2015 August 27.
Author M
anuscriptA
uthor Manuscript
Author M
anuscriptA
uthor Manuscript
Page 24
Table 3Adverse Events, Clinical Measures, Tobacco Use, and Use of Nonglycemic Medication
after Randomization.*
VariableIntensive Therapy
(N = 5128)Standard Therapy
(N = 5123) P Value†
Adverse events
Hypoglycemia — no. (%)
Requiring medical assistance 538 (10.5) 179 (3.5) <0.001
Requiring any assistance 830 (16.2) 261 (5.1) <0.001
Fatal or nonfatal heart failure — no. (%) 152 (3.0) 124(2.4) 0.10
Motor vehicle accident in which patient was driver — no./total no. (%) 9/5033 (0.2) 14/5036 (0.3) 0.40
Any nonhypoglycemic serious adverse event — no. (%) 113 (2.2) 82 (1.6) 0.03
Fluid retention — no./total no. (%)‡ 3541/5053 (70.1) 3378/5054 (66.8) <0.001
Clinical measures
Weight gain >10 kg since baseline — no./total no. (%) 1399/5036 (27.8) 713/5042 (14.1) <0.001
Alanine aminotransferase >3 times ULN — no./total no. (%)§ 51/5065 (1.0) 77/5061 (1.5) 0.02
Low-density lipoprotein cholesterol — mg/dl¶ 90.8±33.5 90.6±34.0 0.74
Blood pressure — mm Hg¶
Systolic 126.4±16.7 127.4±17.2 0.002
Diastolic 66.9±10.5 67.7±10.6 <0.001
Cigarette-smoking status — no. (%) ∥ 0.54
Current (previous 30 days) 505 (9.8) 508 (9.9)
Former 2524 (49.2) 2467 (48.2)
Never 2093 (40.9) 2143 (41.8)
Missing data 6 (0.1) 5 (0.1)
Use of nonglycemic medication — no./total no. (%)
Antihypertensive 4664/5127 (91.0) 4714/5123 (92.0) 0.06
Angiotensin-converting–enzyme inhibitor 3512/5038 (69.7) 3621/5037 (71.9) 0.02
Aspirin 3736/4950 (75.5) 3753/4970 (75.5) 0.98
Beta-blocker 2395/5038 (47.5) 2450/5037 (48.6) 0.27
N Engl J Med. Author manuscript; available in PMC 2015 August 27.
Author M
anuscriptA
uthor Manuscript
Author M
anuscriptA
uthor Manuscript
Page 25
VariableIntensive Therapy
(N = 5128)Standard Therapy
(N = 5123) P Value†
Statin 4432/5039 (88.0) 4425/5054 (87.6) 0.54
*Plus–minus values are means ±SD. Data within categories are not mutually exclusive. Percentages may not total 100 because of rounding. ULN
denotes upper limit of the normal range.
†P values were calculated with the use of Fisher’s exact test or a two-sample t-test.
‡Of the patients with fluid retention, 89% had pretibial edema or ankle swelling, 30% had shortness of breath, 12% had congestive heart failure or
pulmonary edema, and 24% had nocturia.
§The ULN for alanine aminotransferase was 65 U per liter for men and 50 U per liter for women.
¶Data were obtained from last available measurement at the 12-month visit or later.
∥Smoking status was reported at the last annual visit.
N Engl J Med. Author manuscript; available in PMC 2015 August 27.

Author M
anuscriptA
uthor Manuscript
Author M
anuscriptA
uthor Manuscript
Page 26
Table 4
Primary and Secondary Outcomes.*
Outcome Intensive Therapy (N = 5128) Standard Therapy (N = 5123)Hazard Ratio
(95% CI) P Value
no. of patients (%) % per yr no. of patients (%) % per yr
Primary outcome 352 (6.9) 2.11 371 (7.2) 2.29 0.90 (0.78–1.04) 0.16
Secondary outcome
Death
Any cause 257 (5.0) 1.41 203 (4.0) 1.14 1.22 (1.01–1.46) 0.04
Cardiovascular causes 135 (2.6) 0.79 94 (1.8) 0.56 1.35 (1.04–1.76) 0.02
Nonfatal myocardial infarction 186 (3.6) 1.11 235 (4.6) 1.45 0.76 (0.62–0.92) 0.004
Nonfatal stroke 67 (1.3) 0.39 61 (1.2) 0.37 1.06 (0.75–1.50) 0.74
Fatal or nonfatal congestive heart failure 152 (3.0) 0.90 124 (2.4) 0.75 1.18 (0.93–1.49) 0.17
Causes of death
Any 257 (5.0) 1.41 203 (4.0) 1.14 1.22 (1.01–1.46) 0.04
Unexpected or presumed cardio- vascular disease† 86 (1.7) 67 (1.3)
Fatal myocardial infarction† 19 (0.4) 13 (0.3)
Fatal congestive heart failure† 23 (0.4) 16 (0.3)
Fatal procedure†
For cardiovascular disease 10 (0.2) 3 (0.1)
For noncardiovascular disease 1 (<0.1) 3 (0.1)
Fatal arrhythmia† 4 (0.1) 10 (0.2)
Fatal stroke† 9 (0.2) 11 (0.2)
Other cardiovascular disease† 8 (0.2) 10 (0.2)
Cancer 65 (1.3) 63 (1.2)
Condition other than cancer or cardiovascular disease‡ 50 (1.0) 35 (0.7)
Undetermined 7 (0.1) 11 (0.2)
*The primary outcome was the first occurrence of nonfatal myocardial infarction or nonfatal stroke or death from cardiovascular causes. Data
within categories are not mutually exclusive, and patients who were classified as having more than one possible cause of death are listed in the relevant categories. Hazard ratios are for the intensive-therapy group as compared with the standard-therapy group.
†This condition was a component of the outcome of fatal cardiovascular disease.
‡Additional details are provided in the Supplementary Appendix.
N Engl J Med. Author manuscript; available in PMC 2015 August 27.


