
THE ACCEPTANCE OF ONLINE WAQF IN ISLAMIC BANKING INSTITUTIONS
MARDZIYAH MOHD ISA
MASTER IN ISLAMIC FINANCE AND BANKINGUNIVERSITI UTARA MALAYSIA
2014
ii
THE ACCEPTANCE OF ONLINE WAQF IN ISLAMIC BANKING INSTITUTIONS
By:
MARDZIYAH MOHD ISA
Thesis Submitted toOthman Yeop Abdullah Graduate School of Business,
Universiti Utara MalaysiaIn Partial Fulfillment of the Requirement for the
Master in Islamic Finance and Banking

iii
PERMISSION TO USE
In presenting this research paper in partial fulfilment of the requirements for a Post Graduate degree from the Universiti Utara Malaysia (UUM), I agree that the Library of this university may make it freely available for inspection. I further agree that permission for copying this research paper in any manner, in whole or in part, for scholarly purposes may be granted by my supervisors or in their absence, by the Dean of Othman Yeop Abdullah Graduate School of Business where I did my dissertation. It I understood that any copying or publication or use of this research paper parts of it for financial gain shall not be allowed without my written permission. It is also understood that due recognition shall be given to me and to the UUM in any scholarly use which may be made of any material in my dissertation/project paper.
Request for permission to copy or to make other use of materials in this research paper in whole or in part should be addressed to:
Dean of Othman Yeop Abdullah Graduate School of BusinessUniversiti Utara Malaysia
06010 UUM SintokKedah Darul Aman

iv
ABSTRACT
This research explores the factors influencing the acceptance of online waqf in Islamic banking institutions. The survey involved 230 Muslim respondents among Universiti Utara Malaysia, College of Business (UUM COB) staffs. All the data are analyzed using software of Statistical Package for Social Science (SPSS) by conducting statistical method namely, Independent Samples T-Test, Analysis of Variance (ANOVA), Pearson Correlation and Multiple Linear Regression analysis to archive the objectives of this research. A conceptual framework is built based on the Technology Acceptance Model (TAM) by adding three new external variables, namely perceived religiosity, perceived self-efficacy and amount of information to further explain the acceptance of online waqf. The results showed that four variables are positively correlated with the acceptance of online waqf at 95% and 99% of confidence level. In addition, the results also identified three factors which are perceived usefulness, perceived ease of use and amount of information found significant in influencing the acceptance of online waqf. However, perceived religiosity and perceived self-efficacy is found to be insignificant predictor. Therefore, understanding what influences users to accept and use online waqf can be beneficial to banks, system developers and marketing practitioners in developing and marketing online waqf services that will be acceptable by the target market. Other than that, this study also propagate valuable insights for Islamic banking institutions to introduce online waqf in the future where the factors analyzed could be used as a guideline for better planning and implementation of online waqf.
Keywords: Online waqf, Adoption, Technology Acceptance Model (TAM), Islamic Banking Institutions.

v
ABSTRAK
Kajian ini dilakukan untuk mengukur faktor-faktor yang mempengaruhi penerimaan waqaf atas talian di institusi perbankan Islam. Kajian ini telah dijalankan terhadap 230 responden Muslim di kalangan kakitangan Universiti Utara Malaysia, Kolej Perniagaan. (UUM COB). Semua data dianalisis menggunakan Perisian Pakej Statistik Untuk Sains Sosial (SPSS) dan diuji dengan menggunakan Ujian-T Sampel Tidak Bersandar, Analisis Varians (ANOVA), Korelasi Pearson dan Regrasi Linear Berganda bagi mencapai objektif kajian ini. Kerangka kerja konseptual telah dibina berdasarkan Model Penerimaan Teknologi (TAM) dengan menambah tiga pembolehubah luaran yang baru iaitu persepsi agama, persepsi kecekapan diri dan jumlah maklumat untuk menjelaskan lagi hasrat menggunakan waqaf atas talian. Hasil kajian menunjukkan bahawa empat pembolehubah mempunyai hubungan yang positif terhadap hasrat untuk menggunakanwaqaf atas talian pada tahap keyakinan 95% dan 99%. Tambahan lagi, hasil keputusan kajian ini juga mengenal pasti tiga faktor iaitu persepsi kebergunaan, persepsi kemudahgunaan dan jumlah maklumat didapati penting dalam mempengaruhi hasrat untuk menggunakan waqaf atas talian. Bagaimanapun, persepsi agama dan persepsi kecekapan diri didapati tidak membuktikan sebagai pengaruh penting terhadap hasrat untuk menggunakan waqaf atas talian. Oleh itu, memahami apakah faktor yang mempengaruhi pengguna untuk menerima dan menggunakan waqaf atas talian boleh memberi manfaat kepada bank-bank, pemaju sistem dan pengamal pemasaran dalam membangunkan serta memasarkan perkhidmatan waqaf atas talian yang akan diterima oleh sasaran pasaran. Selain daripada itu, kajian ini juga akan memberikan maklumat yang bermakna kepada institusi perbankan Islam untuk memperkenalkan waqaf atas talian pada masa akan datang di mana faktor-faktor yang dikaji boleh digunakan sebagai garis panduan bagi perancangan dan pelaksanaan waqaf atas talian dengan lebih baik.
Kata Kunci: Waqaf atas talian, Adaptasi, Model Penerimaan Teknologi (TAM)dan Institusi Perbankan Islam.

vi
ACKNOWLEDGEMENT
In the name of Allah, the Most Gracious, the Most Merciful
Alhamdulillah, by the will of Allah, I am able to complete this thesis within the required
time. I would foremost extend my sincere gratitude to all those efforts, who facilitated
the completion of this thesis. Special thanks to Dr. Muhammad bin Ahmad my
respected supervisor for his guidance, time and effort to ensure that I can fulfill the
requirement for this master thesis. I have learned so much from his and wish his
continued success in his career at the Universiti Utara Malaysia. Without his support,
careful supervision and expertise, this thesis would not been possible. I also would like
to say great appreciated to Assoc. Prof. Dr. Abu Bakar bin Hamid for his guidance in
the course of Research Methodology where from his knowledge sharing I am able to
understand and fulfill thesis requirement very well.
My sincere appreciation goes to my respective parent Mohd Isa bin Hassan and Meryam
binti Ishak for their moral and educational up bringing rendered to me. May their gentle
soul rest in a piece and May Allah rewards them with Jannatul Firdausi, Amin.
I owe my loving to my family especially my second mother Rokiah binti Kassim for the
understanding, encouragement and financial support, which has enabled me to
successfully complete my master study. Special thanks to all my siblings; A’tiroh,
Faizah, Mohd Taqiyuddin, Mohd Jalaluddin and Mohd Salamuddin, thanks for being
supportive and caring siblings.
I also give special thanks to all my friends, especially to students of Master in Islamic
Finance and Banking, who always cheer up my day up with their jokes and supports.
Last but not least, I would like to thank everyone involved who has given inspirations
and guidance whether directly or indirectly. Thank you.

vii
TABLE OF CONTENTS
PERMISSION TO USE....................................................................................................iii
TABLE OF CONTENTS.................................................................................................vii
LIST OF TABLES.............................................................................................................x
LIST OF FIGURES ..........................................................................................................xi
LIST OF ABBREVIATIONS..........................................................................................xii
CHAPTER 1 : INTRODUCTION .....................................................................................1
1.1 Introduction.............................................................................................................1
1.2 Overview of Waqf ...................................................................................................1
1.3 Background of the study .........................................................................................5
1.4 Problem Statement ..................................................................................................7
1.5 Research Questions .................................................................................................9
1.6 Research Objectives..............................................................................................10
1.7 Significance of the Study ......................................................................................11
1.8 Definition of Key Terms.......................................................................................12
1.9 Scope and Limitation of the Study........................................................................13
1.9.1 Scope of the Study.........................................................................................13
1.9.2 Limitation of the Study..................................................................................14
1.10 Organization of the Thesis ....................................................................................15
CHAPTER 2 : LITERATURE REVIEW ........................................................................17
2.1 Introduction...........................................................................................................17
2.2 Waqf Studies .........................................................................................................17
2.3 Cash Waqf with Online System ............................................................................22
2.4 Technology Acceptance Model (TAM)................................................................24
2.5 Research Model ....................................................................................................26
2.5.1 Perceived Usefulness .....................................................................................26
2.5.2 Perceived Ease of Use ...................................................................................28
2.5.3 Perceived Religiosity .....................................................................................29
2.5.4 Perceived Self-efficacy..................................................................................31

viii
2.5.5 Amount of Information..................................................................................32
2.6 Research Hypotheses ............................................................................................33
2.7 Research Framework ............................................................................................34
CHAPTER 3 : RESEARCH METHODOLOGY ............................................................36
3.1 Introduction...........................................................................................................36
3.2 Research Design....................................................................................................36
3.3 Population and Sample of the Study.....................................................................37
3.4 Questionnaire Design............................................................................................40
3.5 Measurement of the Variables ..............................................................................41
3.6 Data Collection Method........................................................................................43
3.7 Reliability of the Instrument .................................................................................44
3.8 Normality of the Data ...........................................................................................46
3.9 Data Analysis ........................................................................................................47
3.10 Descriptive Statistics.............................................................................................48
3.11 Inferential Statistics ..............................................................................................49
3.11.1 Test of Differences ........................................................................................49
3.11.2 Pearson Correlation .......................................................................................51
3.11.3 Multiple Linear Regressions..........................................................................52
3.12 Conclusion ............................................................................................................54
CHAPTER 4 : DATA ANALYSIS AND FINDINGS ....................................................55
4.1 Introduction...........................................................................................................55
4.2 Profile of the Respondents ....................................................................................55
4.3 Level of Online Waqf Acceptance and Determinant Factors...............................57
4.4 The differences between Demographic Factors and Online Waqf........................58
Acceptance .......................................................................................................................58
4.4.1 The difference between Gender and Online Waqf Acceptance .....................58
4.4.2 The difference between Position in University and Online Waqf .................59
Acceptance ...................................................................................................................59
4.4.3 The Difference between Age and Online Waqf Acceptance .........................60
4.4.4 The difference between Highest Education Level and Online Waqf.............62
Acceptance ...................................................................................................................62

ix
4.4.5 The Difference between Monthly Income and Online Waqf Acceptance .....63
4.4.6 The Difference between Working Period and Online Waqf Acceptance ......64
4.5 The Relationship between the Factors with Online Waqf Acceptance .................65
4.6 Factors Influencing the Acceptance of Online Waqf ............................................69
CHAPTER 5 : DISCUSSION AND RECOMMENDATIONS ......................................73
5.1 Introduction...........................................................................................................73
5.2 Discussion of the Findings....................................................................................73
5.3 Contributions of the study.....................................................................................76
5.4 Recommendations.................................................................................................78
5.5 Limitations of the Study........................................................................................79
5.6 Conclusion ............................................................................................................80
REFERENCES ................................................................................................................82
APPENDICES

x
LIST OF TABLES
Table 1.1 Internet banking subscribers (end of period)…………………………….8
Table 3.1 Sample Size for a Given Population Size……………………………….39
Table 3.2 The list of Colleges in the Clusters………….…………………………..40
Table 3.3 Measurement of the Variables………………………………………….42
Table 3.4 Reliability test for the variables…………………………………………45
Table 3.5 Data analysis technique………………………………………………....54
Table 4.1 Profile of the respondents………………………………………………57
Table 4.2 Level of Online Waqf Acceptance and Determinant Factors…………..58
Table 4.3 The Difference between Gender and Online Waqf Acceptance………...59
Table 4.4 The difference between Positions in University and Online
Waqf Acceptance……………………………..........................................60
Table 4.5 The difference between Ages and Online Waqf Acceptance…………...61
Table 4.6 Post Hoc ANOVA analysis of Ages……………………………………62
Table 4.7 The Difference between Highest Education Levels and Online
Waqf Acceptance……………………………………………………….63
Table 4.8 The Difference between Monthly Income and Online
Waqf Acceptance……………………………………………………….64
Table 4.9 The difference between Working Period and Online Waqf
Acceptance……………………………………………………………..65
Table 4.10 Results of Pearson Correlation Analysis among Variables…………….66
Table 4.11 Results of Multiple Regression Analysis………………………………70

xi
LIST OF FIGURES
Figure 1.1 Performance of Cash Waqf in Malaysia Dicember 2012………………..7
Figure 1.2 Organization of the Study………………………………………………16
Figure 2.1 Technology Acceptance Model (TAM)………………………………...26
Figure 2.2 Theoretical Framework of Online Waqf Acceptance…………………..35
Figure 3.1 Formulas for Multiple Linear Regressions……………………………..53
xii
LIST OF ABBREVIATIONS
ANOVA Analysis of Variance
BIMB Bank Islam Malaysia Berhad
BMMB Bank Muamalat Malaysia Berhad
BNM Bank Negara Malaysia
COB College of Business
ICT Information and Communication Technology
SPSS Statistical Package for Social Science
TAM Technology Acceptance Model
TRA Theory of Reasoned Action
UUM COB Universiti Utara Malaysia, College of Business
UUM Universiti Utara Malaysia
YWM Yayasan Wakaf Malaysia
1
CHAPTER 1
INTRODUCTION
1.1 Introduction
This study explores the factors influencing the acceptance of online waqf which is
generally termed as Islamic e-donations in Malaysia. This chapter begins with an
overview of waqf, background of the study, problem statement, research questions and
research objectives. It follows by significant of the study, the definition of key terms and
the scope and limitations of the study. Finally, this chapter discusses the organization of
remaining chapters.
1.2 Overview of Waqf
In Arabic word, waqf can be defined as “وقف”, which means to hold or detain. On the
other hand, waqf is detention of a specific thing in the ownership of waqif (appropriator)
and devoting of its profits or usufruct in charity for the poor or other pious intentions
(Ibrahim, 2008). According to Kahf (1998), waqf is an act of holding certain property
and preserve it for confined benefit of certain philanthropy that disallows any use or
disposition outside the specific objective. Waqf applies to non-perishable property, the

The contents of
the thesis is for
internal user
only

82
REFERENCES
Abdullah, N. and Abd-Majid, M.S. (2003) The Influence of Religiosity, Income and Consumption On Saving Behaviour: The Case of International IslamicUniversity Malaysia, IQTISAD Journal of Islamic Economics, 4, 1, 37-55.
Ab. Aziz, M. R., Johari, F. and Yusof, M. A. (2013). Cash Waqf Models for Financing Education. Paper Proceeding of the 5th Islamic Economics System Conference:”Sustainable Development Through the Islamic Economics System”. Organized by Faculty Economics and Muamalat, Universiti Sains Islam Malaysia.
Ab. Aziz, M. R., Yusof, M. A., Johari, F. and Sabri, H. (2014). Relationship between Level of Income and Method of Contribution and Appointment of Islamic Waqf Bank as an Agent in Collecting Waqf Fund, Journal of Emerging Economies and Islamic Research, Vol. 2, No. 2.
Abdullah, M. S. (2010). Agama Mega Utusan Malaysia, 1 September.
Adam, S. and Lahsasna, A. (2013). Cash endowment as source of fund in Islamic micro-financing, 4th International Conference on Business and Economic Research (4th
ICBER 2013), proceeding, 1362-1378.
Ajzen, I., and Fishbein, M. (1980). Understanding Attitudes and Predicting Social Behavior. Prentice-Hall, Inc.
Alrafi, A. (2006). Technology Acceptance Model. Retrieved 4th February 2009, from www.irnresearch. org/RIPs/2005/RIP2005-4.pdf.
Amin, H. (2007). Internet Banking Adoption among Young Intellectuals. Journal of Internet Banking and Commerce, 12(3), 1-1 3.
Amin, H., Baba, R., and Muhammad, M. Z. (2007). An Analysis of Mobile Banking Acceptance by Malaysian Customers. Sumvay Academic Journal, 4, 1-1 2.
Amin, H. (2008). Factors Affecting The Intentions Of Customers In Malaysia To Use Mobile Phone Credit Cards. Management Research News, 31 (7), 493-503.
Amin, H. (2009). An Analysis of Online Banking Usage Intentions: An Extension of The Technology Acceptance Model, International Journal of Business and Society, 10, 1, 27-40.

83
Amin, H. (2010). Factors Affecting the Decisions of Tabung Haji Customers in Malaysia to Use ATM Banking: An Empirical Investigation, Journal of Internet Banking and Commerce, August 2010, vol. 15, no.2.
Amin, H., Supinah, R., Aris, M. M. and Baba, R. (2012). Receptiveness of Mobile Banking by Malaysian Local Customers in Sabah: An Empirical Investigation, Journal of Internet Banking and Commmerce, vol. 17, no. 1.
Amin, H., Rahman, A. R. A., Ramayah, T., Supinah, R. and Aris, M. M. (2014). Determinants of Online Waqf Acceptance: An Empirical Investigation, The Electronic Journal on Information Systems in Developing Countries, 60, 8, 1-18.
Bandura, A. (1982). Self-efficacy Mechanism in Human Agency, The American Psychologist, 37(2), pp. 122-147.
Baraghani, S., N. (2007) Factors Influencing the Adoption of Internet Banking. Master Thesis. Tarbiat Modares University of Engineering Department of IndustrialEngineering.
Cavana, R. Y., Delehaye, B. L., & Sekaran, U. (2010). Applied Business Research: Qualitative and Quantitative Methods. Australia: John Wiley & Sons Ltd.
Chowdhury and Rahaman, M. S. (2011). Economics of Cash Waqf Management in Malaysia: A proposed cash waqf model for practitioners and future researcher, African Journal of Business Management, 5(20).
Chung, D. (2008). A Comparison of Three Models to Understand Purchasing Behaviour of Avatar-Related Products. Paper Presented at the Annual Meeting of the International Communication Association. Retrievedhttp://www.allacademic.com/ meta /p11540 -index. html.
Chuttur, M. Y. (2009). Overview of the Technology Acceptance Model: Origin, Developments and Future Direction. Working Paper on Information System,ISSN 1535-6078, 9(37).
Coakes, S. J., and Steed, L. (2007). SPSS Version 14.0 for Windows: Analysis without Anguish. Australia: John Wiley & Sons Australia, Ltd,
Davis, F. D. (1985). A Technology Acceptance Model for Empirically Testing New End-User Information System: Theory and Result. (Unpublished DoctoraI Dissertation). MIT Sloan School of Management, Cambridge, MA.
Davis, F. D. (1989). Perceived Usefulness, Perceived Ease of Use and User Acceptance of Information Technology. MIS Quarterly, 13(3), 31 9-340.
Davis, F.D. Bagozzi, R.P., and Warshaw, P.R. (1989). User acceptance of computer technology: A comparison of two theoretical models. Management Science, 35(8), 982-1003.

84
Dona, D.R. (2007) Penerapan Wakaf Tunai Pada Lembaga Keuangan Public Islami, Journal of Islamic Business and Economics, 1, 1, 85-99.
Ellen, P. S., Bearson, W. O. and Sharma, S. (1991). Resistance to Technological Innovations: An Examination of the Role of Self-Efficacy and Performance Satisfaction, Journal of the Academy of Marketing Science, 19(4), pp. 297-307.
Fishbein, M., and Ajzen, 1. (1975). Belief, Attitude, Intention, and Behavior: An Introduction to Theory and Research. Reading, UA: Addison Wesley.
Guriting, P. and Ndubisi, N.O. (2006) Borneo Online Banking: Evaluating CustomerPerceptions and Behavioral Intention, Management Research News, 29, 1/2, 6-15.
Hair, J. F., Anderson, R. E., Tatam, R. L. & Beach, W. C. (1998). Multivariate Data Analysis, (3rd ed.). MacMillan Publ. Co.
Hair, J. F., Balck, W. C., Babin, B. J., Anderson, R. E., & Tatham, R. L. (2006). Multivariate Data Analysis (6th ed.). Upper Saddle River, New Jersey: Pearson Education International.
Hair, J., Money, A., & Samouel, P. &. (2007). Research Methods for Business (ed. ke 7). Australia: John Wiley & Sons.
Hashim, M. A. and Bisnes, J. (2009). Satu Pendekatan Strategik Ke Arah Pemerkasaan Ekonomi Ummah, Kongres Ekonomi Islam Ke-3, Malaysia Islamic Chamber of Commerce.
Ibrahim, M. B. (2008). Pelaksanaan Skim Wakaf Tunai oleh Yayasan Waqaf Malaysia, Jurnal Pengurusan Jawhar, Vol. 2, No. 1.
Ismail, C. Z., Muda, S. and Hanafiah, N. J. A. (2014). Challenges and Prospects of Cash Waqf Development in Malaysia, Journal of Basic and Applied Scientific Research, 4(2) 340-348.
Jabatan Perdana Menteri (1987). Tafsir Pimpinan al-Rahman. Kuala Lumpur: Bahagian Hal Ehwal Islam.
Kahf, M. (1998) Financing the Development of Awqaf Property, Paper presented at the Seminar on Development of Awqaf organized by Islamic Research and Training Institute (IRTI), Kuala Lumpur.
Kahf, M. (1999) Financing the Development of Awqaf Property, The American Journal of Islamic Social Sciences, 16, 4, 39-66.
85
Kerlinger, F. N. (1973). Foundations of Behavioral Research(ed. ke 2). New York: Holt,Rhinehart, and Winston.
Kleijnen, M., Wetzels, M. and de Ruyter, K. (2004) Consumer Acceptance of Wireless Finance, Journal of Financial Services Marketing, 8, 3, 206-217.
Krejcie, V. R., and Morgan, W. D. (1970). Determining sample size for research.Educational and Psychological Measurement, 607-610.
Lean, O.K., Zailani, S., Ramayah, T. and Fernando, Y. (2009) Factors Influencing Intention to Use E-Government Among Citizens in Malaysia, International Journal of Information Management, 29, 458-475.
Lee, Y., Kozar, K.A., and Larsen, K.R.T. (2003). The Technology Acceptance Model: Past, Present and Future. Communication of the AIS, 12 (50), 752-80.
Luarn, P., and Lin, H.H. (2005). Toward an understanding of the behavioural intention to use mobile banking. Computers in Human Behaviour, 21, 873-891.
Malhotra, N. K. (2004). Marketing Research: An Applied Orientation (4th ed.). New Delhi: Pearson Prentice Hall.
Mannan, M. A. A. (1998). Cash Waqf: Enrichment of Family Heritage Generation to Generation (1st Edition), Social Investment Bank Press.
Masyita, D. and Febrian, E. (2004) The Role of BRI in the Indonesian Cash waqfHouse’s System, Working Papers in Business, Management and Finance, No. 200402.
Mathieson, K., Peacock, E., and Chin, W. W. (2001). Extending the Technology Acceptance Model: The Influence of Perceived User Resources. DATA BASE for Advances in Information Systems, 32(3), 86–112
Mazhar, N. (2006, May 21). Technology Acceptance Model. Retrieved November 30, 2008, from http://ezinearticles.com/?Technology-Acceptance-Model&id=202354.
McDaniel, S. W. and Burnett, J.J. (1990) Consumer Religiosity and Retail Store Evaluative Criteria, Journal of the Academy of Marketing Science, 18, 101-112.
Mohan. H., Ahmad. N., Quan. C. K., Chiam. T. Y., Jimmy. L. & Mat. N. K. N. (2013). Determinants of the Internet Banking Intention in Malaysia, American Journal of Economic, 3(3): 149-152.
Mohsin, M. I. A. (2008). Cash waqf: A new financial product model aspects of Shariah principles on its commercialization, Paper Presented at Islamic Banking, Accounting and Finance Conference (iBAF 2008), Organized by Faculty of

86
Economics and Muamalat, Universiti Sains Islam Malaysia at the Legend Hotel Kuala Lumpur, 28-29.
Mohammad, M.T.S. and Mar-Iman, A.H. (2006) Obstacles of the current concept of waqf to the development of waqf properties and the recommended alternative, Malaysian Journal of Real Estate, 1, 1, 27-38.
Mokhlis, S. (2009) Relevancy and Measurement of Religiosity in Consumer Behaviour Research, International Business Research, 2, 3, 75-84.
M-Sadeq, A. (2002) Waqf, Perpetual Charity and Poverty Alleviation, International Journal of Social Economics, 29, 1/2, 135-151.
Ndubisi, N.O. and Sinti, Q. (2006) Consumer Attitudes, System’s Characteristics and Internet Banking Acceptance in Malaysia, Management Research News, 29, 1/2, 16-27.
Nor. K. M., Shanab. E. A. A. and Pearson. J. M. (2008). Internet Banking Acceptance in Malaysia Based on the Theory at Reasoned Action, Journal of Information System and Technology Management, Vol. 5, No. 1, p. 03-14.
Pikkarainen, T., Pikkarainen, K, Karjaluoto, H. and Pahnila, S. (2004) Consumer Acceptance of Online Banking: An Extension of the Technology Acceptance Model, Internet Research, 14, 3, 224-235.
Philips, Lisa A., Calantone, Roger, & Lee, Tung, M. (1994). International Technology Adoption: Behavior Structure, Demand Certainty and Culture. Journal of Business & Industrial Marketing. Vol. 9 No.2 pp. 16-28.
Ramayah T, Jantan, M., Noor, M.N.M. and Ling, K.P. (2003) Receptiveness of Internet Banking by Malaysian Consumers, Asian Academy of Management Journal, 8, 2, 1- 29.
Ramayah, T. and Ignatius, J. (2005) Impact of Perceived Usefulness, Perceived Ease Of Use And Perceived Enjoyment On Intention To Shop Online, ICFAI Journal of Systems Management (IJSM), III, 3, 36-51.
Ramayah, T. and Mohd-Suki, N. (2006) Intention to Use Mobile PC among MBA Students: Implications For Technology Integration In The Learning Curriculum, UNITAR e- Journal, 1, 2, 1-10.
Ramayah, T., Rouibah, K., Gopi, M. and Rangel, G.J. (2009) A Decomposed Theory of Reasoned Action to Explain Intention to Use Internet Stock Trading Among Malaysian Investors, Computers in Human Behavior, 25, 6, 1222-1230.
Saduman, S. and Aysun, E.E. (2009). The Socio-Economic Role of Waqf System in the Muslim Ottoman Cities’ Formation and Evolution, TRAKIA Journal of Sciences, 7, 2, 272-275.

87
Sathye, M. (1999) Acceptance of Internet Banking by Australian Consumers: An Empirical Investigation, International Journal of Bank Marketing, 17, 7,324-334.
Sekaran, U. (2003). Research Method For Business: A Skill Building Approach (4th ed.). New York, NY: Wiley.
Sekaran, U. (2000). Research method for business: a skill-building approach (3th ed.). New York: Wiley and sons, inc.
Sripalawat, J., Thongmak, M. and Ngramyarn, A. (2011). M-Banking in MetropolitanBangkok and a Comparison with other Countries, The Journal of ComputerInformation System, 51. 3, pg. 67.
Sophonthummapharn, K. (2009). The Adoption of Techno-Relationship Innovations: A Framework for Electronic Customer Relationship Management, Marketing Intelligence and Planning, 27(3), pp. 380-412.
Toraman, Cengiz, Tuncsiper, Bedriye, Yilmaz, Sinan (2004), Cash Waqf in the Ottomans as Philanthropic Foundations and Their Accounting Practices. Anadolu University of Turkey.
Wan-Ahmad, W.M., Ab-Rahman, A., Ali, N.A. and Che-Seman, A. (2008) Religiosity And Banking Selection Criteria Among Malays In Lembah Klang, Journal of Shariah, 16, 2, 279-304.
Wang, Y.S., Wang, Y.M., Lin, H.H. and Tang, T.I. (2003) Determinants of User Acceptance of Internet Banking: An Empirical Study, International Journal of Service Industry Management, 14, 5, 501-519.
Wood, R. and Bandura, A. (1989). Impact of conceptions of ability on self-regulatory mechanisms and complex decision making, Journal of personality and social psychology, 56, pp. 407-415.
Worthington, E. L., Jr., Wade, N. G., Hight, T. L., Mccullough, M. E., Berry, J. T., Ripley, J. S., Berry, J. W., Schmitt, M. M., & Bursley, K. H. (2003). The Religious Commitment Inventory-10: Development Refinement And ValidationOf A Brief Scale For Research And Counseling, Journal of Counseling Psychology, 50(1), 84-96.
Yaacob, H., Petra, S., Sumardi, A. and Nahar, H. S. (2013). Demonstrating Accountability through Accounting and Reporting: Lessons from an Awqaf Institution Operating in a Non-Islamic South East Asia Country, Paper Proceeding of the 5th Islamic Economics System Conference. Faculty Economics and Muamalat, Universiti Sains Islam Malaysia.

88
Yayasan Wakaf Malaysia (2013). YWM Lancar Sistem Wakaf Tunai Malaysia, Buletin.
Zaki, A. L. A., Norzaidi, M. D. and Zuina, I. C. (2008). Pengurusan Harta Wakaf dan Potensinya Ke Arah Kemajuan Pendidikan Umat Islam Di Malaysia, Jurnal Pengurusan Jawhar.
Zikmund, W. G. (1994). Business Research Methods (4th ed.). Orlando: The Dryden Press.
http://maktabahsyamilah.com/

89
APPENDICESAPPENDIX A
Letter of Data CollectionAPPENDIX BQuestionnaire
APPENDIX CReliability Analysis
APPENDIX DNormality TestAPPENDIX EDescriptive Statistics
i. Profile of the Respondentsii. Mean and Standard Deviation of the Variables
APPENDIX FInferential Analysis
i. Independent Sample T-Testii. One-way ANOVA
iii. Pearson Correlationiv. Multiple Linear Regression

90
APPENDIX ALetter of Data Collection

91
APPENDIX BQuestionnaire

92
BAHAGIAN A: Latar Belakang
Sila tandakan (√) pilihan yang tepat mengenai latar belakang di kotak yang disediakan.
1. JantinaLelakiPerempuan
2. Taraf perkahwinanBujangBerkahwinJanda/Duda
3. Umur20 tahun dan ke bawah21-30 tahun31-40 tahun41-50 tahun 51 tahun dan ke atas
4. Tahap pendidikan tertinggi
SPMSTPM/Sijil/DiplomaIjazah Sarjana MudaIjazah SarjanaPhD
5. Jawatan di universiti
Ahli akademikBukan ahli akademik
6. Pendapatan bulanan
RM 900 dan ke bawahRM 1,000-RM 2,999RM 3,000-RM 5,999RM 6,000-RM 9,999RM 10,000 dan ke atas
7. Tempoh bekerjaKurang daripada 5 tahun6-10 tahun11-15 tahun

93
16-20 tahunLebih daripada 21 tahun
BAHAGIAN B: Faktor-faktor yang mempengaruhi penerimaan waqaf secara online
Kenyataan berikut menerangkan faktor-faktor yang mempengaruhi keputusan anda untuk menyumbang waqaf secara online di institusi perbankan Islam. Sila bulatkannombor-nombor pilihan terbaik bagi menunjukkan sejauhmanakah anda bersetuju atau tidak bersetuju dengan kenyataan di bawah.
1 2 3 4 5Sangat tidak setuju Tidak setuju Tidak pasti Setuju Sangat setuju
1Saya fikir dengan menggunakan waqaf secara online akan meningkatkan prestasi saya dalam menjalankan aktiviti-aktiviti kebajikan.
1 2 3 4 5
2Saya fikir penggunaan waqaf secara online akan memudahkan saya untuk menjalankan aktiviti-aktiviti kebajikan.
1 2 3 4 5
3Saya merasakan dengan menggunakan waqaf secara online adalah berguna dalam menjalankan aktiviti-aktiviti kebajikan.
1 2 3 4 5
4Saya merasakan dengan menggunakan waqaf secara online membolehkan saya untuk melakukan aktiviti kebajikan dengan lebih cepat.
1 2 3 4 5
5Saya merasakan dengan menggunakan waqaf secara online untuk aktiviti kebajikan dapat meningkatkan produktiviti saya.
1 2 3 4 5
6Saya fikir bahawa belajar menggunakan waqaf secara online adalah mudah bagi saya.
1 2 3 4 5
7Saya merasa mudah untuk melakukan apa yang saya mahu ketika menggunakan waqaf secara online.
1 2 3 4 5
8Saya fikir adalah lebih fleksibel untuk berinteraksi dengan waqafsecara online.
1 2 3 4 5
9Saya fikir bahawa menggunakan waqaf secara online adalah mudah dan senang.
1 2 3 4 5
10Saya fikir bahawa pembelajaran waqaf secara online adalah mudah difahami.
1 2 3 4 5
11Saya akan memberi sumbangan kewangan kepada institusi pertubuhan agama islam.
1 2 3 4 5
12Kepercayaan terhadap agama islam mempengaruhi semua urusan hidup saya.
1 2 3 4 5
13Saya sering membaca buku-buku dan majalah-majalah mengenai agama Islam.
1 2 3 4 5
14 Saya seronok menghabiskan masa dalam memahami agama Islam. 1 2 3 4 515 Agama islam merupakan panduan hidup saya. 1 2 3 4 516 Saya mempunyai kebolehan untuk melakukan transaksi secara 1 2 3 4 5

94
BAHAGIAN C: CADANGAN DAN PANDANGAN TERHADAP WAQAF SECARA ONLINE DI INSTITUSI PERBANKAN ISLAM
____________________________________________________________________________________________________________________________________________________________________________________________________________________________________________________________________________________________
TERIMA KASIH DI ATAS KERJASAMA YANG DIBERIKAN
online tanpa memerlukan sebarang bantuan dari orang lain.
17Saya mempunyai kebolehan untuk melakukan transaksi secara online jika saya mempunyai buku panduan.
1 2 3 4 5
18Saya mempunyai kebolehan untuk melakukan transaksi jika saya pernah menggunakan sistem online yang sama.
1 2 3 4 5
19Saya mempunyai kebolehan untuk melakukan transaksi sekiranya saya pernah melihat orang lain menggunakan perkhidmatan waqaf secara online.
1 2 3 4 5
20Saya mempunyai kebolehan untuk melakukan transaksi secara online jika seseorang memberi panduan kepada saya buat kali pertama.
1 2 3 4 5
21 Saya sering menerima maklumat mengenai waqaf secara online. 1 2 3 4 5
22Saya sering menerima maklumat yang cukup tentang waqaf secara online.
1 2 3 4 5
23Saya telah menerima maklumat mengenai faedah-faedah menggunakan waqaf secara online.
1 2 3 4 5
24Saya telah menerima maklumat tentang menggunakan waqaf secara online daripada sumber-sumber media.
1 2 3 4 5
25 Saya mendapat maklumat yang cukup tentang waqaf secara online. 1 2 3 4 526 Saya bercadang untuk menggunakan waqaf secara online. 1 2 3 4 5
27Saya bercadang untuk menggunakan waqaf secara online sebaik mungkin.
1 2 3 4 5
28Saya akan menggunakan waqaf secara online pada masa akan datang.
1 2 3 4 5
29Saya akan menggunakan waqaf secara online dengan lebih kerap pada bulan Ramadhan.
1 2 3 4 5
30Secara keseluruhan, saya akan menggunakan waqaf secara online untuk aktiviti kebajikan saya.
1 2 3 4 5

95
APPENDIX CReliability Analysis
96
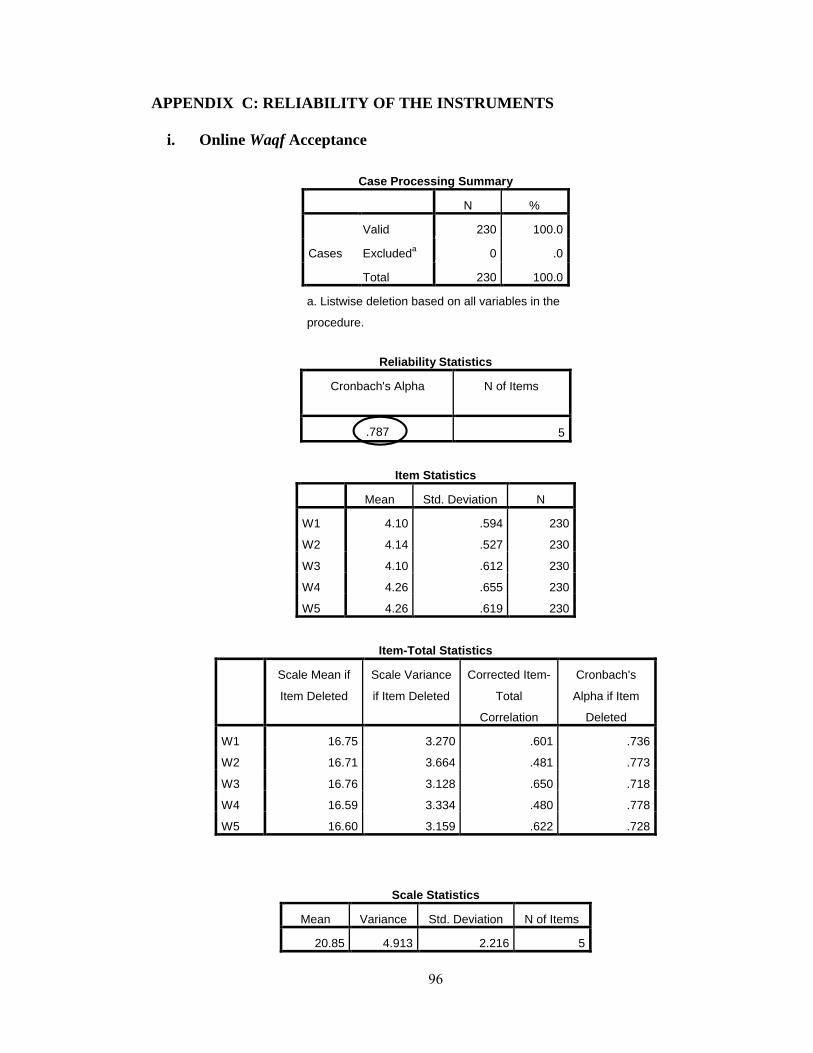
APPENDIX C: RELIABILITY OF THE INSTRUMENTS
i. Online Waqf Acceptance
Case Processing Summary
N %
Cases
Valid 230 100.0
Excludeda 0 .0
Total 230 100.0
a. Listwise deletion based on all variables in the
procedure.
Reliability Statistics
Cronbach's Alpha N of Items
.787 5
Item Statistics
Mean Std. Deviation N
W1 4.10 .594 230
W2 4.14 .527 230
W3 4.10 .612 230
W4 4.26 .655 230
W5 4.26 .619 230
Item-Total Statistics
Scale Mean if
Item Deleted
Scale Variance
if Item Deleted
Corrected Item-
Total
Correlation
Cronbach's
Alpha if Item
Deleted
W1 16.75 3.270 .601 .736
W2 16.71 3.664 .481 .773
W3 16.76 3.128 .650 .718
W4 16.59 3.334 .480 .778
W5 16.60 3.159 .622 .728
Scale Statistics
Mean Variance Std. Deviation N of Items
20.85 4.913 2.216 5

97
ii. Perceived Usefulness
Case Processing Summary
N %
Cases
Valid 230 100.0
Excludeda 0 .0
Total 230 100.0
a. Listwise deletion based on all variables in the
procedure.
Reliability Statistics
Cronbach's Alpha N of Items
.721 5
Item Statistics
Mean Std. Deviation N
PU1 4.10 .657 230
PU2 4.20 .611 230
PU3 4.19 .625 230
PU4 4.26 .554 230
PU5 4.11 .688 230
Item-Total Statistics
Scale Mean if
Item Deleted
Scale Variance
if Item Deleted
Corrected Item-
Total
Correlation
Cronbach's
Alpha if Item
Deleted
PU1 16.77 2.879 .609 .618
PU2 16.66 3.422 .386 .709
PU3 16.67 3.225 .468 .678
PU4 16.60 3.576 .374 .711
PU5 16.76 2.875 .566 .637
Scale Statistics
Mean Variance Std. Deviation N of Items
20.87 4.667 2.160 5

98
iii. Perceived Ease of Use
Case Processing Summary
N %
Cases
Valid 230 100.0
Excludeda 0 .0
Total 230 100.0
a. Listwise deletion based on all variables in the
procedure.
Reliability Statistics
Cronbach's Alpha N of Items
.856 5
Item Statistics
Mean Std. Deviation N
PEOU1 4.01 .647 230
PEOU2 4.00 .680 230
PEOU3 4.00 .661 230
PEOU4 4.02 .667 230
PEOU5 3.85 .673 230
Item-Total Statistics
Scale Mean if
Item Deleted
Scale Variance
if Item Deleted
Corrected Item-
Total
Correlation
Cronbach's
Alpha if Item
Deleted
PEOU1 15.87 4.728 .671 .827
PEOU2 15.87 4.565 .691 .821
PEOU3 15.87 4.635 .691 .821
PEOU4 15.86 4.691 .658 .830
PEOU5 16.03 4.707 .643 .834
Scale Statistics
Mean Variance Std. Deviation N of Items
19.87 7.036 2.653 5
99
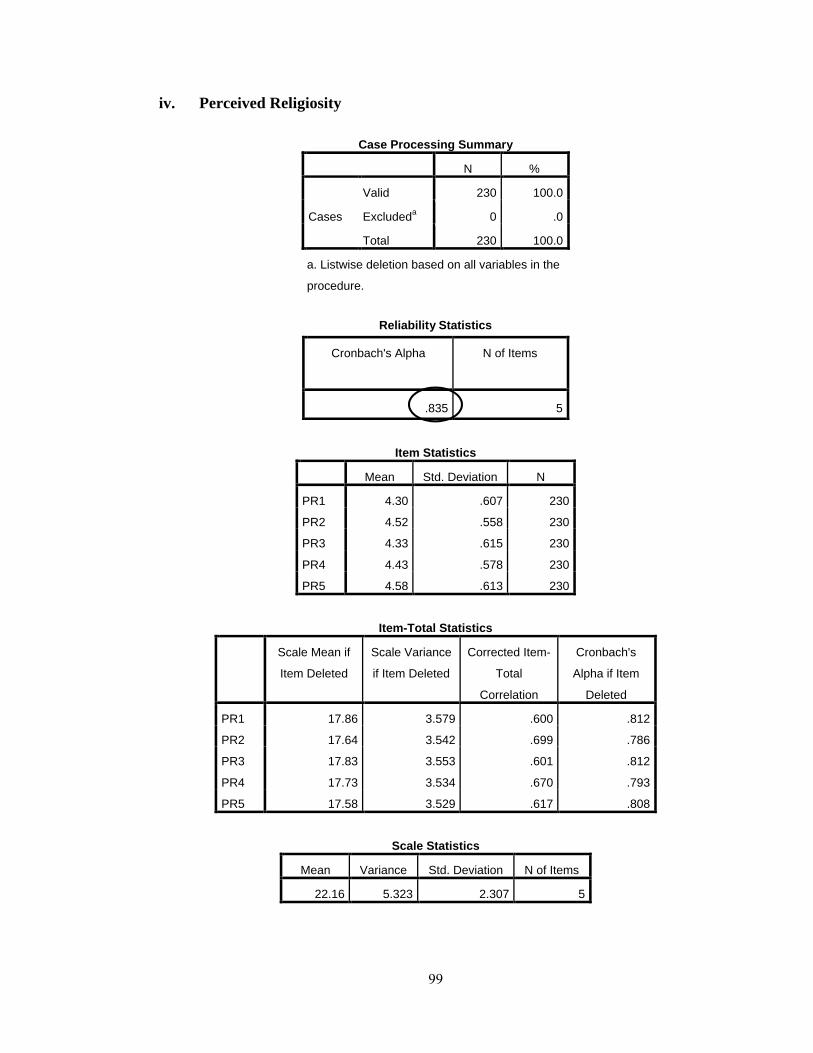
iv. Perceived Religiosity
Case Processing Summary
N %
Cases
Valid 230 100.0
Excludeda 0 .0
Total 230 100.0
a. Listwise deletion based on all variables in the
procedure.
Reliability Statistics
Cronbach's Alpha N of Items
.835 5
Item Statistics
Mean Std. Deviation N
PR1 4.30 .607 230
PR2 4.52 .558 230
PR3 4.33 .615 230
PR4 4.43 .578 230
PR5 4.58 .613 230
Item-Total Statistics
Scale Mean if
Item Deleted
Scale Variance
if Item Deleted
Corrected Item-
Total
Correlation
Cronbach's
Alpha if Item
Deleted
PR1 17.86 3.579 .600 .812
PR2 17.64 3.542 .699 .786
PR3 17.83 3.553 .601 .812
PR4 17.73 3.534 .670 .793
PR5 17.58 3.529 .617 .808
Scale Statistics
Mean Variance Std. Deviation N of Items
22.16 5.323 2.307 5

100
v. Perceived Self-efficacy
Case Processing Summary
N %
Cases
Valid 230 100.0
Excludeda 0 .0
Total 230 100.0
a. Listwise deletion based on all variables in the
procedure.
Reliability Statistics
Cronbach's Alpha N of Items
.865 5
Item Statistics
Mean Std. Deviation N
PE1 3.88 .707 230
PE2 3.86 .679 230
PE3 3.94 .665 230
PE4 3.91 .696 230
PE5 3.87 .718 230
Item-Total Statistics
Scale Mean if
Item Deleted
Scale Variance
if Item Deleted
Corrected Item-
Total
Correlation
Cronbach's
Alpha if Item
Deleted
PE1 15.58 5.651 .491 .884
PE2 15.60 5.141 .715 .829
PE3 15.52 5.142 .737 .825
PE4 15.55 4.816 .819 .802
PE5 15.59 5.064 .688 .836
Scale Statistics
Mean Variance Std. Deviation N of Items
19.46 7.804 2.794 5

101
vi. Amount of Information
Case Processing Summary
N %
Cases
Valid 230 100.0
Excludeda 0 .0
Total 230 100.0
a. Listwise deletion based on all variables in the
procedure.
Reliability Statistics
Cronbach's Alpha N of Items
.939 5
Item Statistics
Mean Std. Deviation N
AOI1 2.55 .955 230
AOI2 2.50 .956 230
AOI3 2.49 1.005 230
AOI4 2.50 .966 230
AOI5 2.47 .956 230
Item-Total Statistics
Scale Mean if
Item Deleted
Scale Variance
if Item Deleted
Corrected Item-
Total
Correlation
Cronbach's
Alpha if Item
Deleted
AOI1 9.95 12.526 .797 .932
AOI2 10.01 12.306 .836 .925
AOI3 10.01 11.882 .856 .921
AOI4 10.00 12.231 .839 .924
AOI5 10.04 12.221 .852 .922
Scale Statistics
Mean Variance Std. Deviation N of Items
12.50 18.827 4.339 5

102
APPENDIX DNormality Test

103
APPENDIX D: NORMALITY OF THE DATA
i. Online Waqf Acceptance
Case Processing Summary
Cases
Valid Missing Total
N Percent N Percent N Percent
meanW 226 98.3% 4 1.7% 230 100.0%
Descriptives
Statistic Std. Error
meanW
Mean 4.1912 .02784
95% Confidence Interval for Mean
Lower Bound 4.1363
Upper Bound 4.2460
5% Trimmed Mean 4.1902
Median 4.2000
Variance .175
Std. Deviation .41858
Minimum 3.40
Maximum 5.00
Range 1.60
Interquartile Range .40
Skewness -.079 .162Kurtosis -.637 .322
Tests of Normality
Kolmogorov-Smirnova Shapiro-Wilk
Statistic df Sig. Statistic df Sig.
meanW .151 226 .000 .954 226 .000
a. Lilliefors Significance Correction

104

105

106
ii. Perceived Usefulness
Case Processing Summary
Cases
Valid Missing Total
N Percent N Percent N Percent
meanPU 230 100.0% 0 0.0% 230 100.0%
Descriptives
Statistic Std. Error
meanPU
Mean 4.1730 .02849
95% Confidence Interval for
Mean
Lower Bound 4.1169
Upper Bound 4.2292
5% Trimmed Mean 4.1739
Median 4.2000
Variance .187
Std. Deviation .43208
Minimum 3.00
Maximum 5.00
Range 2.00
Interquartile Range .40
Skewness -.155 .160
Kurtosis -.373 .320
Tests of Normality
Kolmogorov-Smirnova Shapiro-Wilk
Statistic df Sig. Statistic df Sig.
meanPU .148 230 .000 .961 230 .000
a. Lilliefors Significance Correction

107

108

109
iii. Perceived Ease of Use
Case Processing Summary
Cases
Valid Missing Total
N Percent N Percent N Percent
meanPEOU 230 100.0% 0 0.0% 230 100.0%
Descriptives
Statistic Std. Error
meanPEOU
Mean 3.9748 .03498
95% Confidence Interval for
Mean
Lower Bound 3.9059
Upper Bound 4.0437
5% Trimmed Mean 3.9725
Median 4.0000
Variance .281
Std. Deviation .53053
Minimum 3.00
Maximum 5.00
Range 2.00
Interquartile Range .80
Skewness -.282 .160
Kurtosis -.433 .320
Tests of Normality
Kolmogorov-Smirnova Shapiro-Wilk
Statistic df Sig. Statistic df Sig.
meanPEOU .193 230 .000 .939 230 .000
a. Lilliefors Significance Correction

110

111

112
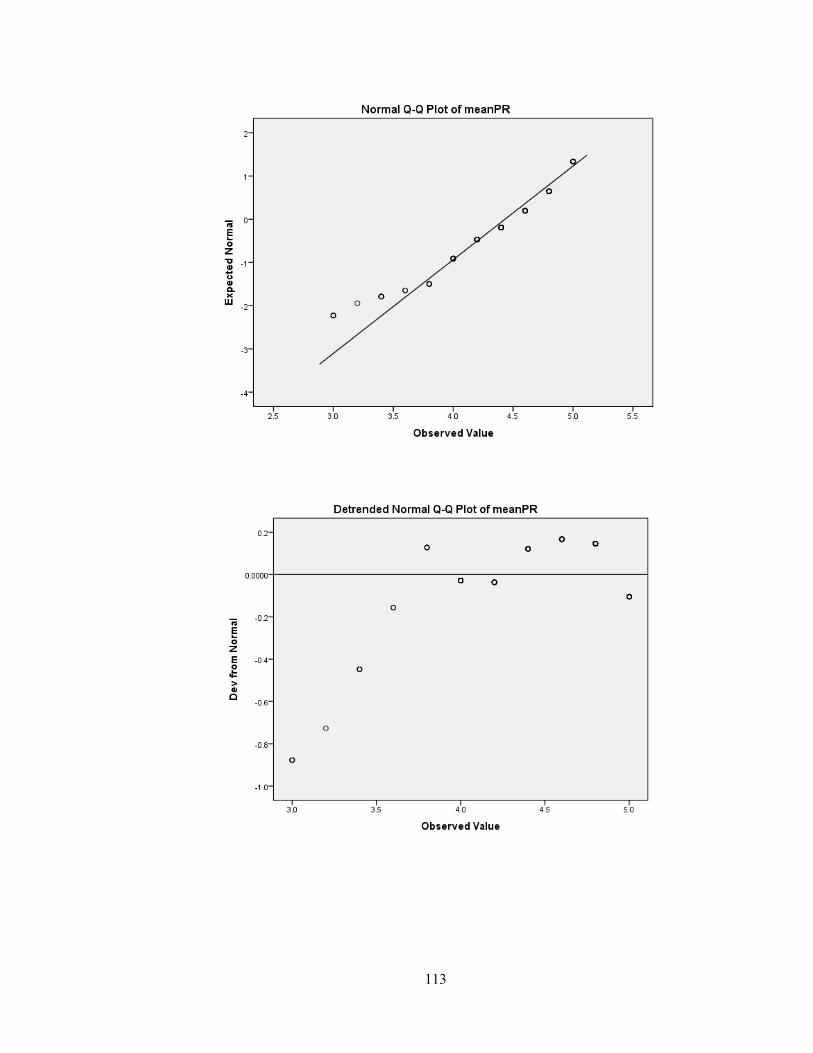
iv. Perceived Religiosity
Case Processing Summary
Cases
Valid Missing Total
N Percent N Percent N Percent
meanPR 230 100.0% 0 0.0% 230 100.0%
Descriptives
Statistic Std. Error
meanPR
Mean 4.4322 .03043
95% Confidence Interval for
Mean
Lower Bound 4.3722
Upper Bound 4.4921
5% Trimmed Mean 4.4671
Median 4.6000
Variance .213
Std. Deviation .46145
Minimum 3.00
Maximum 5.00
Range 2.00
Interquartile Range .80
Skewness -.814 .160
Kurtosis .563 .320
Tests of Normality
Kolmogorov-Smirnova Shapiro-Wilk
Statistic df Sig. Statistic df Sig.
meanPR .151 230 .000 .907 230 .000
a. Lilliefors Significance Correction
113

114

115
v. Perceived Self-Efficacy
Case Processing Summary
Cases
Valid Missing Total
N Percent N Percent N Percent
meanPE 230 100.0% 0 0.0% 230 100.0%
Descriptives
Statistic Std. Error
meanPE
Mean 3.8913 .03684
95% Confidence Interval for
Mean
Lower Bound 3.8187
Upper Bound 3.9639
5% Trimmed Mean 3.8923
Median 4.0000
Variance .312
Std. Deviation .55870
Minimum 2.40
Maximum 5.00
Range 2.60
Interquartile Range .60
Skewness -.272 .160
Kurtosis -.089 .320
Tests of Normality
Kolmogorov-Smirnova Shapiro-Wilk
Statistic df Sig. Statistic df Sig.
meanPE .195 230 .000 .947 230 .000
a. Lilliefors Significance Correction

116

117

118
vi. Amount of Information
Case Processing Summary
Cases
Valid Missing Total
N Percent N Percent N Percent
meanAOI 230 100.0% 0 0.0% 230 100.0%
Descriptives
Statistic Std. Error
meanAOI
Mean 2.5009 .05722
95% Confidence Interval for
Mean
Lower Bound 2.3881
Upper Bound 2.6136
5% Trimmed Mean 2.4942
Median 2.4000
Variance .753
Std. Deviation .86781
Minimum 1.00
Maximum 4.40
Range 3.40
Interquartile Range 1.00
Skewness .280 .160
Kurtosis -.704 .320
Tests of Normality
Kolmogorov-Smirnova Shapiro-Wilk
Statistic df Sig. Statistic df Sig.
meanAOI .135 230 .000 .955 230 .000
a. Lilliefors Significance Correction

119

120
121
APPENDIX EDescriptive Statistics
i. Profile of the Respondentsii. Mean and Standard Deviation of the Variables

122
APPENDIX E: DESCRIPTIVE STATISTICS
i. Profile of the Respondents
Statistics
gender maritul
status
age highest
education
level
position in
university
monthly
income
working
period
NValid 230 230 230 230 230 230 230
Missing 0 0 0 0 0 0 0
Mean 1.61 1.83 3.28 3.40 1.40 2.89 2.72
Std. Error of Mean .032 .029 .064 .097 .032 .066 .090
Median 2.00 2.00 3.00 4.00 1.00 3.00 3.00
Mode 2 2 4 5 1 2 2
Std. Deviation .489 .444 .964 1.465 .491 .996 1.367
Variance .239 .197 .929 2.145 .241 .992 1.870
Skewness -.448 -.772 .116 -.449 .411 .363 .338
Std. Error of Skewness .160 .160 .160 .160 .160 .160 .160
Kurtosis -1.815 .781 -1.017 -1.205 -1.847 -.754 -1.075
Std. Error of Kurtosis .320 .320 .320 .320 .320 .320 .320
Range 1 2 3 4 1 4 4
Minimum 1 1 2 1 1 1 1
Maximum 2 3 5 5 2 5 5
Sum 370 420 755 782 322 664 626
Frequency Table
gender
Frequency Percent Valid Percent Cumulative
Percent
Valid
male 90 39.1 39.1 39.1
female 140 60.9 60.9 100.0
Total 230 100.0 100.0

123
maritul status
Frequency Percent Valid Percent Cumulative
Percent
Valid
single 46 20.0 20.0 20.0
married 178 77.4 77.4 97.4
divorce 6 2.6 2.6 100.0
Total 230 100.0 100.0
age
Frequency Percent Valid Percent Cumulative
Percent
Valid
21-30 years 59 25.7 25.7 25.7
31-40 years 71 30.9 30.9 56.5
41-50 years 76 33.0 33.0 89.6
51 years and above 24 10.4 10.4 100.0
Total 230 100.0 100.0
highest education level
Frequency Percent Valid Percent Cumulative
Percent
Valid
SPM 39 17.0 17.0 17.0
STPM/sijil/diploma 30 13.0 13.0 30.0
degree 32 13.9 13.9 43.9
master 58 25.2 25.2 69.1
PhD 71 30.9 30.9 100.0
Total 230 100.0 100.0
position in university
Frequency Percent Valid Percent Cumulative
Percent
Valid
academician 138 60.0 60.0 60.0
non academician 92 40.0 40.0 100.0
Total 230 100.0 100.0

124
monthly income
Frequency Percent Valid Percent Cumulative
Percent
Valid
RM 900 and below 8 3.5 3.5 3.5
RM 1,000-RM 2,999 91 39.6 39.6 43.0
RM 3,000-RM 5,999 63 27.4 27.4 70.4
RM 6,000-RM 9,999 55 23.9 23.9 94.3
RM 10,000 and above 13 5.7 5.7 100.0
Total 230 100.0 100.0
working period
Frequency Percent Valid Percent Cumulative
Percent
Valid
below 5 years 53 23.0 23.0 23.0
6-10 years 60 26.1 26.1 49.1
11-15 years 51 22.2 22.2 71.3
16-20 years 30 13.0 13.0 84.3
more than 21 years 36 15.7 15.7 100.0
Total 230 100.0 100.0

125
ii. Mean and Standard Deviation of the Variables
Statistics
meanW meanPU meanPEOU meanPR meanPE meanAOI
NValid 226 230 230 230 230 230
Missing 4 0 0 0 0 0
Mean 4.1912 4.1730 3.9748 4.4322 3.8913 2.5009
Median 4.2000 4.2000 4.0000 4.6000 4.0000 2.4000

126
APPENDIX FInferential Analysis
i. Independent Sample T-Testii. One-way ANOVA
iii. Pearson Correlationiv. Multiple Linear Regression

127
APPENDIX F: INFERENTIAL ANALYSISi. INDEPENDENT SAMPLE T-TEST
a. Gender Toward Online Waqf Acceptance
Group Statistics
gender N Mean Std. Deviation Std. Error Mean
meanWmale 90 4.2067 .40274 .04245
female 136 4.1809 .42990 .03686
Independent Samples Test
Levene's
Test for
Equality of
Variances
t-test for Equality of Means
F Sig. t df Sig.
(2-
tailed)
Mean
Difference
Std. Error
Difference
95%
Confidence
Interval of the
Difference
Lower Upper
meanW
Equal
variances
assumed
.533
.466
.453
224 .651 .02578 .05698-
.08650.13807
Equal
variances
not
assumed
.459199.1
66
.647
.02578 .05622-
.08509.13666

128
b. Position in University Toward Online Waqf Acceptance
Group Statistics
position in university N Mean Std. Deviation Std. Error Mean
meanWacademician 136 4.2059 .42370 .03633
non academician 90 4.1689 .41208 .04344
Independent Samples Test
Levene's Test
for Equality of
Variances
t-test for Equality of Means
F Sig. t df Sig.
(2-tailed)
Mean
Difference
Std. Error
Difference
95% Confidence
Interval of the
Difference
Lower Upper
meanW
Equal
variances
assumed
.018
.893 .650
224 .517 .03699 .05695 -.07523 .14922
Equal
variances
not
assumed
.653 194.373
.514
.03699 .05663 -.07469 .14868

129
ii. ONE-WAY ANOVAc. Age Toward Online Waqf Acceptance
Descriptives
meanW
N Mean Std.
Deviation
Std.
Error
95% Confidence
Interval for Mean
Minimum Maximum
Lower
Bound
Upper
Bound
21-30 years 56 4.1964 .42382 .05664 4.0829 4.3099 3.40 4.60
31-40 years 71 4.2930 .41381 .04911 4.1950 4.3909 3.40 5.00
41-50 years 75 4.1013 .41508 .04793 4.0058 4.1968 3.40 5.00
51 years and above 24 4.1583 .38664 .07892 3.9951 4.3216 3.40 5.00
Total 226 4.1912 .41858 .02784 4.1363 4.2460 3.40 5.00
Test of Homogeneity of Variances
meanW
Levene Statistic df1 df2 Sig.
.507 3 222 .678
ANOVA
meanW
Sum of Squares df Mean Square F Sig.
Between Groups 1.368 3 .456 2.661 .049
Within Groups 38.054 222 .171
Total 39.422 225

130
Multiple Comparisons
Dependent Variable: meanW
Tukey HSD
(I) age (J) age Mean
Difference
(I-J)
Std.
Error
Sig. 95% Confidence
Interval
Lower
Bound
Upper
Bound
21-30 years
31-40 years -.09653 .07399 .561 -.2881 .0950
41-50 years .09510 .07312 .564 -.0942 .2844
51 years and above .03810 .10101 .982 -.2234 .2996
31-40 years
21-30 years .09653 .07399 .561 -.0950 .2881
41-50 years .19162* .06856 .029 .0142 .3691
51 years and above .13462 .09776 .515 -.1184 .3877
41-50 years
21-30 years -.09510 .07312 .564 -.2844 .0942
31-40 years -.19162* .06856 .029 -.3691 -.0142
51 years and above -.05700 .09710 .936 -.3083 .1943
51 years and above
21-30 years -.03810 .10101 .982 -.2996 .2234
31-40 years -.13462 .09776 .515 -.3877 .1184
41-50 years .05700 .09710 .936 -.1943 .3083
*. The mean difference is significant at the 0.05 level.

131
d. Highest Education Levels Toward Online Waqf Acceptance
Descriptives
meanW
N Mean Std.
Deviation
Std.
Error
95% Confidence
Interval for Mean
Minimum Maximum
Lower
Bound
Upper
Bound
SPM 39 4.2359 .35503 .05685 4.1208 4.3510 3.60 5.00
STPM/sijil/diploma 29 4.2345 .44423 .08249 4.0655 4.4035 3.40 5.00
degree 32 4.0562 .44355 .07841 3.8963 4.2162 3.40 4.80
master 56 4.2643 .42829 .05723 4.1496 4.3790 3.40 5.00
PhD 70 4.1514 .41345 .04942 4.0528 4.2500 3.40 5.00
Total 226 4.1912 .41858 .02784 4.1363 4.2460 3.40 5.00
Test of Homogeneity of Variances
meanW
Levene Statistic df1 df2 Sig.
.823 4 221 .512
ANOVA
meanW
Sum of Squares df Mean Square F Sig.
Between Groups 1.125 4 .281 1.623 .169
Within Groups 38.297 221 .173
Total 39.422 225

132
Multiple Comparisons
Dependent Variable: meanW
Tukey HSD
(I) highest
education
level
(J) highest
education
level
Mean
Difference
(I-J)
Std.
Error
Sig. 95% Confidence Interval
Lower
Bound
Upper
Bound
SPM
STPM/sijil/diploma .00141 .10207 1.000 -.2793 .2822
degree .17965 .09929 .371 -.0934 .4527
master -.02839 .08682 .998 -.2672 .2104
PhD .08447 .08318 .848 -.1443 .3133
STPM/sijil/diploma
SPM -.00141 .10207 1.000 -.2822 .2793
degree .17823 .10673 .455 -.1153 .4718
master -.02980 .09524 .998 -.2917 .2321
PhD .08305 .09193 .895 -.1698 .3359
degree
SPM -.17965 .09929 .371 -.4527 .0934
STPM/sijil/diploma -.17823 .10673 .455 -.4718 .1153
master -.20804 .09225 .164 -.4618 .0457
PhD -.09518 .08883 .821 -.3395 .1491
master
SPM .02839 .08682 .998 -.2104 .2672
STPM/sijil/diploma .02980 .09524 .998 -.2321 .2917
degree .20804 .09225 .164 -.0457 .4618
PhD .11286 .07463 .556 -.0924 .3181
PhD
SPM -.08447 .08318 .848 -.3133 .1443
STPM/sijil/diploma -.08305 .09193 .895 -.3359 .1698
degree .09518 .08883 .821 -.1491 .3395
master -.11286 .07463 .556 -.3181 .0924

133
e. Monthly Income Toward Online Waqf Acceptance
Descriptives
meanW
N Mean Std.
Deviation
Std.
Error
95% Confidence
Interval for Mean
Minimum Maximum
Lower
Bound
Upper
Bound
RM 900 and below 8 4.2000 .33806 .11952 3.9174 4.4826 3.80 4.60
RM 1,000-RM 2,999 88 4.2114 .41618 .04436 4.1232 4.2995 3.40 5.00
RM 3,000-RM 5,999 63 4.2317 .45182 .05692 4.1180 4.3455 3.40 5.00
RM 6,000-RM 9,999 55 4.1527 .40545 .05467 4.0431 4.2623 3.40 5.00
RM 10,000 and above 12 4.0000 .35162 .10150 3.7766 4.2234 3.40 4.40
Total 226 4.1912 .41858 .02784 4.1363 4.2460 3.40 5.00
Test of Homogeneity of Variances
meanW
Levene Statistic df1 df2 Sig.
.878 4 221 .478
ANOVA
meanW
Sum of Squares df Mean Square F Sig.
Between Groups .660 4 .165 .941 .441
Within Groups 38.762 221 .175
Total 39.422 225

134
Multiple Comparisons
Dependent Variable: meanW
Tukey HSD
(I) monthly
income
(J) monthly
income
Mean
Difference
(I-J)
Std.
Error
Sig. 95% Confidence
Interval
Lower
Bound
Upper
Bound
RM 900 and below
RM 1,000-RM 2,999 -.01136 .15465 1.000 -.4367 .4140
RM 3,000-RM 5,999 -.03175 .15719 1.000 -.4641 .4006
RM 6,000-RM 9,999 .04727 .15847 .998 -.3886 .4831
RM 10,000 and above .20000 .19116 .833 -.3258 .7258
RM 1,000-RM 2,999
RM 900 and below .01136 .15465 1.000 -.4140 .4367
RM 3,000-RM 5,999 -.02038 .06912 .998 -.2105 .1697
RM 6,000-RM 9,999 .05864 .07199 .926 -.1394 .2566
RM 10,000 and above .21136 .12888 .473 -.1431 .5658
RM 3,000-RM 5,999
RM 900 and below .03175 .15719 1.000 -.4006 .4641
RM 1,000-RM 2,999 .02038 .06912 .998 -.1697 .2105
RM 6,000-RM 9,999 .07902 .07729 .845 -.1335 .2916
RM 10,000 and above .23175 .13191 .402 -.1311 .5946
RM 6,000-RM 9,999
RM 900 and below -.04727 .15847 .998 -.4831 .3886
RM 1,000-RM 2,999 -.05864 .07199 .926 -.2566 .1394
RM 3,000-RM 5,999 -.07902 .07729 .845 -.2916 .1335
RM 10,000 and above .15273 .13344 .783 -.2143 .5197
RM 10,000 and above
RM 900 and below -.20000 .19116 .833 -.7258 .3258
RM 1,000-RM 2,999 -.21136 .12888 .473 -.5658 .1431
RM 3,000-RM 5,999 -.23175 .13191 .402 -.5946 .1311
RM 6,000-RM 9,999 -.15273 .13344 .783 -.5197 .2143

135
f. Working Period Toward Online Waqf Acceptance
Descriptives
meanW
N Mean Std.
Deviation
Std.
Error
95% Confidence
Interval for Mean
Minimum Maximum
Lower
Bound
Upper
Bound
below 5 years 52 4.1923 .45841 .06357 4.0647 4.3199 3.40 5.00
6-10 years 58 4.1793 .40469 .05314 4.0729 4.2857 3.40 5.00
11-15 years 50 4.3040 .40049 .05664 4.1902 4.4178 3.40 5.00
16-20 years 30 4.0667 .39769 .07261 3.9182 4.2152 3.40 5.00
more than 21 years 36 4.1556 .40599 .06766 4.0182 4.2929 3.40 5.00
Total 226 4.1912 .41858 .02784 4.1363 4.2460 3.40 5.00
Test of Homogeneity of Variances
meanW
Levene Statistic df1 df2 Sig.
1.243 4 221 .294
ANOVA
meanW
Sum of Squares df Mean Square F Sig.
Between Groups 1.155 4 .289 1.668 .158
Within Groups 38.267 221 .173
Total 39.422 225

136
Multiple Comparisons
Dependent Variable: meanW
Tukey HSD
(I) working
period
(J) working
period
Mean
Difference
(I-J)
Std.
Error
Sig. 95% Confidence
Interval
Lower
Bound
Upper
Bound
below 5 years
6-10 years .01300 .07947 1.000 -.2056 .2316
11-15 years -.11169 .08242 .657 -.3384 .1150
16-20 years .12564 .09540 .681 -.1368 .3880
more than 21 years .03675 .09022 .994 -.2114 .2849
6-10 years
below 5 years -.01300 .07947 1.000 -.2316 .2056
11-15 years -.12469 .08030 .529 -.3456 .0962
16-20 years .11264 .09358 .749 -.1447 .3700
more than 21 years .02375 .08829 .999 -.2191 .2666
11-15 years
below 5 years .11169 .08242 .657 -.1150 .3384
6-10 years .12469 .08030 .529 -.0962 .3456
16-20 years .23733 .09610 .101 -.0270 .5016
more than 21 years .14844 .09096 .479 -.1017 .3986
16-20 years
below 5 years -.12564 .09540 .681 -.3880 .1368
6-10 years -.11264 .09358 .749 -.3700 .1447
11-15 years -.23733 .09610 .101 -.5016 .0270
more than 21 years -.08889 .10287 .910 -.3718 .1940
more than 21
years
below 5 years -.03675 .09022 .994 -.2849 .2114
6-10 years -.02375 .08829 .999 -.2666 .2191
11-15 years -.14844 .09096 .479 -.3986 .1017
16-20 years .08889 .10287 .910 -.1940 .3718

137
iii. PEARSON CORRELATION
Correlations
Mean
W
Mean
PU
Mean
PEOU
Mean
PR
Mean
PE
Mean
AOI
meanW
Pearson Correlation 1 .328** .237** .179** .132* -.120
Sig. (2-tailed) .000 .000 .007 .048 .071
N 226 226 226 226 226 226
meanPU
Pearson Correlation .328** 1 .229** .149* .192** -.035
Sig. (2-tailed) .000 .000 .024 .003 .596
N 226 230 230 230 230 230
meanPEOU
Pearson Correlation .237** .229** 1 .388** .443** .074
Sig. (2-tailed) .000 .000 .000 .000 .265
N 226 230 230 230 230 230
meanPR
Pearson Correlation .179** .149* .388** 1 .290** -.033
Sig. (2-tailed) .007 .024 .000 .000 .619
N 226 230 230 230 230 230
meanPE
Pearson Correlation .132* .192** .443** .290** 1 .022
Sig. (2-tailed) .048 .003 .000 .000 .740
N 226 230 230 230 230 230
meanAOI
Pearson Correlation -.120 -.035 .074 -.033 .022 1
Sig. (2-tailed) .071 .596 .265 .619 .740
N 226 230 230 230 230 230
**. Correlation is significant at the 0.01 level (2-tailed).
*. Correlation is significant at the 0.05 level (2-tailed).

138
iv. MULTIPLE LINEAR REGRESSION
FACTORS INFLUENCING THE ACCEPTANCE OF ONLINE WAQF
Descriptive Statistics
Mean Std. Deviation N
meanW 4.1912 .41858 226
meanPU 4.1805 .42664 226
meanPEOU 3.9832 .52415 226
meanPR 4.4398 .45334 226
meanPE 3.8876 .55644 226
meanAOI 2.5018 .86579 226
Correlations
Mean
W
Mean
PU
Mean
PEOU
Mean
PR
Mean
PE
Mean
AOI
Pearson Correlation
meanW 1.000 .328 .237 .179 .132 -.120
meanPU .328 1.000 .200 .124 .186 -.024
meanPEOU .237 .200 1.000 .393 .455 .085
meanPR .179 .124 .393 1.000 .281 -.028
meanPE .132 .186 .455 .281 1.000 .028
meanAOI -.120 -.024 .085 -.028 .028 1.000
Sig. (1-tailed)
meanW . .000 .000 .004 .024 .036
meanPU .000 . .001 .032 .002 .360
meanPEOU .000 .001 . .000 .000 .102
meanPR .004 .032 .000 . .000 .340
meanPE .024 .002 .000 .000 . .338
meanAOI .036 .360 .102 .340 .338 .
N
meanW 226 226 226 226 226 226
meanPU 226 226 226 226 226 226
meanPEOU 226 226 226 226 226 226
meanPR 226 226 226 226 226 226
meanPE 226 226 226 226 226 226
meanAOI 226 226 226 226 226 226
Variables Entered/Removeda

139
Model Variables
Entered
Variables
Removed
Method
1
meanAOI,
meanPU,
meanPR,
meanPE,
meanPEOUb
. Enter
a. Dependent Variable: meanW
b. All requested variables entered.
Model Summaryb
Model R R Square Adjusted
R Square
Std.
Error of
The
Estimate
Change Statistics
R Square
Change
F
Change
df1 df2 Sig.
F Change
1 .400a .160 .141 .38805 .160 8.359 5 220 .000
a. Predictors: (Constant), meanAOI, meanPU, meanPR, meanPE, meanPEOU
b. Dependent Variable: meanW
ANOVAa
Model Sum of Squares df Mean Square F Sig.
1
Regression 6.294 5 1.259 8.359 .000b
Residual 33.129 220 .151
Total 39.422 225
a. Dependent Variable: meanW
b. Predictors: (Constant), meanAOI, meanPU, meanPR, meanPE, meanPEOU

140
Coefficientsa
Model Unstandardized
Coefficients
Standardized
Coefficients
t Sig. Collinearity
Statistics
B Std.
Error
Beta Tolerance VIF
1
(Constant) 2.367 .360 6.580 .000
meanPU .279 .062 .284 4.474 .000 .946 1.057
meanPEOU .133 .059 .166 2.252 .025 .700 1.428
meanPR .073 .063 .080 1.171 .243 .828 1.208
meanPE -.012 .053 -.016 -.227 .821 .772 1.295
meanAOI -.060 .030 -.125 -2.006 .046 .987 1.013
a. Dependent Variable: meanW
Collinearity Diagnosticsa
Model Dimension Eigenvalue Condition
Index
Variance Proportions
(Constant) Mean
PU
Mean
PEOU
Mean
PR
Mean
PE
Mean
AOI
1
1 5.871 1.000 .00 .00 .00 .00 .00 .00
2 .092 7.970 .00 .00 .00 .00 .01 .96
3 .014 20.310 .04 .18 .07 .02 .55 .00
4 .010 23.932 .00 .16 .50 .11 .40 .00
5 .008 27.110 .01 .25 .42 .50 .04 .00
6 .004 39.773 .94 .40 .01 .37 .01 .04
a. Dependent Variable: meanW

141
Residuals Statisticsa
Minimum Maximum Mean Std. Deviation N
Predicted Value 3.7396 4.6129 4.1912 .16725 226
Std. Predicted Value -2.700 2.522 .000 1.000 226
Standard Error of Predicted
Value.030 .119 .061 .017 226
Adjusted Predicted Value 3.7044 4.5969 4.1900 .16713 226
Residual -.92213 .99759 .00000 .38372 226
Std. Residual -2.376 2.571 .000 .989 226
Stud. Residual -2.393 2.600 .001 1.002 226
Deleted Residual -.93521 1.02023 .00116 .39384 226
Stud. Deleted Residual -2.419 2.635 .001 1.006 226
Mahal. Distance .326 20.063 4.978 3.503 226
Cook's Distance .000 .040 .004 .007 226
Centered Leverage Value .001 .089 .022 .016 226
a. Dependent Variable: meanW

142
CHARTS

143

144
SCATTER PLOT GRAPH:
i. Perceived Usefulness with Online Waqf Acceptance
ii. Perceived Ease of Use with Online Waqf Acceptance

145
iii. Perceived Religiosity with Online Waqf Acceptance
iv. Perceived Self-Efficacy with Online Waqf Acceptance

146
v. Amount Of Information with Online Waqf Acceptance


