Download - THDA SINGLE FAMILY LOAN PROGRAM REPORT

THDA SINGLE FAMILY LOAN PROGRAM REPORT
Fiscal Year 2015
Tennessee Housing Development Agency Andrew Jackson Building 502 Deaderick St., Third Floor Nashville, TN 37243
Hulya Arik, Ph.D. THDA Economist
RESEARCH AND PLANNING DIVISION
September 2015

TABLE OF CONTENTS
Fiscal Year Overview ......................................................................................................................1 THDA Loan Program Highlights for FY 2015 ................................................................................2 Marketing Great Choice across the State .........................................................................................3 Property Characteristics ...................................................................................................................6 Homebuyer Characteristics ............................................................................................................10 Loan Characteristics.......................................................................................................................13 Geographic Distribution.................................................................................................................15
TABLES AND FIGURES
Figure 1 Number of Loans Funded by Month, Fiscal Years 2014 and 2015 ...............................3 Figure 2 Interest Rates, THDA and Nation, January 1, 2000-June 30, 2015 ...............................5 Figure 3 Interest Rates, THDA and Nation, and THDA Loans Funded, Fiscal Year 2015 .........5 Figure 4 Average Purchase Price of THDA Loans Funded, 2008-June 30, 2015 .......................7 Figure 5 Median Purchase Price of New and Existing Homes, by MSA, Fiscal Year 2015 .......8 Figure 6 Median Price of Existing Homes, Major MSAs, THDA (FY 2015) and Market
(Q2_2015) ......................................................................................................................9 Figure 7 Annual Median Price Change of Existing Homes, THDA and Market .......................10 Figure 8 Average Income of THDA Borrowers by Program, 2008-2015 ..................................11 Figure 9 Average Credit Scores, by Program, Fiscal Year 2015 ...............................................13 Figure 10 Distribution of THDA Loans by Insurer, FY06 through FY15 ...................................14 Figure 11 Percent of FHA Loans in Total Loan Portfolio, THDA, U.S. and Tennessee .............15 Table 1 THDA Loans by Program and Year, 2010-2015 .........................................................17 Table 2 Property Characteristics—Fiscal Year 2015 .......................................................... 18-19 Table 3 Homebuyer Characteristics—Fiscal Year 2015..................................................... 20-21 Table 4 Loan Characteristics—Fiscal Year 2015 .....................................................................22 Table 5a Geographic Distribution of Loans (Number and Percent) by Program, Fiscal Year 2015 ..........................................................................................................23 Table 5b Geographic Distribution of Loan Dollars by Program, Fiscal Year 2015 ...................24 Table 6 Loans (Number and Percent) by Program and County—Fiscal Year 2015........... 25-27 Table 7 Dollar Amount of Loan by Program and County—Fiscal Year 2015 ................... 28-30 Table 8 Selected Characteristics by County—Fiscal Year 2015 ........................................ 31-33

1
Fiscal Year Overview
During fiscal year 2015, Tennessee Housing Development Agency (THDA) funded 2,028 first loans,
totaling approximately $240 million. THDA also funded an additional 1,849 second loans for borrowers
using the Great Choice Plus Program. The total value of the second loans that were funded in fiscal year
2015 was $9.1 million. The number of first loans funded in fiscal year 2015 increased by 5.2 percent
compared to the previous fiscal year.
THDA homeownership programs generally serve first-time homebuyers (those who have not
owned their principal residence within the last three years), but serve all eligible homebuyers who are
buying in federally targeted areas1 and who are veterans2.
Until October 1, 2013, THDA offered four homeownership programs: Great Rate (GR), Great
Advantage (GA), Great Start (GS) and New Start (NS). Starting in October 2013, THDA discontinued
offering Great Rate, Great Start and Great Advantage program loans and introduced the Great Choice
and Great Choice Plus loan programs. The Great Choice Program loan offers a 30-year, fixed-rate loan
to qualified first-time and repeat homebuyers. The Great Choice Plus loan is a second loan offering
down payment and closing cost assistance at no interest in conjunction with a Great Choice loan. The
second loan amount is equal to four percent of the sales price of the home and is deferred for 15 years
and forgiven after that. An eight-hour homebuyer education class is required for the Great Choice Plus
Program loan. This education requirement is the same as what was in place for the Great Advantage,
Great Start and New Start programs. In addition to the Great Choice program, THDA continued helping
very low-income families with the New Start Program that has a zero percent interest rate3and delivered
through non-profit partners and are designed to promote the construction of new houses.
1 A Targeted Area is a qualified census tract or an area of chronic economic distress as designated by the IRS. A Targeted Area may be an entire county or a particular census tract within a county. In fiscal year 2015, two THDA borrowers were not first-time homebuyers and purchased a home in a targeted area. 2 Starting February 28, 2007, THDA implemented the veteran exemption. With that exemption, veterans and their spouses do not have to meet the three year requirement (i.e. be a first-time homebuyer) to be eligible for THDA’s loan programs. The definition of “veteran” is found at 38 U.S.C. and, generally, includes anyone (a) who has served in the military and has been released under conditions other than dishonorable or (b) who has re-enlisted, but could have been discharged or released under conditions other than dishonorable. A current, active member of the military in the first tour of duty is not eligible for this exemption. In fiscal year 2015, there were no THDA borrowers who took advantage of veteran exemption. 3 Effective January 23, 2006, the New Start Program became a two-tiered program. Tier I is still a zero percent loan program for very low income (60 percent or less of the state median income) people. Tier II allows the borrower to have a slightly higher income (70 percent of the state median income) than Tier I, and in exchange the borrower pays a low fixed interest rate (half of the interest rate on the Great choice program). In fiscal year 2015, eight of the New Start loans were Tier II.

2
In April 2011, THDA approved a special interest rate discount for active duty service members
and National Guard, veterans discharged under conditions other than dishonorable, reservists with at
least 180 days of active duty service, spouses of service members and qualified veterans as well as
surviving spouses of service members and qualified veterans. Service members can apply for the
“Homeownership for the Brave” discount, which is a ½-percent interest rate reduction on the loan
choices (Great Rate, Great Advantage, Great Start, Great Choice and Great Choice Plus). The first-time
homeownership requirement is waived for those veterans. In fiscal year 2015, there were 60 THDA
borrowers who took advantage of this rate reduction. Of those 60 loans, 24 were Great Choice and 36
were Great Choice Plus program loans. These loans are included in corresponding program totals for the
analysis.
In the following sections, the property, borrower and loan characteristics are discussed in more
detail. Second loans of the Great Choice Plus borrowers are not included in the discussion of property
and borrower characteristics because the borrower and the property are the same for both the first and
second loans. All differences discussed are statistically significant at a 95 percent confidence level or
better unless otherwise stated.
THDA Homeownership Program Highlights for Fiscal Year 2015
From July 1, 2014 until June 30, 2015, a total of 2,210 prospective homebuyers applied for
THDA loans. This is in comparison to 2,076 loan applications during the previous fiscal year, an
increase of 6.5 percent. During fiscal year 2015, 2,140 THDA borrowers paid off their loans. There were
23,922 active4 loans at the end of fiscal year 2015 (June 30, 2015).
During fiscal year 2015, THDA funded 2,028 first loans (see Table 1), a 5.2 percent increase
from 1,927 loans funded in fiscal year 2014. The total value of the first loans funded in fiscal year 2015
was $239,995,354. The dollar value of the loans increased by 5.5 percent compared to the previous
fiscal year. THDA also funded 1,849 second loans for the Great Choice Plus borrowers who needed
downpayment and closing costs assistance. The total value of those second loans was $9,059,477. The
number and dollar value of the second loans are not included in the comparisons for the rest of this
report.
4 An active loan is a first loan that is funded, but not paid off or foreclosed at the time of this report. Second loans are not included in the active loan count.

3
The total number of New Start Program loans funded increased from 86 in fiscal year 2014 to 92
in fiscal year 2015. In fiscal year 2015, of all the loans funded, 1,849 (91 percent) of the borrowers
required a second loan for the downpayment and closing costs. This shows that THDA downpayment
and closing costs assistance program continued to fill a niche in the existing home buying market in
Tennessee.
The number of loans funded during the fiscal year fluctuated by month and in comparison to the
same month last year. Figure 1 compares the number of THDA loans funded in fiscal years 2014 and
2015 by the funding month. There was a substantial increase in loan production in September and
October 2013 (fiscal year 2014) after the announcement that THDA was switching to the Great Choice
Program, and, with the new program, borrowers who needed assistance with their downpayment and
closing costs would need to take a zero interest second loan rather than a grant, which was offered with
discontinued Great Advantage and Great Start Programs. Some borrowers who did not want to borrow
the downpayment and closing costs as a second loan (Great Choice Plus) expedited their loan
applications to ensure that they received Great Start loans with up to four percent downpayment and
closing costs assistance as a grant. Therefore, in the first half of fiscal year 2015, especially in
September and October 2014, THDA’s loan production was lower than the same months previous year.
Figure 1: Number of Loans Funded by Month, Fiscal Years 2014 and 2015
Marketing Great Choice across the State
In May 2014 (fiscal year 2014), THDA launched GreatChoiceTN.com- a consumer-focused website
highlighting THDA’s loan program, and for the first time, THDA invested in a direct-to-consumer
0
50
100
150
200
250
300
July
Augu
st
Sept
embe
r
Oct
ober
Nov
embe
r
Dece
mbe
r
Janu
ary
Febr
uary
Mar
ch
April
May
June
FY_2014 FY_2015

4
marketing campaign to promote the loan program to homebuyers across Tennessee. THDA’s 2014 Great
Choice campaign started in May 2014 with online advertising on Google and Facebook. These online
ads ran through July 2014. THDA also started statewide radio advertising between May and July 2014,
and statewide television advertising in June and July 2014. Television and radio advertising was
supported with newspaper advertising in June and July and Billboards in June in all of the priority
counties.
In 2015, between late February and July 2015, the Great Choice campaign continued with
commercials on Google, Facebook and Zillow. In March and April 2015, television and radio
commercials focused in East and West Tennessee, while continued on the online streaming service
Hulu. Between March and July newspaper ads were running in all of the priority county5 newspapers.
THDA focused on the East and West Tennessee for the television and radio advertisement because more
than half of THDA’s mortgage business comes from the Middle Tennessee. Most recently THDA placed
four Great Choice ads in the Memphis Business Journal. The first ad ran on June 26, 2015. This series
focuses on homeownership as a new development and economic growth driver in Memphis.
All these efforts for promoting the loan program paid off, and THDA’s loan production in fiscal
year 2015 increased. For example, in March 2015, the number of loans funded increased by 53 percent
compared to February 2015, and it was 51 percent higher than the number of loans funded in March
2014.
The difference between the market interest rate and the interest rate THDA charges on loans is
another factor that affects the demand for THDA loans. In the early 2000s, THDA’s interest rates were
relatively lower than national average. However, starting in 2009, this interest rate edge enjoyed by
THDA borrowers vanished with the declining mortgage interest rates mostly resulting from the Federal
Reserve Bank’s expansionary monetary policies aimed at solving the financial crisis of 2008. The
following figure shows the average monthly interest rate for THDA loans and the national average
interest rate for all lenders on conventional 30-year fixed mortgages by month. The national average
interest rates are from Monthly Interest Rates Surveys (MIRS) provided by the Federal Housing Finance
Agency (FHFA). The average interest rate on THDA loans does not include the interest rate discounts
for eligible service members and veterans (Homeownership for the Brave) or the New Start Program
loans with zero percent interest rate. Especially in 2012 and the first half of 2013, THDA’s average
5 The priority counties were the counties, which had 100 or more home purchase between January 1, 2012 and September 30, 2012 (purchase prices of those homes were at or below THDA’s purchase price limits) and had less than 10 THDA loans made between January 2013 and September 30, 2013.

5
interest rates stayed above national average rates. During the first half of fiscal year 2015, THDA
borrowers enjoyed relatively lower interest rates than the market borrowers using the conventional
mortgage products. However, the interest rate spread changed against THDA starting February 2015.
Figure 2: Interest Rates, THDA and Nation, January 1, 2000-June 30, 2015
In Figure 3, the number of loans funded by month (for fiscal year 2015) is added to the
mortgage interest rates. After a dip in the number of loans funded in February 2015, THDA’s loan
production steadily increased even though the THDA’s average interest rates were higher than the
national average interest rates.
Figure 3: Interest Rates, THDA and Nation, and THDA Loans Funded, Fiscal Year 2015
0.00%
1.00%
2.00%
3.00%
4.00%
5.00%
6.00%
7.00%
8.00%
9.00%
2000
-120
00-7
2001
-120
01-7
2002
-120
02-7
2003
-120
03-7
2004
-120
04-7
2005
-120
05-7
2006
-120
06-7
2007
-120
07-7
2008
-120
08-7
2009
-120
09-7
2010
-120
10-7
2011
-120
11-7
2012
-120
12-7
2013
-120
13-7
2014
-120
14-7
2015
-1
Nation THDA
0
50
100
150
200
250
300
3.60%
3.70%
3.80%
3.90%
4.00%
4.10%
4.20%
4.30%
4.40%N
umbe
r of T
HDA
Loan
s Fun
ded
Aver
age
Mon
thly
Inte
rest
Rat
e
THDA Nation Loans Funded

6
Potential THDA borrowers might be more attracted to THDA loan products for the factors other than the
interest rate spread. Downpayment and closing costs assistance and how that assistance is provided are
possible factors. For example, effective October 1, 2014 (in the first half of fiscal year 2015), THDA
changed the structure of the Great Choice Plus second loan from an amortizing 10-year second mortgage
with a payment to a 15-year deferred/forgivable second loan without a payment. After the seasonal decline
in the housing markets corresponding the winter months passed, THDA’s loan production reacted to the
changes in the program structure regarding the downpayment and closing costs assistance. In February
2015, the number of THDA loans funded was 29 percent lower than the number of loans funded in January
2015, but it was still 57 percent higher than THDA’s loan production in February 2014 (fiscal year 2014).
In March 2015, THDA’s loan production increased by 53 percent compared to February 2015.
Property Characteristics (see Table 2)
Approximately 12 percent of all homes purchased were new in fiscal year 2015. Fifty-five
percent of all new homes purchased in the state were purchased by the borrowers in the Nashville MSA.
Among the counties, Davidson County borrowers purchased the highest percentage of new homes in the
state, followed by Rutherford County. Twenty-eight percent of new homes purchased by THDA
borrowers were in Davidson County and 15 percent were in Rutherford County.
In fiscal year 2015, the average purchase price for all properties insignificantly declined from
$122,619 to $122,277. The average purchase prices in the current fiscal year were higher than the
previous fiscal year for loans in the Great Choice Plus and New Start Programs, but relatively lower than
the previous fiscal year in the Great Choice Program. Since 2010, borrowers who used the loan
programs that offered downpayment and closing costs assistance (either in the form of a grant or second
mortgage) purchased homes more expensive than borrowers who did not require downpayment and
closing costs assistance.

7
Figure 4: Average Purchase Price of THDA Loans Funded, 2008-June 30, 2015
Figure 4 displays the average purchase prices THDA borrowers paid in different loan programs since
2008. Great Advantage borrowers purchased, on average, more expensive homes almost in every year.
2014 saw consistency with that trend when, on average, Great Choice Plus program borrowers’ homes
were 14 percent more expensive than the homes purchased by the Great Choice Program borrowers who
did not require a second loan for downpayment and closing costs.
The purchase prices of THDA borrowers’ homes also varied depending on whether the home
purchased was new or existing. On average, new homes were 18 percent more expensive than existing
homes purchased. Median purchase prices of new and existing homes also varied by the MSA in which
the purchased home was located. The median prices for existing and new homes purchased in Tennessee
MSAs by THDA borrowers are given in Figure 5.
$90,000
$100,000
$110,000
$120,000
$130,000
$140,000
$150,000
2008 2009 2010 2011 2012 2013 2014 2015
Great Rate Great AdvantageGreat Start Great Choice

8
Figure 5: Median Purchase Price of New and Existing Homes, by MSA, Fiscal Year 2015
In fiscal year 2015, a median priced new home purchased by a THDA borrower in the Cleveland MSA
was only two percent more expensive than an existing home purchased in the same MSA. Median
purchase prices of new and existing homes varied most in the Jackson MSA. On average, a THDA
borrower who purchased a new home in the Jackson MSA paid 54 percent more than a THDA borrower
who purchased an existing home. Only in the Memphis MSA was the median price of new homes less
than the median price of existing homes.
In fiscal year 2015, the median price of an existing home purchased with a THDA loan in the
Nashville MSA was $130,000. At the end of the second quarter of 2015, the median priced existing
home was $208,500 for all homebuyers in the Nashville MSA (not just THDA borrowers). Figure 6
shows the difference between the median prices of existing homes that THDA borrowers purchased
versus all homebuyers purchased in the major Tennessee MSAs.6 In all metropolitan areas included in
the report, the median prices of existing homes purchased in the overall market were higher than the
median prices THDA borrowers paid. Only in the Nashville MSA was the median price of existing
homes purchased higher than the median price of existing homes in the state.
6 The data for the existing homes median prices are from the National Association of Realtors (NAR) quarterly Metropolitan Median Area Prices and Affordability report for the second quarter of 2015.
$0$15,000$30,000$45,000$60,000$75,000$90,000
$105,000$120,000$135,000$150,000$165,000
New Existing

9
Figure 6: Median Price of Existing Homes, Major MSAs, THDA (FY 2015) and Market (Q2_2015)
Figure 7 shows the annual price change for the existing homes purchased by THDA borrowers and all
existing homes purchased in the market. According to the figure, in the Nashville and Memphis MSAs,
median prices of existing homes purchased by THDA borrowers in fiscal year 2015 were higher than the
median prices in fiscal year 2014. In contrast, the median price of existing homes declined from the
fiscal year 2014 levels in the Knoxville MSA. THDA borrowers who purchased existing homes in the
Memphis MSA in fiscal year 2015 paid 4.5 percent more than the THDA existing home borrowers paid
in fiscal year 2014. Meanwhile, the overall Memphis MSA existing home market median price in the
second quarter of 2015 increased by eight percent compared to the median price in the second quarter of
2014. The median existing single-family home price in the Knoxville MSA increased by five percent,
while FY 2015 THDA borrowers paid two percent less than THDA borrowers who purchased existing
homes in fiscal year 2014. In the Chattanooga MSA, the median price, which THDA borrowers paid for
existing homes was not different than the median price in the previous fiscal year, while the median
price of all existing homes sold in the MSA increased by eight percent in the second quarter of 2015
compared to the second quarter of 2014. Homebuyers purchasing existing homes in the Nashville MSA
experienced the highest annual price appreciation in the second quarter of 2015.
$0
$20,000
$40,000
$60,000
$80,000
$100,000
$120,000
$140,000
$160,000
$180,000
Nashville Chattanooga Knoxville Memphis
Market_Q2_2015 THDA_FY2015 THDA-State Median

10
Figure 7: Annual Median Price Change of Existing Homes, THDA and Market
Across all programs, an average home purchased was 1,449 square feet and was 29 years old (built in
1986). The average size and the average year built of all homes purchased did not change substantially
compared to the previous fiscal year, and there were only slight differences among programs.
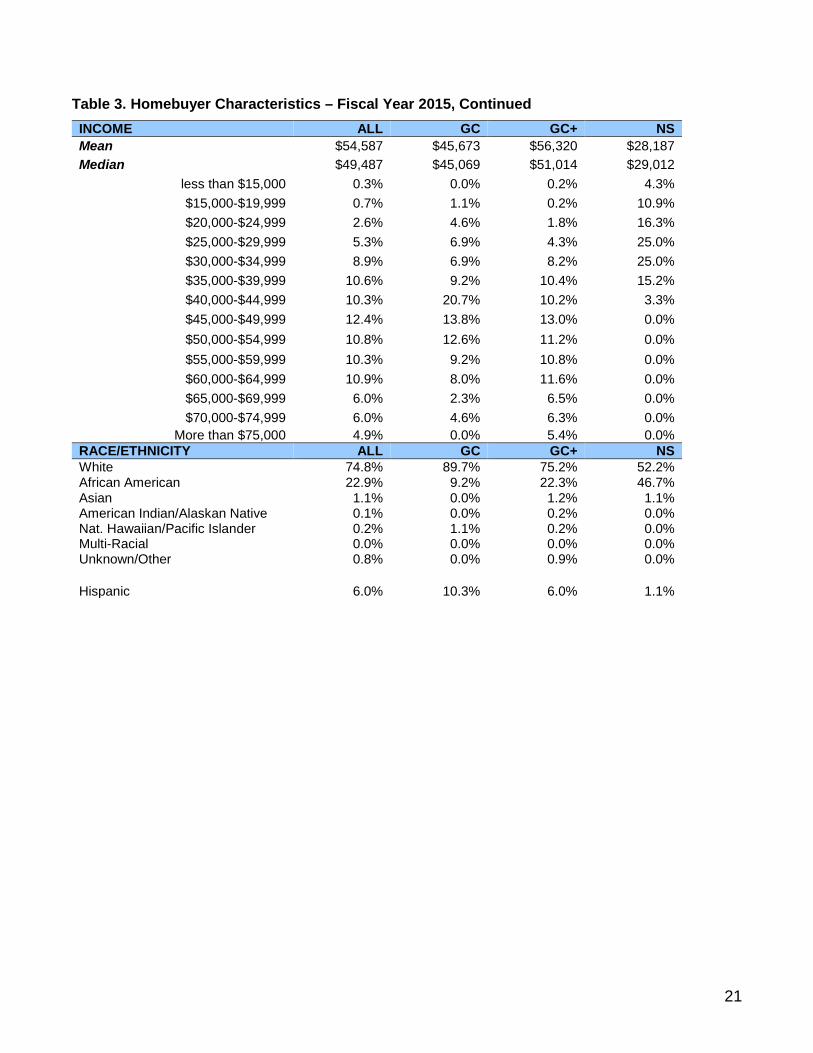
Homebuyer Characteristics (see Table 3)
The borrowers’ average annual income for all programs was $54,587, approximately eight percent
higher than the average income of borrowers in fiscal year 2014. Borrowers in all programs had average
income higher than the previous year. For example, an average borrower who used a Great Choice
Program loan in fiscal year 2015 had two percent higher income than an average Great Choice Program
borrower in fiscal year 2014. An average Great Choice Plus Program borrower in fiscal year 2015 had
23 percent more income than an average Great Choice Program borrower in fiscal year 2014. The
average incomes of THDA borrowers who used different loan programs between 2008 and 2015 are
displayed at Figure 8.
-4.0%
-2.0%
0.0%
2.0%
4.0%
6.0%
8.0%
10.0%
12.0%
14.0%
Nashville Chattanooga Knoxville Memphis
THDA Market

11
Figure 8: Average Income of THDA Borrowers by Program, 2008-2015
According to Figure 8, between 2008 and 2010, THDA borrowers who used different loan products7 had
relatively comparable average incomes. However, after 2010, this situation changed as the average
income of borrowers using the loan programs that offered downpayment and closing costs assistance
increased relative to the borrowers who did not require downpayment and closing costs assistance. For
example, in 2011, an average Great Advantage Program borrower’s income was 17 percent more than
an average Great Start Program borrower’s. Similarly, in the same year, a Great Start Program borrower
had, on average, 11 percent higher income than a Great Rate Program borrower. This phenomenon
continued when the Great Choice and Great Choice Plus Programs replaced the Great Rate, Great
Advantage and Great Start Programs. In 2014, borrowers in the Great Choice Plus Program had, on
average, 17 percent more annual income.
For all THDA loans, the average age of the borrower was not significantly different than last
year. The average age of the borrowers in all THDA programs in fiscal year 2015 was 35, and 56
percent of the borrowers in all programs were male. Approximately 58 percent of all THDA borrowers
were 33 years old and younger (Millennial or Generation Y). According to the NAR 2015 Homebuyer
and Seller Generational Trends Report, in the overall U.S. market (not just Tennessee or THDA), 32
percent of home buyers were 33 years and younger. This shows that THDA is participating in this
market trend and served relatively younger individuals who were purchasing their first home.
7 New Start Program borrowers are not included in this chart because the New Start Program is designed to create homeownership opportunities for very low income families.
$0
$10,000
$20,000
$30,000
$40,000
$50,000
$60,000
2008 2009 2010 2011 2012 2013 2014 2015
Great Rate Great Choice Great AdvantageGreat Start Great Choice Plus

12
Seventy-five percent of borrowers in all programs were white, and 23 percent were African
American. More New Start Program borrowers (47 percent) were African American compared to the
borrowers in other programs. The number of Hispanic borrowers increased compared to last year. In all
programs, six percent of all borrowers were of Hispanic origin in fiscal year 2015.
Almost 100 percent of THDA borrowers were first-time homebuyers. Compared to the previous
fiscal year the number of borrowers who purchased homes in targeted areas (including fully targeted
counties and targeted census tracts) increased in fiscal year 2015. Approximately 13 percent of all
THDA loans were for homes in targeted areas. Even though the first-time homeownership requirement
is waived for the borrowers who buy a home in a targeted area, only two of the borrowers who bought a
home in a targeted area were not first-time homebuyers. Recently, with the help of THDA’s CONNECT
Team, THDA is creating awareness that repeat homebuyers can also benefit from the THDA loan
products. Across Tennessee, in 58 fully targeted counties and in certain targeted census tracts in 14 other
counties, potential homebuyers do not have to be a first-time homebuyer to be eligible for a THDA
loan.8
Lenders were the primary source of information to borrowers regarding THDA loans. Almost 58
percent of THDA’s borrowers learned about THDA programs from their lenders.
The average credit score for the borrowers in all programs was 679. Figure 9 shows the average
credit scores of the borrowers in various loan programs. The borrowers in different Great Choice
programs had similar average credit scores. Borrowers in the New Start Program were exceptions with a
648 credit score, on average. However, the New Start Program is designed to promote the construction
of new homes for low and very low income Tennesseans, and delivered through non-profit organizations
(the “New Start Program Partner” or “Program Partner”) with established programs for the construction
of single family housing for low and very low income households. The New Start Program Partner is
responsible for selecting the homebuyer, determining eligibility, constructing the home, providing
homebuyer education, originating and servicing the New Start Loan. Credit underwriting standards,
which borrowers have to meet are determined by the Program Partner, and borrowers may not be
required to have credit scores of at least 620 like the borrowers in other THDA programs.
8 The interactive map showing the targeted areas where the borrowers do not have to be first-time homebuyers can be found on www.thda.org or at https://www.arcgis.com/home/webmap/viewer.html?webmap=a372468765f34ed1b0511ba2c62386bb&extent=-88.4534,34.7908,-84.3967,36.7076

13
Figure 9: Average Credit Scores, by Program, Fiscal Year 2015
Loan Characteristics (see Table 4)
Of all borrowers, 97 percent had a down payment, including the borrowers who used THDA’s
downpayment and closing costs assistance and those who brought their own down payment to the
closing table. The borrowers whose loans are insured by Veterans Administration (VA) and Rural
Development (RD) and borrowers who purchase HUD repo homes are not required to have a
downpayment. On average, the downpayment was 4.9 percent of the purchase price. In fiscal year 2015,
the average payment for principal, interest, property tax and insurance (PITI) decreased to $726 from
$747 in fiscal year 2014. On average, PITI as a percent of income stayed the same at 18.3 percent. For
3.2 percent of THDA borrowers in fiscal year 2015, monthly housing payments exceeded 30 percent of
their income. The number of borrowers paying less than 20 percent of their income for PITI increased to
63 percent in 2015.
In fiscal year 2015, the share of FHA-insured loans in THDA’s loan portfolio increased to 92
percent from 89 percent in fiscal year 2014. Figure 10 shows the distribution of THDA loans by the
insurer.
050
100150200250300350400450500550600650700
Great Choice Great Choice Plus New Start ALL LOANS

14
Figure 10: Distribution of THDA Loans by Insurer, FY06 through FY15
Historically, FHA-insured loans comprised a large portion of THDA’s loan portfolio. In fiscal years
2007 and 2008, when Private Mortgage Insurance (PMI) companies started insuring THDA loans, the
share of conventionally insured loans increased. In fiscal year 2008, the share of conventionally insured
loans was even higher than the share of FHA insured loans for the first time since fiscal year 2002. With
the financial crisis, many of the PMI companies lost their credit ratings to be eligible to insure THDA
loans. The lack of private insurance led to the decline of conventionally insured loans in THDA loan
production again in 2007 and 2008. After the declining shares of FHA-insured loans, starting in fiscal
year 2009, THDA is making more FHA-insured loans compared to the conventionally insured loans. For
the last several years, consistently, around 90 percent of all THDA loans funded in the fiscal year were
FHA-insured.
Figure 11 provides the percent of FHA-insured loans in total outstanding loan portfolio quarterly
from the first quarter of 2007 until the second quarter of 2015.9 The figure compares the THDA loan
portfolio to the national and Tennessee market. The data for Tennessee and the nation are from the
quarterly delinquency surveys from Mortgage Bankers Association (MBA). Percent of FHA-insured
loans in total outstanding THDA loans were much higher than the nation and Tennessee. The percentage
declined when THDA started making more conventional loans in 2007 and 2008, but it went back up
again as THDA made mostly FHA-insured loans since 2009.
9 For the THDA portfolio, we did not have the second quarter 2015 data. Therefore the percent of FHA-insured loans in total outstanding THDA loan portfolio is as of the first quarter of 2015.
0.00%
20.00%
40.00%
60.00%
80.00%
100.00%
FY06 FY07 FY08 FY09 FY10 FY11 FY12 FY13 FY14 FY15
Distribution of Loans by Loan Type, FY06-FY15
Conventionally Insured Conventionally Uninsured FHA RD VA

15
Figure 11: Percent of FHA Loans in Total Loan Portfolio, THDA, U.S. and Tennessee
According to Figure 11, while 17 percent of all loans nationwide and 24 percent of all loans in
Tennessee were FHA-insured loans, more than 78 percent of THDA’s total outstanding loan portfolio
consisted of FHA-insured loans. This is the highest level since the beginning of 2006.
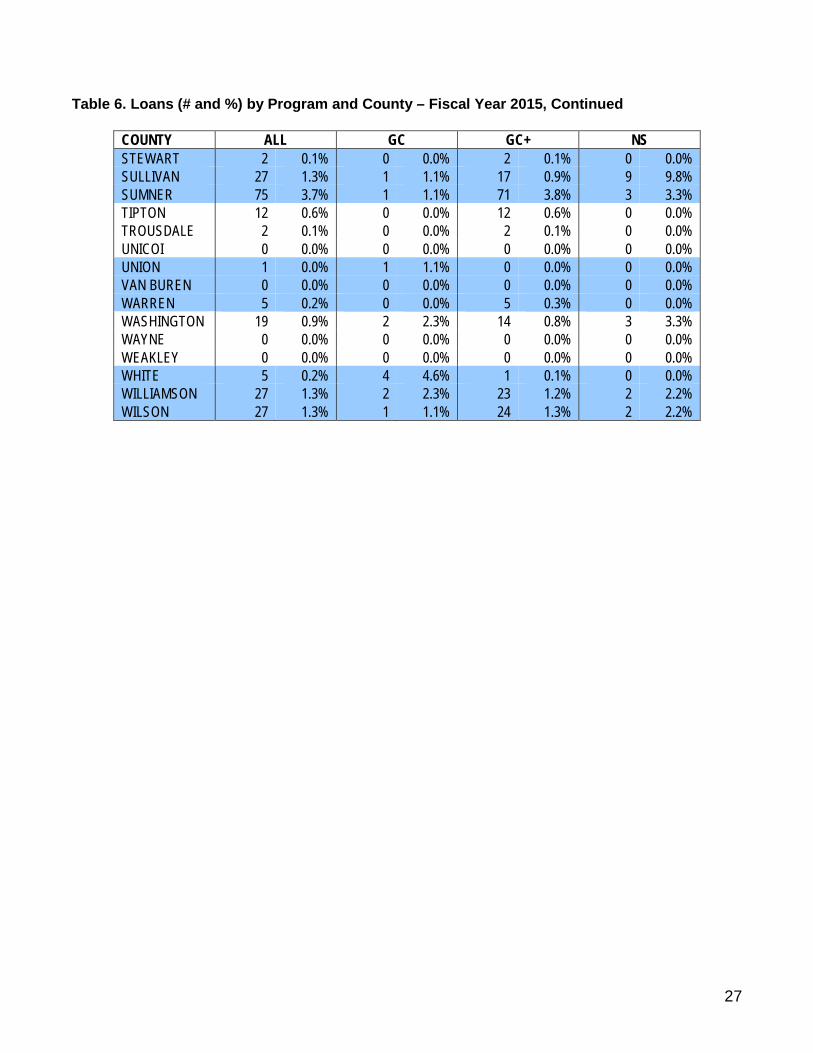
Geographic Distribution (see Table 5)
Looking geographically at the loan distribution statewide, Middle Tennessee was dominant among the
three grand divisions. In fiscal year 2014, 54 percent of all THDA loans were made in Middle
Tennessee. Even though Middle Tennessee continued getting the largest percentage of THDA loans
funded during the fiscal year, the proportion was lower than the previous fiscal year. THDA was able to
increase the loan production in East Tennessee compared to the previous fiscal year. The percent of
loans funded in East Tennessee increased from 25 percent of all loans funded in fiscal year 2014 to 30
percent in fiscal year 2015. Of all loans funded, 61 percent were made in suburban areas and 32 percent
were made in central cities.10
In terms of MSAs, the share of loans made in the Nashville-Davidson-Murfreesboro-Franklin
MSA declined from 54.5 percent to 47.6 percent of all loans. The Knoxville MSA followed the
Nashville-Davidson-Murfreesboro-Franklin MSA with 12.5 percent of all THDA loans. In fiscal year
2015, THDA funded more loans in Davidson County than in other counties. Twenty-four percent of all
loans were made in Davidson County. Rutherford, Shelby and Knox followed, respectively, in terms of
10 In this report, urban areas are defined as the counties in MSAs. Central cities are Bristol, Chattanooga, Jackson, Johnson City, Kingsport, Knoxville, Memphis and Nashville.
0.0%
10.0%
20.0%
30.0%
40.0%
50.0%
60.0%
70.0%
80.0%
US Tennessee THDA

16
number of loans funded during fiscal year 2015. THDA’s loan production declined by 17 percent in
Rutherford County and 13 percent in Shelby County and increased by 23 percent in Knox County
compared to the previous fiscal year
Even though the total number of THDA loans in the state increased by five percent compared to
the previous fiscal year, not all the counties were impacted equally. The most substantial year-over-year
increase among the counties with 100 or more THDA loans in fiscal year 2014 was in Knox County
where the number of THDA loans increased from 129 in fiscal year 2014 to 159 in fiscal year 2015, a 23
percent annual increase. Hamilton and Davidson Counties, respectively, were other counties with a
substantial increase in the total number of THDA loans. THDA made substantially less loans in
Williamson County compared to the previous fiscal year, with volume moving from 56 to 27, a 52
percent annual decline.
In fiscal year 2015, the number of unserved counties was 25. THDA did not make any loans in
Benton, Carroll, Clay, Decatur, Fentress, Grundy, Hancock, Hardeman, Hardin, Henry, Houston,
Jackson, Lake, Lawrence, Lewis, Macon, Marion, Moore, Perry, Pickett, Sequatchie, Unicoi, Van
Buren, Wayne and Weakley Counties.

17
Table 1. THDA Loans by Program and Fiscal Year, 2010-2015
All Programs11,12
Great Start Great Advantage Great Rate Great Choice Great Choice Plus13
New Start
Total # of Loans ALL GS GA GR GC GC+ NS 2010-2011 2,214 1,829 61 212 111 2011-2012 2,201 1,881 39 160 120 2012-2013 1,882 1,613 22 133 114 2013-2014 1,927 924 23 121 57 716 86 2014-2015 2,028 87 1,849 92
Total Loan $ ALL GS GA GR GC GC+ NS
2010-2011 $231,073,408 $193,472,248 $6,875,512 $21,485,213 $9,227,035 2011-2012 $236,014,517 $206,189,104 $4,566,076 $15,306,602 $9,752,735 2012-2013 $212,167,036 $186,221,991 $2,614,132 $13,308,047 $10,022,866 2013-2014 $227,421,240 $112,789,360 $3,074,120 $13,541,476 $5,998,803 $84,986,830 $7,030,651 2014-2015 $239,995,354 $8,748,012 $222,988,525 $8,258,817
Avg. Loan $ ALL GS GA GR GC GC+ NS
2010-2011 $104,369 $105,780 $112,713 $101,345 $83,126 2011-2012 $107,231 $109,617 $117,079 $95,666 $81,273 2012-2013 $112,735 $115,451 $118,824 $100,061 $87,920 2013-2014 $118,018 $122,066 $133,657 $111,913 $105,242 $118,697 $81,752 2014-2015 $118,341 $100,552 $120,600 $89,770
11 All Programs total include Disaster Loans made during calendar years 2003, 2004 and 2006, seven Great Save loans made in calendar year 2008, and seven Preserve loans in addition to loans in Great Rate, Great Advantage, Great Start, Great Choice, Great Choice Plus and New Start programs. It also includes the loans with Homeownership for the Brave discount. It does not include the second loans. 12 The second loans of borrowers who used the Great Choice Plus Program are not included in the all program totals, total loan value or the average loan value of all loans. 13 In fiscal year 2015, those 1,849 Great Choice Plus Program borrowers had second loans, but the loan number and total and average loan values are for only the first loans. Second loans are not included.

18
Table 2. Property Characteristics14 – Fiscal Year 2015
NEW OR EXISTING ALL GC GC+ NS NEW
Average Price $140,366 $110,325 $154,584 $124,230 Median Price $136,900 $106,000 $150,975 $129,900
Number of Homes New 240 14 134 92 % of Homes New 11.8% 16.1% 7.2% 100.0%
EXISTING Average Price $119,849 $106,947 $120,398 NA Median Price $115,550 $100,000 $116,000 NA
Number of Homes Existing 1,788 73 1,715 0 % of Homes Existing 88.2% 83.9% 92.8% 0.0%
SALES PRICE ALL GC GC+ NS Mean $122,277 $107,490 $122,875 $124,230 Median $119,000 $100,000 $119,165 $129,900
Less than $60,000 2.5% 6.9% 2.4% 0.0% $60,000-$79,999 8.4% 13.8% 8.6% 0.0% $80,000-$89,999 8.1% 14.9% 8.1% 1.1% $90,000-$99,999 8.9% 13.8% 8.5% 12.0%
$100,000-$109,999 10.6% 9.2% 10.5% 13.0% $110,000-$119,999 12.7% 12.6% 13.0% 6.5% $120,000-$129,999 10.9% 4.6% 10.9% 18.5% $130,000-$139,999 11.6% 6.9% 10.9% 30.4% $140,000-$149,999 6.5% 3.4% 6.4% 12.0% $150,000-$159,999 6.0% 4.6% 6.0% 6.5% $160,000-$169,999 4.1% 1.1% 4.5% 0.0% $170,000-$179,999 3.2% 2.3% 3.4% 0.0% $180,000-$189,999 1.7% 1.1% 1.8% 0.0% $190,000-$199,999 0.9% 1.1% 0.9% 0.0%
$200,000 and above 3.8% 3.4% 4.1% 0.0% SQUARE FEET ALL GC GC+ NS Mean 1,449 1,486 1,456 1,283 Median 1,376 1,478 1,379 1,231
less than 1,000 7.2% 6.9% 7.5% 2.2% 1,000-1,250 27.6% 19.5% 26.9% 48.9% 1,251-1,500 28.6% 25.3% 28.2% 39.1% 1,501-1,750 17.2% 27.6% 17.2% 7.6%
More than 1,750 19.5% 20.7% 20.3% 2.2%
14 The Great Choice Program in this table refers to the loans whose borrowers did not require a second loan for downpayment and/or closing costs. The Great Choice Plus Program refers to the first loans whose borrowers took second loan for downpayment and/or closing costs. The second loans are not included in the discussion of those characteristics.

19
Table 2. Property Characteristics – Fiscal Year 2015, Continued
YEAR BUILT ALL GC GC+ NS Mean (year built) 1986 1988 1985 2014 Median (year built) 1992 1996 1990 2014
before 1950 8.0% 10.3% 8.3% 0.0% 1950s 6.4% 4.6% 6.8% 0.0% 1960s 8.8% 4.6% 9.5% 0.0% 1970s 11.5% 14.9% 11.9% 0.0% 1980s 12.7% 11.5% 13.4% 0.0% 1990s 15.7% 10.3% 16.8% 0.0% 2000s 22.9% 23.0% 24.0% 0.0% 2011 0.7% 0.0% 0.8% 0.0% 2012 0.2% 0.0% 0.2% 0.0% 2013 0.7% 1.1% 0.5% 5.4% 2014 9.2% 18.4% 5.4% 77.2% 2015 3.2% 1.1% 2.5% 17.4%

20
Table 3. Homebuyer Characteristics – Fiscal Year 2015
AGE ALL GC GC+ NS Mean 35 38 34 38 Median 31 33 31 36
less than 25 21.4% 21.8% 22.1% 7.6% 25-29 20.9% 14.9% 21.5% 14.1% 30-34 18.6% 17.2% 18.6% 19.6% 35-39 13.0% 10.3% 12.4% 27.2% 40-44 8.4% 8.0% 8.5% 6.5%
45 and over 17.7% 27.6% 16.9% 25.0% FIRST-TIME BUYER ALL GC GC+ NS
Yes 99.9% 98.9% 99.9% 100.0% No 0.1% 1.1% 0.1% 0.0%
GENDER ALL GC GC+ NS Female 44.0% 31.0% 43.5% 66.3%
Male 56.0% 69.0% 56.5% 33.7% HOUSEHOLD SIZE ALL GC GC+ NS Mean 2 2 2 3 Median 2 2 2 3
1 Person 34.8% 24.1% 36.4% 12.0% 2 Person 26.9% 39.1% 26.4% 25.0% 3 Person 17.8% 17.2% 17.3% 28.3% 4 Person 13.0% 14.9% 12.8% 15.2%
5+ Person 7.5% 4.6% 7.1% 19.6% HOUSEHOLD COMP. ALL GC GC+ NS Single Female 19.5% 12.6% 20.0% 16.3% Female with child(ren) 14.8% 6.9% 13.7% 44.6% Single Male 21.2% 19.5% 22.1% 4.3% Male with child(ren) 5.6% 4.6% 5.7% 4.3% Single Parent 1.7% 1.1% 1.8% 1.1% Married Couple 37.1% 55.2% 36.6% 29.3% Other/Unknown 0.1% 0.0% 0.2% 0.0%
21
Table 3. Homebuyer Characteristics – Fiscal Year 2015, Continued
INCOME ALL GC GC+ NS Mean $54,587 $45,673 $56,320 $28,187 Median $49,487 $45,069 $51,014 $29,012
less than $15,000 0.3% 0.0% 0.2% 4.3% $15,000-$19,999 0.7% 1.1% 0.2% 10.9% $20,000-$24,999 2.6% 4.6% 1.8% 16.3% $25,000-$29,999 5.3% 6.9% 4.3% 25.0% $30,000-$34,999 8.9% 6.9% 8.2% 25.0% $35,000-$39,999 10.6% 9.2% 10.4% 15.2% $40,000-$44,999 10.3% 20.7% 10.2% 3.3% $45,000-$49,999 12.4% 13.8% 13.0% 0.0% $50,000-$54,999 10.8% 12.6% 11.2% 0.0% $55,000-$59,999 10.3% 9.2% 10.8% 0.0% $60,000-$64,999 10.9% 8.0% 11.6% 0.0% $65,000-$69,999 6.0% 2.3% 6.5% 0.0% $70,000-$74,999 6.0% 4.6% 6.3% 0.0%
More than $75,000 4.9% 0.0% 5.4% 0.0% RACE/ETHNICITY ALL GC GC+ NS White 74.8% 89.7% 75.2% 52.2% African American 22.9% 9.2% 22.3% 46.7% Asian 1.1% 0.0% 1.2% 1.1% American Indian/Alaskan Native 0.1% 0.0% 0.2% 0.0% Nat. Hawaiian/Pacific Islander 0.2% 1.1% 0.2% 0.0% Multi-Racial 0.0% 0.0% 0.0% 0.0% Unknown/Other 0.8% 0.0% 0.9% 0.0% Hispanic 6.0% 10.3% 6.0% 1.1%

22
Table 4. Loan Characteristics – Fiscal Year 2015 DOWN PAYMENT ALL GC GC+ NS Yes 97.4% 49.4% 99.5% 100.0% No 2.6% 50.6% 0.5% 0.0%
# of loans with down payment 1,975 43 1,840 92 % of Acquisition Cost
Mean* 4.9% 14.7% 3.6% 27.2% Median* 3.5% 10.6% 3.5% 25.0%
LOAN TYPE ALL GC GC+ NS Conventional Insured 0.1% 0.0% 0.0% 3.3% Conventional Uninsured 5.0% 12.6% 0.1% 96.7% FHA 91.7% 33.3% 99.0% 0.0% RD 1.4% 26.4% 0.3% 0.0% VA 1.7% 27.6% 0.6% 0.0% PITI ALL GC GC+ NS Mean $726 $613 $745 $433 Median $706 $596 $724 $448
less than $300 0.7% 2.3% 0.4% 5.4% $300-399 3.1% 6.9% 2.2% 18.5% $400-499 10.3% 17.2% 7.1% 68.5% $500-599 14.3% 25.3% 14.2% 6.5% $600-699 20.0% 19.5% 21.0% 1.1% $700-799 19.2% 14.9% 20.3% 0.0% $800-899 13.6% 6.9% 14.6% 0.0%
$900 or more 18.7% 6.9% 20.2% 0.0% PITI % of INCOME ALL GC GC+ NS Mean 18.3% 16.8% 18.3% 20.7% Median 17.6% 15.6% 17.6% 18.7%
less than 15% 25.0% 33.3% 25.2% 14.1% 15-19% 38.0% 41.4% 37.4% 46.7% 20-24% 23.9% 17.2% 24.0% 28.3% 25-29% 9.9% 5.7% 10.2% 6.5%
30% or more 3.2% 2.3% 3.2% 4.3% TARGETED AREA ALL GC GC+ NS Yes 12.9% 33.3% 12.1% 10.9% No 87.1% 66.7% 87.9% 89.1%
* Down payment as percent of acquisition cost is calculated only for the loans with a down payment.

23
Table 5a. Geographic Distribution of Loans (Number and Percent) by Program, Fiscal Year 2015 Percentage listed is within the program (column)
TENNESSEE ALL GC GC+ NS Statewide GRAND DIVISIONS ALL GC GC+ NS
East 612 30.2% 48 55.2% 522 28.2% 42 45.7% Middle 1,103 54.4% 32 36.8% 1,033 55.9% 38 41.3%
West 313 15.4% 7 8.0% 294 15.9% 12 13.0% URBAN-RURAL ALL GC GC+ NS
Central City 658 32.4% 16 18.4% 606 32.8% 36 39.1% Rural 142 7.0% 25 28.7% 111 6.0% 6 6.5%
Suburb 1,228 60.6% 46 52.9% 1,132 61.2% 50 54.3% MSA ALL GC GC+ NS
Chattanooga 148 7.3% 2 2.3% 142 7.7% 4 4.3% Cleveland 60 3.0% 2 2.3% 55 3.0% 3 3.3%
Johnson City 21 1.0% 2 2.3% 15 0.8% 4 4.3% Kingsport-Bristol 32 1.6% 2 2.3% 21 1.1% 9 9.8%
Knoxville 254 12.5% 22 25.3% 217 11.7% 15 16.3% Morristown 34 1.7% 6 6.9% 26 1.4% 2 2.2% Clarksville 89 4.4% 1 1.1% 88 4.8% 0 0.0% Nashville 966 47.6% 20 23.0% 909 49.2% 37 40.2% Jackson 42 2.1% 0 0.0% 42 2.3% 0 0.0%
Memphis 240 11.8% 5 5.7% 223 12.1% 12 13.0% East TN Non-MSA 63 3.1% 12 13.8% 46 2.5% 5 5.4%
Middle TN Non-MSA 48 2.4% 11 12.6% 36 1.9% 1 1.1% West TN Non-MSA 31 1.5% 2 2.3% 29 1.6% 0 0.0%

24
Table 5b. Geographic Distribution of Loan Dollars by Program, Fiscal Year 2015 TENNESSEE ALL GC GC+ NS
Statewide $239,995,354 $8,748,012 $222,988,525 $8,258,817 GRAND DIV. ALL GC GC+ NS
East $62,724,618 $4,619,490 $54,468,742 $3,636,386 Middle $143,810,287 $3,565,327 $136,545,379 $3,699,581
West $33,460,449 $563,195 $31,974,404 $922,850 URBAN-RURAL ALL GC GC+ NS
Central City $74,921,797 $1,595,098 $70,294,358 $3,032,341 Rural $12,796,404 $2,343,630 $9,948,149 $504,625
Suburb $152,277,153 $4,809,284 $142,746,018 $4,721,851 MSA ALL GC GC+ NS
Chattanooga $16,497,496 $189,759 $15,977,237 $330,500 Cleveland $5,900,517 $212,801 $5,464,741 $222,975
Johnson City $1,983,424 $190,507 $1,422,345 $370,572 Kingsport-Bristol $3,032,586 $231,872 $1,987,179 $813,535
Knoxville $26,449,453 $2,113,725 $23,040,924 $1,294,804 Morristown $3,258,804 $561,411 $2,529,393 $168,000 Clarksville $10,216,920 $120,026 $10,096,894 $0 Nashville $129,049,877 $2,470,241 $122,948,680 $3,630,956 Jackson $4,167,206 $0 $4,167,206 $0
Memphis $26,642,667 $314,040 $25,405,777 $922,850 East Non-MSA $5,602,338 $1,119,415 $4,046,923 $436,000
Middle Non-MSA $4,543,490 $975,060 $3,499,805 $68,625 West Non-MSA $2,650,576 $249,155 $2,401,421 $0

25
Table 6. Loans (# and %) by Program and County – Fiscal Year 2015
COUNTY ALL GC GC+ NS ANDERSON 19 0.9% 2 2.3% 17 0.9% 0 0.0% BEDFORD 11 0.5% 0 0.0% 10 0.5% 1 1.1% BENTON 0 0.0% 0 0.0% 0 0.0% 0 0.0% BLEDSOE 1 0.0% 0 0.0% 1 0.1% 0 0.0% BLOUNT 33 1.6% 2 2.3% 25 1.4% 6 6.5% BRADLEY 56 2.8% 2 2.3% 51 2.8% 3 3.3% CAMPBELL 3 0.1% 0 0.0% 3 0.2% 0 0.0% CANNON 3 0.1% 0 0.0% 3 0.2% 0 0.0% CARROLL 0 0.0% 0 0.0% 0 0.0% 0 0.0% CARTER 2 0.1% 0 0.0% 1 0.1% 1 1.1% CHEATHAM 7 0.3% 0 0.0% 7 0.4% 0 0.0% CHESTER 2 0.1% 0 0.0% 2 0.1% 0 0.0% CLAIBORNE 2 0.1% 0 0.0% 2 0.1% 0 0.0% CLAY 0 0.0% 0 0.0% 0 0.0% 0 0.0% COCKE 6 0.3% 0 0.0% 6 0.3% 0 0.0% COFFEE 5 0.2% 1 1.1% 4 0.2% 0 0.0% CROCKETT 3 0.1% 0 0.0% 3 0.2% 0 0.0% CUMBERLAND 13 0.6% 5 5.7% 5 0.3% 3 3.3% DAVIDSON 493 24.3% 12 13.8% 458 24.8% 23 25.0% DECATUR 0 0.0% 0 0.0% 0 0.0% 0 0.0% DEKALB 3 0.1% 0 0.0% 3 0.2% 0 0.0% DICKSON 7 0.3% 0 0.0% 5 0.3% 2 2.2% DYER 7 0.3% 0 0.0% 7 0.4% 0 0.0% FAYETTE 5 0.2% 1 1.1% 4 0.2% 0 0.0% FENTRESS 0 0.0% 0 0.0% 0 0.0% 0 0.0% FRANKLIN 3 0.1% 1 1.1% 2 0.1% 0 0.0% GIBSON 8 0.4% 2 2.3% 6 0.3% 0 0.0% GILES 2 0.1% 0 0.0% 2 0.1% 0 0.0% GRAINGER 4 0.2% 0 0.0% 3 0.2% 1 1.1% GREENE 5 0.2% 2 2.3% 3 0.2% 0 0.0% GRUNDY 0 0.0% 0 0.0% 0 0.0% 0 0.0% HAMBLEN 13 0.6% 1 1.1% 11 0.6% 1 1.1% HAMILTON 148 7.3% 2 2.3% 142 7.7% 4 4.3% HANCOCK 0 0.0% 0 0.0% 0 0.0% 0 0.0% HARDEMAN 0 0.0% 0 0.0% 0 0.0% 0 0.0% HARDIN 0 0.0% 0 0.0% 0 0.0% 0 0.0% HAWKINS 5 0.2% 1 1.1% 4 0.2% 0 0.0% HAYWOOD 4 0.2% 0 0.0% 4 0.2% 0 0.0% HENDERSON 1 0.0% 0 0.0% 1 0.1% 0 0.0% HENRY 0 0.0% 0 0.0% 0 0.0% 0 0.0%

26
Table 6. Loans (# and %) by Program and County – Fiscal Year 2015, Continued
COUNTY ALL GC GC+ NS HICKMAN 4 0.2% 0 0.0% 4 0.2% 0 0.0% HOUSTON 0 0.0% 0 0.0% 0 0.0% 0 0.0% HUMPHREYS 2 0.1% 1 1.1% 1 0.1% 0 0.0% JACKSON 0 0.0% 0 0.0% 0 0.0% 0 0.0% JEFFERSON 21 1.0% 5 5.7% 15 0.8% 1 1.1% JOHNSON 1 0.0% 0 0.0% 0 0.0% 1 1.1% KNOX 159 7.8% 6 6.9% 148 8.0% 5 5.4% LAKE 0 0.0% 0 0.0% 0 0.0% 0 0.0% LAUDERDALE 8 0.4% 0 0.0% 8 0.4% 0 0.0% LAWRENCE 0 0.0% 0 0.0% 0 0.0% 0 0.0% LEWIS 0 0.0% 0 0.0% 0 0.0% 0 0.0% LINCOLN 1 0.0% 0 0.0% 1 0.1% 0 0.0% LOUDON 20 1.0% 7 8.0% 12 0.6% 1 1.1% MACON 0 0.0% 0 0.0% 0 0.0% 0 0.0% MADISON 37 1.8% 0 0.0% 37 2.0% 0 0.0% MARION 0 0.0% 0 0.0% 0 0.0% 0 0.0% MARSHALL 2 0.1% 0 0.0% 2 0.1% 0 0.0% MAURY 33 1.6% 1 1.1% 29 1.6% 3 3.3% MCMINN 9 0.4% 1 1.1% 8 0.4% 0 0.0% MCNAIRY 2 0.1% 0 0.0% 2 0.1% 0 0.0% MEIGS 1 0.0% 0 0.0% 1 0.1% 0 0.0% MONROE 9 0.4% 2 2.3% 7 0.4% 0 0.0% MONTGOMERY 89 4.4% 1 1.1% 88 4.8% 0 0.0% MOORE 0 0.0% 0 0.0% 0 0.0% 0 0.0% MORGAN 3 0.1% 0 0.0% 1 0.1% 2 2.2% OBION 1 0.0% 0 0.0% 1 0.1% 0 0.0% OVERTON 2 0.1% 1 1.1% 1 0.1% 0 0.0% PERRY 0 0.0% 0 0.0% 0 0.0% 0 0.0% PICKETT 0 0.0% 0 0.0% 0 0.0% 0 0.0% POLK 4 0.2% 0 0.0% 4 0.2% 0 0.0% PUTNAM 5 0.2% 3 3.4% 2 0.1% 0 0.0% RHEA 2 0.1% 0 0.0% 2 0.1% 0 0.0% ROANE 12 0.6% 4 4.6% 8 0.4% 0 0.0% ROBERTSON 28 1.4% 2 2.3% 26 1.4% 0 0.0% RUTHERFORD 258 12.7% 1 1.1% 255 13.8% 2 2.2% SCOTT 2 0.1% 0 0.0% 1 0.1% 1 1.1% SEQUATCHIE 0 0.0% 0 0.0% 0 0.0% 0 0.0% SEVIER 12 0.6% 2 2.3% 10 0.5% 0 0.0% SHELBY 223 11.0% 4 4.6% 207 11.2% 12 13.0% SMITH 2 0.1% 0 0.0% 2 0.1% 0 0.0%
27
Table 6. Loans (# and %) by Program and County – Fiscal Year 2015, Continued
COUNTY ALL GC GC+ NS STEWART 2 0.1% 0 0.0% 2 0.1% 0 0.0% SULLIVAN 27 1.3% 1 1.1% 17 0.9% 9 9.8% SUMNER 75 3.7% 1 1.1% 71 3.8% 3 3.3% TIPTON 12 0.6% 0 0.0% 12 0.6% 0 0.0% TROUSDALE 2 0.1% 0 0.0% 2 0.1% 0 0.0% UNICOI 0 0.0% 0 0.0% 0 0.0% 0 0.0% UNION 1 0.0% 1 1.1% 0 0.0% 0 0.0% VAN BUREN 0 0.0% 0 0.0% 0 0.0% 0 0.0% WARREN 5 0.2% 0 0.0% 5 0.3% 0 0.0% WASHINGTON 19 0.9% 2 2.3% 14 0.8% 3 3.3% WAYNE 0 0.0% 0 0.0% 0 0.0% 0 0.0% WEAKLEY 0 0.0% 0 0.0% 0 0.0% 0 0.0% WHITE 5 0.2% 4 4.6% 1 0.1% 0 0.0% WILLIAMSON 27 1.3% 2 2.3% 23 1.2% 2 2.2% WILSON 27 1.3% 1 1.1% 24 1.3% 2 2.2%

28
Table 8. Dollar Amount of Loans by Program and County – Fiscal Year 2015
COUNTY ALL GC GC+ NS ANDERSON $1,905,721 $118,228 $1,787,493 $0 BEDFORD $1,094,486 $0 $1,025,861 $68,625 BENTON $0 $0 $0 $0 BLEDSOE $108,007 $0 $108,007 $0 BLOUNT $3,345,639 $197,342 $2,605,228 $543,069 BRADLEY $5,541,328 $212,801 $5,105,552 $222,975 CAMPBELL $285,655 $0 $285,655 $0 CANNON $239,579 $0 $239,579 $0 CARROLL $0 $0 $0 $0 CARTER $154,842 $0 $88,270 $66,572 CHEATHAM $956,847 $0 $956,847 $0 CHESTER $177,229 $0 $177,229 $0 CLAIBORNE $163,974 $0 $163,974 $0 CLAY $0 $0 $0 $0 COCKE $407,138 $0 $407,138 $0 COFFEE $469,534 $97,805 $371,729 $0 CROCKETT $324,564 $0 $324,564 $0 CUMBERLAND $1,151,204 $418,365 $440,339 $292,500 DAVIDSON $65,862,936 $1,295,129 $62,266,601 $2,301,206 DECATUR $0 $0 $0 $0 DEKALB $317,148 $0 $317,148 $0 DICKSON $715,185 $0 $506,160 $209,025 DYER $560,851 $0 $560,851 $0 FAYETTE $716,558 $70,483 $646,075 $0 FENTRESS $0 $0 $0 $0 FRANKLIN $290,636 $62,840 $227,796 $0 GIBSON $741,012 $249,155 $491,857 $0 GILES $176,085 $0 $176,085 $0 GRAINGER $319,879 $0 $217,879 $102,000 GREENE $390,786 $109,184 $281,602 $0 GRUNDY $0 $0 $0 $0 HAMBLEN $1,225,129 $112,500 $1,036,129 $76,500 HAMILTON $16,497,496 $189,759 $15,977,237 $330,500 HANCOCK $0 $0 $0 $0 HARDEMAN $0 $0 $0 $0 HARDIN $0 $0 $0 $0 HAWKINS $409,904 $112,418 $297,486 $0 HAYWOOD $348,960 $0 $348,960 $0 HENDERSON $84,442 $0 $84,442 $0

29
Table 8. Dollar Amount of Loans by Program and County – Fiscal Year 2015, Continued
COUNTY ALL GC GC+ NS HENRY $0 $0 $0 $0 HICKMAN $319,013 $0 $319,013 $0 HOUSTON $0 $0 $0 $0 HUMPHREYS $169,578 $122,448 $47,130 $0 JACKSON $0 $0 $0 $0 JEFFERSON $2,033,675 $448,911 $1,493,264 $91,500 JOHNSON $96,000 $0 $0 $96,000 KNOX $17,099,195 $643,814 $16,049,681 $405,700 LAKE $0 $0 $0 $0 LAUDERDALE $667,293 $0 $667,293 $0 LAWRENCE $0 $0 $0 $0 LEWIS $0 $0 $0 $0 LINCOLN $74,132 $0 $74,132 $0 LOUDON $1,929,398 $615,783 $1,204,940 $108,675 MACON $0 $0 $0 $0 MADISON $3,665,413 $0 $3,665,413 $0 MARION $0 $0 $0 $0 MARSHALL $267,956 $0 $267,956 $0 MAURY $3,563,741 $55,967 $3,189,024 $318,750 MCMINN $655,787 $71,428 $584,359 $0 MCNAIRY $133,143 $0 $133,143 $0 MEIGS $88,271 $0 $88,271 $0 MONROE $773,202 $184,663 $588,539 $0 MONTGOMERY $10,216,920 $120,026 $10,096,894 $0 MOORE $0 $0 $0 $0 MORGAN $239,440 $0 $104,080 $135,360 OBION $114,875 $0 $114,875 $0 OVERTON $199,744 $91,836 $107,908 $0 PERRY $0 $0 $0 $0 PICKETT $0 $0 $0 $0 POLK $359,189 $0 $359,189 $0 PUTNAM $504,477 $317,527 $186,950 $0 RHEA $151,209 $0 $151,209 $0 ROANE $1,227,484 $441,516 $785,968 $0 ROBERTSON $3,621,237 $262,316 $3,358,921 $0 RUTHERFORD $33,521,374 $93,279 $33,269,095 $159,000 SCOTT $119,177 $0 $71,677 $47,500 SEQUATCHIE $0 $0 $0 $0 SEVIER $1,497,583 $335,775 $1,161,808 $0

30
Table 8. Dollar Amount of Loans by Program and County – Fiscal Year 2015, Continued
COUNTY ALL GC GC+ NS SHELBY $24,701,558 $243,557 $23,535,151 $922,850 SMITH $269,330 $0 $269,330 $0 STEWART $249,618 $0 $249,618 $0 SULLIVAN $2,622,682 $119,454 $1,689,693 $813,535 SUMNER $10,601,698 $176,739 $10,169,959 $255,000 TIPTON $1,224,551 $0 $1,224,551 $0 TROUSDALE $298,493 $0 $298,493 $0 UNICOI $0 $0 $0 $0 UNION $97,042 $97,042 $0 $0 VAN BUREN $0 $0 $0 $0 WARREN $362,952 $0 $362,952 $0 WASHINGTON $1,828,582 $190,507 $1,334,075 $304,000 WAYNE $0 $0 $0 $0 WEAKLEY $0 $0 $0 $0 WHITE $367,144 $282,604 $84,540 $0 WILLIAMSON $4,883,897 $383,533 $4,291,489 $208,875 WILSON $4,196,547 $203,278 $3,814,169 $179,100

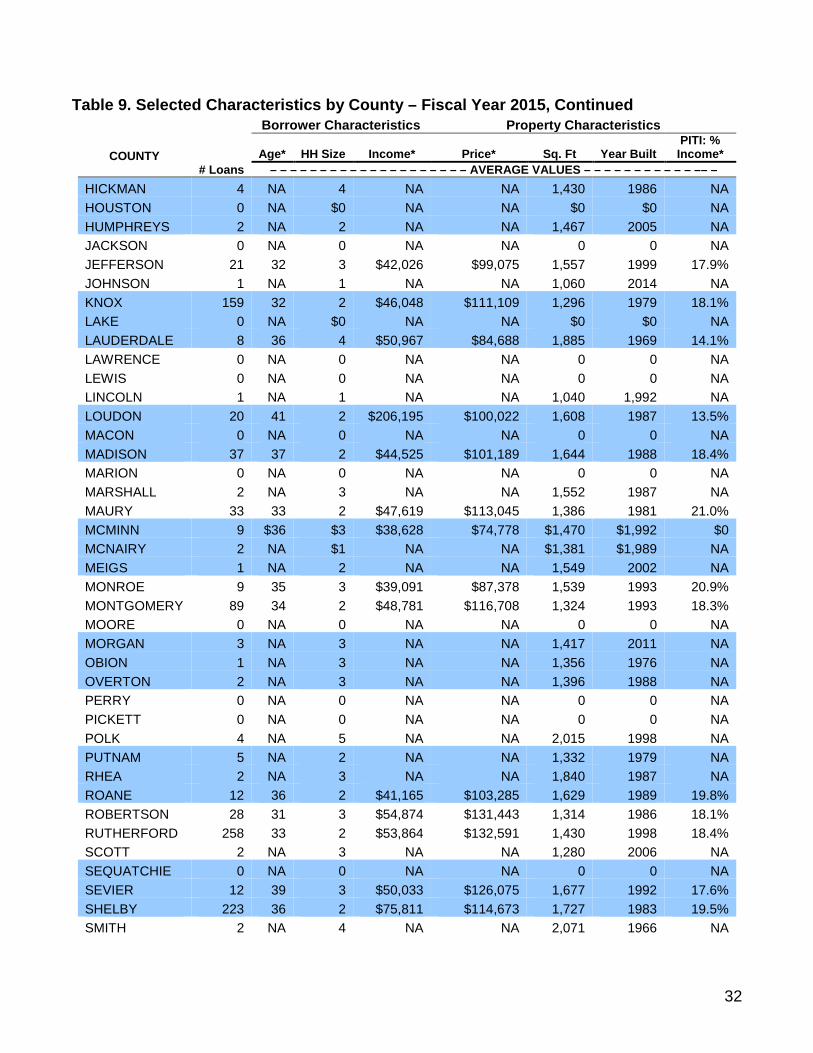
31
Table 9. Selected Characteristics by County – Fiscal Year 2015 Borrower Characteristics Property Characteristics
COUNTY
Age* HH Size Income* Price Sq. Ft Year Built PITI: % Income*
# Loans – – – – – – – – – – – – – – – – – – – – AVERAGE VALUES – – – – – – – – – – – – – – –– –
ANDERSON 19 37 2 $44,498 $102,657 1,267 1966 18.0% BEDFORD 11 31 3 $43,794 $103,300 1,275 2001 17.3% BENTON 0 NA 0 NA NA 0 0 NA BLEDSOE 1 NA 1 NA NA 1,456 2,000 NA BLOUNT 33 35 3 $45,022 $111,271 1,429 1987 16.6% BRADLEY 56 33 3 $43,891 $103,187 1,244 1978 17.2% CAMPBELL 3 NA $3 NA NA $1,517 $1,975 NA CANNON 3 NA 1 NA NA 1,369 2000 NA CARROLL 0 NA $0 NA NA $0 $0 NA CARTER 2 NA 3 NA NA 1,576 2010 NA CHEATHAM 7 34 2 $52,443 $139,214 1,355 1990 19.7% CHESTER 2 NA 2 NA NA 1,102 1981 NA CLAIBORNE 2 NA 2 NA NA 1,433 2000 NA CLAY 0 NA $0 NA NA $0 $0 NA COCKE 6 38 2 $42,784 $69,150 1,386 1986 12.9% COFFEE 5 NA 3 NA NA 1,487 1994 NA CROCKETT 3 NA 3 NA NA 1,440 2004 NA CUMBERLAND 13 33 3 $44,630 $95,896 1,470 1989 13.7% DAVIDSON 493 35 2 $53,709 $138,089 1,405 1986 18.9% DECATUR 0 NA 0 NA NA 0 0 NA DEKALB 3 NA 2 NA NA 1,492 1993 NA DICKSON 7 31 3 $47,629 $113,457 1,450 1991 15.7% DYER 7 33 3 44,801 81,600 1,605 1,982 0 FAYETTE 5 NA 1 NA NA 1,883 2002 NA FENTRESS 0 NA $0 NA NA $0 $0 NA FRANKLIN 3 NA 3 NA NA 1,621 1998 NA GIBSON 8 36 3 $49,848 $93,150 1,592 1991 14.6% GILES 2 NA 2 NA NA 1,614 1,984 NA GRAINGER 4 NA 2 NA NA 1,446 2007 NA GREENE 5 NA 2 NA NA 1,319 1983 NA GRUNDY 0 NA $0 NA NA $0 $0 NA HAMBLEN 13 39 2 $43,974 $97,673 1,297 1988 16.2% HAMILTON 148 35 2 $46,591 $115,073 1,372 1969 19.0% HANCOCK 0 NA 0 NA NA 0 0 NA HARDEMAN 0 NA 0 NA NA 0 0 NA HARDIN 0 NA 0 NA NA 0 0 NA HAWKINS 5 NA 3 NA NA 1,529 1998 NA HAYWOOD 4 NA 3 NA NA 1,502 1971 NA HENDERSON 1 NA 3 NA NA 1,156 1998 NA HENRY 0 NA 0 NA NA 0 0 NA
32
Table 9. Selected Characteristics by County – Fiscal Year 2015, Continued Borrower Characteristics Property Characteristics
COUNTY
# Loans
Age* HH Size Income* Price* Sq. Ft Year Built PITI: %
Income* – – – – – – – – – – – – – – – – – – – – AVERAGE VALUES – – – – – – – – – – – –– –
HICKMAN 4 NA 4 NA NA 1,430 1986 NA HOUSTON 0 NA $0 NA NA $0 $0 NA HUMPHREYS 2 NA 2 NA NA 1,467 2005 NA JACKSON 0 NA 0 NA NA 0 0 NA JEFFERSON 21 32 3 $42,026 $99,075 1,557 1999 17.9% JOHNSON 1 NA 1 NA NA 1,060 2014 NA KNOX 159 32 2 $46,048 $111,109 1,296 1979 18.1% LAKE 0 NA $0 NA NA $0 $0 NA LAUDERDALE 8 36 4 $50,967 $84,688 1,885 1969 14.1% LAWRENCE 0 NA 0 NA NA 0 0 NA LEWIS 0 NA 0 NA NA 0 0 NA LINCOLN 1 NA 1 NA NA 1,040 1,992 NA LOUDON 20 41 2 $206,195 $100,022 1,608 1987 13.5% MACON 0 NA 0 NA NA 0 0 NA MADISON 37 37 2 $44,525 $101,189 1,644 1988 18.4% MARION 0 NA 0 NA NA 0 0 NA MARSHALL 2 NA 3 NA NA 1,552 1987 NA MAURY 33 33 2 $47,619 $113,045 1,386 1981 21.0% MCMINN 9 $36 $3 $38,628 $74,778 $1,470 $1,992 $0 MCNAIRY 2 NA $1 NA NA $1,381 $1,989 NA MEIGS 1 NA 2 NA NA 1,549 2002 NA MONROE 9 35 3 $39,091 $87,378 1,539 1993 20.9% MONTGOMERY 89 34 2 $48,781 $116,708 1,324 1993 18.3% MOORE 0 NA 0 NA NA 0 0 NA MORGAN 3 NA 3 NA NA 1,417 2011 NA OBION 1 NA 3 NA NA 1,356 1976 NA OVERTON 2 NA 3 NA NA 1,396 1988 NA PERRY 0 NA 0 NA NA 0 0 NA PICKETT 0 NA 0 NA NA 0 0 NA POLK 4 NA 5 NA NA 2,015 1998 NA PUTNAM 5 NA 2 NA NA 1,332 1979 NA RHEA 2 NA 3 NA NA 1,840 1987 NA ROANE 12 36 2 $41,165 $103,285 1,629 1989 19.8% ROBERTSON 28 31 3 $54,874 $131,443 1,314 1986 18.1% RUTHERFORD 258 33 2 $53,864 $132,591 1,430 1998 18.4% SCOTT 2 NA 3 NA NA 1,280 2006 NA SEQUATCHIE 0 NA 0 NA NA 0 0 NA SEVIER 12 39 3 $50,033 $126,075 1,677 1992 17.6% SHELBY 223 36 2 $75,811 $114,673 1,727 1983 19.5% SMITH 2 NA 4 NA NA 2,071 1966 NA

33
Table 9. Selected Characteristics by County – Fiscal Year 2015, Continued Borrower Characteristics Property Characteristics
COUNTY # Loans
Age* HH Size Income* Price* Sq. Ft Year Built PITI % Income*
– – – – – – – – – – – – – – – – – – – – – AVERAGE VALUES – – – – – – – – – – – – STEWART 2 NA 4 NA NA 1,146 1983 NA SULLIVAN 27 43 2 $42,565 $112,811 1,386 1985 16.6% SUMNER 75 35 3 $57,188 $145,196 1,514 1988 18.5% TIPTON 12 34 3 $51,085 $104,038 1,460 1992 17.1% TROUSDALE 2 NA 2 NA NA 1,733 2011 NA UNICOI 0 NA 0 NA NA 0 0 NA UNION 1 NA 2 NA NA 1,478 2,014 NA VAN BUREN 0 NA 0 NA NA 0 0 NA WARREN 5 NA 3 NA NA 1,199 1996 NA WASHINGTON 19 37 3 $42,863 $103,137 1,312 1987 16.8% WAYNE 0 NA 0 NA NA 0 0 NA WEAKLEY 0 NA 0 NA NA 0 0 NA WHITE 5 NA 3 NA NA 1,247 1970 NA WILLIAMSON 27 34 3 $58,828 $188,428 1,603 2001 21.6% WILSON 27 32 3 $61,675 $160,124 1,673 1995 18.0% TENNESSEE 2,028 35 2 $54,587 $122,277 1,449 $1,986 18.3%
*In the counties with 5 or less loans, the information about the borrower’s age, the income of the borrower and the acquisition cost are suppressed to protect the anonymity of the borrowers.


![[] neuropsicologia thda(bookfi org)](https://cdn.vdocuments.mx/doc/165x107/568ca56b1a28ab186d8d0b5b/-neuropsicologia-thdabookfi-org.jpg)


