
Tim Guilfoyle [email protected]
Phillip O. Berry Academy Charlotte, NC 28075 HHMI Ambassador
Activities For All levels of Biology
“….this isn’t some species that was obliterated by deforestation or the
building of a dam. Dinosaurs had their shot and nature SELECTED
them for extinction….” Ian Malcolm (Jeff Goldblum) Jurassic Park

It changed your teaching and you don't know how your students learned
without it?
https://www.google.com/search?noj=1&biw=1280&bih=675&tbm=isch&sa=1&q=survey+says&oq=survey+says&gs_l=img.3..0l10.162937.164613.0.165169.1
1.10.0.1.1.0.145.1014.6j4.10.0....0...1c.1.64.img..0.11.1015.Wpf1gMxN3N4#imgrc=N7uiBNlx4zOu_M%3A

Biointeractive.org


Mother Nature – The Natural Engineer
Evolving Bodies, Evolving Switches
The Stickleback Fish
Natural Selection of the Rock
Pocket Mouse
Beaks as Tools: Selective Advantage In
Changing Environments

Using Stickleback Fish to Teach Evolution and Genetics
Next Generation Science Standards MS-LS1.B, MS-LS3.A, MS-LS3.B, MS-LS4.C HS-LS1.A, HS-LS3.A, HS-LS3.B, HS-LS3-3, HS-LS4.B, HS-LS4.C
AP Biology Big Idea 1 – 1.A.1, 1.A.2, 1.A.4, 1.C.2 Big Idea 2 - 2.D.1, 2.E.1 Big Idea 3 – 3.A.4, 3.B.1, 3.C.1 IB Biology (2009 Standards) 4.1, 4.3, 5.4, D.2 (2016 Standards) 3.1, 3.4, 5.1, 5.2 Common Core
CCSS.ELA-Literacy.WHST.6-8.1, CCSS.ELA-Literacy.WHST9-12.1, CCSS.ELA-Literacy.RST.6-8.7, CCSS.ELA-Literacy.RST.9-12.5, CCSS.ELALiteracy. RST.9-12.7, CCSS.Math.Practice.MP2, CCSS.Math.Content.HSS.IC.A.1
Florida Science Standards Big Idea 15: Diversity and Evolution of Living Organisms Big Idea 16: Heredity and Reproduction SC.7.L.15.2; SC.7.L.15.3 SC.912.L.15.13; SC.912.L.15.14; SC.912.L.15.15

Film Introduction:
• Freshwater stickleback populations were
established when marine populations became
trapped in lakes, initially connected to the ocean,
that formed at the end of the last ice age.
• Freshwater stickleback populations are very
different from marine populations because they
have adapted to life in freshwater environments.
• Freshwater stickleback fish underwent many
changes (color, size, skeleton) as they adapted
to life in freshwater.
• This activity focuses on changes in the pelvic
skeleton because this trait is highly variable and
is easy to see and measure.
• The underlying genetic mechanisms are well
studied too.
The Making of the Fittest: Evolving Switches, Evolving Bodies

The Making of the Fittest: Evolving Switches, Evolving Bodies
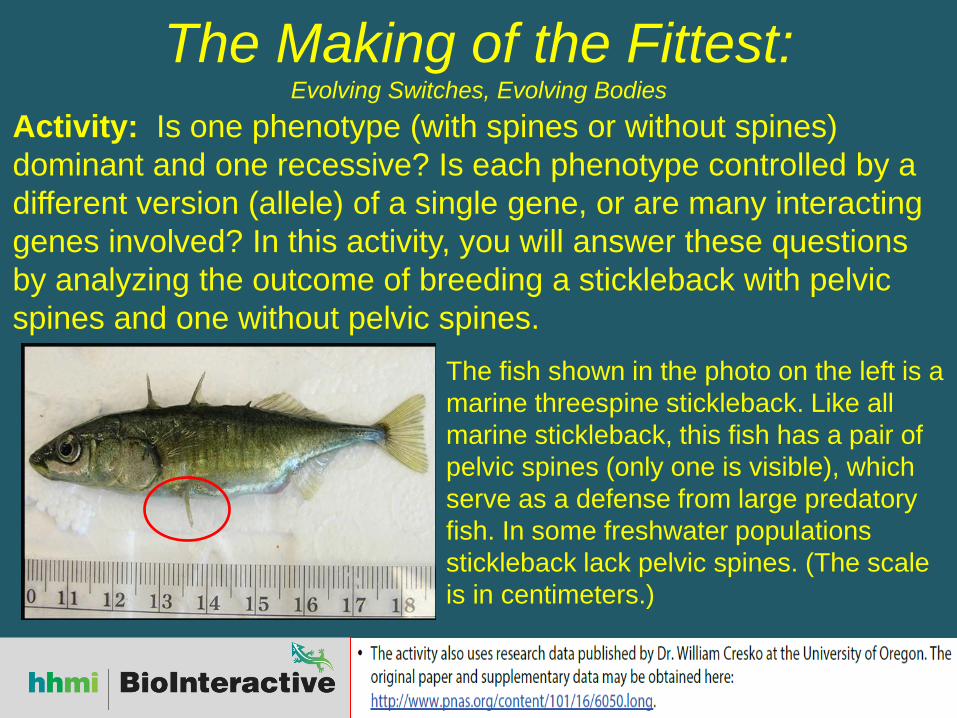
Activity: Is one phenotype (with spines or without spines)
dominant and one recessive? Is each phenotype controlled by a
different version (allele) of a single gene, or are many interacting
genes involved? In this activity, you will answer these questions
by analyzing the outcome of breeding a stickleback with pelvic
spines and one without pelvic spines.
The fish shown in the photo on the left is a
marine threespine stickleback. Like all
marine stickleback, this fish has a pair of
pelvic spines (only one is visible), which
serve as a defense from large predatory
fish. In some freshwater populations
stickleback lack pelvic spines. (The scale
is in centimeters.)
The Making of the Fittest: Evolving Switches, Evolving Bodies
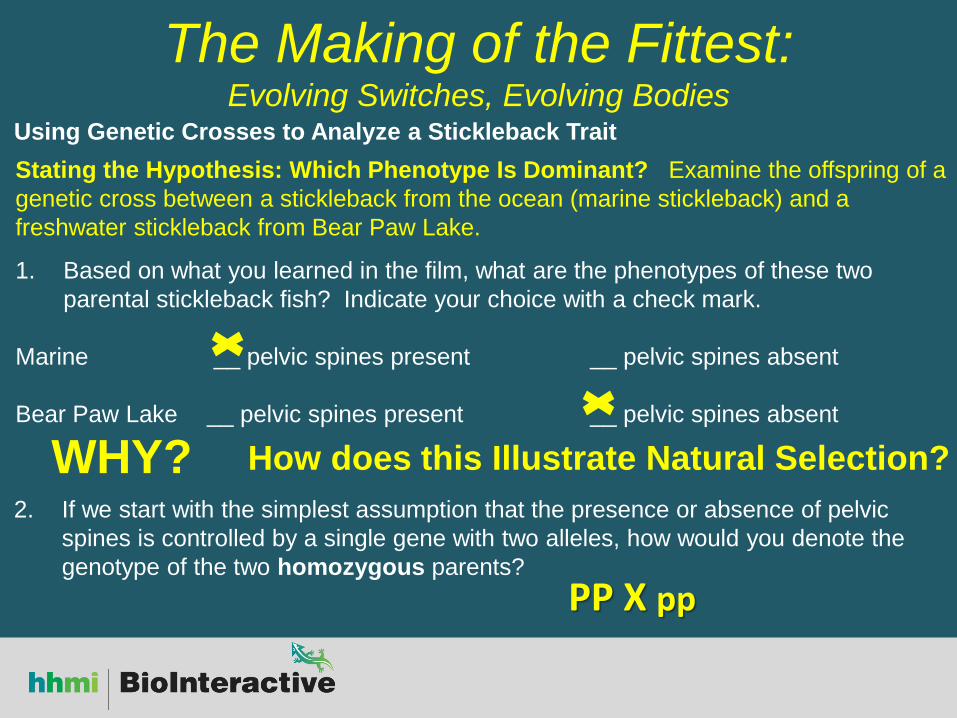
Stating the Hypothesis: Which Phenotype Is Dominant? Examine the offspring of a
genetic cross between a stickleback from the ocean (marine stickleback) and a
freshwater stickleback from Bear Paw Lake.
1. Based on what you learned in the film, what are the phenotypes of these two
parental stickleback fish? Indicate your choice with a check mark.
Marine __ pelvic spines present __ pelvic spines absent
Bear Paw Lake __ pelvic spines present __ pelvic spines absent
The Making of the Fittest: Evolving Switches, Evolving Bodies
WHY? How does this Illustrate Natural Selection?
2. If we start with the simplest assumption that the presence or absence of pelvic
spines is controlled by a single gene with two alleles, how would you denote the
genotype of the two homozygous parents?
PP X pp
Using Genetic Crosses to Analyze a Stickleback Trait

Students answer depends on which phenotype is hypothesized to be dominant (with spines or without spines); however 100% of F1 will be heterozygous (1:0 ratio)
1 PP: 2Pp: 1pp or 3:1
30 with spines and 10 without spines (or vice versa depending on the students hypothesis)
What is your hypothesis for which phenotype is dominant and which one is recessive?
Assign Genotypes:
Marine __________________ Bear Paw Lake _________________ PP or pp PP or pp
Based on your hypothesis, what would you expect to
be the results of the cross between the marine and
Bear Paw Lake stickleback parents? Make your
prediction using the Punnett square to the right.
Using the Punnett square to the right, what do you
expect would be the result of crossing two F1 fish to
produce the second filial (F2) generation?
If you had 40 offspring in the F2 generation, approximately how many would you
expect to have pelvic spines and how many to lack pelvic spines?

Obtaining the Data: Do the Results from the
Experiment Support Your Hypothesis?
• Now you will use the fish cards to see whether the result of
the crosses described in support your hypothesis.
• The cards show photographs of stickleback fish that were
stained with a solution that turns bones red, making them
easier to see.
• There are two sets of cards: the first set (16 cards) represents
the F1 generation and the second set (40 cards) the F2
generation.
• You will be sorting these cards according to whether the fish
have pelvic spines.
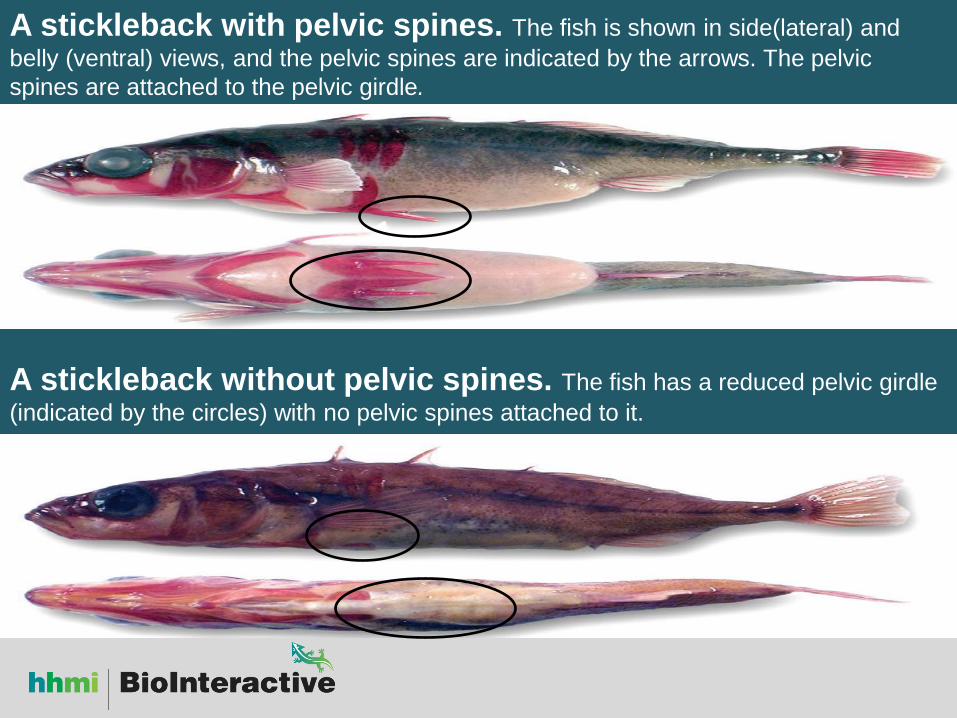
A stickleback with pelvic spines. The fish is shown in side(lateral) and
belly (ventral) views, and the pelvic spines are indicated by the arrows. The pelvic
spines are attached to the pelvic girdle.
A stickleback without pelvic spines. The fish has a reduced pelvic girdle
(indicated by the circles) with no pelvic spines attached to it.

16 0
Sort the F1 set of cards into two separate piles: fish with pelvic spines and fish without
pelvic spines. Count and record the total number of fish with each phenotype in the table
below. What is the ratio of fish with pelvic spines to fish without pelvic spines in the F1
generation?
Repeat the same procedure with the F2 set of cards. Count and record the total number
of fish with each phenotype in the table below.
31 9 Which fish have no spines?
1:0 Ratio
3:1 (3.4:1) Which trait is dominant?
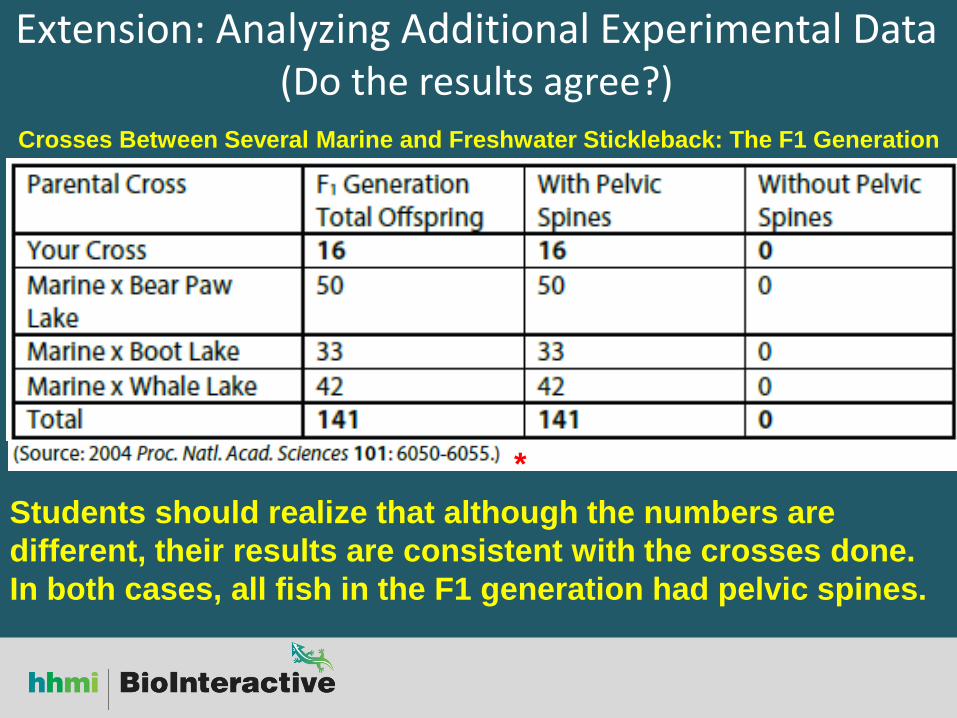
Extension: Analyzing Additional Experimental Data (Do the results agree?)
Students should realize that although the numbers are
different, their results are consistent with the crosses done.
In both cases, all fish in the F1 generation had pelvic spines.
Crosses Between Several Marine and Freshwater Stickleback: The F1 Generation
*

Extension: Analyzing Additional Experimental Data (Do the results agree?)
You will notice that the phenotype ratios vary from family to family. Explain why
every family does not show the same ratio. WHY??????
Crosses Between F1 Generation Stickleback from the Marine x Bear Paw Lake
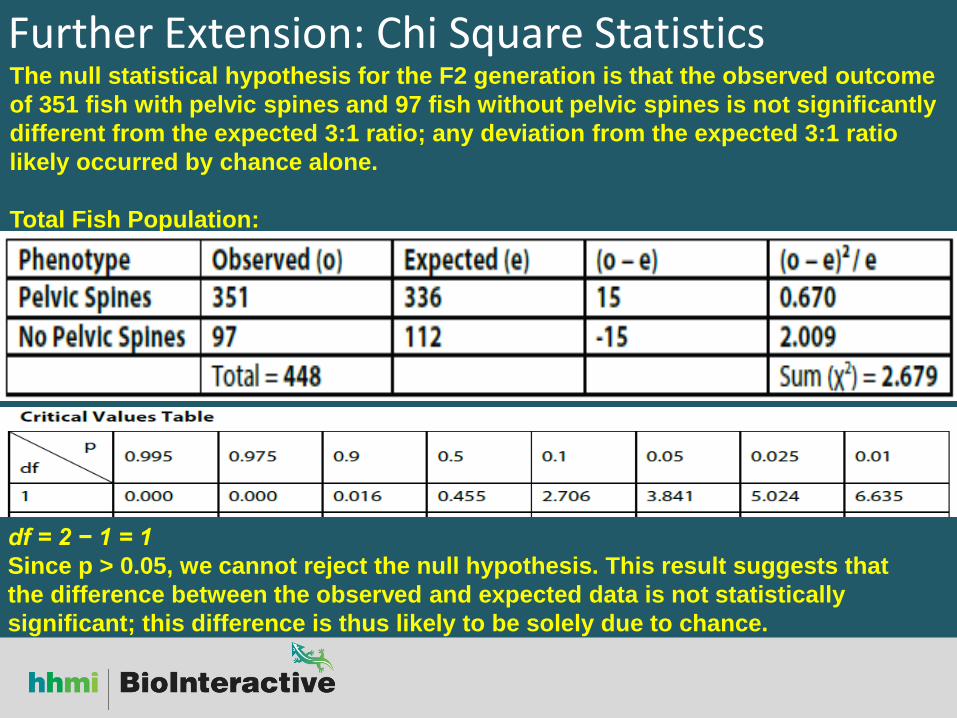
Further Extension: Chi Square Statistics The null statistical hypothesis for the F2 generation is that the observed outcome
of 351 fish with pelvic spines and 97 fish without pelvic spines is not significantly
different from the expected 3:1 ratio; any deviation from the expected 3:1 ratio
likely occurred by chance alone.
Total Fish Population:
df = 2 − 1 = 1
Since p > 0.05, we cannot reject the null hypothesis. This result suggests that
the difference between the observed and expected data is not statistically
significant; this difference is thus likely to be solely due to chance.
Extensions:
Do these results support the
hypothesis that the presence
or absence of pelvic spines is
controlled by a single gene?
Explain using evidence.
How did Mother
Nature “Engineer”
the Stickleback?

Natural Selection of the Rock Pocket Mouse
Next Generation Science Standards MS-LS2-1, MS-LS2-2, MS-LS4-4, MS-LS4-6, MS-ESS2-2 MS- LS2.C, MS- LS4.B, MS- LS4.C HS-LS1-1, HS.LS1.A, HS-LS2-1, HS-LS2-2, HS-LS2-6, HS-LS2-7 HS-LS3-1, HS-LS3-3, HS-LS4-2, HS-LS4-3, HS-LS4-4, HS-LS4-5, HS.LS1.A, HS.LS2.C, HS.LS4.B, HS.LS4.C
AP Biology Big Idea 1 – 1.A.1, 1.A.2, 1.A.4, 1.C.3 Big Idea 3 – 3.C.1 Big Idea 4 - 4.A.1, 4.B.1 4.B.3, 4.C.3
IB Biology (2009 Standards) 4.1, 4.3, 5.4, D.2, G.1 (2016 Standards) 3.1, 5.1, 5.2, 10.3, C.1 Common Core
CCSS.ELA-Literacy.RH.9-10.2, CCSS.ELA-Literacy.RST.9-10.3, CCSS.ELA-Literacy.RST.9-10.4, CCSS.ELA-Literacy.RST.9-10.7, CCSS.Math.Practice.MP.2, CCSS.Math.Practice.MP.3,CCSS.Math.Practice.MP.5, CCSS.WHST.9-12.1
Florida Science Standards Big Idea 15: Diversity and Evolution of Living Organisms Big Idea 16: Heredity and Reproduction SC.7.L.15.2; SC.7.L.15.3 SC.912.L.15.13; SC.912.L.15.14; SC.912.L.15.15
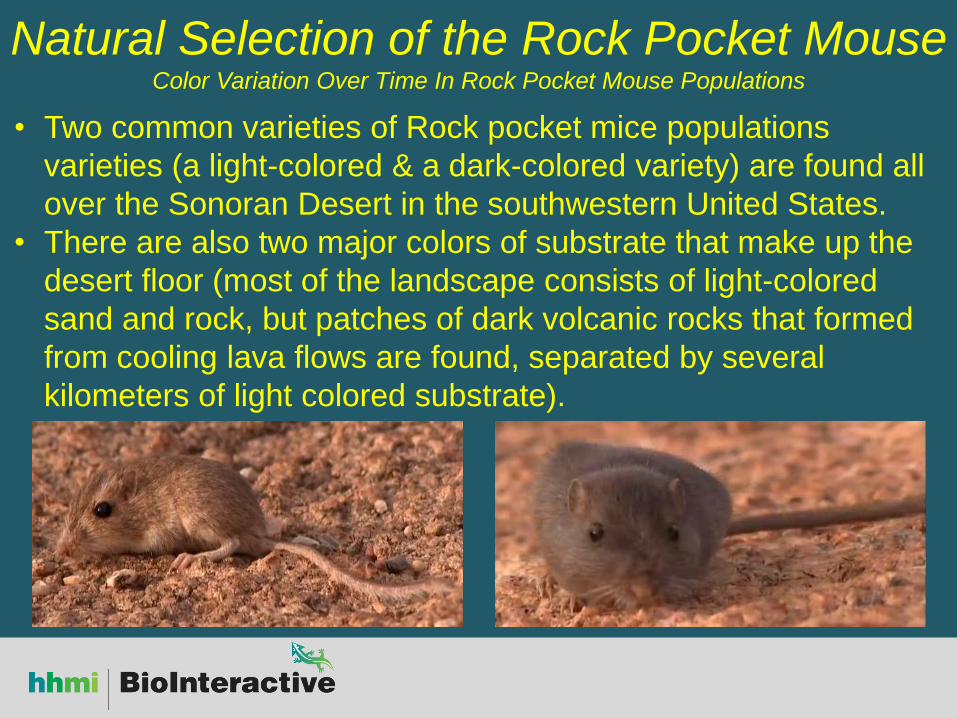
Natural Selection of the Rock Pocket Mouse Color Variation Over Time In Rock Pocket Mouse Populations
• Two common varieties of Rock pocket mice populations
varieties (a light-colored & a dark-colored variety) are found all
over the Sonoran Desert in the southwestern United States.
• There are also two major colors of substrate that make up the
desert floor (most of the landscape consists of light-colored
sand and rock, but patches of dark volcanic rocks that formed
from cooling lava flows are found, separated by several
kilometers of light colored substrate).

Natural Selection of the Rock Pocket Mouse Color Variation Over Time In Rock Pocket Mouse Populations
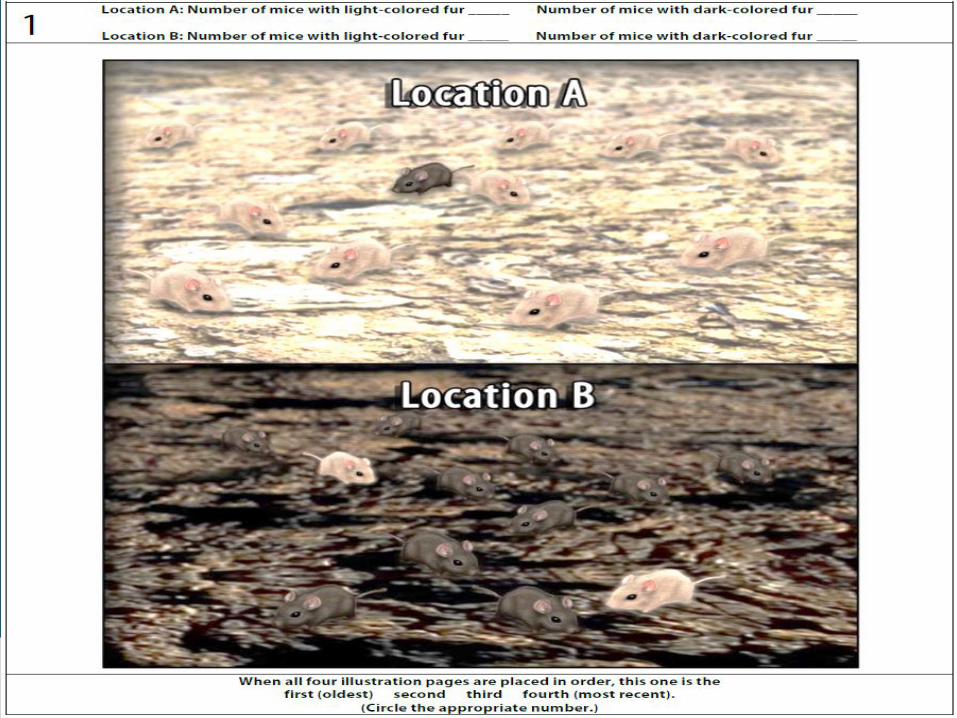
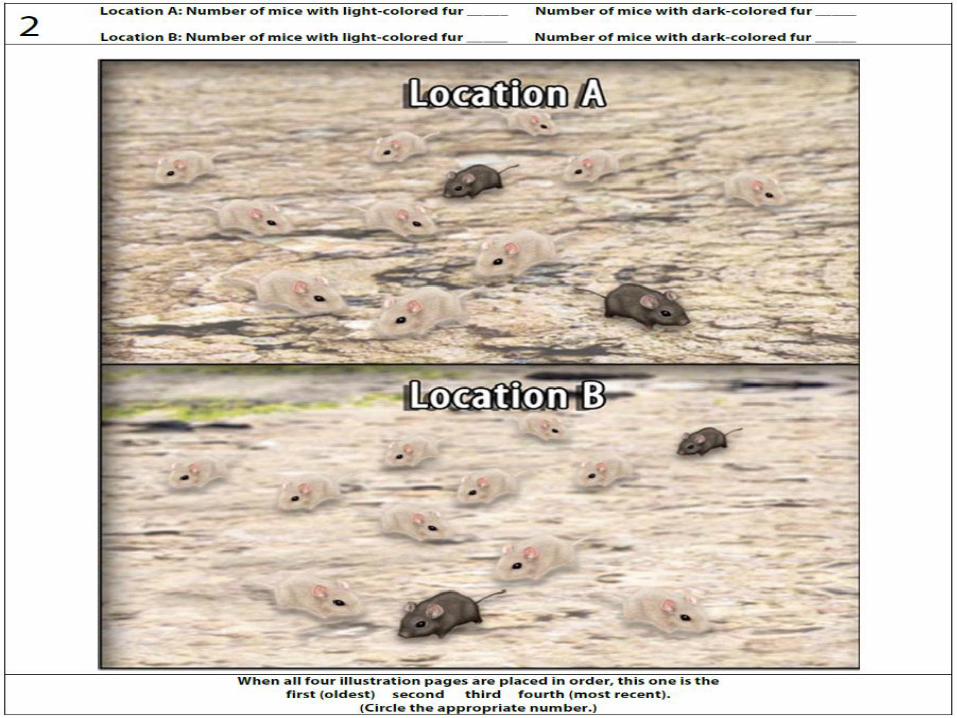
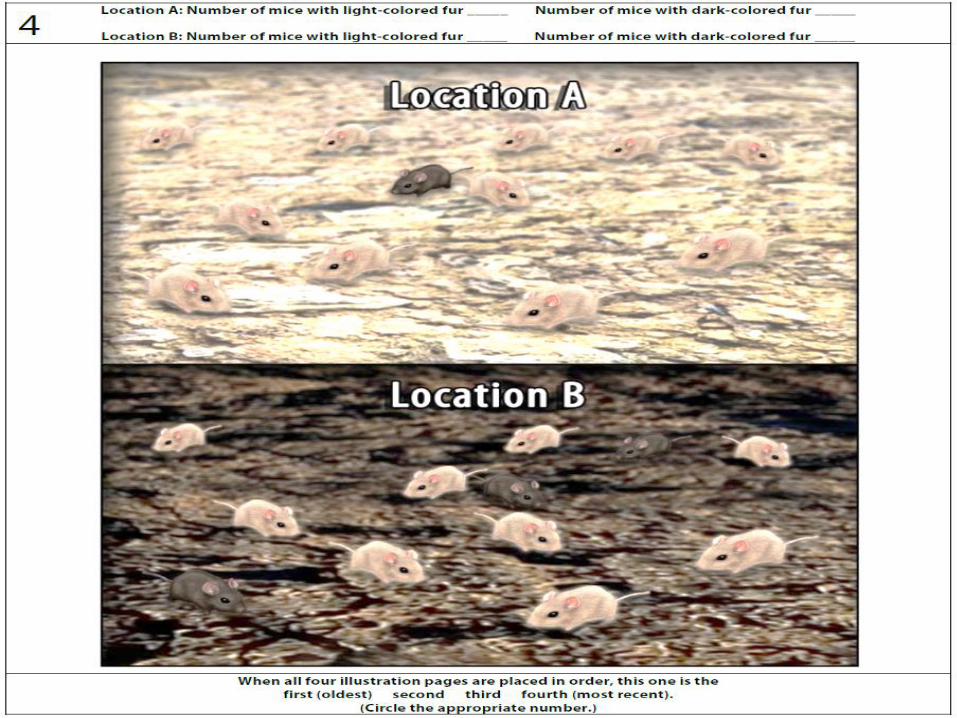
The illustrations represent snapshots of rock pocket
mouse populations. Each full-page illustration
shows the color variation at two different locations,
A and B, at a particular moment in time. (Note: The
images are out of order.)
1. Count the number of light-colored and dark-
colored mice present at each location at each
moment in time. Record your counts in the
spaces provided at the top of each
illustration.
2. Place the illustrations in what you think is the
correct order from oldest to most recent.
Indicate your order by circling the appropriate
number under the illustration.
3. Explain how you decided which illustration
represents the most recent rock pocket mouse
population and why you positioned the others in
the sequence as you did.


• Using what you learned by watching the film, check the order in which you arranged the illustrations. Change the order as necessary. Once you are satisfied that you are correct, fill out the data table below using the counts you recorded above the illustrations.
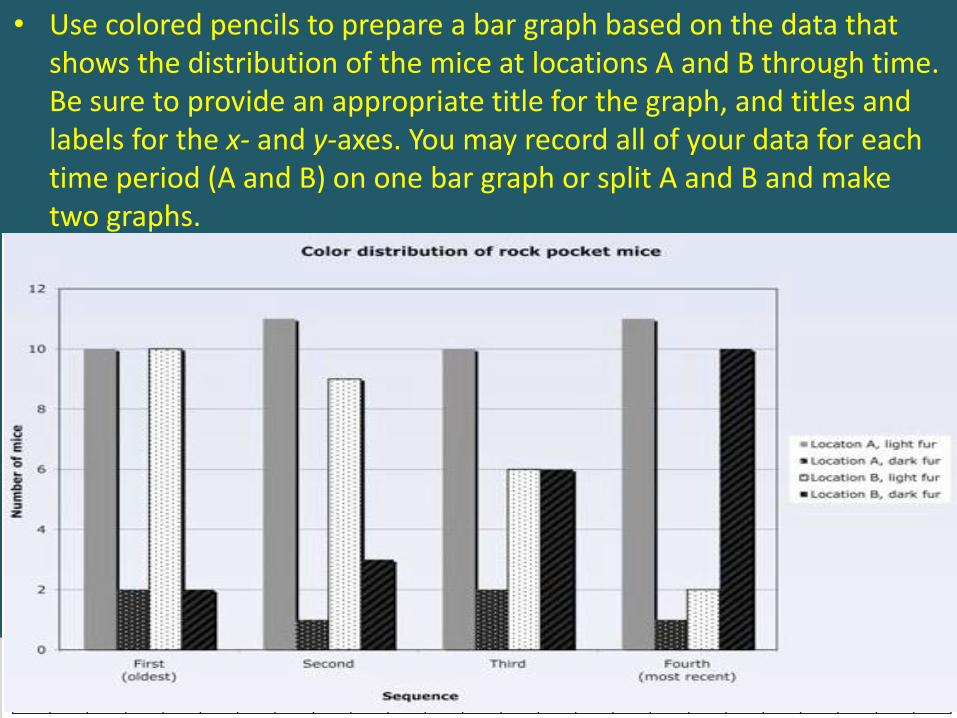
• Use colored pencils to prepare a bar graph based on the data that shows the distribution of the mice at locations A and B through time. Be sure to provide an appropriate title for the graph, and titles and labels for the x- and y-axes. You may record all of your data for each time period (A and B) on one bar graph or split A and B and make two graphs.

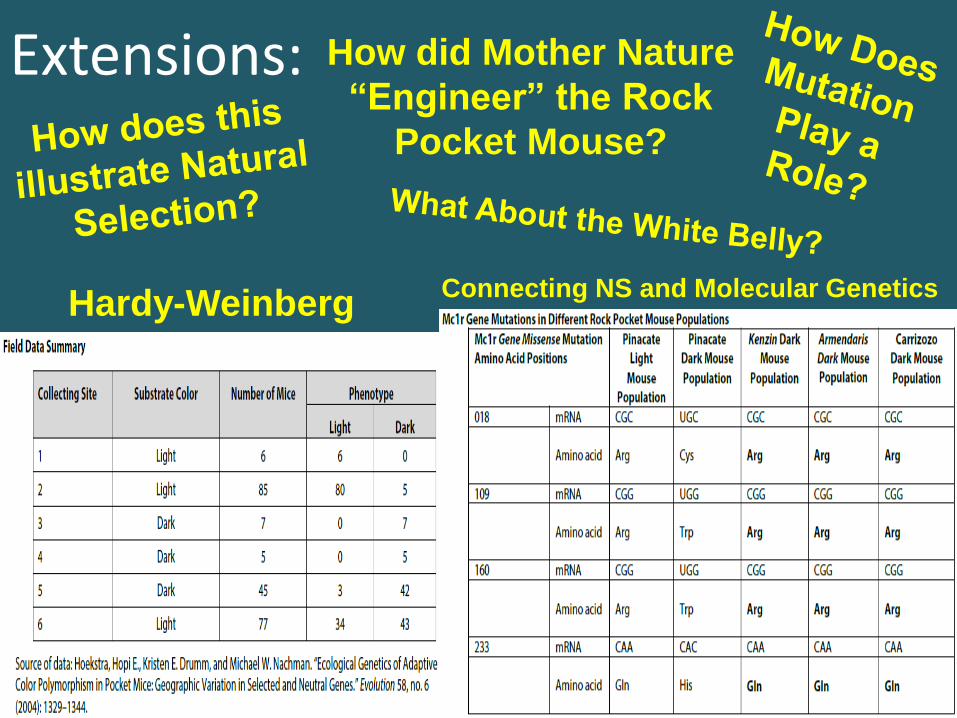
Extensions:
Connecting NS and Molecular Genetics Hardy-Weinberg
How did Mother Nature
“Engineer” the Rock
Pocket Mouse?
Beaks as Tools: Selective Advantage In Changing Environments
Next Generation Science Standards HS-LS2-1, HS-LS2-2, HS-LS4-2, HS-LS4-4, HS-LS4-5 HS-LS2.A, HS-LS2.C, HS-LS4.B, HS-LS4.C
AP Biology Big Idea 1 – 1.A.1, 1.A.2, 1.A.4
IB Biology (2009 Standards) 5.4, D.2 (2016 Standards) 5.1, 5.2, 5.4. 10.3
Common Core CCSS.ELA-LITERACY.RST.9-10.3, CCSS.ELA-LITERACY.RST.9-10.4, CCSS.ELA-LITERACY.RST.9-10.5, CCSS.ELA-LITERACY.RST.11-12.3, CCSS.ELA-LITERACY.RST.11-12.4, CCSS.MATH.CONTENT.HSS-ID.A.2
Florida Science Standards Big Idea 15: Diversity and Evolution of Living Organisms Big Idea 16: Heredity and Reproduction SC.7.L.15.2; SC.7.L.15.3 SC.912.L.15.13; SC.912.L.15.14; SC.912.L.15.15

Beaks as Tools: Selective Advantage In Changing Environments
• When food was plentiful and included different seed sizes,
all ground finches were able to find food.
• However, when drought struck the small island of Daphne
Major in 1977, the vegetation and the available seeds
changed considerably, so that the finches now had to
compete for food.
• When the smaller seeds disappeared, the finches had to
turn to the much larger, spiny seeds that were hard to crack
open.
• The smaller medium ground finches with slightly smaller
beaks ran out of food.
• But finches that had slightly larger beaks could still forage
on the much bigger, spiny seeds, which gave them a
survival advantage.
• Five years later, unusually long-lasting rainfalls allowed
vines to overrun the island and again changed the
vegetation drastically.
• The dominant slow-growing plants that produced large,
tough seeds were replaced by fast-growing plants with
smaller, softer seeds such as grasses and vines.
• When drought struck again two years later and birds had to
compete for food, larger seeds were scarce.
• The birds with larger beaks now had difficulty picking up the
more abundant small seeds produced by the vines and
grasses.
• Therefore, selection swung in the opposite direction; more
finches with smaller beaks survived, and their offspring
inherited smaller beaks.

http://www.dreamstime.com/illustration/rice.html
http://www.123rf.com/photo_27909666_little-sack-of-kidney-beans-phasiolus-vulgaris-l--on-white-background.html
http://www.nadirimpex.com/en/18-forceps
http://www.clipartsheep.com/free-needle-nose-pliers-clipart/dT1hSFIwY0RvdkwzZDNkeTVqYkdsd1lYSjBiRzl5WkM1amIyMHZkM0F0WTI5dWRHVnVkQzkxY0d4dllXUnpMekl3TVRNdk1Ea3ZjR3hwWlhKekxuQnVad3x3PTIzNHxoPTU4Nnx0PXBuZ3w/
http://www.fotosearch.com/CSP481/k19013632
/
http://www.storables.com/iris-small-plastic-clear-shoe-box.html
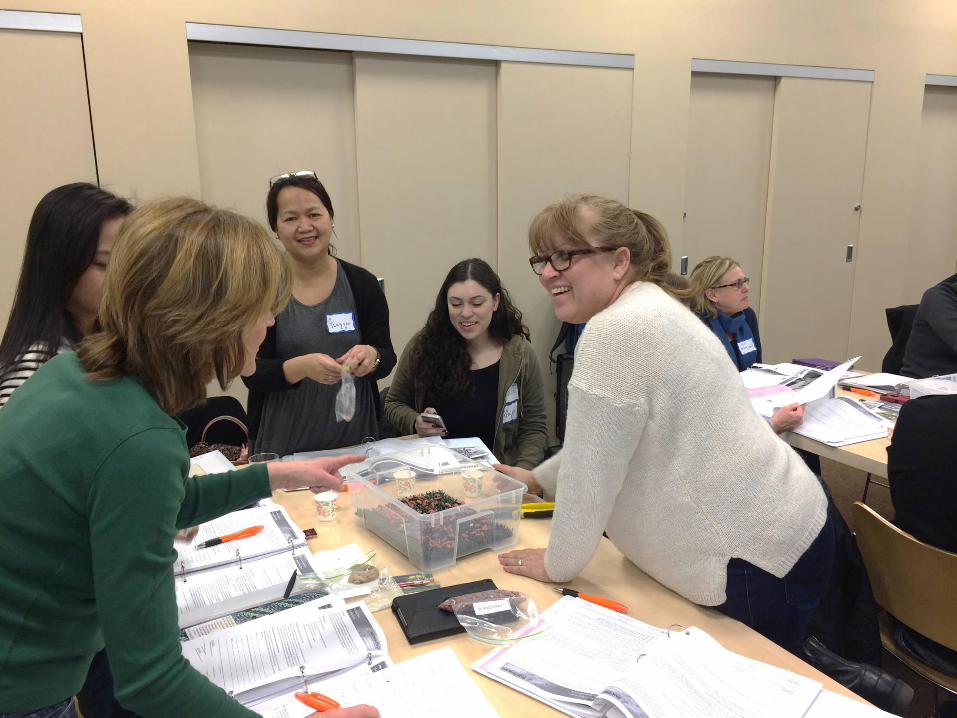
Materials: Variations of the following
Rice Beans Turf Cups
Container
Forceps
Pliers

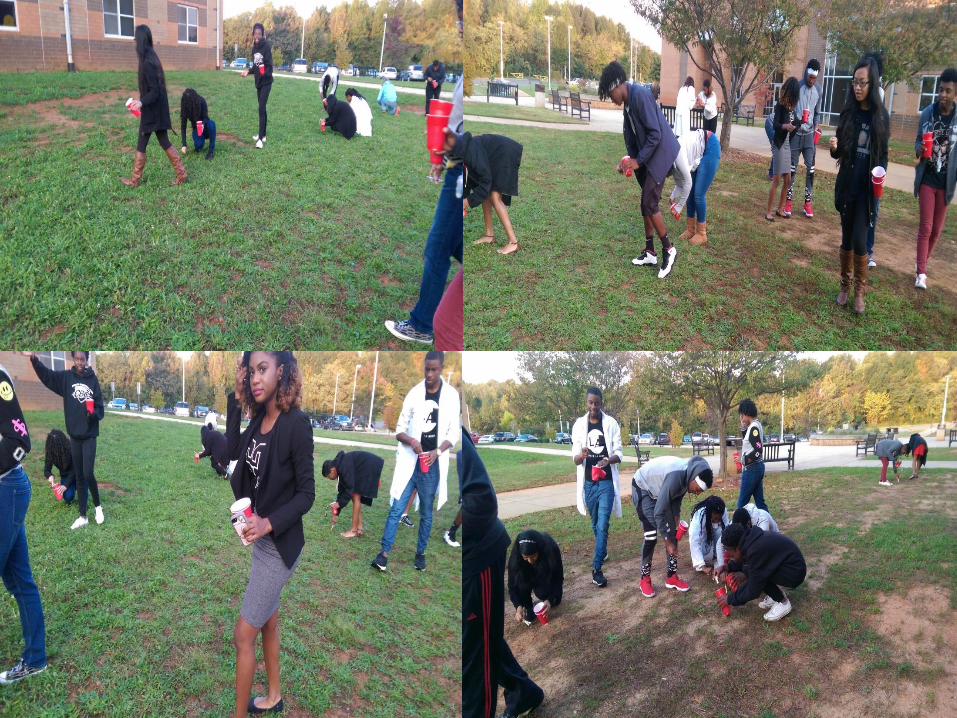

Enter the total seed counts for each beak under all three food conditions (green, brown,
and orange fields). Descriptive statistics, such as class average and standard deviation,
are automatically calculated in the light gray fields at the bottom of the table. To the right
are graphs that will show class results once all data points are entered in the table.

Extensions:
Great Transitions: The Origin of Birds Data Analysis
How did Mother Nature
“Engineer” the
Galapagos Finch?

Tim Guilfoyle [email protected]
tguilfoyle.cmswiki.wikispaces.net/
Phillip O. Berry Academy Charlotte, NC 28075 HHMI Ambassador
“Life moves pretty fast. If you don't stop and look around
once in a while, you could miss it.” – Ferris Bueller https://www.google.com/search?noj=1&biw=1280&bih=675&tbm=isch&sa=1&q=thank+you+animated+gif&oq=thank+you+animate&gs_l=img.1.0.0l10.792396.795337.0.797226.17.14.0.3.
3.0.428.1481.3j4j1j0j1.9.0....0...1c.1.64.img..5.12.1488.L9ToXCUKAkQ#imgrc=7gim4UXsdit6LM%3A

F2 Stickleback Without Pelvic Spines


